Two of my colleagues at the City of Thornton granted me the permission to use the photos below.
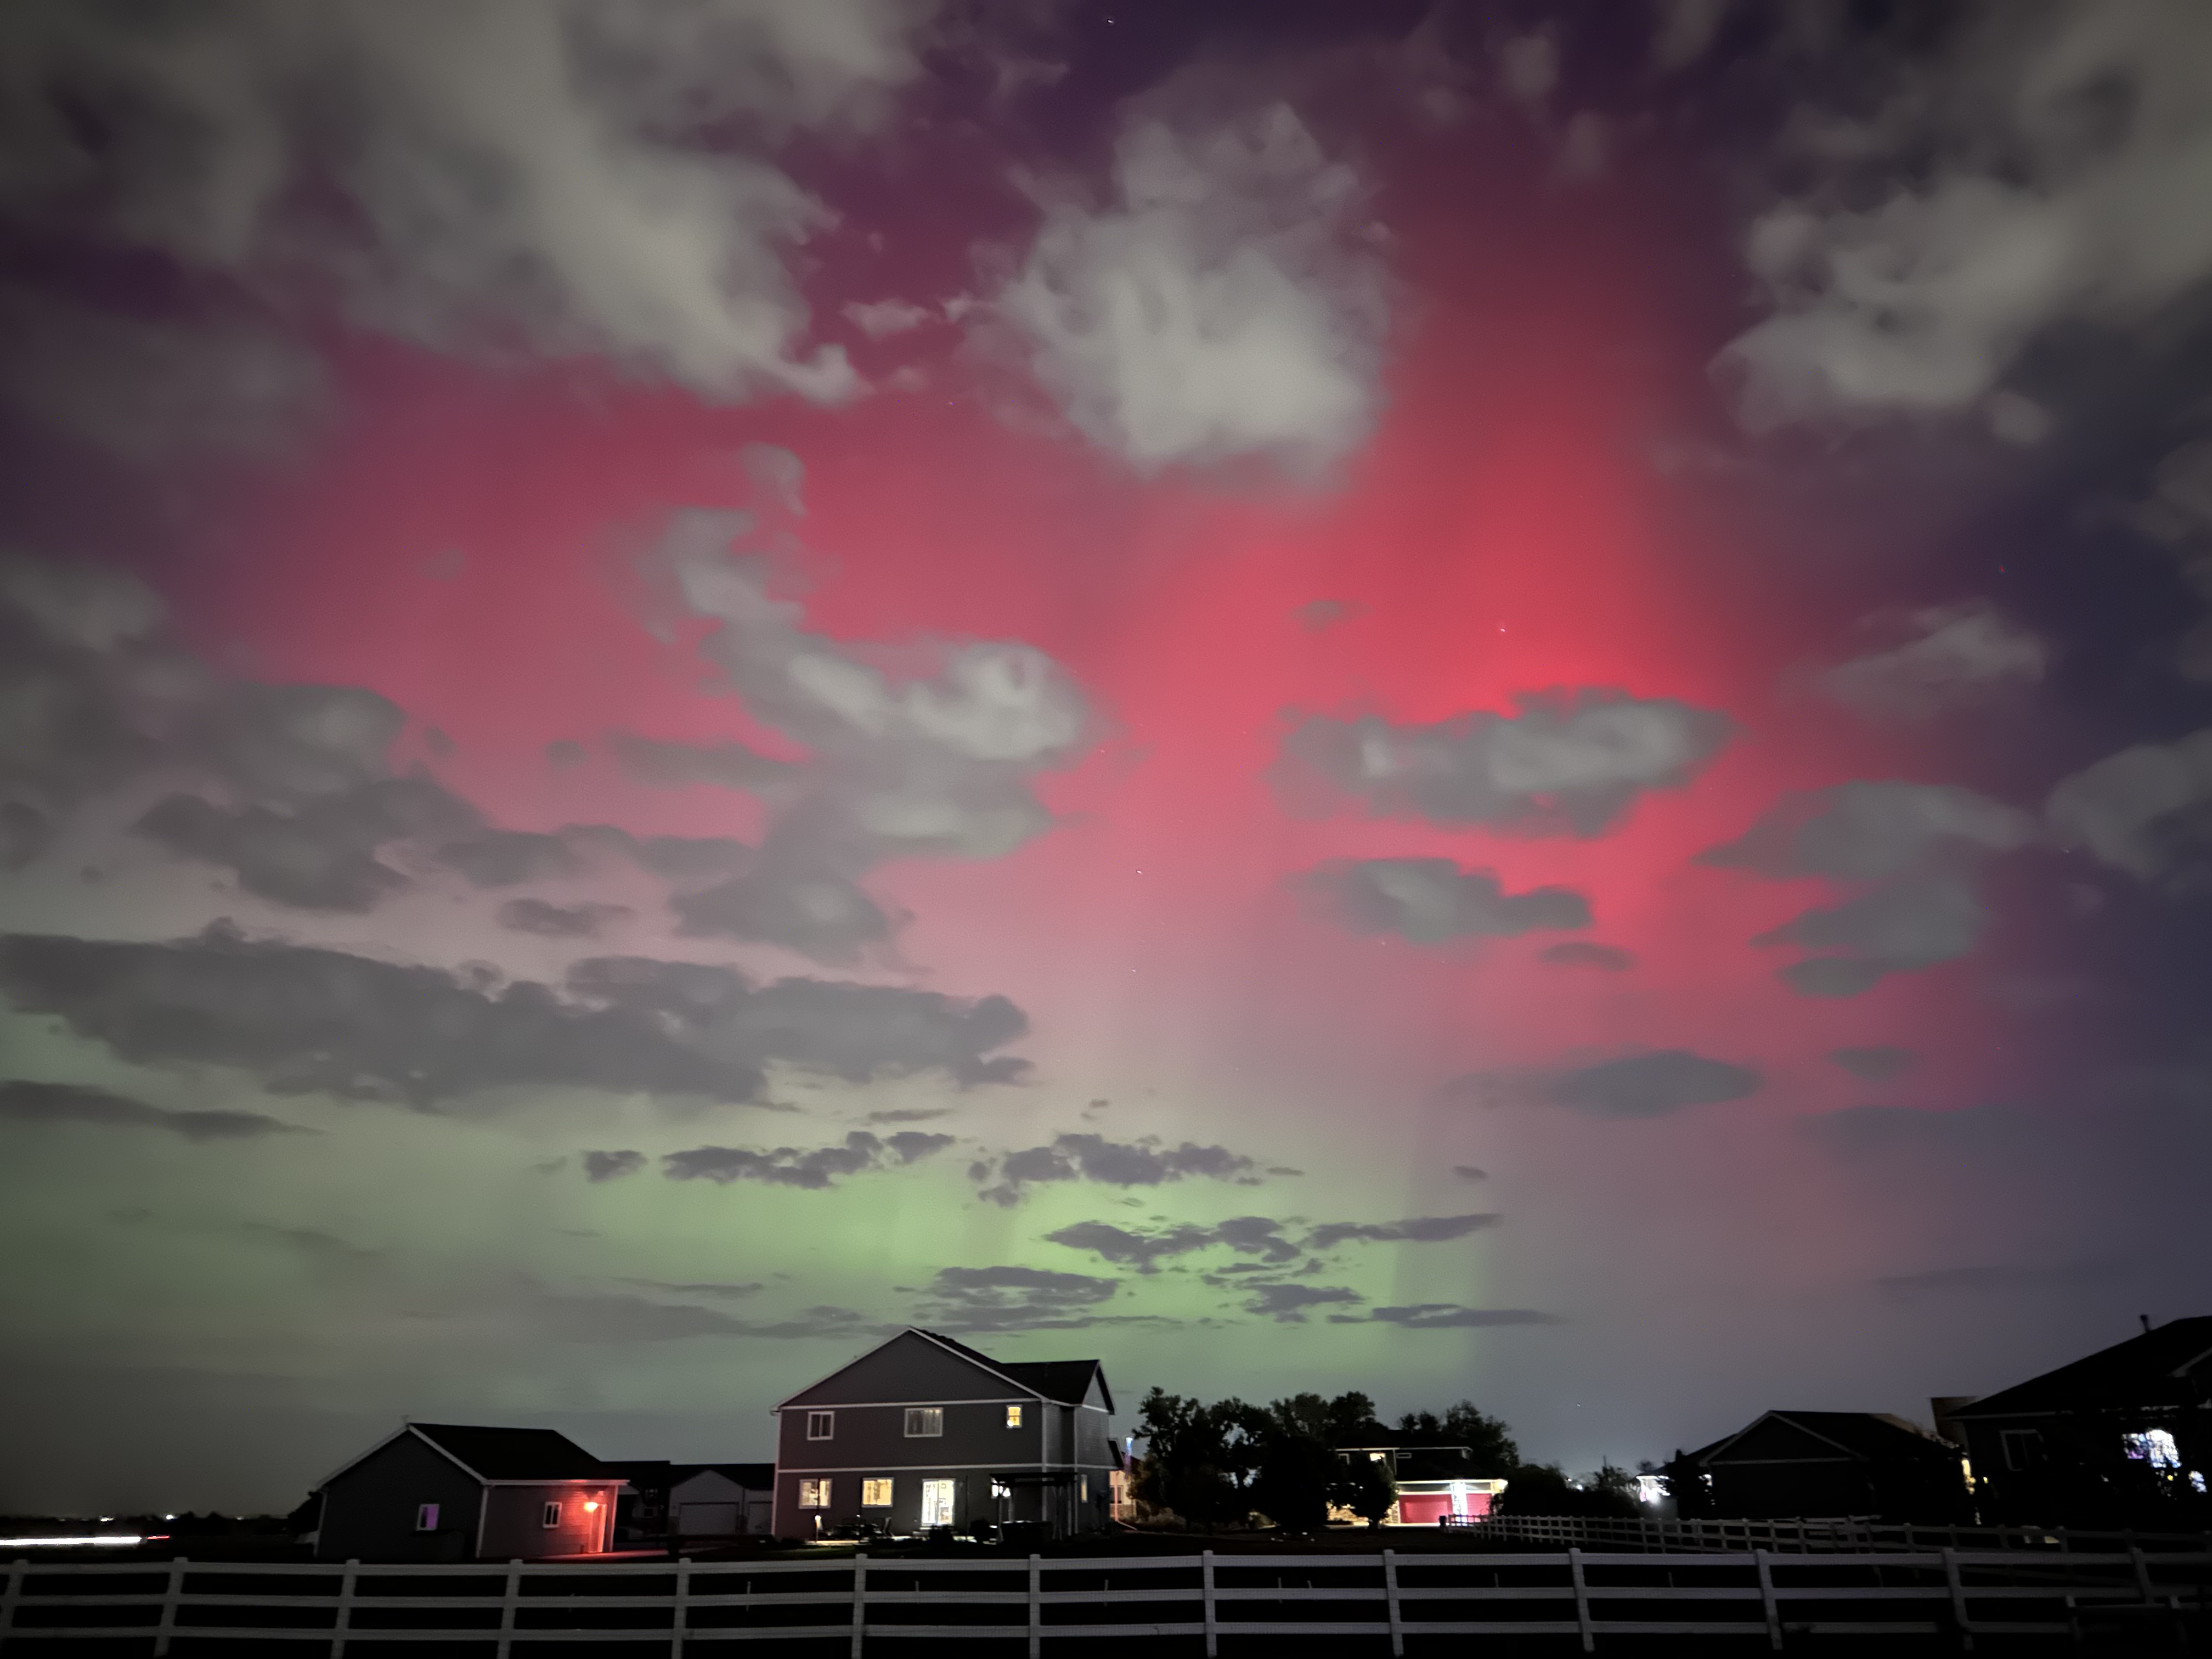
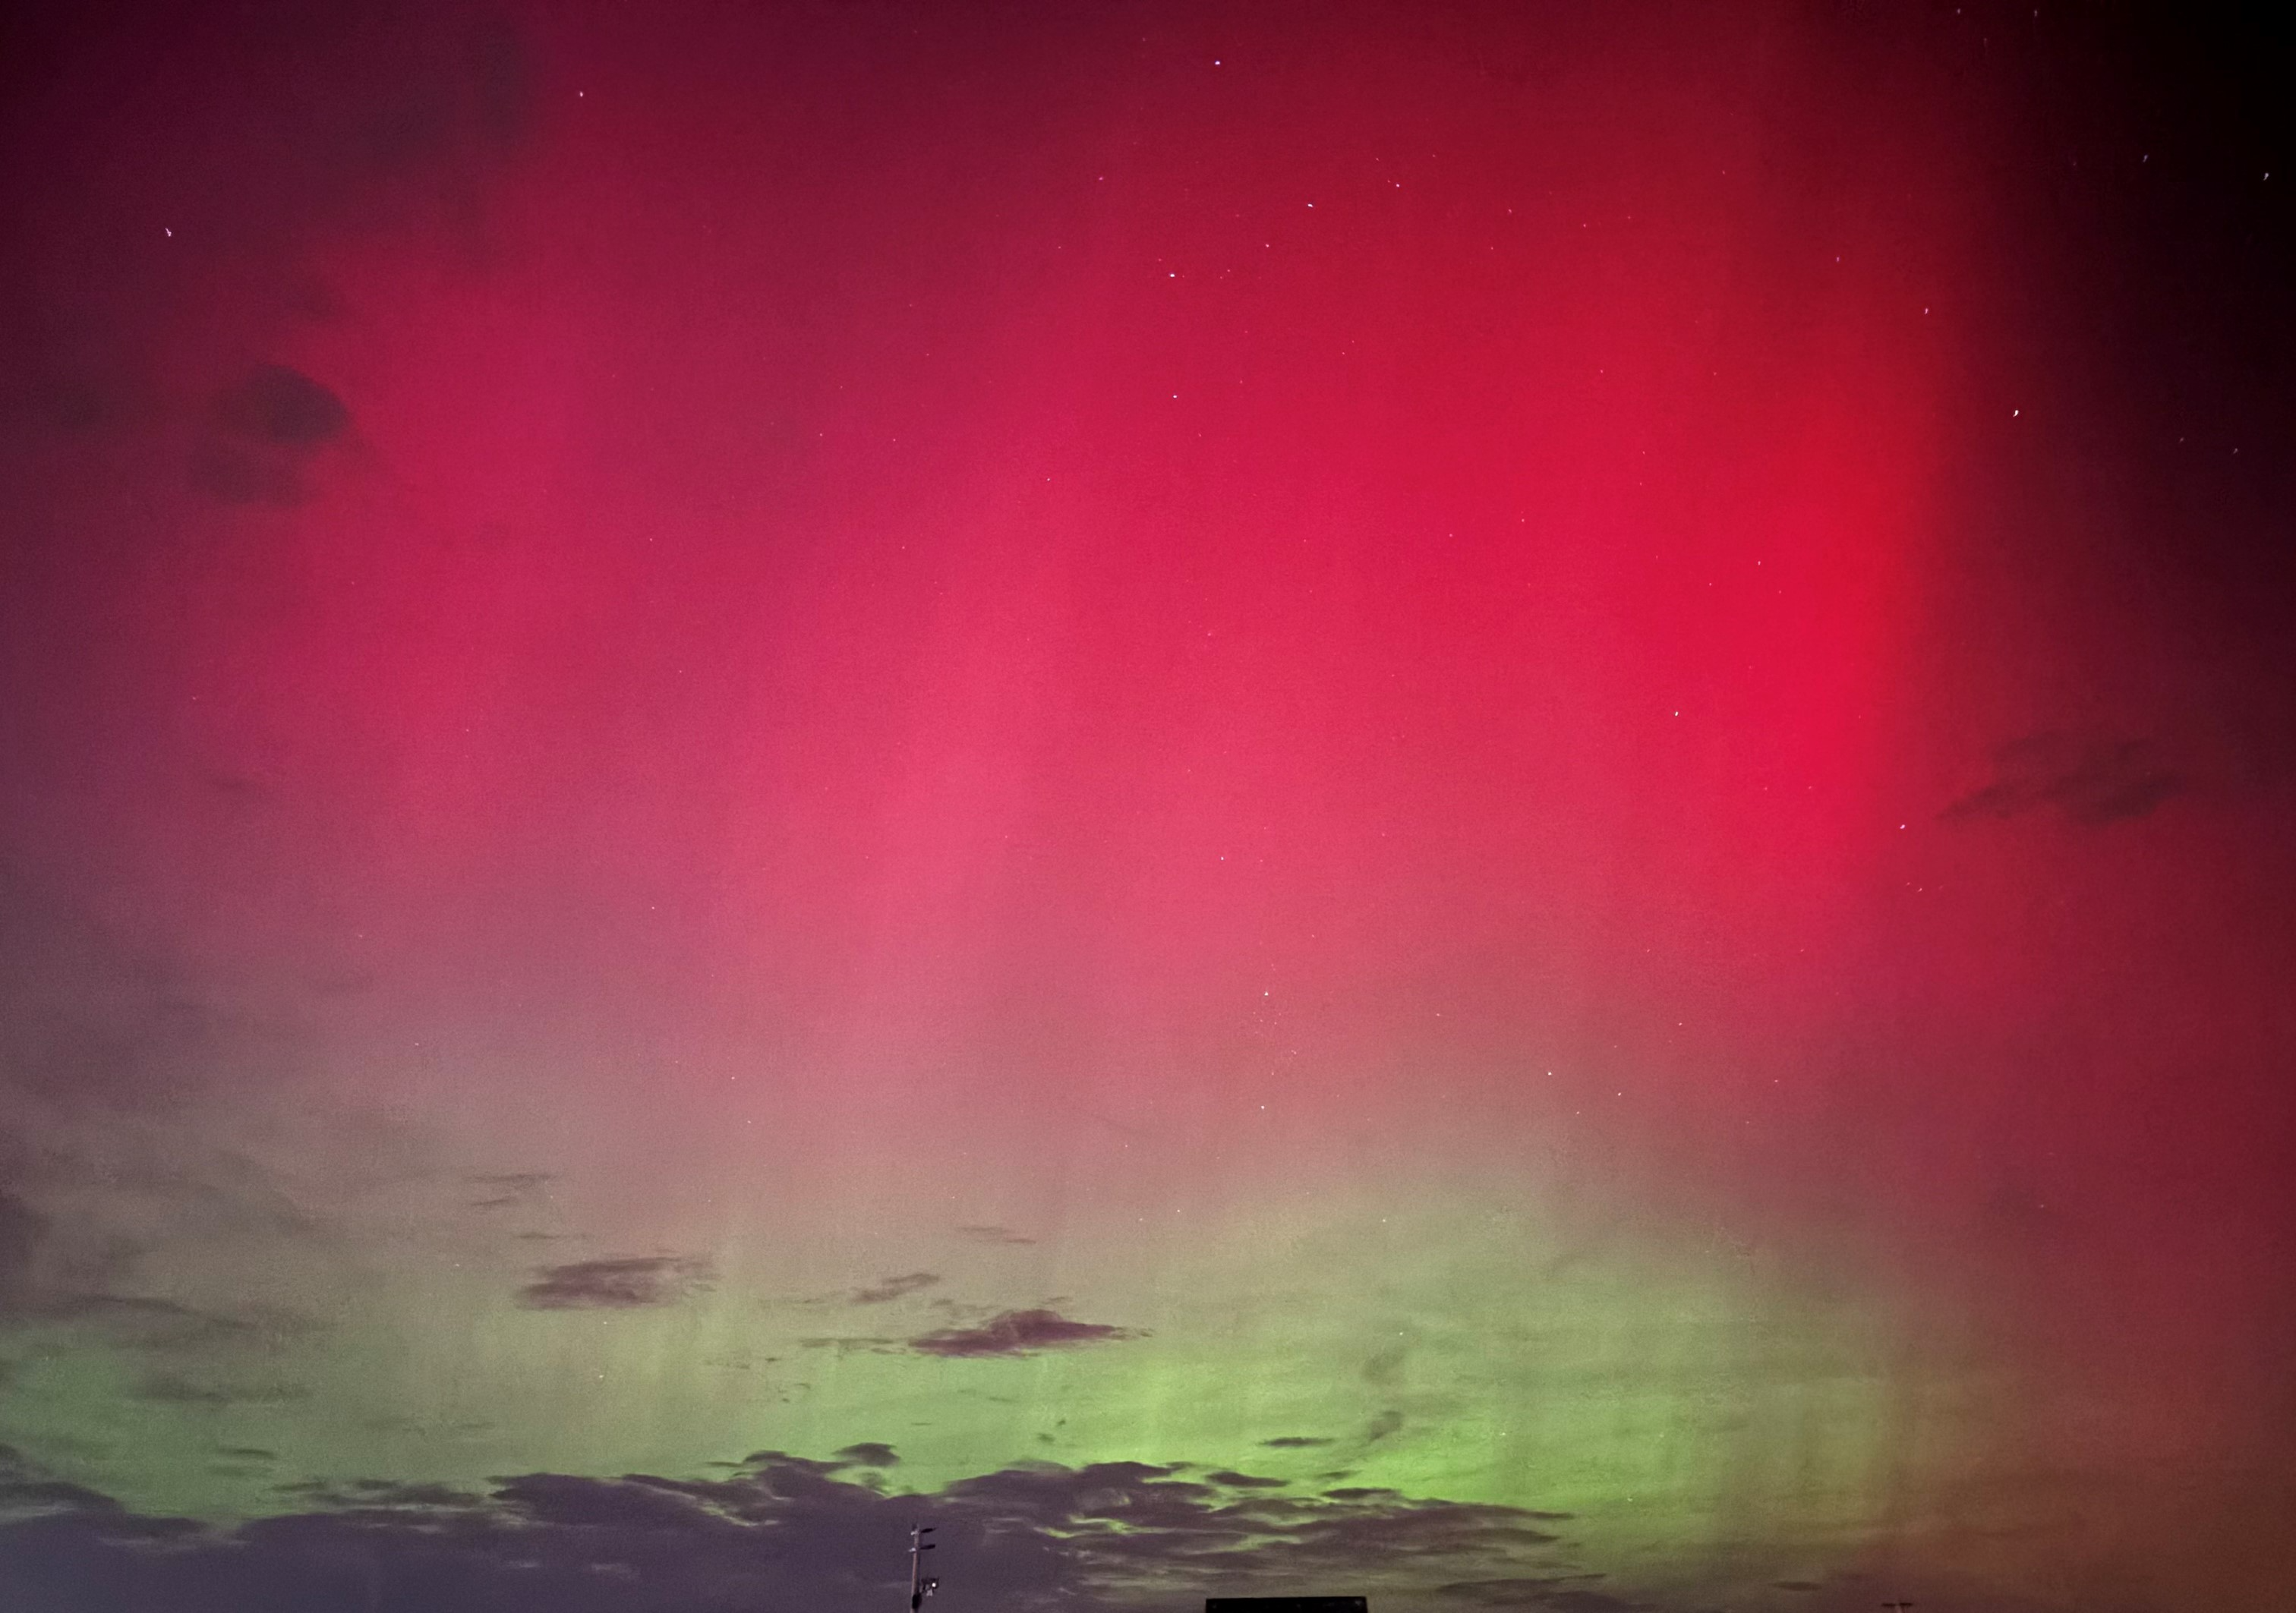
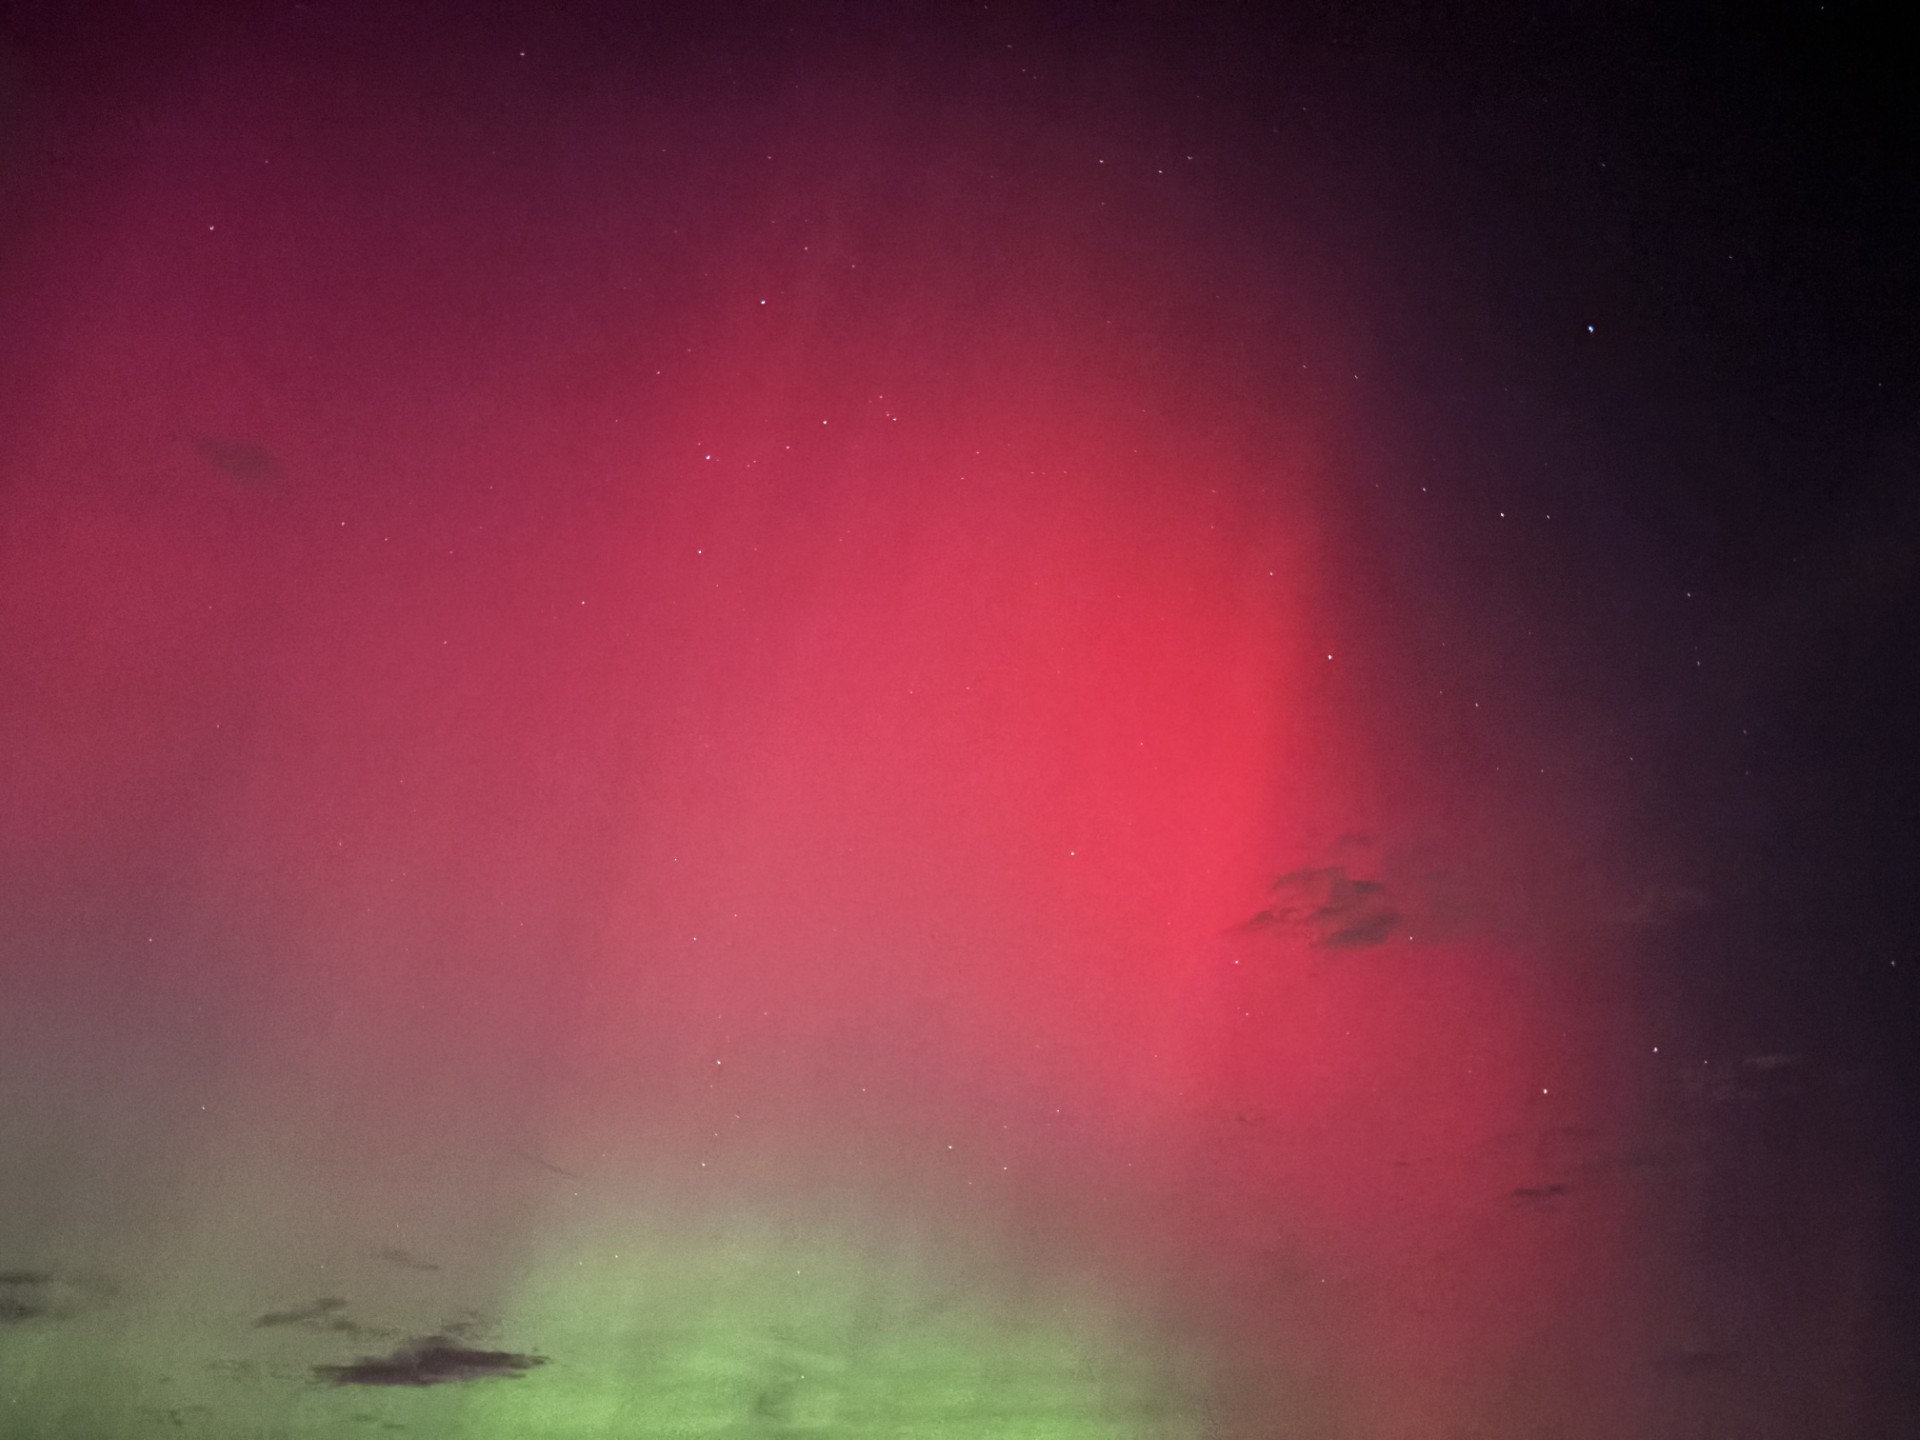

Two of my colleagues at the City of Thornton granted me the permission to use the photos below.
Click the link to read the article on the NIDIS website:
October 10, 2024
Key Points
- Water Year 2024 overall was warmer than normal across the Intermountain West, with variable precipitation across the region, contributing to drought development in Wyoming and limiting drought amelioration in southern New Mexico.
- Drier-than normal-conditions were noted in northwestern Arizona, southern New Mexico, western and southwestern Utah, north-central and southeastern Colorado, and eastern and southern Wyoming.
- Wetter-than-normal conditions were logged in northern portions of New Mexico, much of the southern Rockies of Colorado, areas of central and west-central Utah, and parts of northwestern Wyoming.
- Overall, the 2024 North American Monsoon season precipitation underperformed in Arizona and southern/western New Mexico and overperformed in eastern and northern Utah, northern New Mexico, and all but the Front Range and eastern Rockies of Colorado.
- As of October 7, 2024, El Niño-Southern Oscillation (ENSO) neutral conditions are expected to transition to La Niña by November (71% chance), which typically increases likelihood of drier winter conditions across the Southwest, and is expected to persist through January–March 2025.

Jump to:
- Water Year 2024 Summary
- Water Year 2024 Drought Impacts
- What Is the North American Monsoon?
- How Did the 2024 Monsoon Impact Drought in the Intermountain West?
- Did ENSO-Neutral Conditions Impact the Monsoon?
- Looking Ahead
Intermountain West Water Year 2024 Summary
- Water Year 2024 (October 1, 2023–September 30, 2024) included a mixed bag of record-breaking temperatures, precipitation anomalies, and both drought development and improvement in the Intermountain West.
- Drought developed in Wyoming and improved in parts of New Mexico, Arizona, and Colorado. Long-term drought impacts remain in many areas of the region, including persistent drought in southern New Mexico, despite normal to above-normal precipitation in many areas.
- Roughly the same percentage of the Intermountain West was in drought at the start of Water Year 2024 (38.27%), as the start of Water Year 2025, October 1, 2024 (36.55%). However, drought conditions shifted across the region. At the onset of Water Year 2024, 94.86% of New Mexico was in Moderate to Exceptional Drought (D1–D4) and 0.0% of Wyoming was in drought. Drought has increased in Wyoming to 71.33% and improved in northern/central New Mexico (now covering only 34.73% of the state), eastern Arizona, and southwestern Colorado.
- Most of the Intermountain West experienced average- to above-average snowpack over the course of Water Year 2024. However, snow drought persisted throughout winter in much of northern Wyoming, with record-low snow water equivalent at several long-term SNOTEL stations.
- The 2024 North American Monsoon cumulatively delivered an underperforming season of precipitation for Arizona and southern/western New Mexico, while overperforming in eastern Utah, northern New Mexico, and all but the front range and eastern Rockies of Colorado, improving drought conditions in many areas.
- Colorado received 95% of normal precipitation for Water Year 2024, but areas were both much wetter than normal and much drier than normal. In Colorado, Monte Vista in the San Luis Valley recorded its wettest water year on record (since 1944) with 14.56 inches of precipitation.
- New Mexico statewide precipitation was 87% of average. Southern New Mexico was below average, and Las Cruces reported its driest water year on record with just 3.32 inches recorded.
- Utah experienced record rainfall totals in the southeast (parts of Emery, Wayne, and Garfield counties), which coincided with an eastern shift of the monsoon pattern.
- Above-normal temperatures impacted the entire Intermountain West region, which contributed to new drought development in Wyoming, Arizona, and eastern Colorado and long-term drought persistence in southern New Mexico.
- Arizona experienced its hottest summer (June–August) on record (130 years).
- Colorado experienced its 7th warmest water year on record, and its 5th warmest June–September. Grand Junction recorded its warmest summer on record, and eastern Colorado, including Kiowa, Bent, and Prowers Counties, continues to suffer from Severe Drought (D2).
- New Mexico had its 5th warmest water year and 3rd warmest summer (June–August) on record.
Figure 1: Intermountain West Water Year 2024 Drought Change Map: October 3, 2023–October 1, 2024
Key takeaway: In Water Year 2024, Wyoming experienced significant drought development, with a 3-4 category drought degradation (going from 0% of the state in drought to 71.33%). Much of New Mexico experienced notable drought recovery.
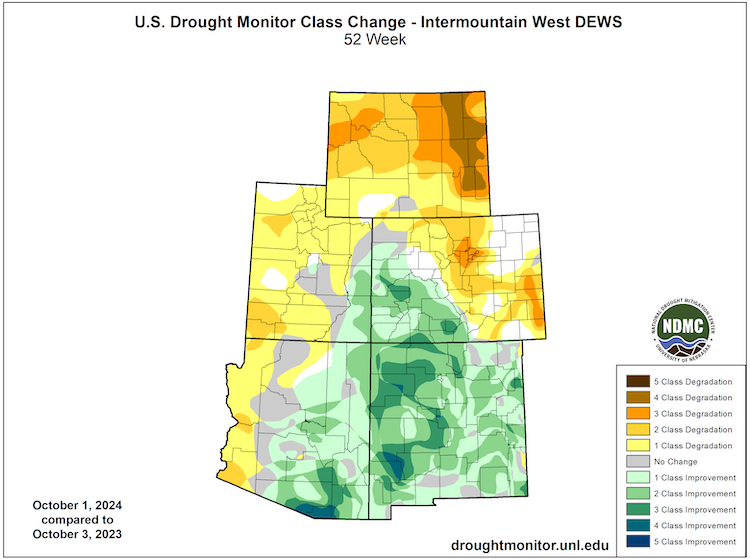
Figure 2: Percent of Average Precipitation: Water Year 2024
Key takeaway: Water Year 2024 was drier than normal across northwestern Arizona, southern New Mexico, western and southwestern Utah, north-central and southeastern Colorado, and eastern and southern Wyoming. Northern portions of New Mexico, much of the southern Rockies of Colorado, areas of central and west-central Utah, and parts of northwestern Wyoming saw wetter-than-normal conditions.

Figure 3: Water Year 2024 Mean Temperature Departure (°F) from Normal for the Western U.S.
Key takeaway: The entire Western U.S. experienced above- and much-above-normal mean temperatures this water year, with record warm temperatures in several locations across the region. In much of the Intermountain West, mean temperatures for the water year were between 1–4º F above normal.
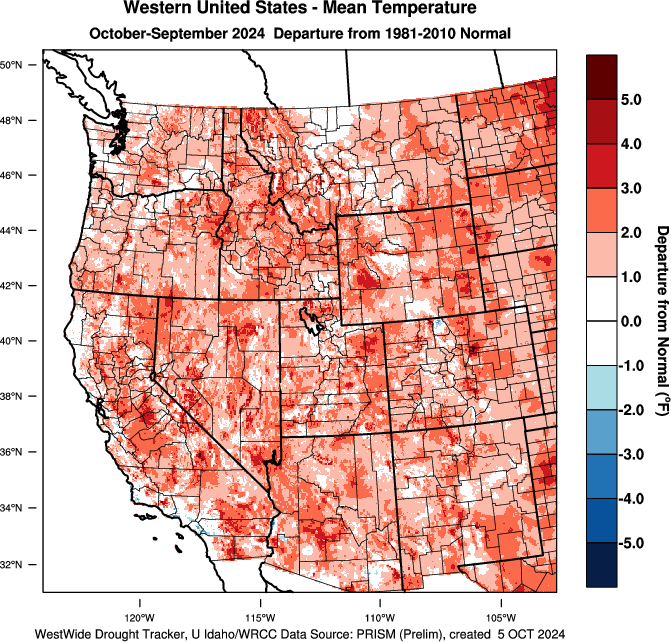
Figure 4: Summer 2024 Mean Temperature Rankings for the Western U.S.
Key takeaway: Summer 2024 saw record warm temperatures in many areas of Arizona, New Mexico, eastern Colorado, southwestern Utah, and southeastern Wyoming, compared to 1895–2010.
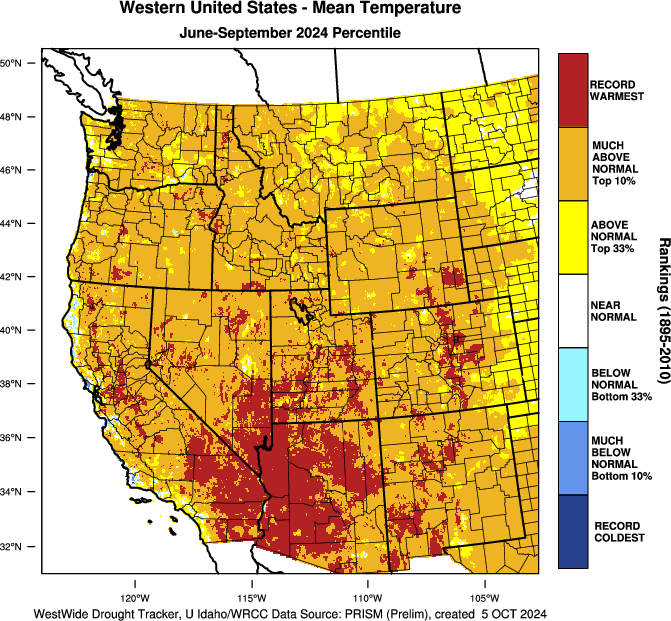
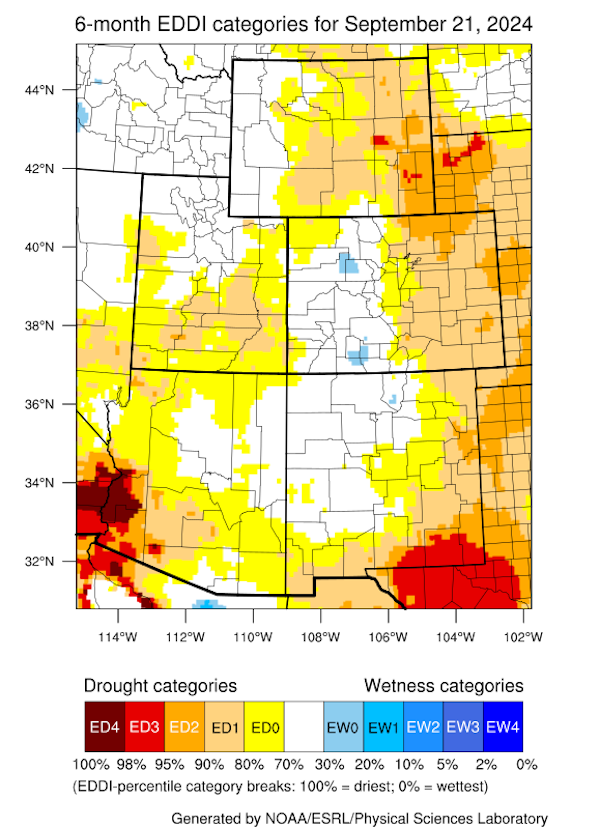
Figure 5: 6-Month Evaporative Demand Drought Index (EDDI): September 1, 2024
Key takeaway: Impacts of high spring and summer temperatures are evident in the Evaporative Demand Drought Index (EDDI), notably in southeastern Wyoming, southwestern Arizona, and southeastern New Mexico. Despite normal or above-normal precipitation, high evaporative demand (the “thirst” of the atmosphere) kept drought recovery to a minimum.
2024 Water Year Drought Impacts
- Wyoming degraded, from no drought a year ago to 71% of the state as of October 1, 2024. The worst agricultural impacts are in the northeastern corner of the state, where poor rangeland conditions, reduced crop yields, reduced irrigation water, water hauling for livestock, supplemental feeding, decreased stock weights, and dry creeks/stock ponds were reported.
- Central Utah and east-central and southern Colorado also reported agricultural and rangeland impacts with lack of forage production and dry soils impacting planting winter wheat requiring drilling into the ground in some fields.
- High temperatures affected water supply, irrigation, and hydropower generation. Warm temperatures reduced snowpack accumulation, produced an earlier snowmelt-driven run-off, and negatively impacted associated water management decisions for communities and land managers (e.g., agriculture, ranches, public lands) over the summer months.
- Lake Powell and Lake Mead maintain well-below-normal storage levels compared to long-term averages.
Drought impacted wildfire activity in Utah, Wyoming, and Arizona. Grassland growth in low elevations in Arizona was high due to wet conditions in winter 2024, which led to a 60% increase in acreage impacted by wildland fire, exacerbated by low summer precipitation in the lower desert areas.
Reservoir Levels Across the Intermountain West
- Over Water Year 2024, reservoir storage increased in Lake Powell, though it is still below average. Other reservoirs hit historic lows.
- As of June 2024, in the Upper Colorado River Basin, the U.S. Bureau of Reclamation reported reservoir levels for Flaming Gorge at 87% full, Blue Mesa at 63% full, and Navajo at 72% full. Lake Powell was 37% full. Unregulated inflow into Lake Powell for the April–July runoff period was approximately 5.32 million acre-feet (MAF), or 83% of average. As of October 4, 2024, Lake Powell was at 60.4% of average levels for this time of year.
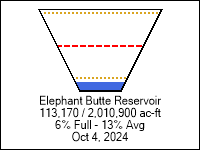
- After the irrigation season ended on the lower Rio Grande in New Mexico, Caballo Dam was shut off (September 28), and water releases from the Elephant Butte dam ended on September 26, 2024. Elephant Butte is currently 6% full (13.2% of average storage for this time of year).
Figure 6: October 2024 Reservoir Storage Levels
Key Takeaway: Lake Powell storage improved over the course of Water Year 2024, while Lake Mead (Colorado River) and Elephant Butte (Rio Grande) are both at historical lows.
Reservoir State October 2024 Level in Acre-Feet End of Water Year Percent of Average Lake Powell/Glen Canyon Dam Arizona 9,125,902 60.5% Lake Havasu – Parker dam Arizona 562,271 98.1% Lake Mohave/Davis Dam Nevada/Arizona 1,567,737 95.8% Lake Mead – Hoover Dam Nevada 8,717,731 54.5% Flaming Gorge Reservoir Wyoming 3,150,682 100.2% Blue Mesa Reservoir Colorado 556,298 96.9% McPhee Reservoir Colorado 216,336 77.2% Navajo Reservoir New Mexico 1,085,804 82% Elephant Butte Dam New Mexico 113,170 13.2% Source: U.S. Bureau of Reclamation Reservoir Storage Dashboard. Data valid October 4, 2024.
What Is the North American Monsoon? Why Does It Matter?
The North American Monsoon is a seasonal circulation of subtropical moisture that develops over northern Mexico and extends into the Southwest U.S. from June 15–-September 30. Monsoonal surges can occur north and west of these “core” areas, reaching Nevada, southeastern California, and Wyoming, including the Greater Yellowstone Region. Monsoonal rainfall accounts for nearly 50% of the total annual precipitation across much of Arizona and New Mexico. Learn more about the North American Monsoon.
How Did the 2024 North American Monsoon Impact Drought in the Intermountain West?
- Pre-Monsoon Conditions:
- As of June 4, 2024, drought conditions were most severe in southern New Mexico, with areas experiencing drought in Arizona, Colorado, New Mexico, Utah, and Wyoming.
- Following a strong El Niño winter (with normal to above-normal snowpack for most of the region), a climate pattern that resembled the monsoon developed in June and July, caused by unusually high thunderstorm activity in the southwestern Atlantic Ocean, Caribbean, and Gulf of Mexico. This resulted in an increase in near-surface Gulf moisture and increased winds from the two jet streams, and facilitated better organization of thunderstorms (which were not a monsoon pattern).
- The August- September precipitation was a traditional North American Monsoon pattern (south to north steering flow similar to the 2016 monsoon), which brought average to above-average precipitation for some of the southwestern U.S., including the four corners region, areas of northern New Mexico, southeastern Arizona and southwestern Colorado.
- Prior to the 2024 Monsoon season, all five Intermountain West states were experiencing some level of drought. As of June 4, 2024 the U.S. Drought Monitor reported that 20.02% of Arizona, 72.41% of New Mexico, 12.89% of Colorado, 6.17% of Wyoming, and 0.40% of Utah were in drought.
- The highest monsoon seasonal precipitation totals were in northern New Mexico (between 90%-150% of normal) and the Four Corners region.
- State-by-State Summary:
- New Mexico: Monsoon precipitation was below normal in southern New Mexico (25% of normal monsoon precipitation) and the southwestern climate district (30th driest monsoon season). However, the northeastern climate district had its 29th wettest monsoon, which improved drought in some areas of New Mexico. Statewide precipitation in New Mexico ranked 65th driest between June-September.
- Arizona: Areas of western and central Arizona had an underperforming monsoon season. Phoenix experienced 30% of normal monsoon season precipitation, while Tucson was at 101% of normal precipitation.
- Colorado: Areas of southern and western Colorado received normal to above-normal precipitation. The eastern plains received below-normal precipitation.
- Utah: Statewide, Utah cumulatively experienced well-above normal rainfall. but July precipitation conditions were well-below average with several counties in east central Utah experiencing record dry rainfall totals, followed by record wet August precipitation. Though short-term drought conditions impacting agriculture and rural communities worsened, healthy soil moisture and reservoir levels demonstrate gradual hydrologic drought improvement.
- Wyoming: Wyoming was largely very dry through the 2024 Monsoon Season, outside of a wet August in the far southeast part of the state. Less than 50% of normal precipitation fell in parts of central and northeast Wyoming, leading to rapid expansion of drought. As of October 1, 2024, 71% of the state was in drought, with 12% of the state in Extreme Drought (D3).
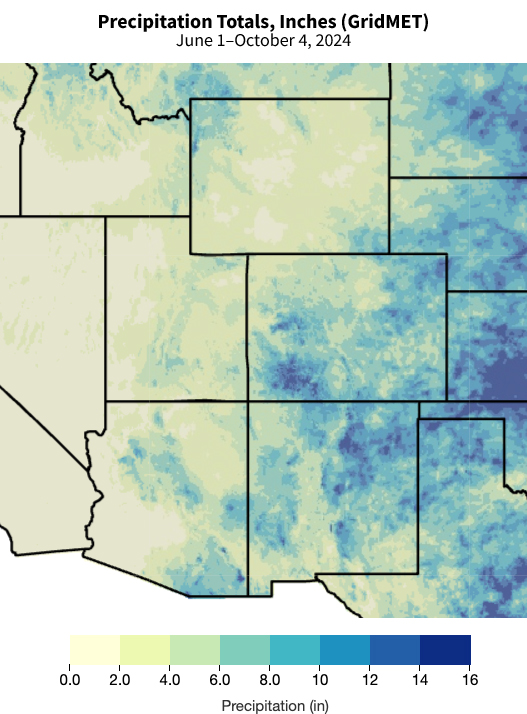
Figure 7: 2024 Monsoon Precipitation (June 1–October 4, 2024)
Key takeaway: Favorable monsoon seasonal precipitation fell in northern New Mexico, southeastern Arizona, and southwestern Colorado.
Did the El Niño–Southern Oscillation (ENSO) Neutral Conditions Impact the 2024 North American Monsoon?
The relationship between the monsoon and El Niño/La Niña events is hard to predict, though there is evidence of a correlation. Several physical mechanisms link wet winters in the monsoonal region during El Niño years with high spring soil moisture that delays the monsoonal onset. However, the extreme year-to-year variability inherent to monsoonal activity limits the statistical ability to anticipate ENSO conditions with summer precipitation outlooks, where seasonal conditions are often driven primarily by event-level weather patterns.
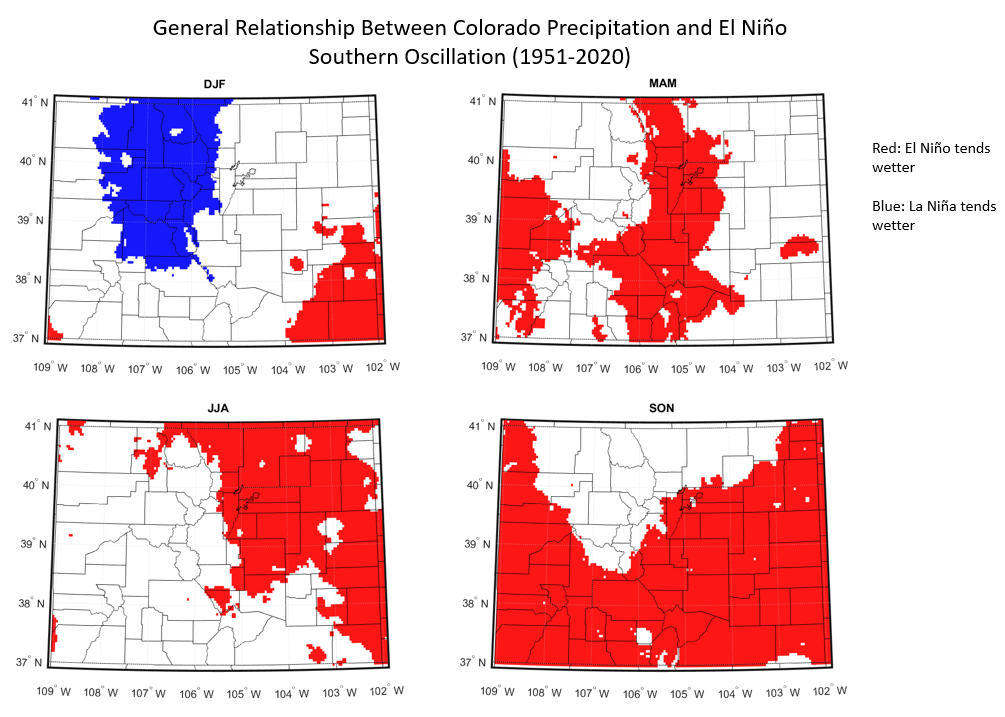
- Winter 2023–2024’s El Niño conditions brought normal to above-normal snowpack for much of the region, including Utah, Colorado, and northern New Mexico.
- Some research suggests summers with La Niña conditions tend to favor robust monsoon activity in June and July, and summers with El Niño conditions tend to favor less active monsoons, but wetter winter precipitation.
- Summer and early fall 2024 were ENSO-neutral. ENSO-neutral conditions can result in strong or weak monsoon precipitation for the Southwest and Four Corners areas.
Looking Ahead
- NOAA’s ENSO alert system is currently reporting ENSO-neutral conditions with La Niña favored to emerge in September–November (71% chance) and expected to persist through January–March 2025. For more information, check out the NOAA ENSO blog and current status presentation. Explore this more for your region of interest with the Western Regional Climate Center ENSO Precipitation Tool.
- If the potential La Niña extends into the winter, it will likely favor drier conditions in the Southwest over the winter months.
- Odds favor below-normal precipitation for October–December 2024, while temperatures are more likely to be above normal, increasing chances for drought degradation in the region.
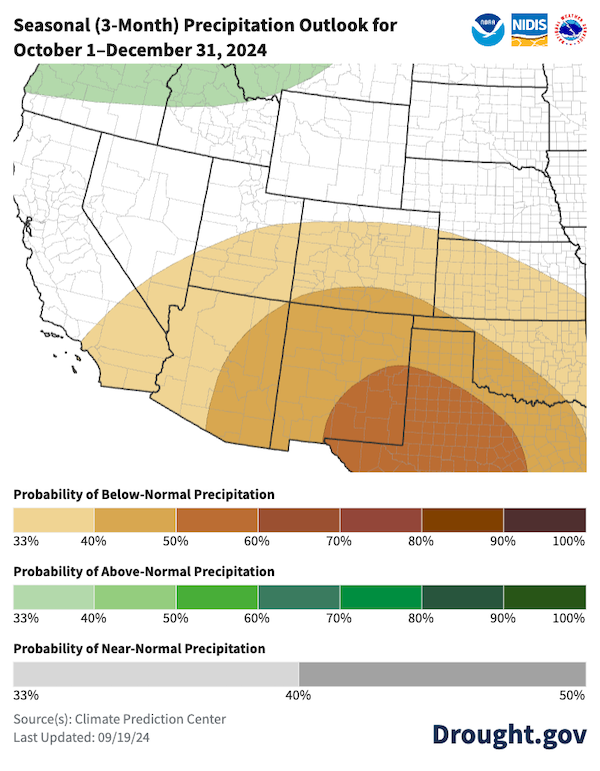
Figure 8: Seasonal Precipitation and Temperature Outlooks (October–December 2024)
Key takeaway: According to NOAA’s Climate Prediction Center, odds favor both below-average precipitation and above-average temperatures across the Intermountain West, southern California, and southern Nevada from October–December 2024.

Additional Resources
- Local NOAA National Weather Service (NWS) pages:
- Climate Assessment for the Southwest (a NOAA CAP/RISA team)
Prepared By
Gretel Follingstad, Amanda Sheffield, Kelsey Satalino, Eleanor Hasenbeck
CU Boulder/Cooperative Institute for Research in Environmental Sciences (CIRES), NOAA/National Integrated Drought Information System (NIDIS)Dave Simeral
Western Regional Climate Center/Desert Research InstituteErinanne Saffell
Arizona State Climate OfficePeter Goble
Colorado Climate CenterJon Meyer
Utah Climate CenterMichael Natoli, Andrew Mangham
NOAA’s National Weather ServicePaul Miller
NOAA’s National Water Prediction Service Colorado River Basin Forecast CenterMike Crimmins
Arizona State UniversityDave DuBois
New Mexico State Climatologist, New Mexico State UniversityLaura Haskell
Utah Department of Natural Resources
I had the occasion in my professional work this week to email Peter Goble with a question about accessing La Niña data. Below is his explainer:
October 10, 2024
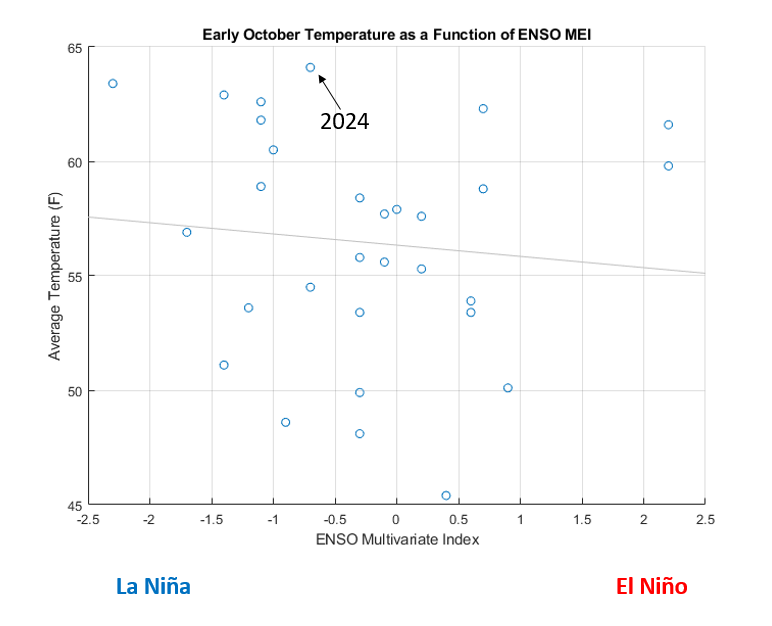
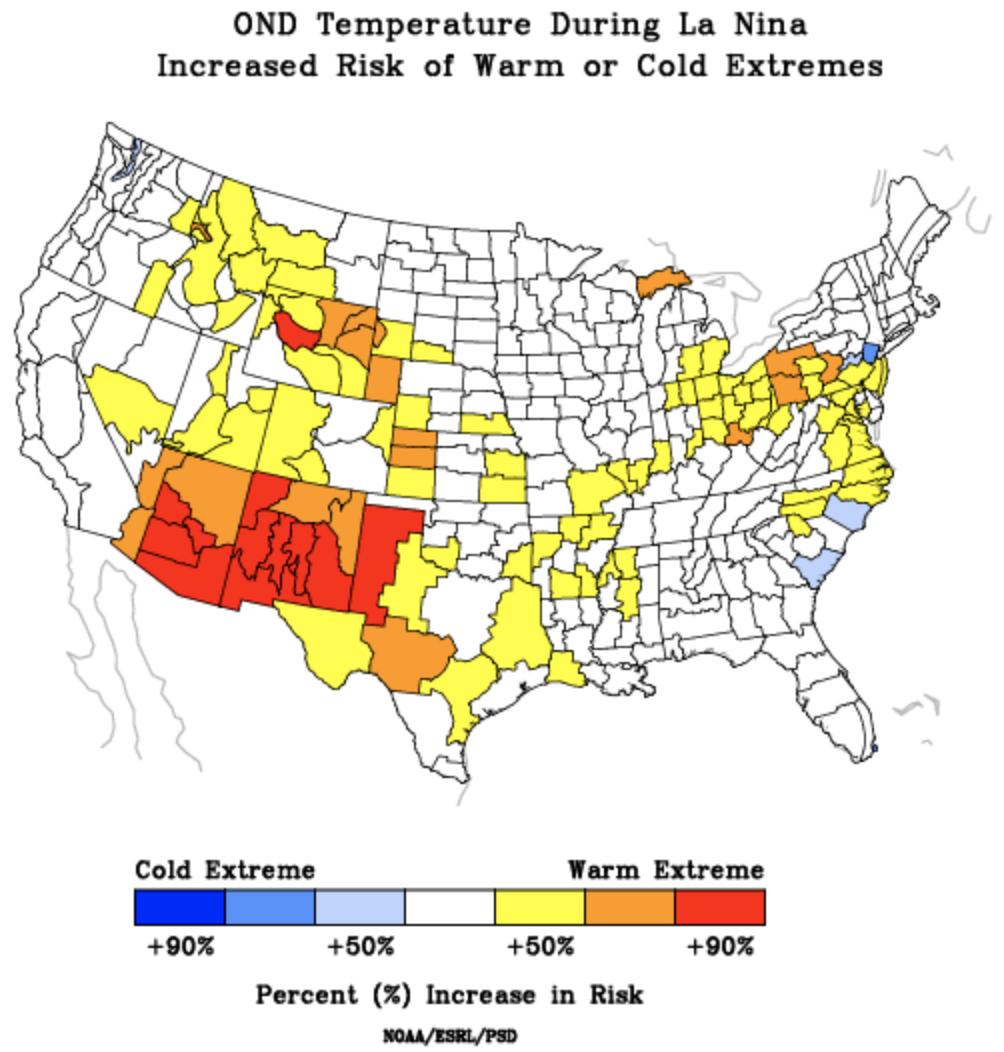
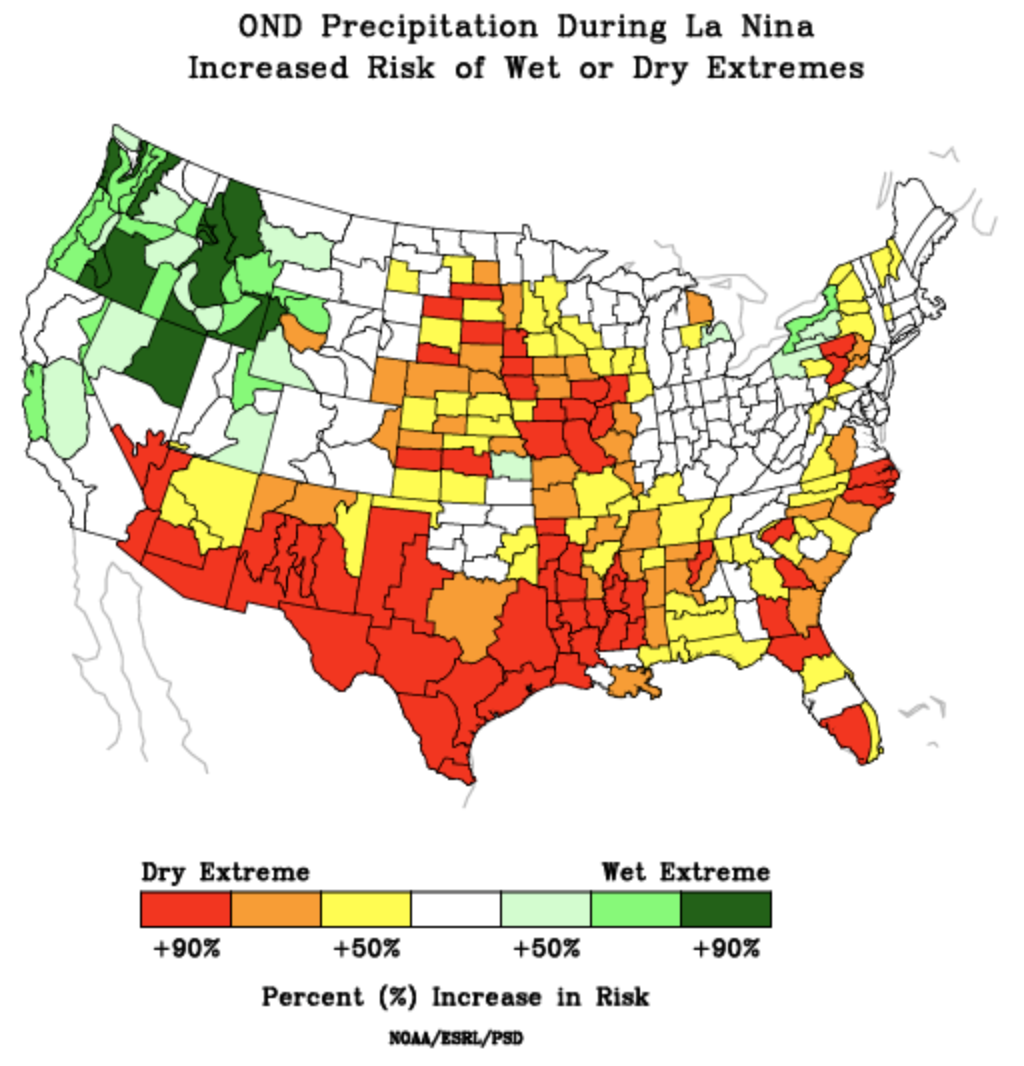
You can find ENSO (El Nino/La Nina) data from the Earth Systems Research Physical Sciences Laboratory (ESRL)here. The first graph below is a scatterplot of temperatures in the first eight days of the water year at Denver International Airport as a function of ENSO. Normally I would use the Denver Central Park station for the longer data record, but the data are a few days behind right now. El Nino vs La Nina barely explains 1% of the variance in temperature over the first eight days of the water year, which is not statistically significant. [ed. emphasis mine] I would caution, however, that eight days is simply not a large enough sample to clearly see the influence of El Nino or La Nina on our weather. Looking at a full season (such as October-December) gives us a far better sample of day-to-day weather variability. The second and third figures below (also from ESRL) show us that there is not a significant increase in the risk of a warm or dry extreme this time of year based on La Nina. That said, we do tend to see wetter, snowier winters (DJF) during winter (December-February) in north-central Colorado during La Nina, so maybe this warm, dry pattern will turn around eventually. Here’s hoping.
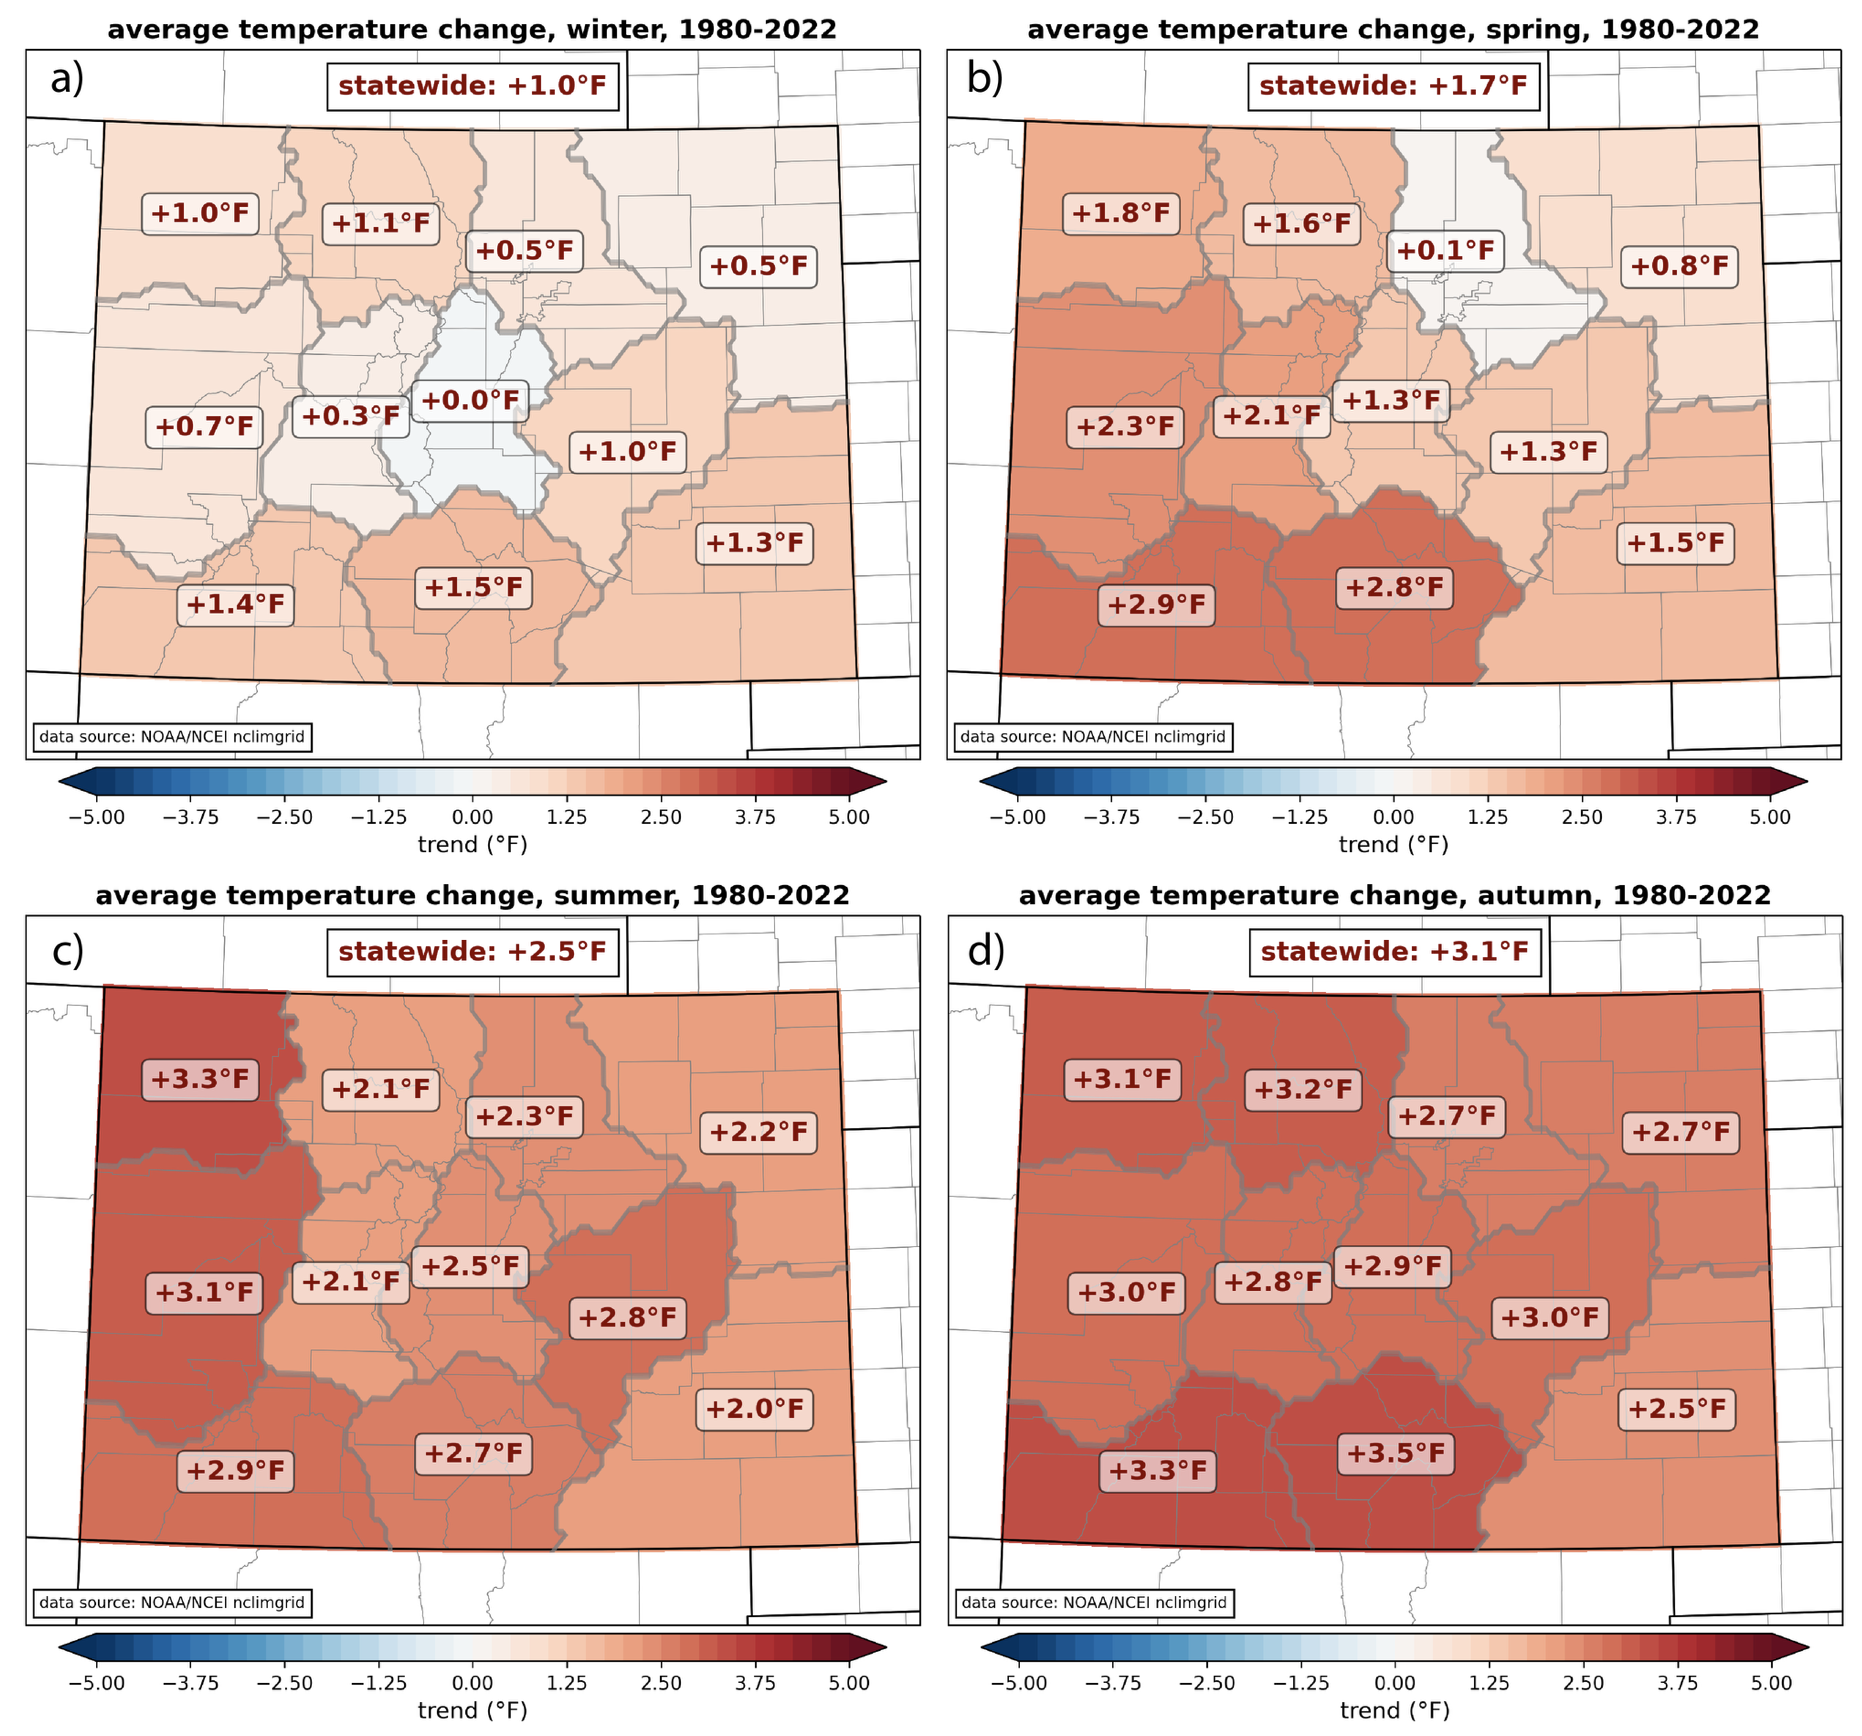
As you know, our climate is warming. We have seen a stronger warming trend in autumn than any other season. I don’t mean to suggest that the anomalous warmth we are experiencing to start this October is the new normal. Every year is different. But the temperatures we are experiencing now probably fit more comfortably into the new normal range of variability.
Data link for graphics that follow.


Click the link to read the article on the American Rivers website (Andrew Fisk):
July 9, 2024
While many are familiar with the fish and wildlife that define our landscapes there are other lesser-known critters that play a role in creating and maintaining a healthy ecosystem. This little guy isn’t flashy with brilliant plumage, a thrilling call, or a remarkable migration story. It is very difficult to see by the naked eye, doesn’t have a dramatic migration story, and isn’t tasty to eat. But you can always know where to find it … in clean clear healthy waters.
So what is this new river friend of ours?
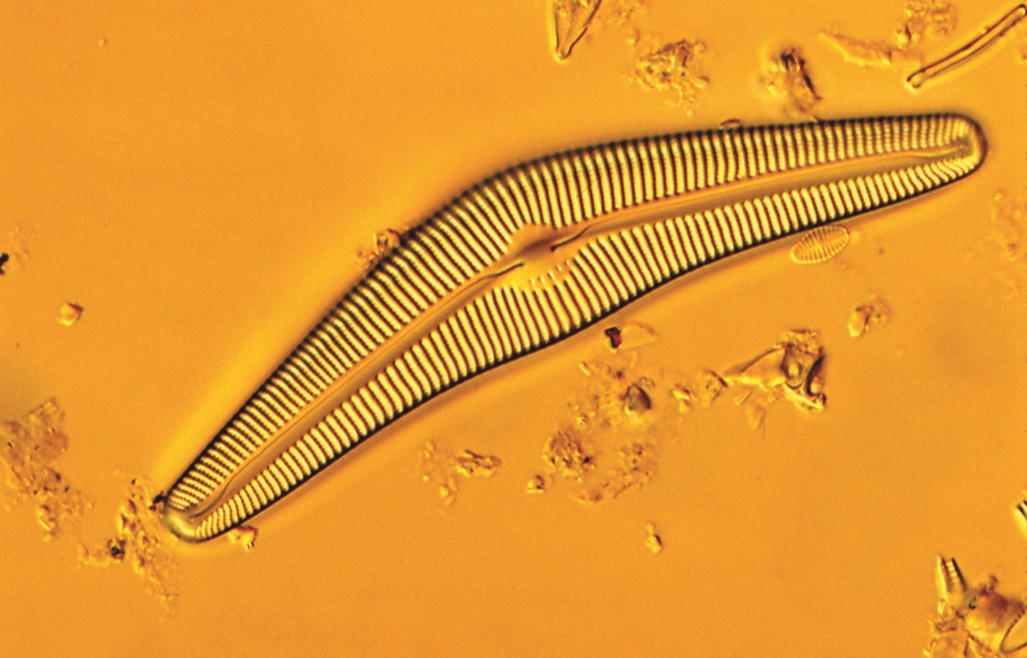
Cymbella cistula shown here is one of the many members of the genera and among the many thousands of varieties of diatoms, or what are commonly called algae. Diatoms are microscopic cells with an outer body shaped in a dramatic and diverse array of wondrous forms. These individual diatoms can exist as individuals or group together in visible colonies (such colonies can be mistaken for a vascular plant, e.g., a plant that has circuitry like blood vessels for transporting water and nutrients through their stems … as a simpler form of life, diatoms have none of this circuitry).
Diatoms generate oxygen through photosynthesis – the process where sunlight and carbon dioxide are converted to oxygen, energy, and water. They are often referred to as planktonic (from the Greek for “wandering”) because despite some having the ability to swim about, they spend their time moving with the currents. The companion group of critters to the plant-like diatoms, or phytoplankton, are the zooplankton, the first consumer in the ocean that eats phytoplankton, also small or early life stage animals that swim or float about.
These two types of planktonic organisms are critical to freshwater and marine food webs and make up a tremendous amount of the living biomass, or organic matter, in our rivers and streams.
Algae? Phytoplankton? You may be envisioning a lake or stream covered in green, making recreation discouraging or even hazardous with certain types of algae blooming in the heat of summer. Too many nutrients from treated wastewater and lawn or farm chemicals allow many species of diatoms to excessively thrive. Impoundments behind dams are often subject to algae blooms due to the decreased flow of water and higher water temperatures. And while abundant amounts of algae generate oxygen from their photosynthesis, inevitably an excessive amount of algae biomass will crash and decay. And decay then consumes all that oxygen. What was a naturally clear and clean waterbody turns a murky green with little oxygen. And some species of diatoms generate toxins that are harmful to humans and animals, making an impoundment or lake not just unappealing to swim, but hazardous to your health. But what about our new friend Cymbella cistula? Not all diatoms are alike! And many species are quite sensitive to an abundance of nutrients and do not thrive in enriched and warmer waters. Cymbella diatoms are one of the diatoms that can really only flourish in low nutrient (“oligotropic”) conditions, waterbodies that run clear and clean. Here is where this tiny organism has an out-sized role in our work to protect and restore our waters.
To chart a course away from polluted and degraded rivers, streams, lakes, and wetlands we need to set a destination. One destination is a waterbody that has little or no impact from humans, or what scientists and regulators call a baseline condition. Because different types of waterbodies – wetlands, estuaries, lakes, streams, and rivers – all have different chemical, biological, and physical characteristics no two types of baseline conditions are exactly the same. Pristine rivers and streams in the northeast are generally those that run clear and cold and flow through forests and areas of little human disturbance. While you may know a pristine stream when you see it, in order to make decisions about how to restore an unloved reach of river, scientists and regulators need precise and measurable indicators of what a pristine baseline condition means.

For many years those indicators were chemical measures of water cleanliness – dissolved oxygen, suspended solids, or temperature. But these indicators only describe a condition at a point in time when the measurement was taken and don’t integrate conditions over longer periods. And they can miss other problems that may be present. So these chemical measures alone are not the best for ensuring we make it to our destination of healthy water. To get the get fullest and most robust picture of the health of a river or stream we need to listen to the critters!
To make a better roadmap (rivermap?) to our destination scientists have for years been exploring what types of fish, insects, and diatoms live in the different types of waterbodies. This work over the last 30 years has created biological definitions of a waterbody’s health to complement the more simplistic chemical measures. One of those biological definitions is based on the description of the types and amounts of diatoms present different environmental conditions. In many parts of the country including here in New England scientists have now collected enough diatom data across enough waterbody types and conditions to create statistical models that show us what diatoms should be living in what types of water conditions. These data and models allow environmental professionals to design clean-up plans or demonstrate how a high-quality water body can remain in good health. In our work to ensure our rivers can be as clean and healthy as possible we rely on the most robust tools, regulations, and policies that help guide science-based decision making. Biological indicators of river health are one of those important tools. The Cymbella diatoms whose presence in these models provides a scientifically robust measure of what constitutes high-quality water are ones we need to listen and pay attention to. So the next time you are paddling down or wandering along that clear and cold stream give a nod to that other “wanderer” helping guide us on our journey to clean and healthy water for all!
Click the link to read the article on the WyoFile website (Dustin Bleizeffer):
October 8, 2024
With a handful of dissenting votes, a legislative panel has advanced a draft measure that proponents say merely provides the opportunity to discuss changing Wyoming statutes to enable temporary storage of high-level radioactive fuel waste from nuclear power plants.
The Minerals, Business and Economic Development Committee on Tuesday voted in favor of the draft bill Used nuclear fuel storage-amendments, which means the committee will sponsor the measure when the full Legislature convenes in January.
Committee Co-chairman Rep. Donald Burkhart Jr. (R-Rawlins), a longtime proponent of bringing nuclear fuel waste into the state, first rolled out the potential for new legislation regarding the matter in July, but neither he nor the committee shared a draft of the proposed legislation until weeks before the October meeting. The bill draft would amend past legislation mostly to align existing state statute with updated language regarding commercial nuclear waste storage with the U.S. Nuclear Regulatory Commission and the Department of Energy, Burkhart said.
“This is not a discussion of why or why not to have this,” Burkhart said at the onset of the discussion, adding that the committee took up the issue at the request of the Legislature’s Regulatory Reduction Task Force. “This is simply to amend the current statute.”

Burkhart was clear in July when he notified his fellow committee members of the pending proposal in draft form — which he shared with them, but not with the public — that nuclear storage held financial promise. The outlook for Wyoming’s fossil fuel-dependent budget is trending downward, and the state could reap more than $4 billion a year from nuclear waste storage, “just to let us keep it here in Wyoming,” he said then.
Also in July, Burkhart said he’d recently visited with a private landowner in Fremont County who, as in the past, is interested in selling land for such a storage facility. The land purchase would cost an estimated $2 million, Burkhart had said, and it would cost about $400 million to build the facility. “None of which would come from the state,” he said. “It would all come from private enterprise.”