I had the occasion in my professional work this week to email Peter Goble with a question about accessing La Niña data. Below is his explainer:
October 10, 2024
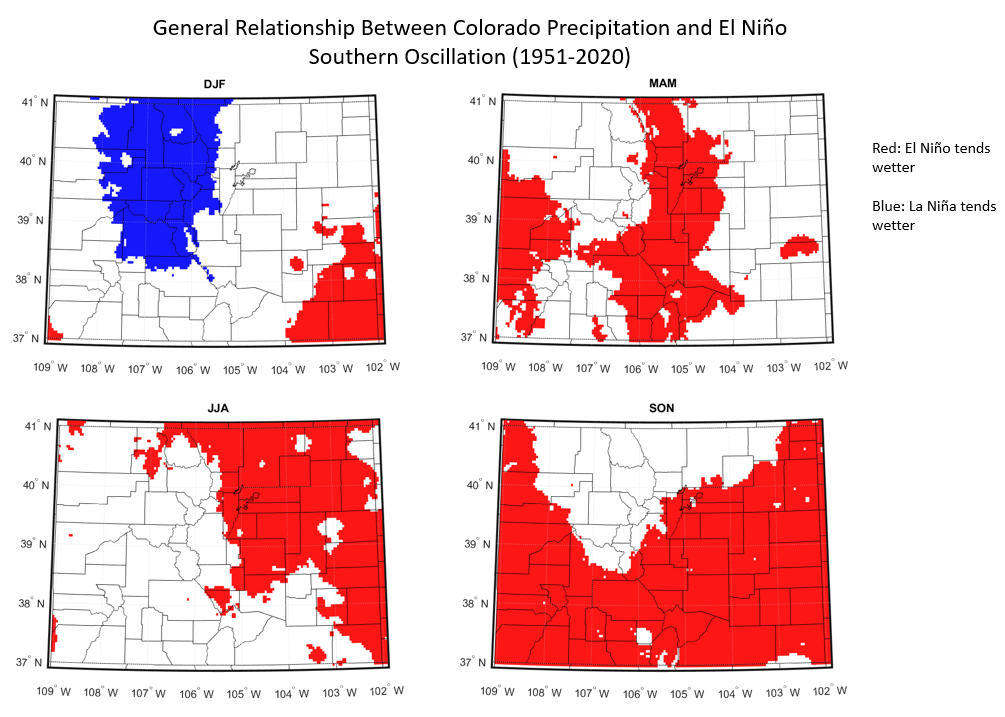
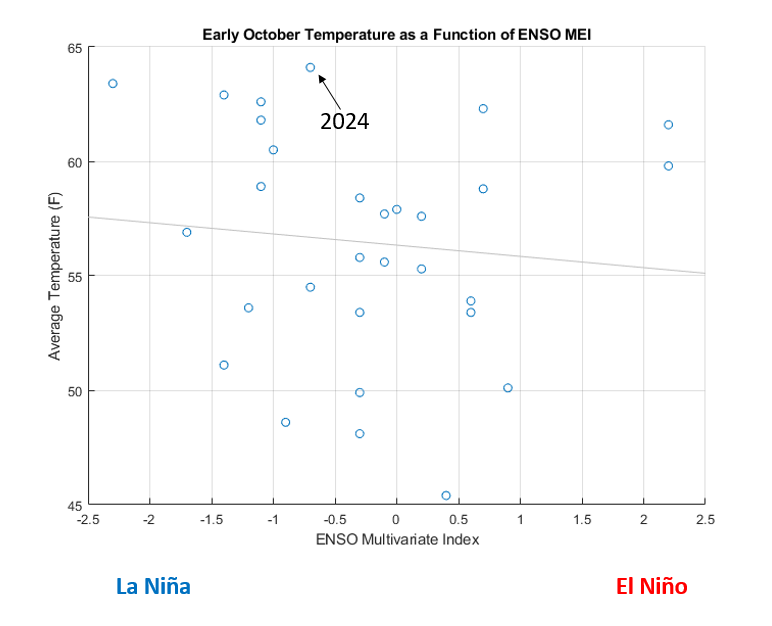
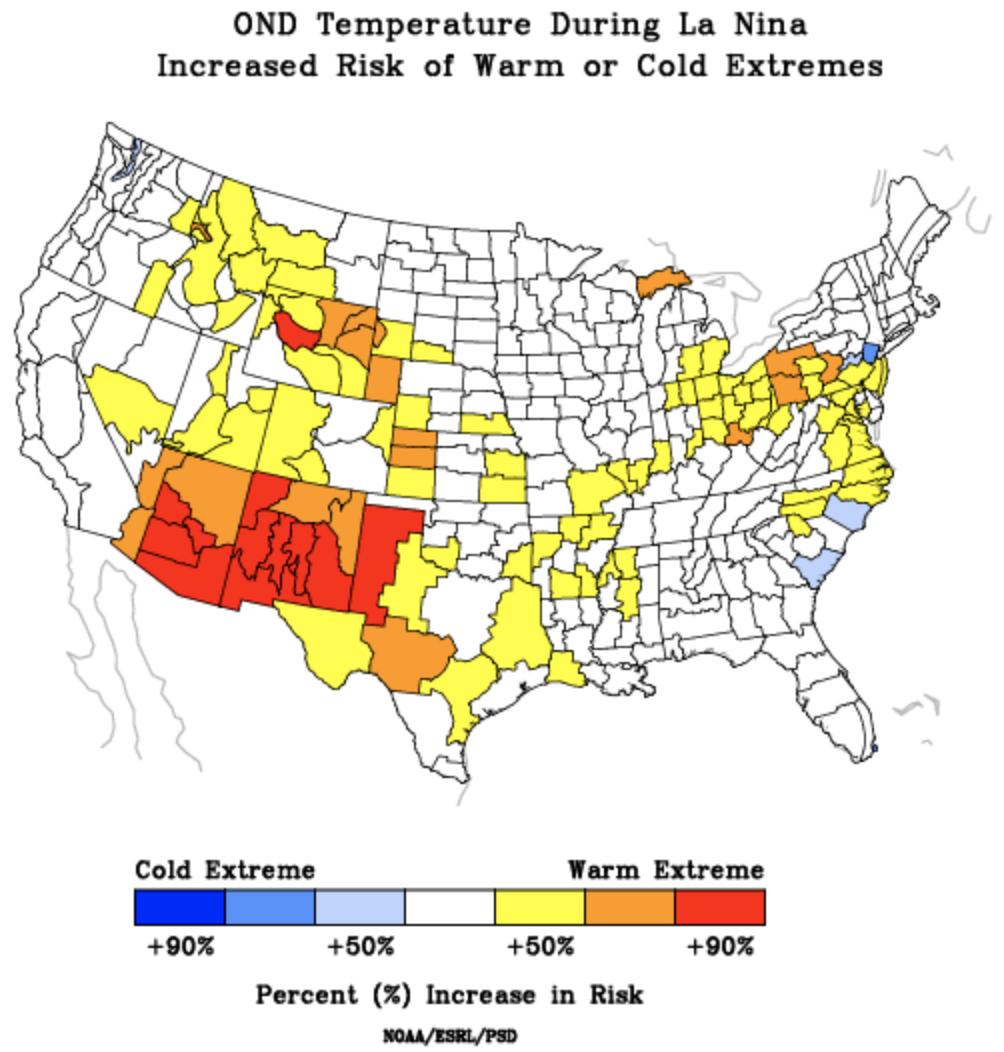
You can find ENSO (El Nino/La Nina) data from the Earth Systems Research Physical Sciences Laboratory (ESRL)here. The first graph below is a scatterplot of temperatures in the first eight days of the water year at Denver International Airport as a function of ENSO. Normally I would use the Denver Central Park station for the longer data record, but the data are a few days behind right now. El Nino vs La Nina barely explains 1% of the variance in temperature over the first eight days of the water year, which is not statistically significant. [ed. emphasis mine] I would caution, however, that eight days is simply not a large enough sample to clearly see the influence of El Nino or La Nina on our weather. Looking at a full season (such as October-December) gives us a far better sample of day-to-day weather variability. The second and third figures below (also from ESRL) show us that there is not a significant increase in the risk of a warm or dry extreme this time of year based on La Nina. That said, we do tend to see wetter, snowier winters (DJF) during winter (December-February) in north-central Colorado during La Nina, so maybe this warm, dry pattern will turn around eventually. Here’s hoping.
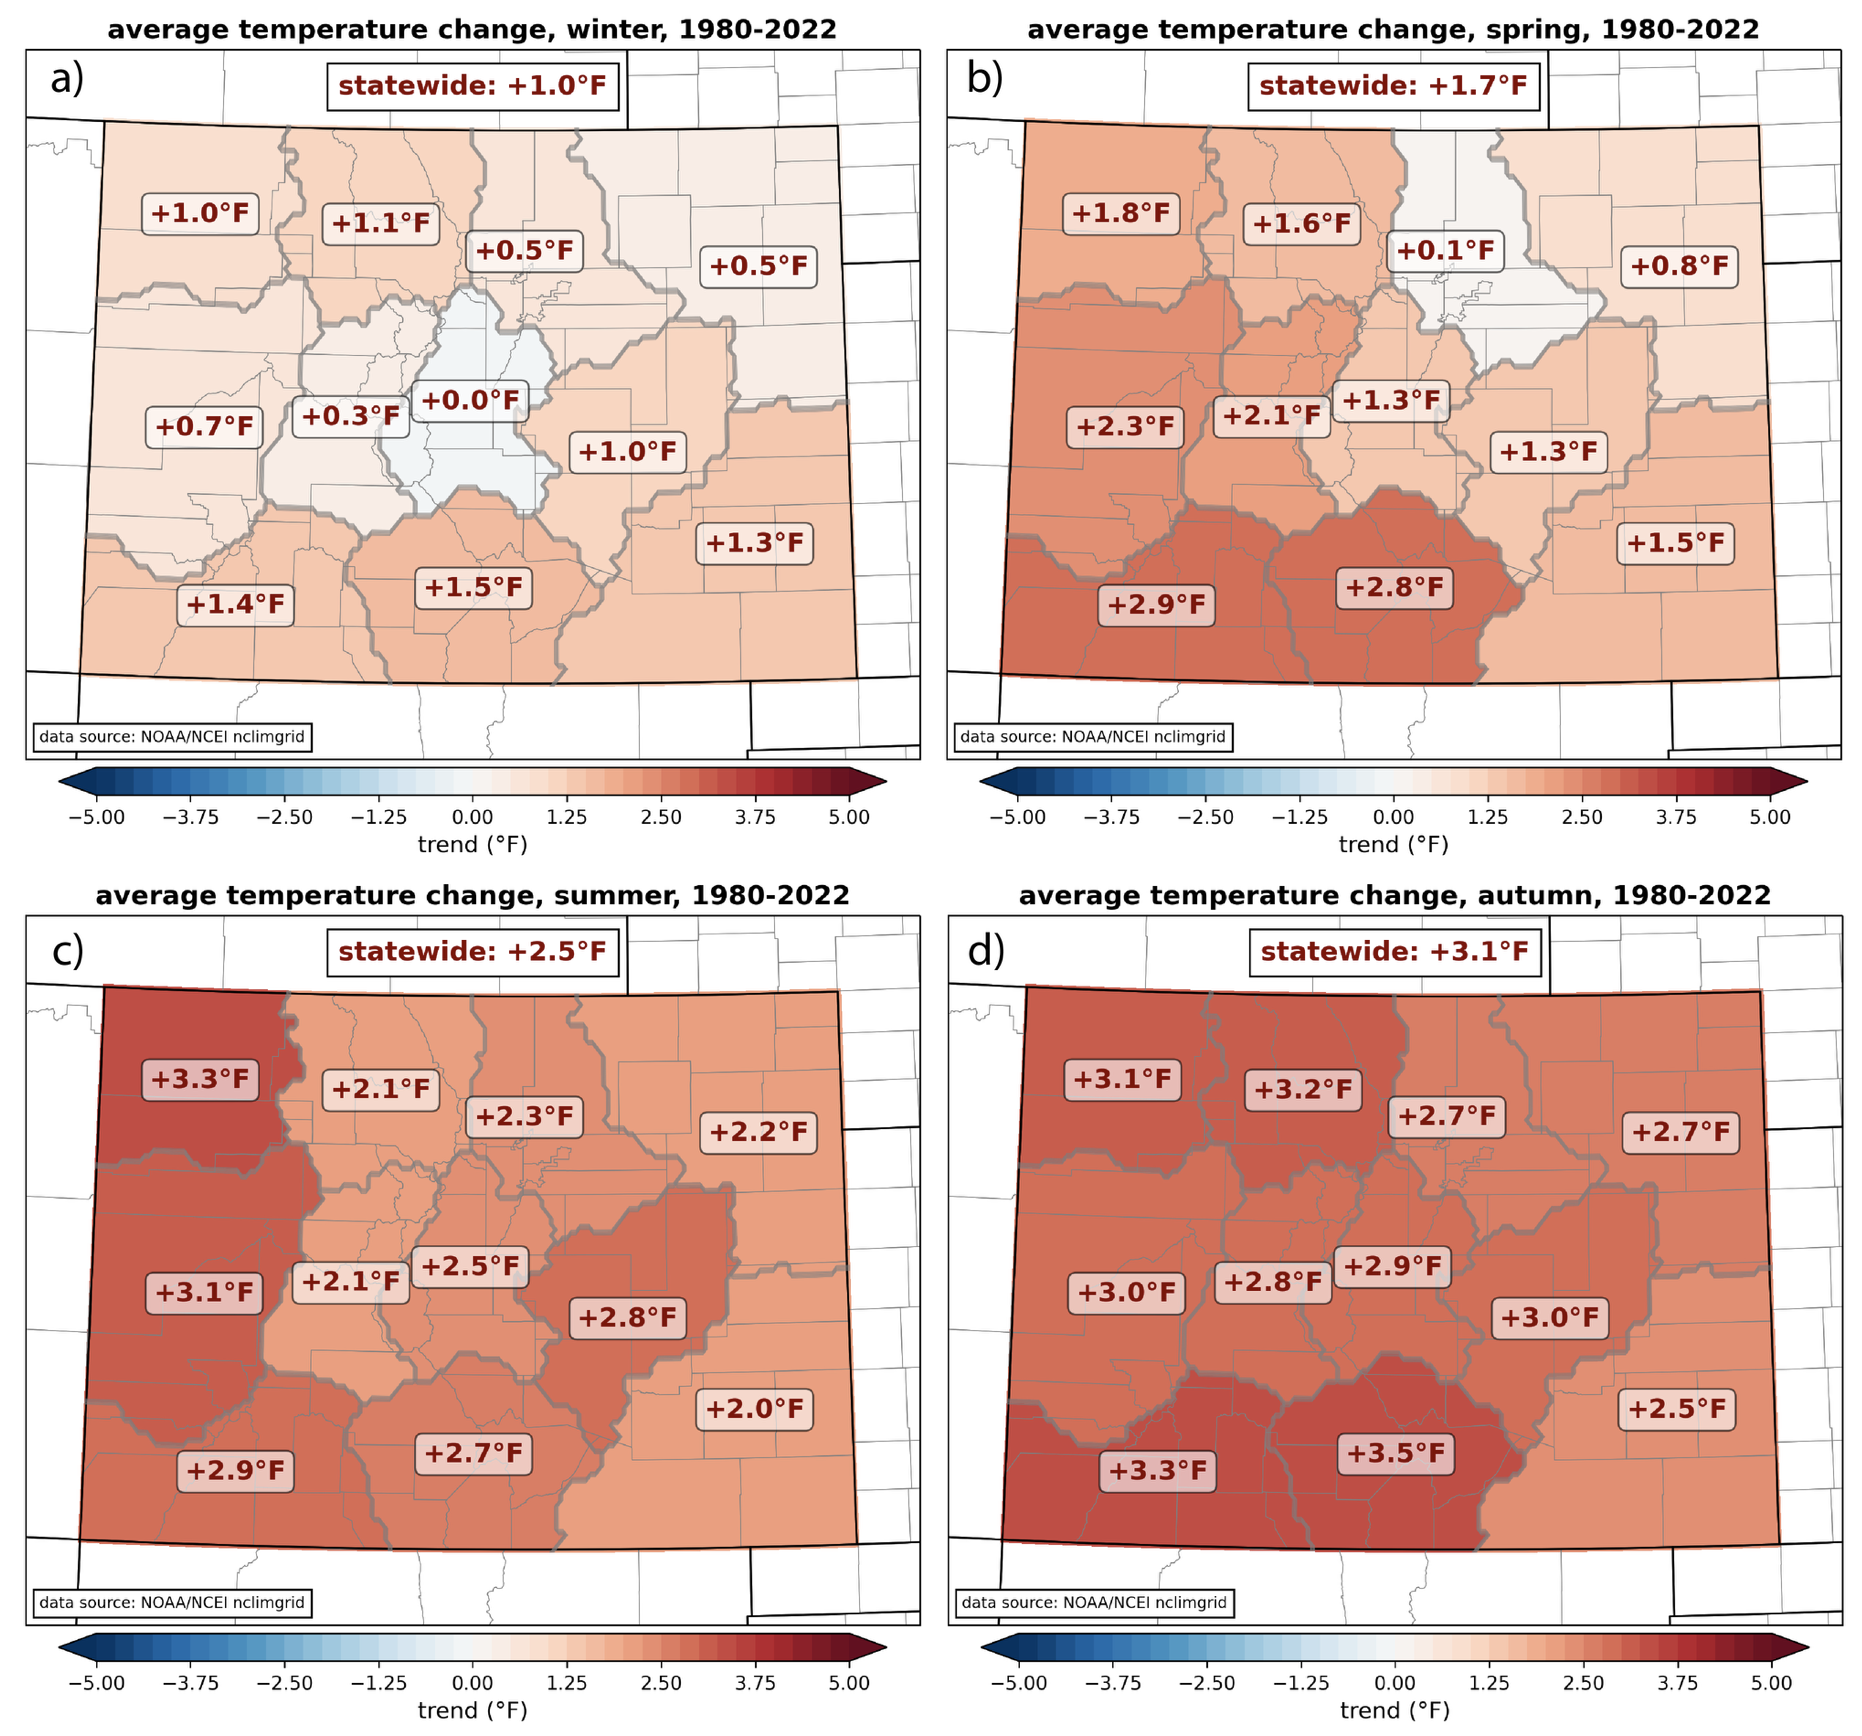
As you know, our climate is warming. We have seen a stronger warming trend in autumn than any other season. I don’t mean to suggest that the anomalous warmth we are experiencing to start this October is the new normal. Every year is different. But the temperatures we are experiencing now probably fit more comfortably into the new normal range of variability.
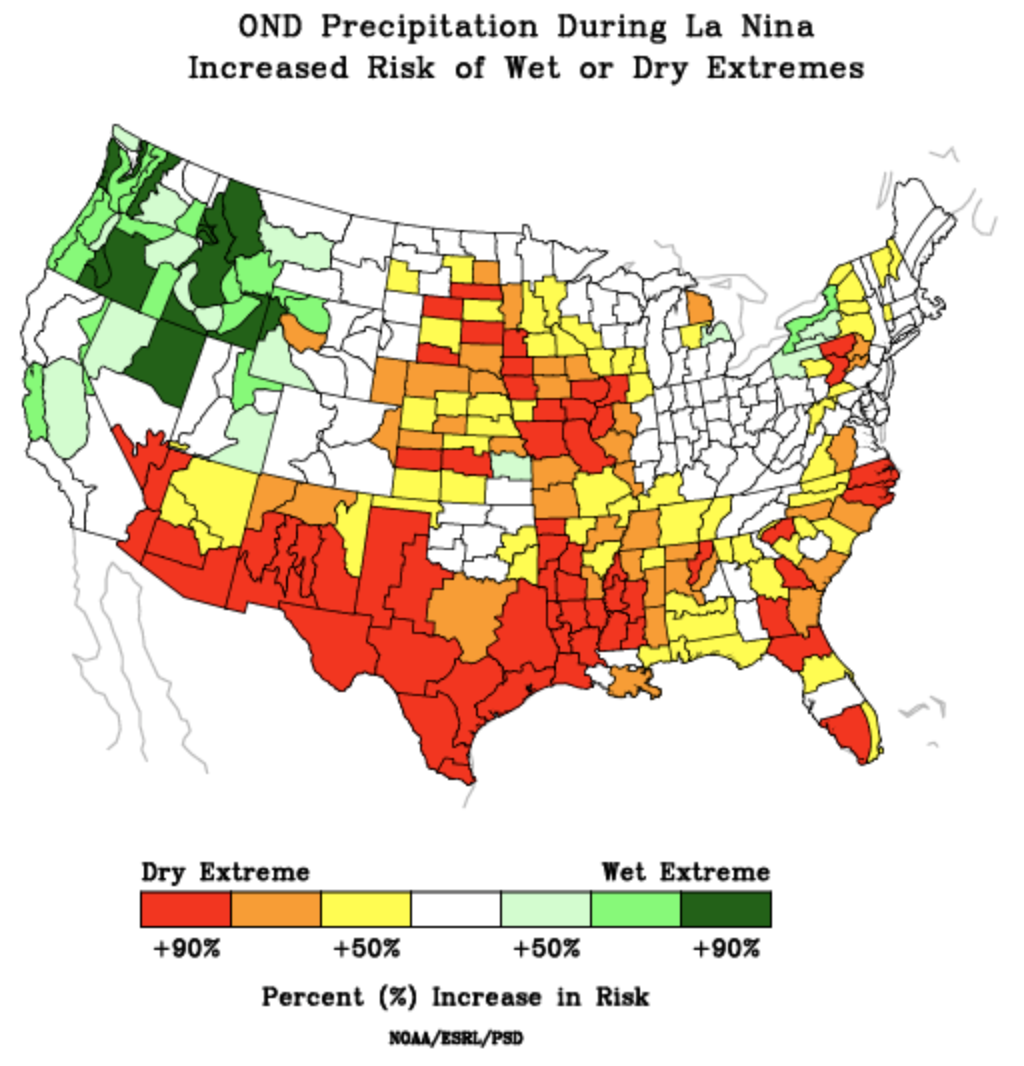
Data link for graphics that follow.