#Wyoming’s #snowpack average heading into ‘wild card’ spring season: A ‘boring’ winter delivered decent snowpack, which some Wyomingites embrace — Dustin Bleizeffer (WyoFile.com)

Snow blankets the mountains around Teton Pass on Jan. 12, 2025. (Angus M. Thuermer Jr./WyoFile)

Click the link to read the article on the WyoFile.net website (Dustin Bleizeffer):

March 17, 2025

If you want to know how weather is shaping life in Wyoming on any given day, just ask a Wyoming Department of Transportation employee, like Andrea Staley.

Her phone was blowing up early Friday afternoon with reports about a rash of crashes along Interstate 80 between Rawlins and Vedauwoo — Wyoming’s busiest roadway.

“By about 11 [a.m.], the road surface had gotten real icy,” she told WyoFile. “And with the wind, the visibility was causing issues.”

Staley, a WyDOT senior public relations publicist for southeast Wyoming, pines for “boring winters.”

“They’re my favorite,” she said.

This map depicts Wyoming’s 2025 winter precipitation as of March 14, 2025. (Wyoming State Climate Office)

It’s been a bit of a mixed bag, according to local meteorologists. But no big surprises, and for an economy that thrives on predictable levels of snow and cold, the weather basically delivered.

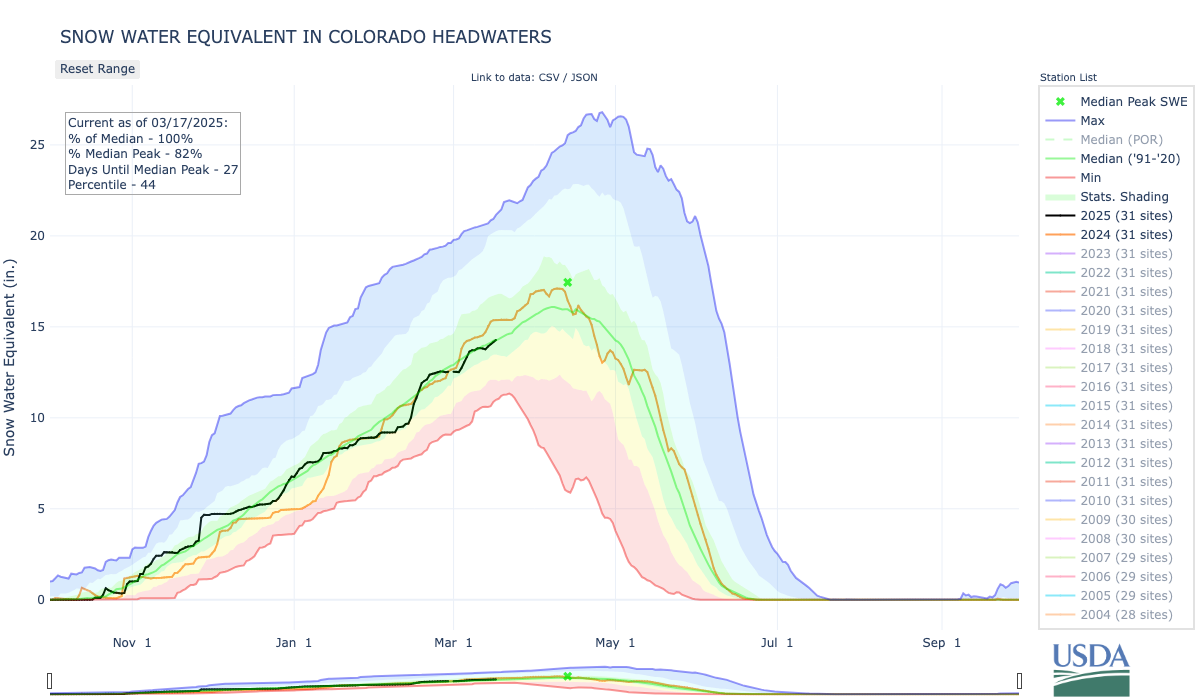
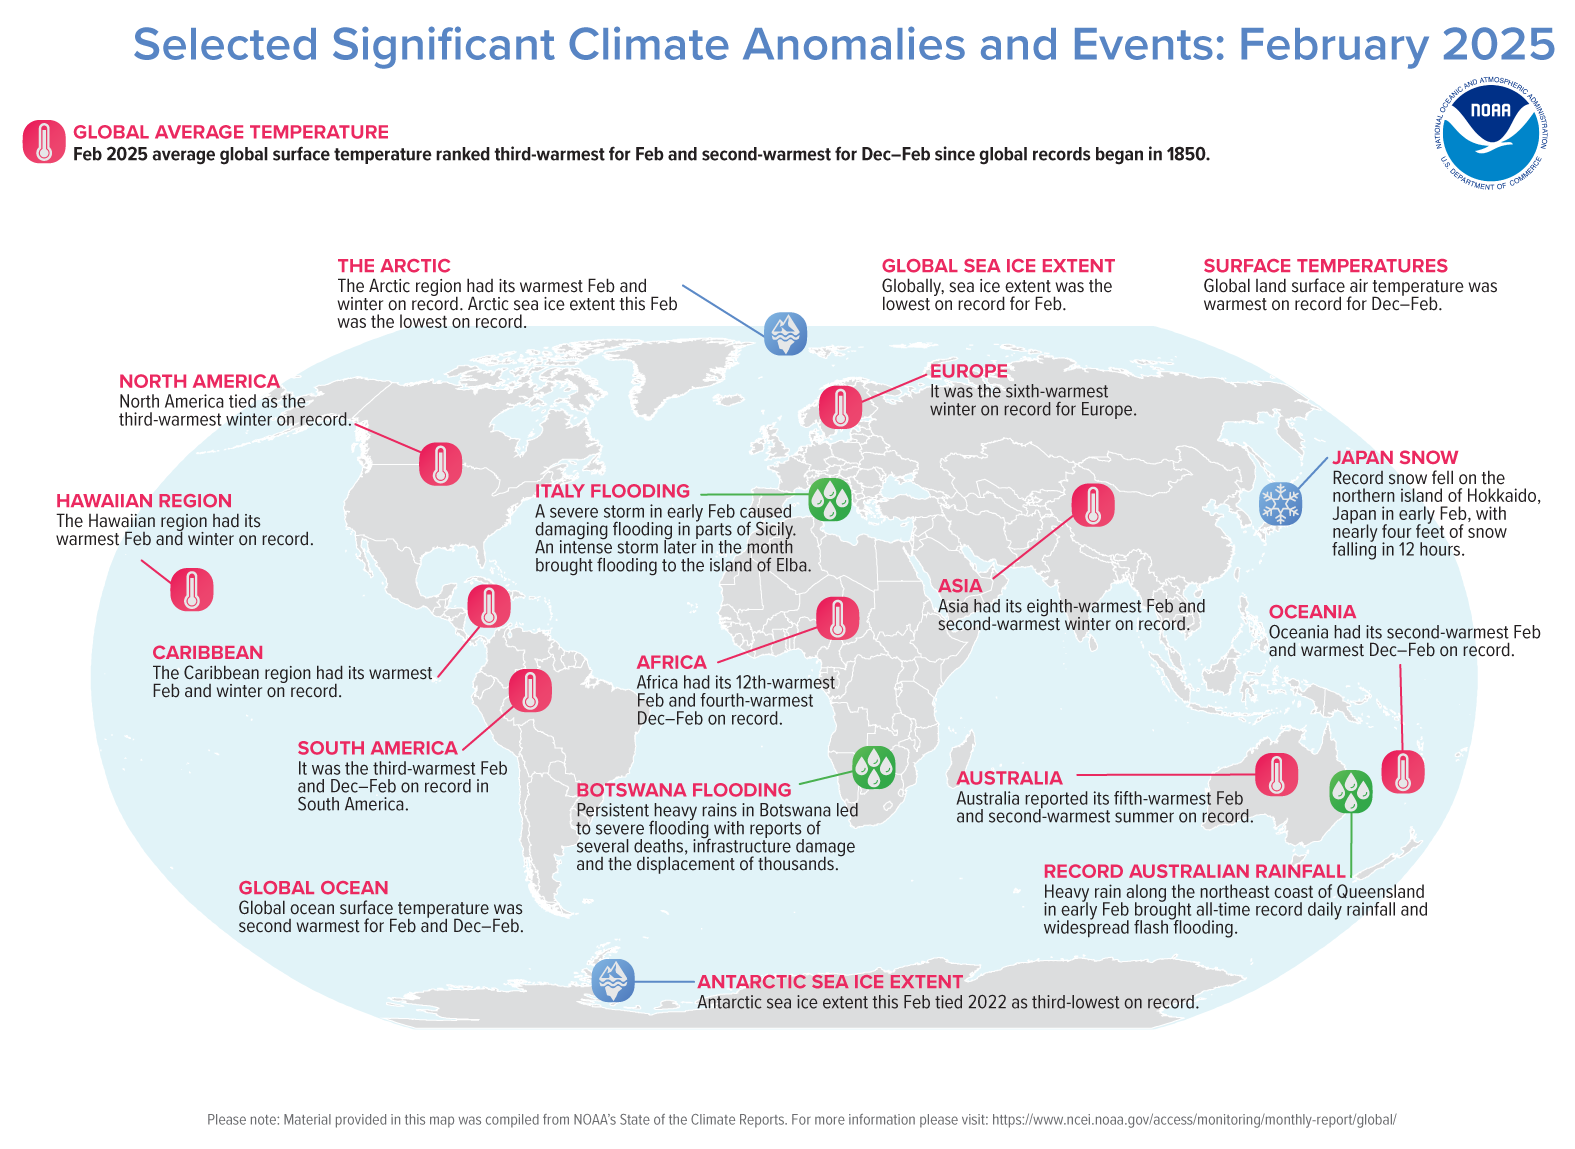
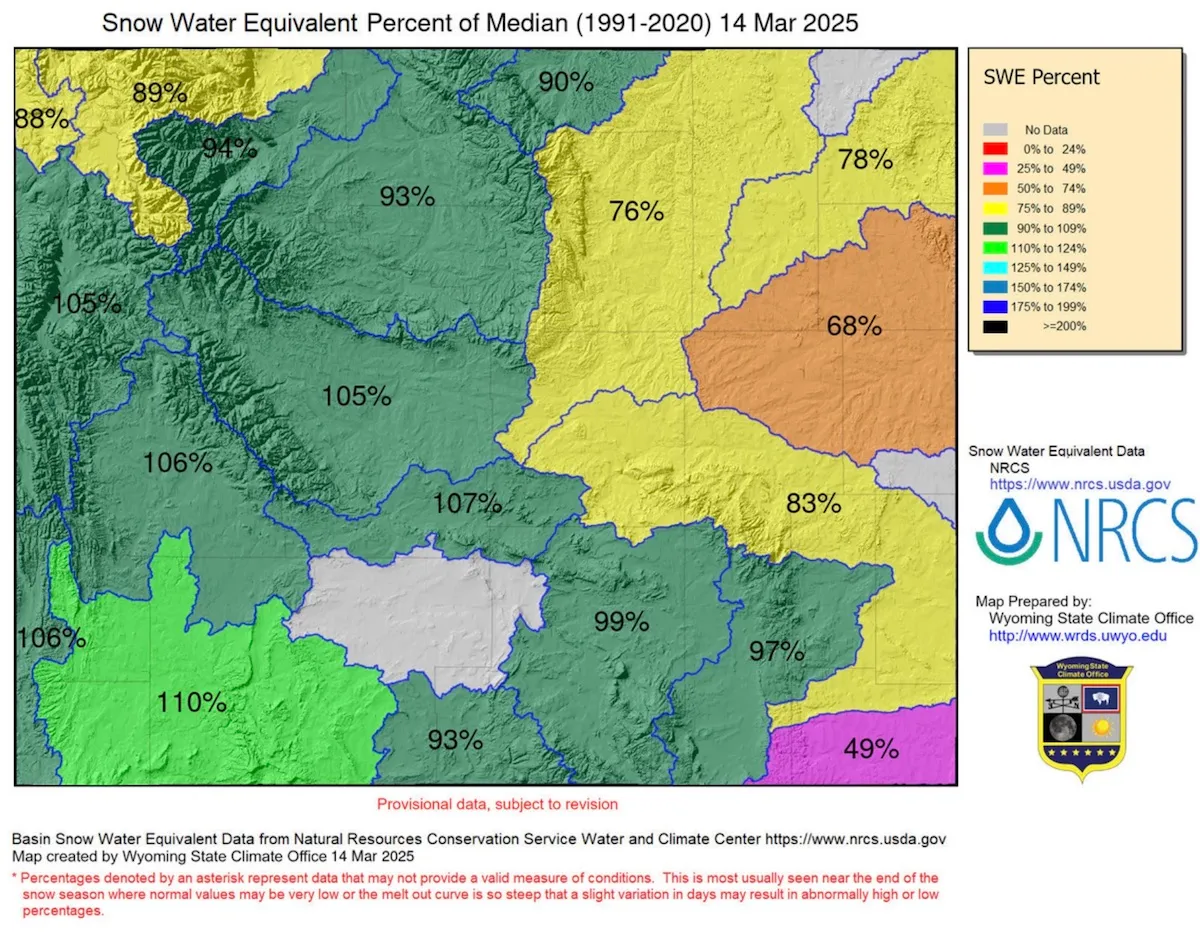
Wyoming is emerging from a fairly mild winter that has been devoid of brutal, prolonged cold snaps or massive snow dumps. With a “snow water equivalent” hovering around 94% of the median across the state, snowpack is “looking pretty good,” according to Natural Resources Conservation Service Water Supply Specialist Jeff Coyle.

There’s lower-than-normal snowpack in the northeast, including the southern portion of the Bighorn Mountains and some parts of the Black Hills on the South Dakota border.

“We’re on course to be kind of an average year in most areas of the state,” Coyle said, adding that both high elevations and basin areas appear to be meeting typical expectations. The wild card, of course, is what Mother Nature might deliver this spring — a time when Wyoming can see its biggest snow dumps.

A view of the Laramie Plains from the Snowy Range in southeast Wyoming on March 1, 2025. (Mike Koshmrl/WyoFile)

Despite an early February snowstorm that helped pad winter snowpack in the southeast, areas around Cheyenne and Laramie are about a foot below average, according to Cheyenne National Weather Service Meteorologist Mike Charnick. Accumulation of the white stuff in the Snowy Range, however, is average and even a bit more in some areas there.

In terms of overall winter precipitation in the southeast, it was among the top 10 or 12 driest years, according to another Wyoming meteorologist.

Generally speaking, it was a “mild” winter in terms of temperature — particularly in the southeast, Charnick said. “We have certainly been pretty far above average,” he said. “The lowest temperature in February was minus six [degrees Fahrenheit] and minus 12 [degrees Fahrenheit] in January.”

Winter was warmer-than-usual in other parts of the state, too.

“Western and southwest Wyoming was in the top third of warmest years over the last 115 years, whereas the rest of the state was pretty close to normal,” Riverton National Weather Service Meteorologist Lance VandenBoogart said.

Westwide SNOTEL basin-filled map March 16, 2025 via the NRCS.

What Season is it Anyway? — Peter Goble (Colorado Climate Center)

Click the link to read the article on the Colorado Climate Center website (Peter Goble):

March 14, 2025

Thursday, March 20th marks the spring equinox – the first day of spring according to most calendars. But does spring really start on March 20th? I would argue the answer is “yes, no, and maybe.” March and early April is possibly the most confusing, yet most important time of year for Colorado climatologically.

[Double rainbow over eastern Colorado in May. Photo credit: Allie Mazurek]

Three Ways to Define Spring

The start of spring may be defined in several ways:

Astronomical Spring uses the sun’s position. The astronomical calendar divides the year using solstices and equinoxes. Our summer solstice occurs when Earth’s northern hemisphere’s tilt towards the sun is maximized. Our winter solstice occurs when Earth’s northern hemisphere’s tilt away from the sun is maximized. The spring equinox (late March) and fall equinox (late September) occur when Earth’s tilt is tangential to the sun, resulting in 12 hours of daylight everywhere.

[Schematic of Earth’s orbit and astronomical seasons. Source: wikipedia, public domain]

Climatological Spring is simply the three-month period of March, April, and May. This definition doesn’t follow Earth’s orbit but aligns better with our temperature experience. Astronomical seasons can be counterintuitive: December 19th is fall, but March 19th is winter? Yet March 19th is typically warmer than December 19th in mid-latitude locations.

Phenological Spring focuses on natural changes – new grass, blooming flowers, and leafing trees. The National Phenology Network tracks leaf-out dates using satellite data. The 30-year average for the Front Range (Fort Collins to Colorado Springs) is between April 1-15. In eastern Colorado and southwestern valleys, it’s March 15-31. In the high country, it might be as late as May or early June. The phenological processes of spring vary yearly based on weather conditions.

[30-year average leaf-out date. Source: National Phenology Network]

Beyond These Definitions

These three definitions do not cover everything. Farmers might define spring by planting time – commonly late April or early May in Colorado. Others may focus on when snow stops falling. On average, the Front Range sees its last snow around the third week of April – earlier for the eastern plains and southwestern valleys, but much later for the mountains. Some areas, like the aptly named “Never Summer Range,” may see snow year-round. As recently as 2019, even the lowest elevations of eastern Colorado had snow as late as May’s fourth week, disrupting graduations, weddings, and “summer break” plans.

[May 21st, 2019 west of Fort Collins, CO. Photo credit: Allie Mazurek]

Alternative Approaches

I might define spring on the northern Front Range as starting when the average minimum temperature rises above freezing and ending when the average daily maximum temperature hits 80°F. PRISM data shows this works reasonably at lower elevations but less so for higher ones.

[First day of calendar year with average minimum daily temperatures above freezing. Created by Colorado Climate Center. Gridded data source: PRISM. Station data source: SCACIS]

Climatologist Brian Brettschneider suggests defining winter as days in the bottom 25% of the temperature distribution, summer as the top 25%, and spring/fall as everything between. By this measure, Denver’s spring begins in March’s third week and ends in June’s second week. Check out his blog for more details.

The Fifth Season?

If we define spring phenologically using leaf-out dates (late March/April or later in mountains), what do we call mid-March? With sunset at 7:00 PM and warming temperatures, it doesn’t feel like winter, yet spring’s phenological processes have not begun. Perhaps it’s a fifth season – “wind season” (Colorado’s windiest time) or “water season” (crucial for our state’s water supply).

Colorado’s Most Important Season

This transitional period is extremely important for Colorado. Most of our usable water comes from mountain snowfall that melts in spring and flows into reservoirs. April is the wettest month for much of our high country, with March close behind.

[Month of year with highest average precipitation. Created by Colorado Climate Center. Data source: PRISM]

When March and April are dry, mountain snowpack suffers and snow melts early. When they’re wet, snowpack is likelier to peak at or above average, and snowmelt comes later. This shortens our high-elevation fire season and leaves more water in our reservoirs through summer and fall.

So while we debate whether it’s technically spring yet, remember that March and early April – whatever we call this season – plays a crucial role in Colorado’s water security and ecological health for the entire year.

State #snowpack still underperforming with typical peak levels a month away — The #GrandJunction Daily Sentinel

Click the link to read the article on the Grand Junction Daily Sentinel website (Dennis Webb):

March 9, 2025

Statewide snowpack, which becomes spring runoff that serves agricultural and municipal needs, stood at 90% of normal as of Friday morning, according to the Natural Resources Conservation Service Colorado Snow Survey program. Accumulation amounts continue to show a distinct north-south split. Northern basins are performing better as is typical in winters such as this one that have La Niña climate patterns marked by colder-than-normal surface ocean temperatures in the eastern equatorial Pacific Ocean.

Snowpack in the Colorado River Basin headwaters in Colorado stood at 101% of median as of [March 7, 2025], the Yampa-White River-Little Snake basins were at 96% of median, and the South Platte Basin was at 106% of median. Farther south, the Gunnison River Basin was at 89% of median; the Arkansas River Basin, 76%; the Upper Rio Grande Basin, 66%; and the San Miguel/Dolores/Animas/San Juan basins, 69%.

Grand Mesa continues to lag behind in snowpack levels. An NRCS measurement station at Mesa Lakes shows snowpack at 81% of normal, but the Park Reservoir and Overland Reservoir stations farther east are at just 69% and 66% of normal, respectively. The current streamflow forecast for this spring and summer at Surface Creek at Cedaredge calls for flows of just 57% of normal.

Assessing the Global Climate in February 2025: Above-average temperatures over most areas; lowest global and Arctic sea ice extent — NOAA

Click the link to read the article on the NOAA website:

March 12, 2025

February Highlights:

  • Temperatures were above average over much of the globe, particularly in the Arctic, but much below average over western Canada and the central United States.
  • Global and Arctic sea ice extent ranked lowest on record for February.
  • Twelve named storms occurred across the globe in February, which set an all-time record for the month.
Map of global selected significant climate anomalies and events in February 2025.

Temperature

The February global surface temperature was 2.27°F (1.26°C) above the 20th-century average of 53.8°F (12.1°C), making it the third-warmest February on record. According to NCEI’s Global Annual Temperature Outlook, there is a 4% chance that 2025 will rank as the warmest year on record. 

Land and Ocean Temperature Percentiles for February 2025 (°C). Red indicates warmer than average and blue indicates colder than average.

It was the fourth-warmest February for the global land air temperature and the second-warmest February for the global ocean surface temperature. Global temperatures have cooled in recent months as a La Niña episode, the cold phase of El Niño Southern Oscillation (ENSO), developed. Global temperatures tend to be cooler during periods of La Niña in comparison to periods with an El Niño present.

February temperatures were above average across much of the global land surface, particularly over the Arctic, central Eurasia, southern South America and central Australia. Much of western Canada, the central United States, eastern Europe, the Middle East and China were colder than average. Sea surface temperatures were above average over most areas, while much of the central and eastern tropical Pacific was below average (consistent with La Niña), as were parts of the southeast Pacific, western North Atlantic and the northwestern Indian Oceans.

Surface Temperature Departure from the 1991–2020 Average for February 2025 (°C). Red indicates warmer than average and blue indicates colder than average.

Snow Cover

The Northern Hemisphere snow cover extent in February was slightly below average. Snow cover over North America and Greenland was below average (by 50,000 square miles), and Eurasia was also below average (by 40,000 square miles). Areas of below-average snow cover include the central United States and much of Europe.

Sea Ice

Global sea ice extent was the smallest in the 47-year record at 6.16 million square miles, which was 770,000 square miles below the 1991–2020 average. Arctic sea ice extent was below average (by 430,000 square miles), ranking lowest on record, and Antarctic extent was below average (by 340,000 square miles), tied with 2022 for third lowest on record.

Map of the Arctic (left) and Antarctic (right) sea ice extent in February 2025.

Tropical Cyclones

Twelve named storms occurred across the globe in February, which set an all-time record for the month. A record five named storms occurred in the southwestern Indian Ocean. Five named storms occurred in the Australian region, as well as four in the Southwest Pacific.


For a more complete summary of climate conditions and events, see our February 2025 Global Climate Report or explore our Climate at a Glance Global Time Series.