And here’s to our children that you loved so much.

And here’s to our children that you loved so much.

Click the link to access the article on the AMS Journals website (Daniel Whitesel, Rezaul Mahmood, Paul Flanagan, Chris Phillips, Roger A. Pielke Sr. , Udaysankar Nair, and Eric Rappin). Here’s the abstract:
April 25, 2025
Land-use land-cover change (LULCC) caused by irrigation impacts weather and climate. The Great Plains Irrigation Experiment (GRAINEX) aims to understand the impacts of irrigated and nonirrigated land uses on the convective environment. To the best of the authors’ knowledge, this paper is the first of this type of study that analyzed convective environments over irrigated and nonirrigated land uses during early and peak growing seasons under a variety of atmospheric conditions, using observed rawinsonde data from GRAINEX and convective diagnostic variables. These variables include CAPE, mixed-layer CAPE (MLCAPE), most unstable CAPE (MUCAPE), lifted index, total totals index, precipitable water (PWAT), 850-mb dewpoint depression (DD850mb; 1 mb = 1 hPa), and environmental lapse rates (ELRs). Rawinsonde observations were categorized by, for example, irrigated versus nonirrigated, morning versus afternoon, cloudy versus noncloudy day, and early [intensive observation period 1 (IOP1)] versus peak (IOP2) growing season (when irrigation also becomes widespread). Irrigated land use and irrigation impact many of these diagnostic variables. For example, it was found that CAPE and MUCAPE were higher over irrigated land use compared to nonirrigated land use for most categories. PWAT was found to be higher over irrigated land use, especially during clear days and peak growing season (IOP2) when irrigation is widespread. DD850mb was lower over irrigated areas and particularly during IOP2. We suggest that, regardless of background condition, LULCC driven by irrigation impacts convective environments and favors the development of convective storms.
© 2025 American Meteorological Society. This published article is licensed under the terms of the default AMS reuse license. For information regarding reuse of this content and general copyright information, consult the AMS Copyright Policy (www.ametsoc.org/PUBSReuseLicenses).Corresponding author: Rezaul Mahmood, rmahmood2@unl.edu
Click the link to read the article on the NOAA website (Emily Becker):
May 8, 2025
The tropical Pacific is in ENSO-neutral conditions, and neutral is expected to continue through the Northern Hemisphere summer. Neutral is also the most likely outcome for the fall and winter, although chances of La Niña are a close second. Today, as your trusty representative of the ENSO forecast team, I’ll cover current conditions in the tropical Pacific, what we mean by neutral, and what it means for seasonal climate prediction… with a side of Macbeth (footnote 1).
The ENSO cauldron
First, let’s set the stage for why we care so much about El Niño and La Niña, the natural climate pattern collectively known as ENSO, the El Niño/Southern Oscillation. El Niño and La Niña change global atmospheric circulation and the jet streams in known ways, with impacts on extreme rain, drought, snow, heatwaves, the range of daily temperature, tornado and hurricane seasons, global crop yields and disease outbreaks, and many others. El Niño and La Niña can be predicted many months in advance, so they provide an early picture of potential climate conditions and allow for preparation and planning.
If it were done when ’tis done
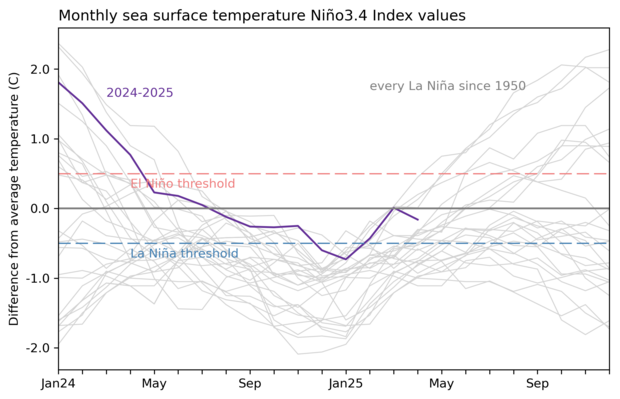
Our primary yardstick for ENSO is how the temperature of the ocean surface in the Niño-3.4 region of the central tropical Pacific compares to the long-term average. (Long-term is currently 1991–2020). Warmer than average by 0.5 °Celsius (0.9 °F) or more is El Niño, while cooler than average by 0.5 C or more is La Niña. Between them—within 0.5 °C of average—is ENSO-neutral territory.
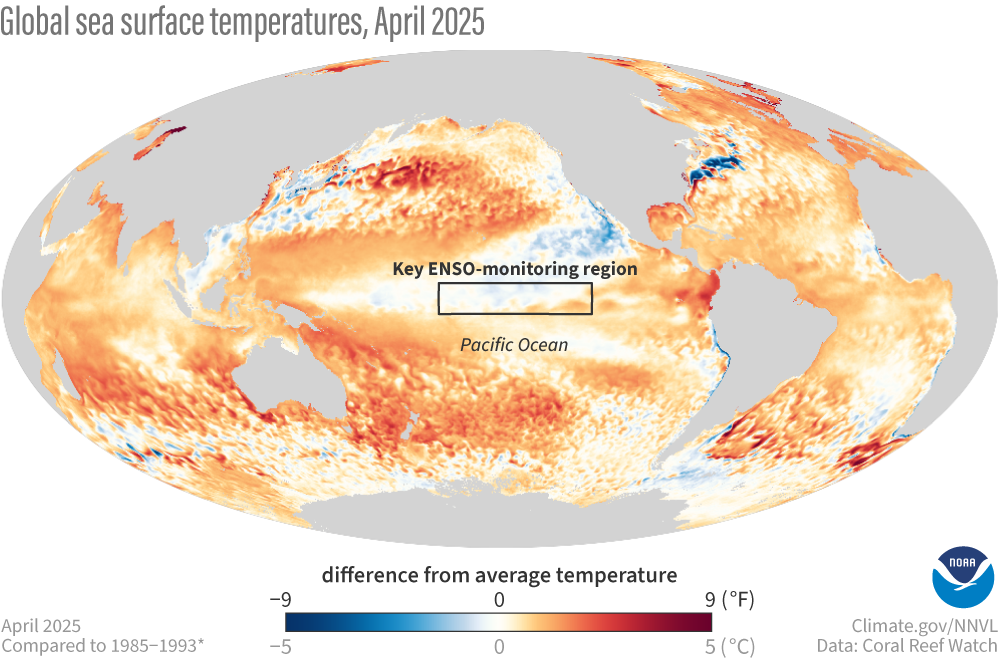
April 2025 sea surface temperature compared to the 1985-1993 average (details on climatology from Coral Reef Watch). The box indicates the location of the Niño-3.4 ENSO-monitoring region in the tropical Pacific. The surface of the east-central tropical Pacific is near average, while much of the global ocean remains warmer than average. NOAA Climate.gov image from Data Snapshots.
According to our most reliable long-term sea surface temperature dataset (see footnote), the Niño-3.4 region was just 0.16 °C (0.3 °F) cooler than the long-term average in April. This is solidly in ENSO-neutral territory for the second month in a row.
We ENSO forecasters also monitor the temperature of the water under the surface of the tropical Pacific because it can reinforce or change temperatures at the surface. Currently, the subsurface is also very close to the long-term average.
Turning to the atmospheric side of ENSO, some features are reminiscent of La Niña, but the brew this month has more ENSO-neutral flavors. We monitor many different aspects of the Walker circulation, the overturning atmospheric circulation in the tropical Pacific, to get a full picture of the strength of the circulation. During El Niño, the Walker circulation is weakened: weaker easterly (from the east) trade winds, a rainier central Pacific, and drier Indonesia. La Niña strengthens the circulation: stronger trade winds, a drier central Pacific, and a wetter Indonesia. When ENSO is neutral, winds, rainfall, and cloudiness are all near average.
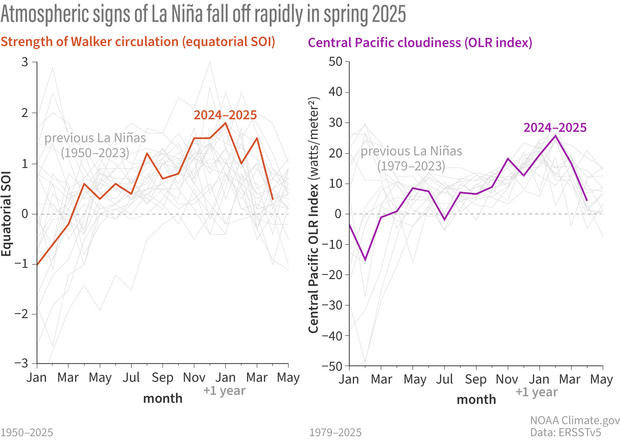
Currently, we find that cloud cover over the central tropical Pacific is slightly reduced, easterly trade winds are modestly stronger than average near the Date Line, and the sea level pressure pattern across the Pacific (as measured by the Equatorial Southern Oscillation Index) is slightly positive. All these indicators are consistent with a stronger Walker circulation, so the tropical Pacific atmosphere is maintaining a slight La Niña-ish lean. However, these are the closest to average we’ve seen in some time, and these monthly measures of the tropical atmosphere bounce around a lot more than the ocean ones.
Nothing is but what is not
A question we often get here at the ENSO Blog is “what are the impacts of neutral?” That’s a great question! After all, I listed a whole bunch of effects from El Niño and La Niña in the second paragraph of this very post. However, neutral doesn’t have a signature pattern of weather effects. When El Niño or La Niña are in charge, they change atmospheric circulation and push the jet streams around in specific ways, leading to their typical impacts, and making the seasonal climate more predictable. In their absence—that is, neutral conditions—other, less predictable weather and climate patterns can be more important.

Examples of other climate patterns include the North Atlantic Oscillation and the Madden-Julian Oscillation, both of which are known to influence temperature and rain/snow. However, they are largely only predictable a few weeks in advance, so they don’t give us the same kind of long-range prediction edge as El Niño or La Niña.
If you can look into the seeds of time and say which grain will grow and which will not
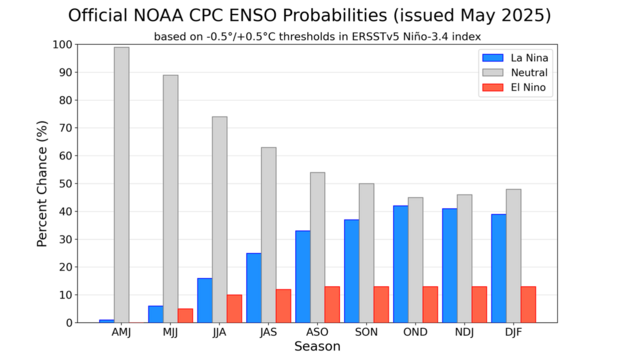
The current outlook for ENSO is very similar to last month’s, with a 74% chance of neutral through the summer. Neutral continues to be the most likely scenario through the winter, although La Niña is a close second. Odds of El Niño next winter are relatively small, at about 15%.
ENSO prediction in the spring is notoriously difficult, a time known as the “spring predictability barrier.” (Check here and here for more details on the spring predictability barrier.) In the coming months, we’ll emerge from this period, and as we draw closer to the winter, our forecasts should gradually become more confident.
A little peek behind the scenes: when Michelle was drafting this month’s ENSO Diagnostic Discussion, she messaged the team to say it was tough not just to repeat April’s discussion. This is another difficulty of ENSO-neutral conditions! It’s been a long time since we’ve had an extended stretch of neutral (you can check out our 75-year historical record of ENSO here). But that doesn’t mean we’re out of things to talk about here at the ENSO Blog, so watch this space!
Footnotes
1: All the section headings are quotes from Shakespeare’s Macbeth. Should I have used quotation marks? Maybe. But we all agreed that looked weird.
2: For official ENSO monitoring, we use the Extended Reconstructed Sea Surface Temperature data set, now on its 5th version. Details on what’s in the latest update are available from NOAA National Centers for Environmental Information.
From email from Northern Water (Jeff Stahla):
May 9, 2025
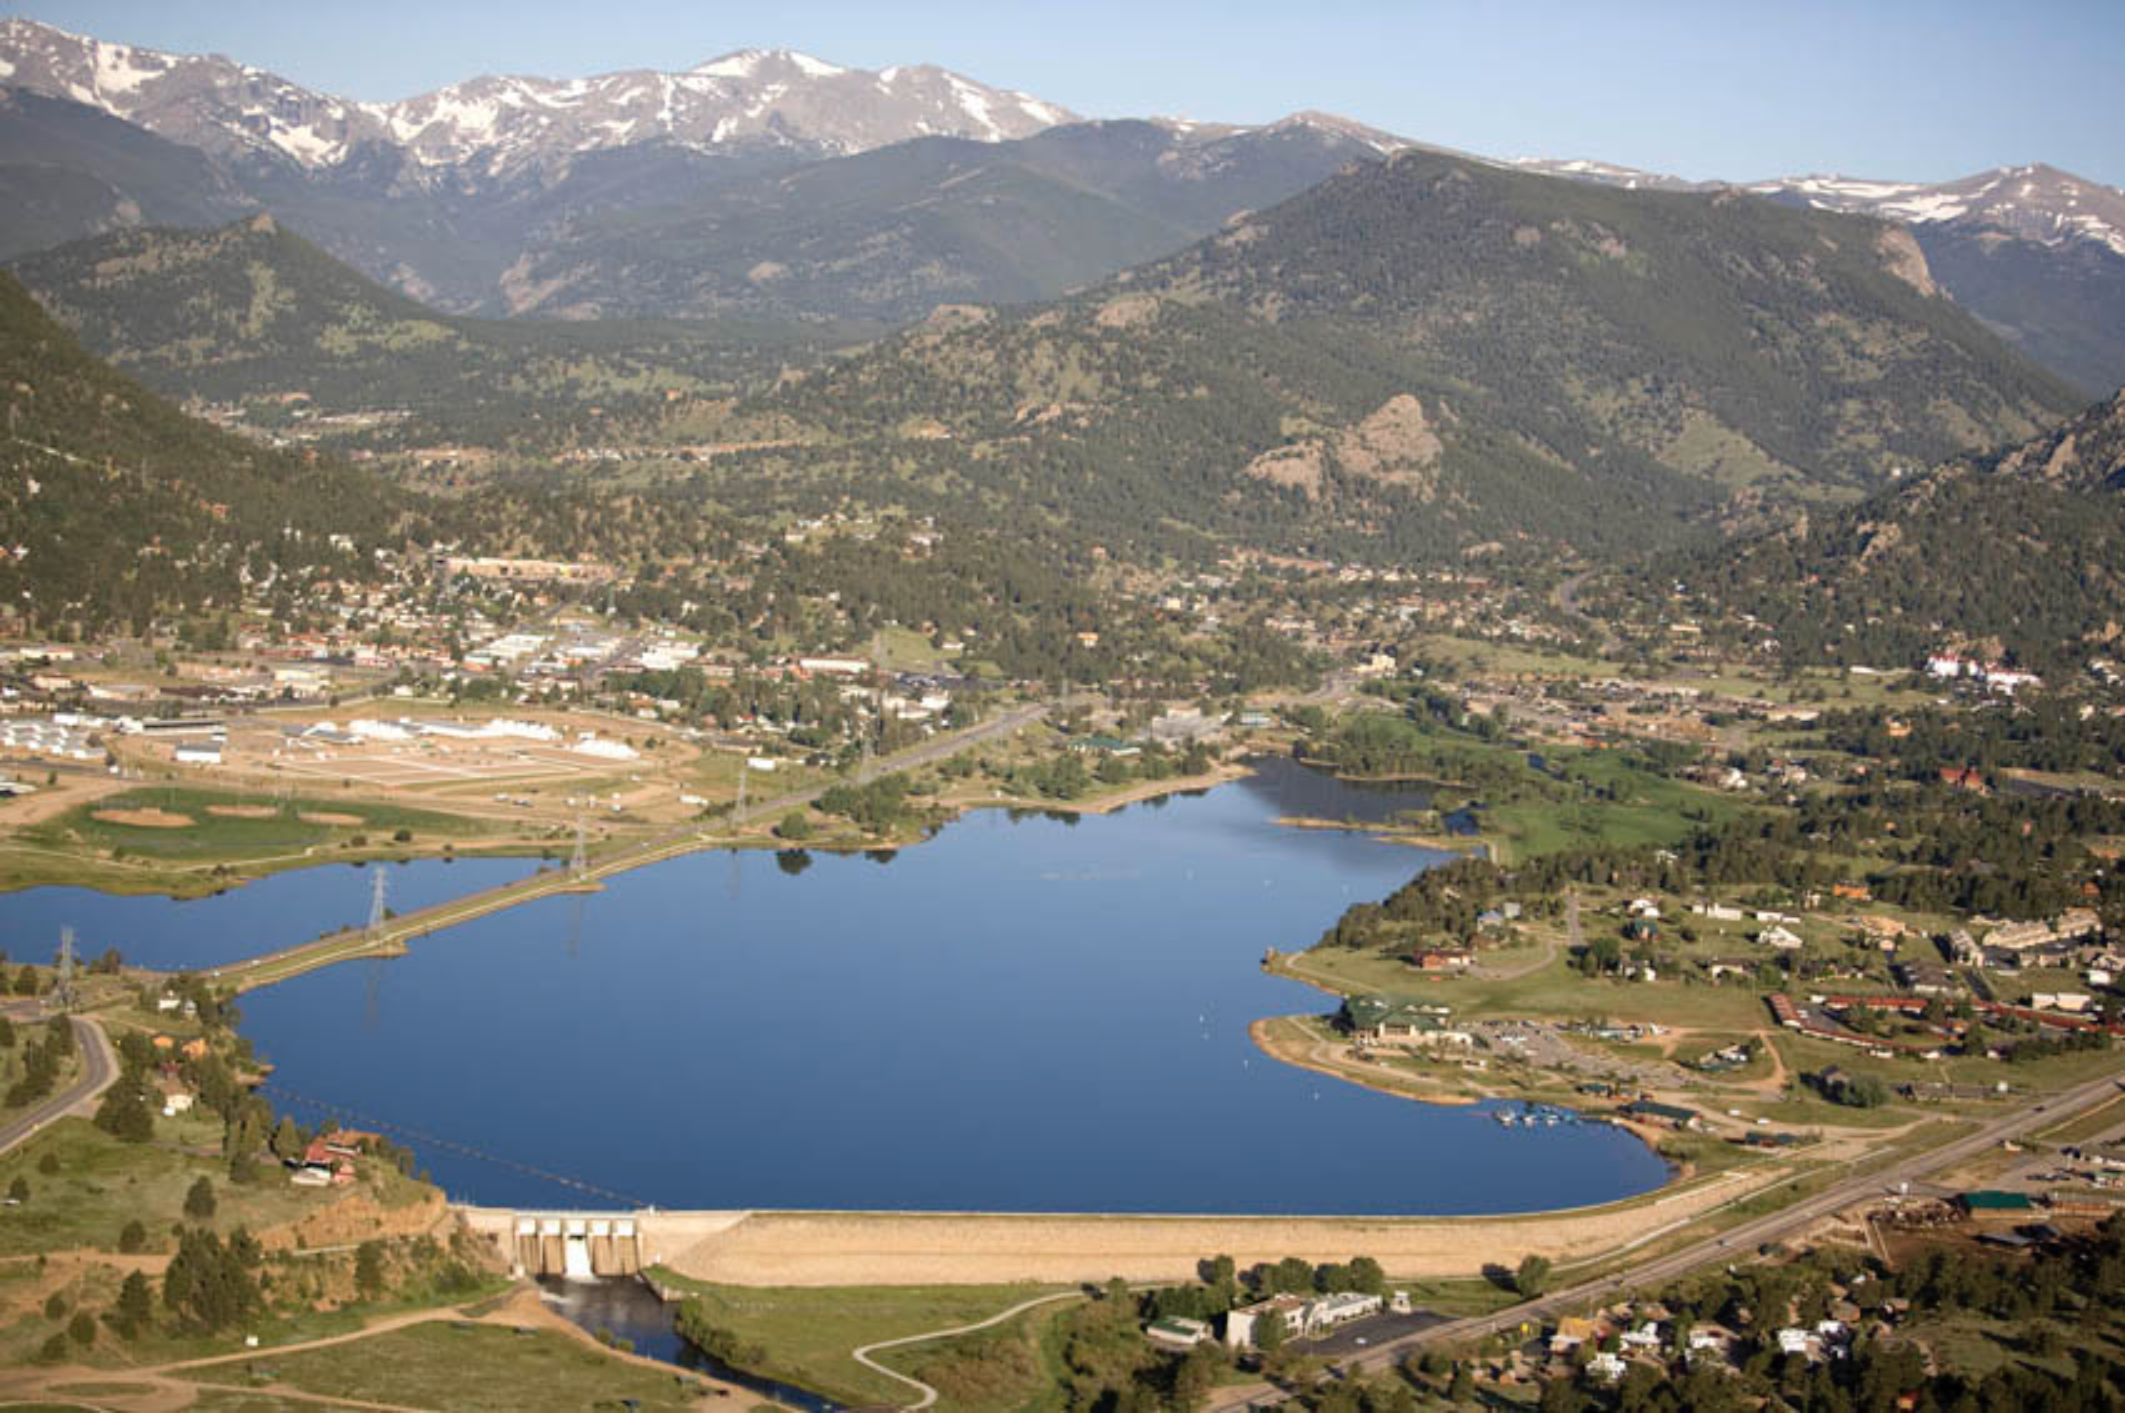
The Northern Water Board of Directors allocated 23,000 acre-feet of Regional Pool Program (RPP) water during its May 8, 2025, Board meeting. RPP water is available for lease by eligible Northern Colorado water users, with sealed bids due 2 p.m. May 22, 2025. Bid prices per-acre-foot must be greater than or equal to $33.80, a floor price the Board selected based on the 2025 agricultural assessment rate. Late bids will not be considered.
The allocation will be available to bidders from two subpools of 11,500 acre-feet each; one that delivers water from Horsetooth Reservoir, and a second that delivers to water users south of Horsetooth Reservoir, including the Big Thompson River, St Vrain Creek and Boulder Creek.
The following forms are required to submit a bid:
- Pre-Approval Form – To confirm eligibility, interested bidders must email or mail the Pre-Approval Form to Northern Water. A new Pre-Approval Form is required each year.
- Carrier Consent Form – If the RPP water will be delivered by a carrier, such as a ditch or reservoir company, bidders and their carriers must complete the Carrier Consent Form or provide a signed agreement stating that the carrier will deliver the RPP water to the bidder. This form must also be emailed or mailed to Northern Water.
- Bid Form – Sealed bids will be accepted at Northern Water’s headquarters through a “self-serve” process. Bidders will sign in at a kiosk in the Building A lobby at Northern Water, 220 Water Ave., Berthoud, and print a bid label for their sealed bid envelope. The label will identify the bidder name, date and time stamp, and bid number. Bidders are then asked to secure the label to the bid envelope and place it in the drop box. Sealed bids may also be mailed to Northern Water, but bids must be received before the deadline.
Sealed bids are due by 2 p.m. Thursday, May 22, at Northern Water’s headquarters, 220 Water Ave., Berthoud, CO 80513. As described above, sealed bids can be mailed or hand delivered; email and fax bid forms will not be accepted. RPP leases within each subpool will be awarded based on highest bids per acre-foot. Sealed bids will be opened at 2:10 p.m. Thursday, May 22, in the Grand Lake Conference Room of Building A at Northern Water.
Questions regarding the Regional Pool Program and bid submittal can be emailed to regionalpool@northernwater.org or by calling Sarah Smith at 970-622-2295 or Water Scheduling at 970-292-2500.
Click the link to read the article on the AZCentral.com website (Debra Utacia Krol). Here’s an excerpt:
May 9, 2024
Key Points
- A federal judge temporarily blocked a procedural move that would allow a land exchange for a copper mine at Oak Flat, east of Phoenix.
- The ruling was issued two days after lawyers for both sides argued the case in a Phoenix courtroom and will stand until the U.S. Supreme Court acts.
Judge Steven P. Logan issued the order May 9, two days after hearing the case in U.S. District Court in Phoenix. He ruled that the government cannot publish a final environmental review of a land swap between Resolution and the U.S. Forest Service, which manages a campground at the site 60 miles east of Phoenix. The order would remain in place until the day after the U.S. Supreme Court declines to take the case or, if it accepts it, rules against grassroots group Apache Stronghold, which filed a lawsuit to stop the exchange in 2021 and sought the temporary delay in the Phoenix court…
In his decision, Logan wrote that it was “abundantly clear that the balance of equities ‘tips sharply’ in Plaintiff’s favor, and that even in the short term, they have established a likelihood of irreparable harm should the transfer proceed.” If the government reissued the environmental impact statement, the land swap could occur within 60 days.
Click the link to read the article on The Land Desk website (Jonathan P. Thompson):
May 2, 2025
🥵 Aridification Watch 🐫
A new study finds that airborne dust deposited on snow in the Upper Colorado River Basin speeds up spring snowmelt. Regular readers of the Land Desk won’t be surprised by this conclusion, as there are regular mentions here regarding the effects of dust-on-snow in the San Juan Mountains. This study, however, is the first to quantify the effects across the entire Colorado River Basin.
When dust, lifted up from the lowlands by spring winds, falls on mountain snow, it decreases the snow’s albedo — the measure of a surface’s reflectivity — causing the snow to melt faster. That adds another variable into the water forecasting mix, since about 85% of the Colorado’s flow comes from snowmelt.
Dust events have been occurring for thousands of years on the Colorado Plateau and in the San Juan Mountains, but picked up significantly following the white settler-colonist influx of the mid-1800s, and peaking in the first few decades of the twentieth century, when volumes of dust were five times higher than they were prior to colonization.
The new study, “Dust on Snow Radiative Forcing and Contribution to Melt in the Colorado River Basin,” by Patrick Naple, S. McKenzie Skiles, et al, used daily remotely sensed images (MODIS) from 2001 to 2023 to observe dust-on-snow impacts. Findings include:
- The lowest dust-on-snow impacts occurred in the northern Uinta in Utah and the Wind River Range in Wyoming, while higher and more persistent effects were seen in the central and southern Rockies.
- Dust impacts tend to be largest in the lower alpine elevations (8,000 – 10,000 feet).
- The researchers observed greater dust effects in the first part of the observation period (2001 to 2014) and lesser after that, “producing a slight but statistically significant decreasing trend over the record.” And the patterns don’t necessarily align with drought intensity, “indicating that there is not a straightforward relationship between aridity and dust.”
- The reason for the decreasing trend aren’t clear, but researchers hypothesize that it relates to a combination of increasing surface roughness (vegetation) and decreasing wind speeds related to climate variability.
The good news for the San Juans is that dust events have been relatively mild this spring, according to the Center for Snow and Avalanche Studies’ April 29 report, which has helped keep the meagre snowpack around a while longer. At least for now: A storm is forecast to move into the San Juans this weekend and early next week, likely bringing both dust and snow to the high country, which could throw off some of our Predict the Peak guesses, for sure.
***
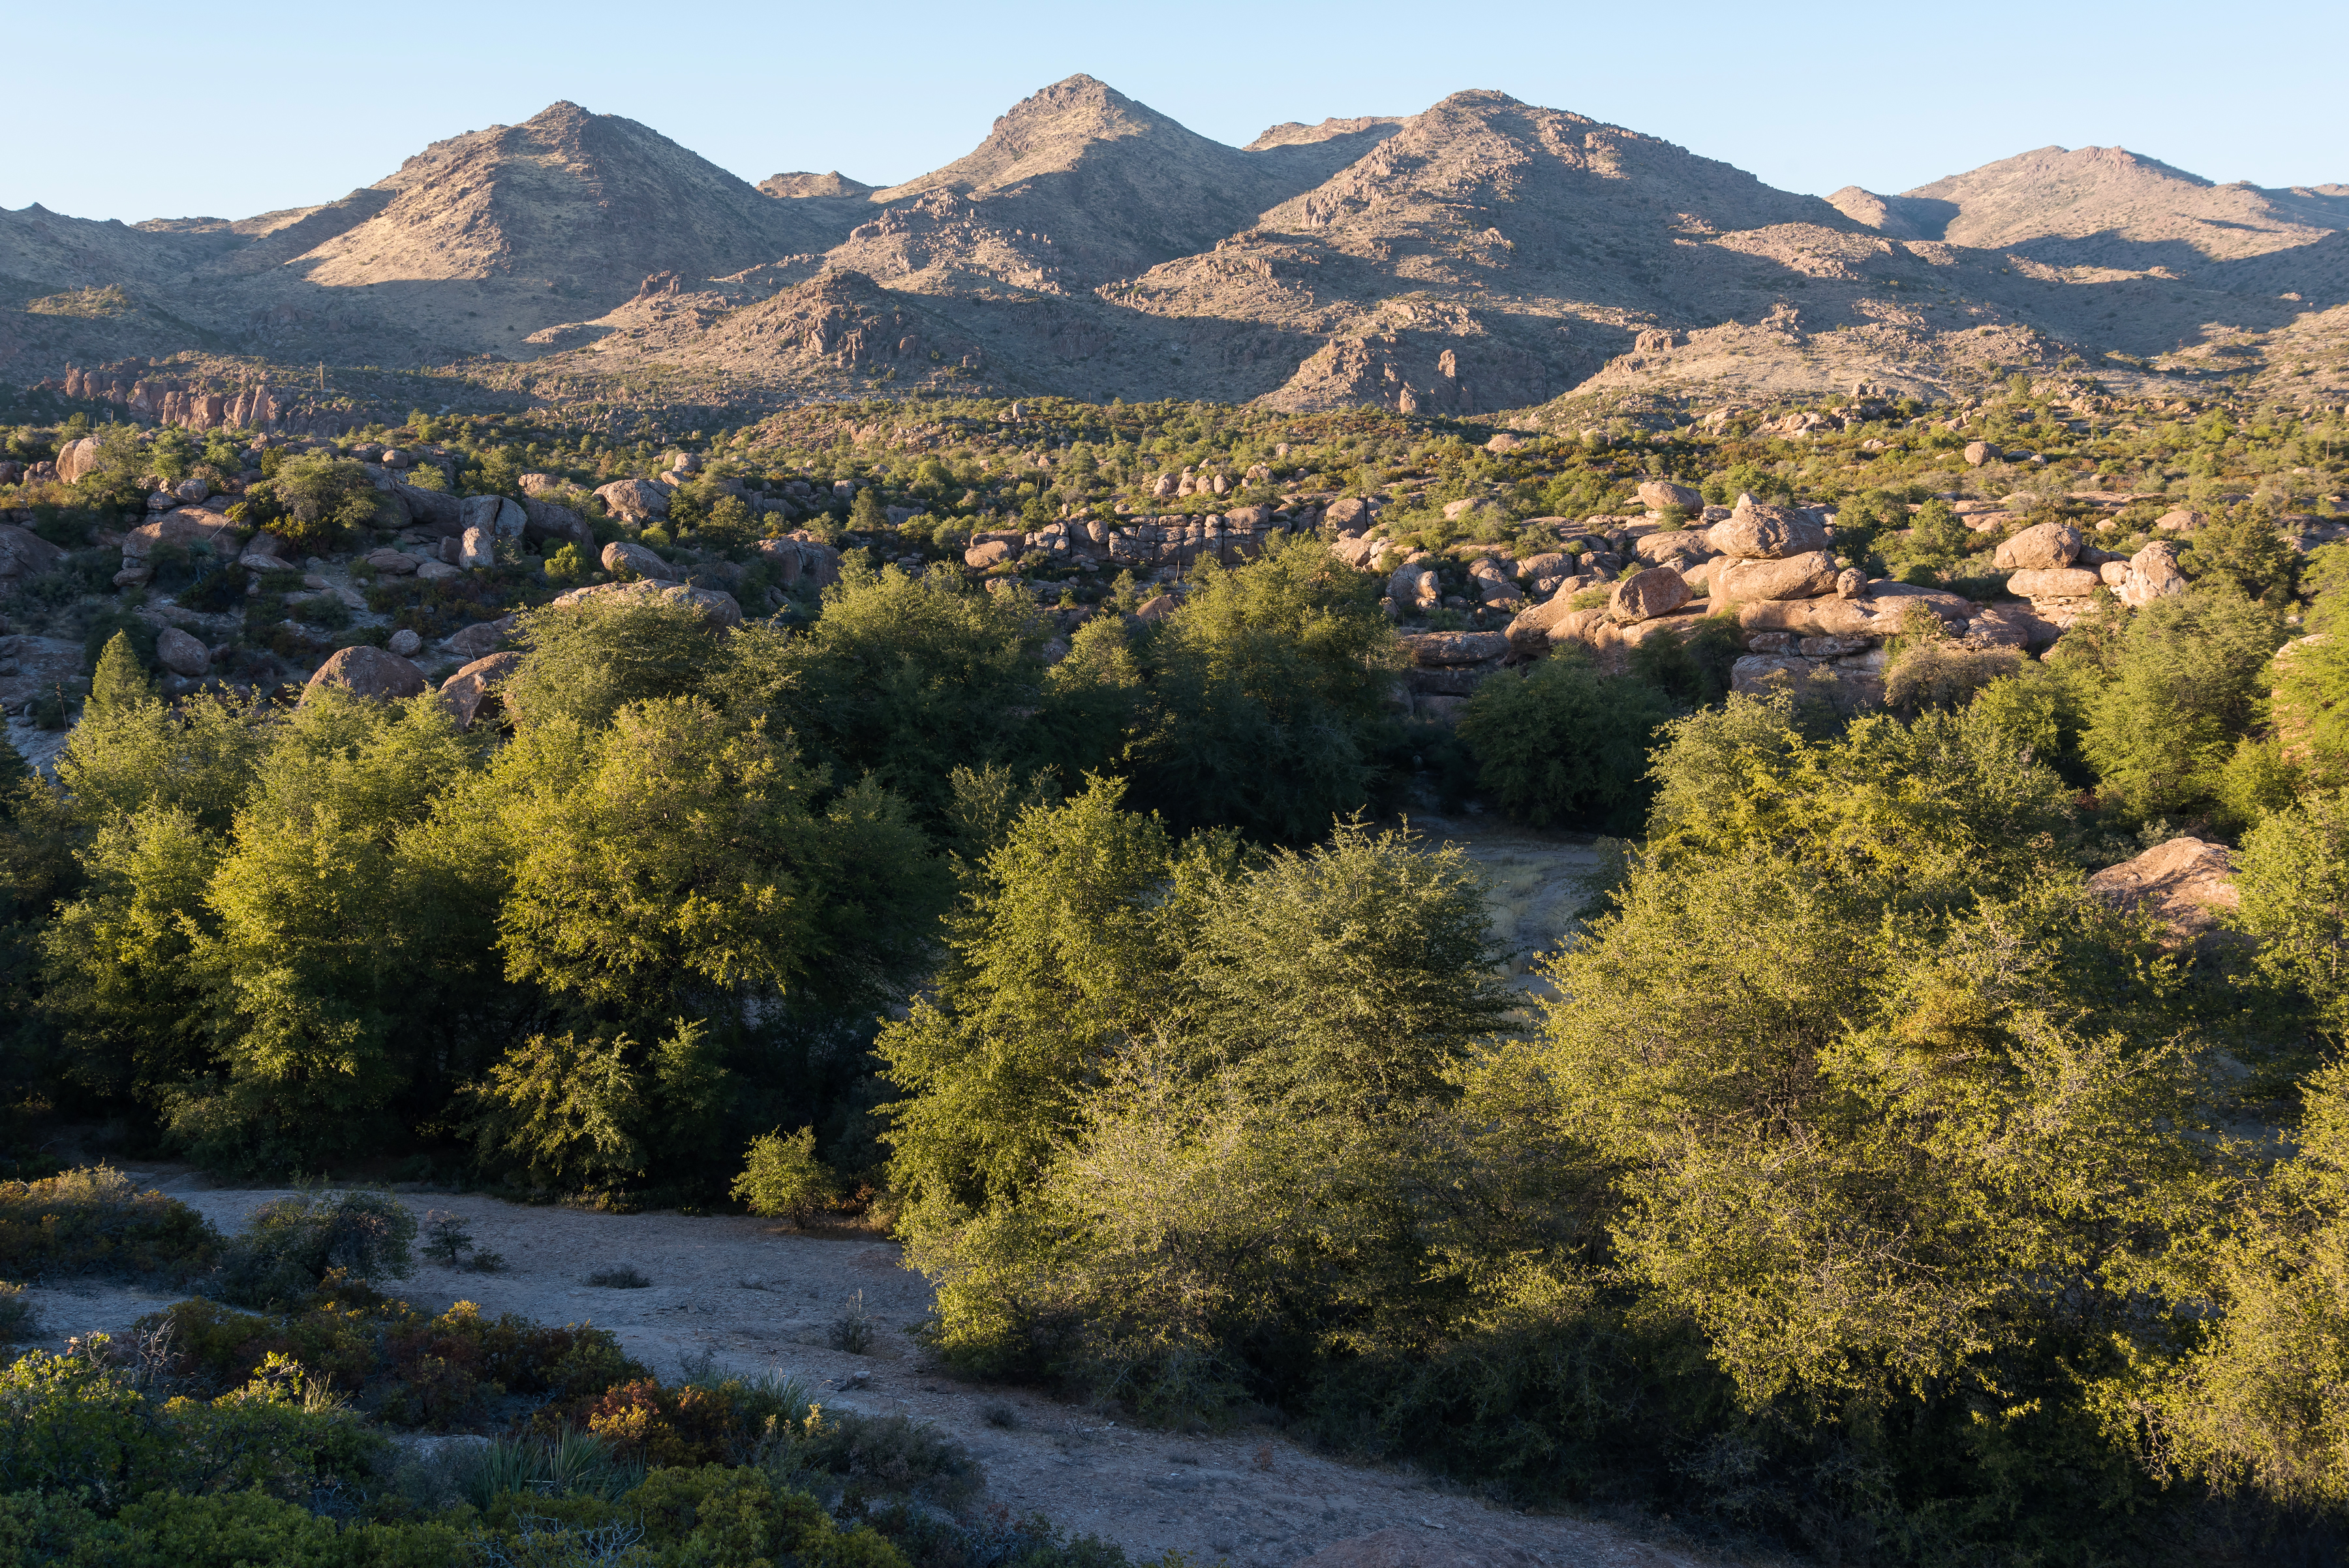
Fire season has arrived in the Southwest. It feels early, but then, who the hell knows anymore? Maybe last year’s fire season is simply continuing on. The Stronghold Fire has scorched a little over 2,000 acres in the east edge of the Dragoon Mountains in southern Arizona, forcing evacuations in the rural sprawl. As of May 1, it was 62% contained and fire activity had ebbed. And the Otero Fire burned through 494 acres of the Rio Grande Bosque adjacent to Socorro, New Mexico.
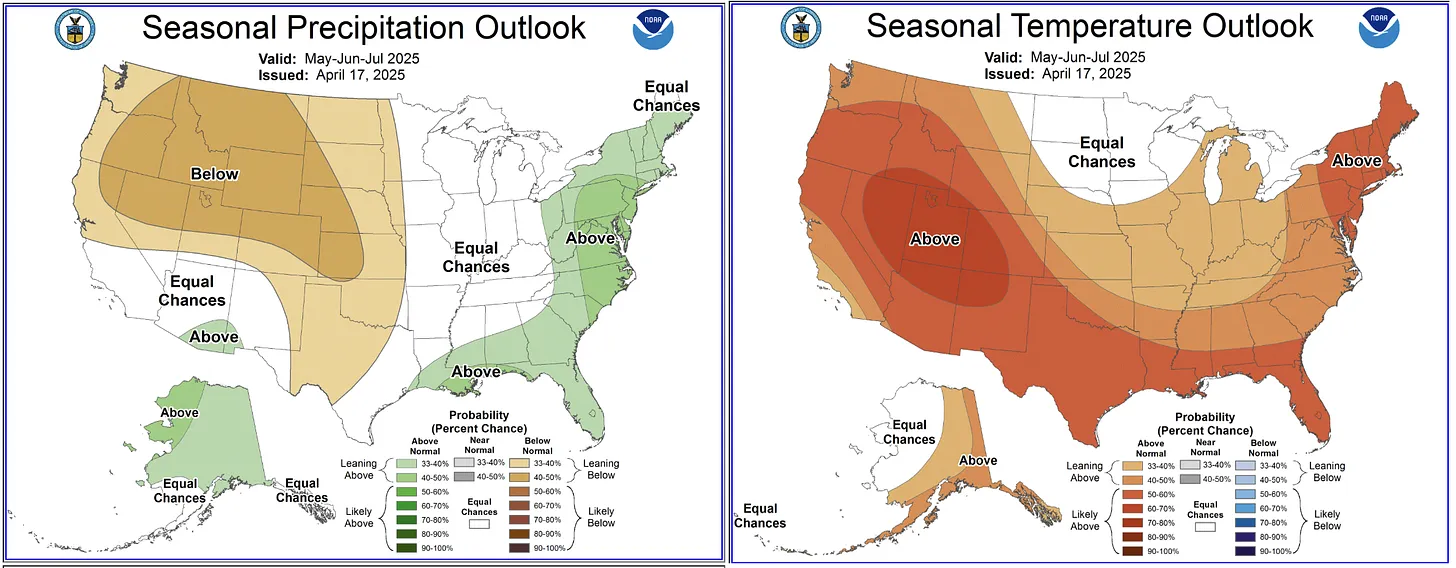
The outlook is for a hot, dry, maybe smoky summer for a good swath of the West:
🏠 Random Real Estate Room 🤑
I stumbled upon an unexpected headline in the Las Vegas Review-Journal today: “Inventory flooding Las Vegas Valley’s home market with no buyers in sight: Zillow.” Say what? For I don’t know how long, we’ve been hearing that Las Vegas was suffering a severe housing shortage — i.e. demand was far outstripping supply — and that the only solution was to sacrifice surrounding public lands to housing developers.
Yet now Zillow is saying there are too many houses for sale? And what’s also interesting is that home prices continue to rise alongside inventory. That’s right: There are more homes available for sale, and yet the median sales price continues to increase, showing that the laws of supply and demand don’t always apply to housing (and showing that the push to bulldoze federal land for affordable housing is a sham).
I checked out Zillow for myself and found about 1,600 homes listed for less than $300,000 for sale in the greater Las Vegas area. I decided to look around the region a bit, too, and it actually seems like there are more sub-$300k homes/condos available now than during my previous scans over the past four years. Oh, and I found this tiny home in the sprawling metropolis of Ticaboo, Utah. A little overpriced, but the location? Heck yeah!

🤯 Trump Ticker 😱
Sigh. That guy is still president, and continues to do his darnedest to wreck everything that makes America great. Wes Siler’s Newsletter is reporting that the National Park Service plans to fire another 1,500 employees in coming days, bringing total Park Service staffing losses through resignations, firings, and layoffs to 5,000 under Trump. Meanwhile, year-to-date visitation at Zion National Park is at near-record levels. The combination of more visitors and fewer staff could get messy.
And all Interior Department employees (which includes the Park Service, BLM, and so forth), have been ordered to submit their resumes — i.e. reapply for their existing jobs — in preparation for significant job cuts and an expected complete overhaul of the department and its agencies.
Firing thousands of people from what seemed like secure jobs will not be good for the economy, which is already struggling mightily due to Trump’s policies. And on that note, if you’re interested in tariffs and how they might affect things, I’d urge you to read this smart take from Aaron Smith at his Ag Data News:

📈 Data Dump 📊
WildEarth Guardians just released their first quarter “Oil & Gas Waste Watch” report tallying up industry and regulatory failures in New Mexico. Findings include:
- 307/330 The number of oil and gas facility incidents/spills reported during the first three months of the year in New Mexico.
- 78,858 barrels Volume of liquid, including 22,927 barrels of wastewater in addition to crude oil, condensates, and other materials, spilled in those incidents. Some of the material was recovered.
- 118 Number of spills involving crude oil or condensates.
- 292/36 Number of spills in the Permian Basin/San Juan Basin, respectively.
📖 Reading Room 🧐
Shaun Griswold has a great essay about the Cybertruck in the latest High Country News and on the website. Here’s a little outtake, but do go read the whole thing. You won’t regret it.

📸 Parting Shot 🎞️
… a little reminder that I was knocking on Cybertrucks before it was cool!

Click the link to read the article on the Pagosa Springs Sun website (Randi Pierce). Here’s an excerpt:
May 8, 2025
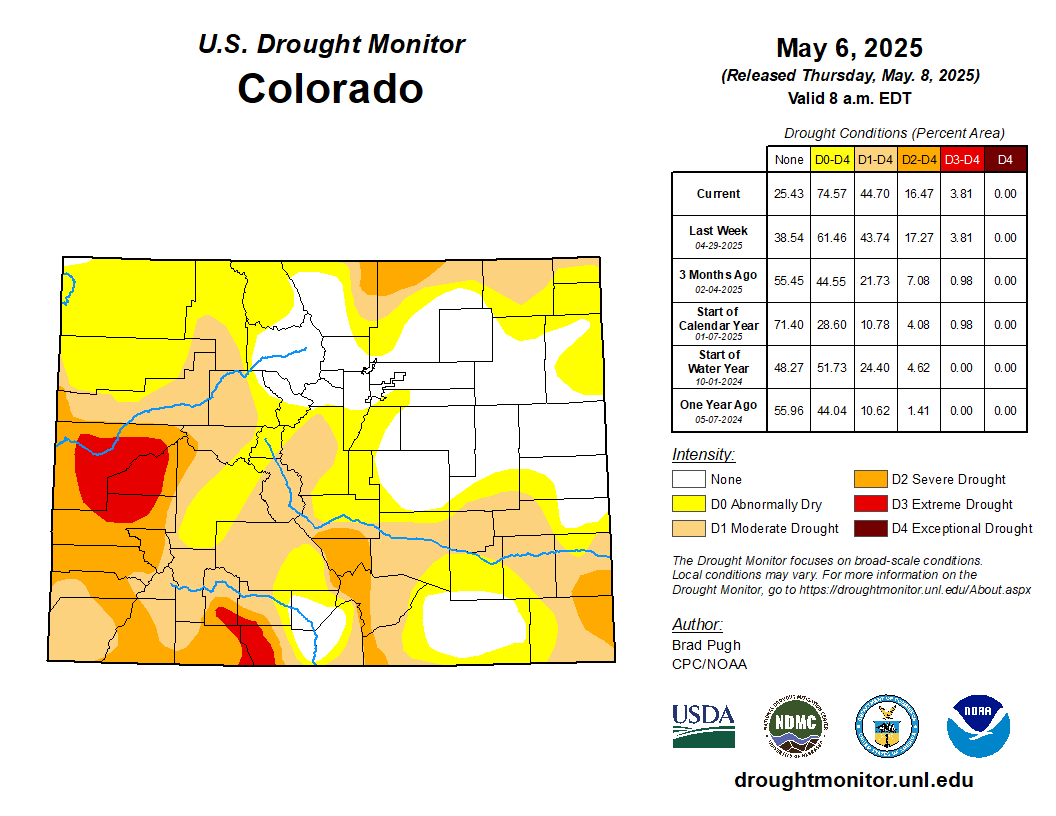
The Pagosa Area Water and Sanitation District (PAWSD) customers are now under voluntary drought restrictions, signaling developing drought conditions in the area. PAWSD Manager Justin Ramsey announced the voluntary restrictions via press release on Monday evening, May 5. The press release explains that the PAWSD Board of Directors approved the 2018 Drought Management Plan on May 17, 2018, with that plan setting trigger points for voluntary drought procedures and four mandatory drought restriction stages from low through severe.