Why is it so warm so early in the season?

By Robert Marcos

A serene sunset over a river, with golden rays shining through the clouds and reflecting on the water, surrounded by lush greenery.
The Colorado River passing Grand Junction, Colorado. Photo by Robert Marcos.

The summer-like heat in the American West is being caused by a combination of persistent high‑pressure systems, long‑term warming from climate change, and an ever-worsening drought.1

The main condition behind the current weather is the development of strong, stagnant high‑pressure ridges, often called “heat domes,” over the western United States. In these patterns, air sinks over the region, compresses, and warms (adiabatic warming), while clear skies allow intense solar heating of the surface. Because the high pressure suppresses cloud formation and storm systems, the hot air remains parked in place for days or weeks, letting temperatures climb far above normal.2

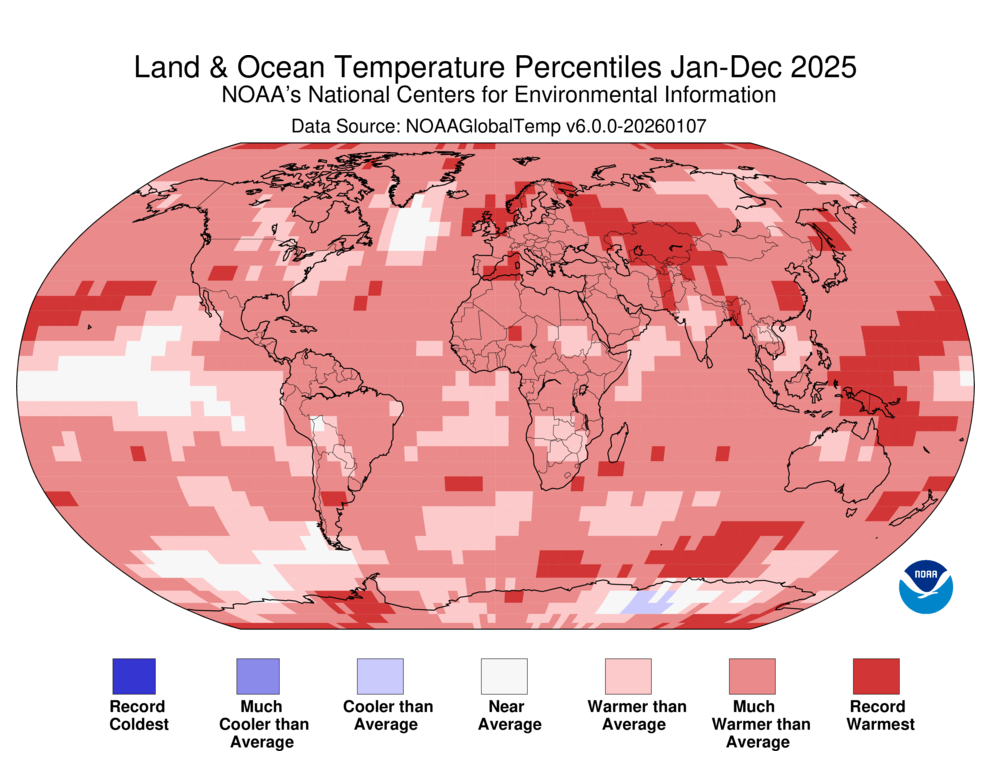
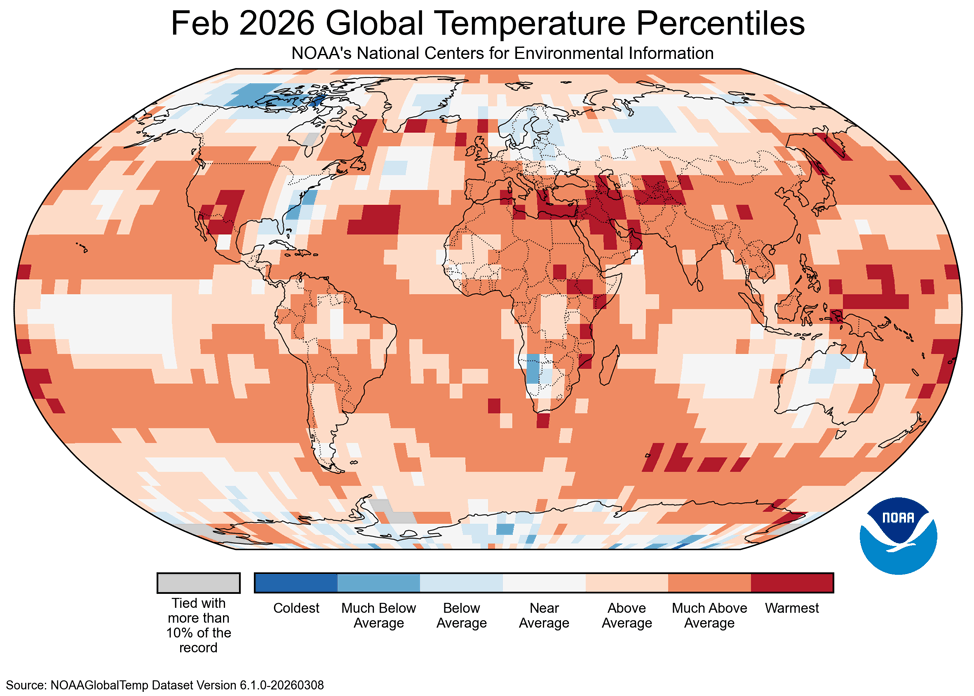
These weather patterns are occurring on top of a background of human‑driven climate warming, which raises the baseline temperature so that heat waves start from a hotter average and break records more easily. Studies of recent western and Pacific Northwest heat waves show that such extremes would have been virtually impossible, or far less intense, without anthropogenic greenhouse gas emissions. Warmer air also increases “evaporative demand,” meaning the atmosphere pulls more moisture from soils, vegetation, and water bodies, further drying the landscape.3

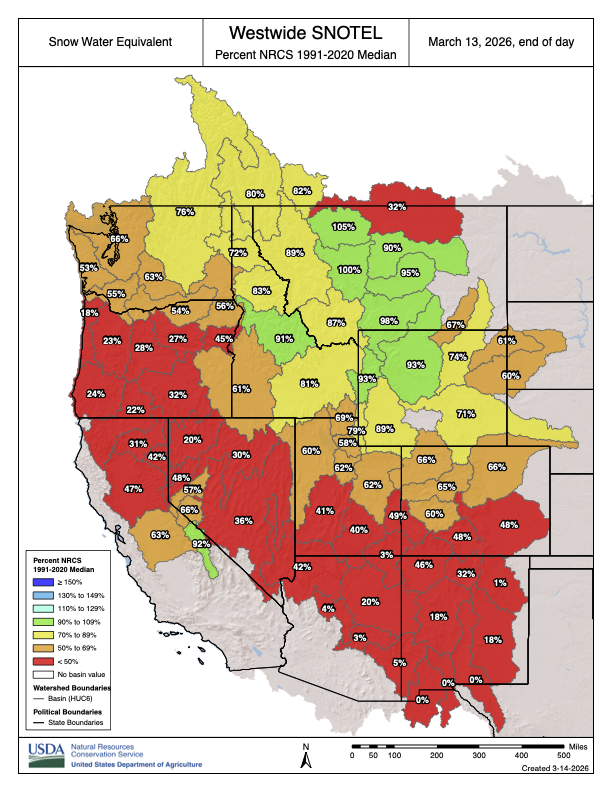
At the same time, much of the West has been in a long‑running drought or “megadrought,” with declining rain and snowpack, especially in the Southwest and Colorado River basin. Low snowpack and early melt remove a natural cooling reservoir, so land surfaces heat up faster and earlier in the warm season. With drier soils and sparse vegetation, more of the sun’s energy goes directly into raising air temperature rather than evaporating water, amplifying surface heat and extending fire season.4

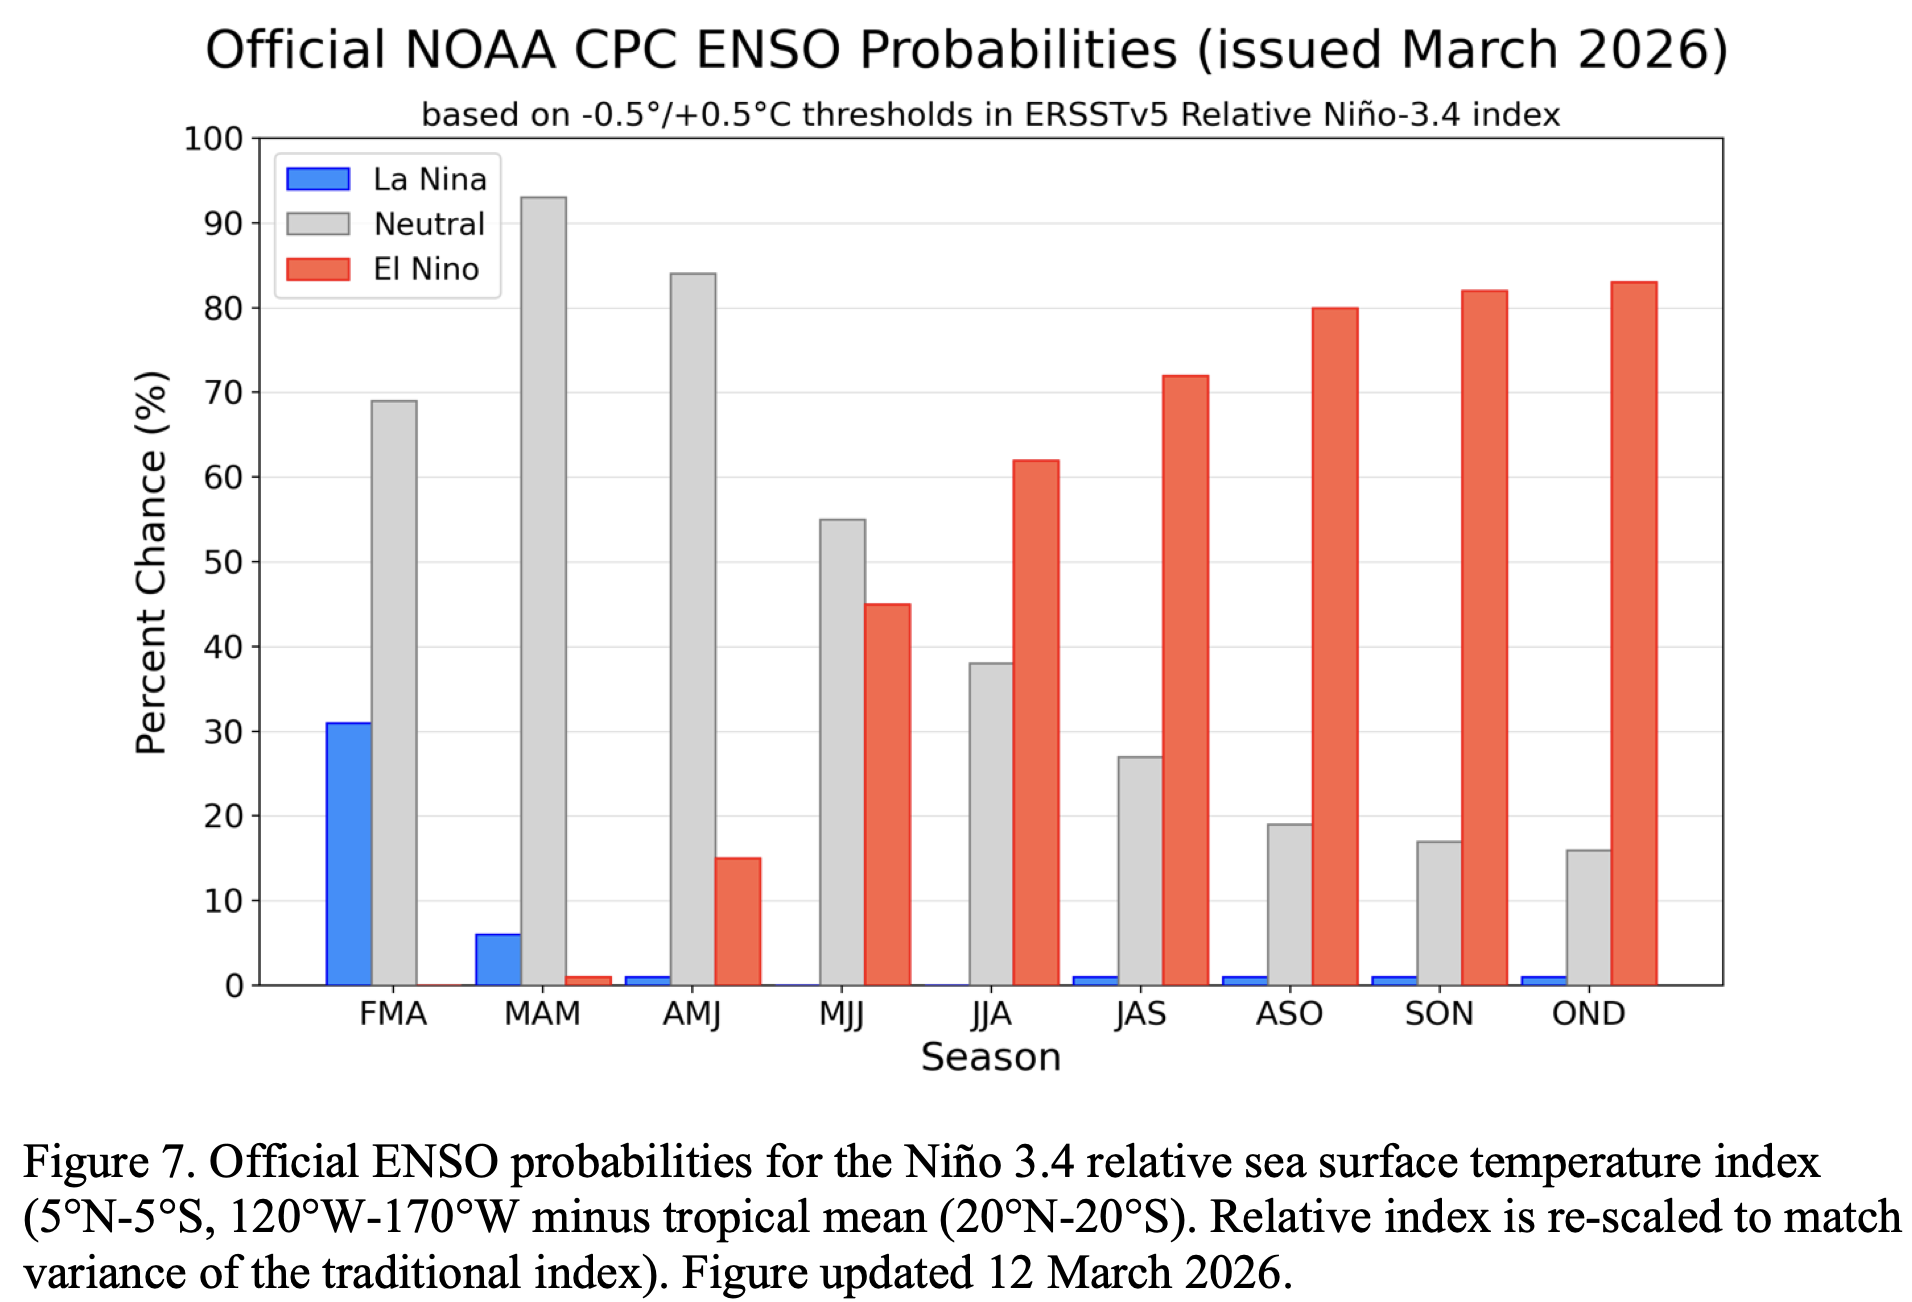
Finally, ocean–atmosphere patterns over the Pacific, such as persistent ridging and a positive phase of broader circulation patterns, help steer and reinforce these high‑pressure systems over the West in summer. Together, these intertwined conditions—blocking high pressure, climate‑driven warming, deepening drought, and altered atmospheric circulation—have produced the unusually intense and frequent summertime heat now characterizing the American West.5

March 2026 Water Supply Briefing — Colorado Basin River Forecast Center #ColoradoRiver #COriver #aridification

Click the link to read the article on the NOAA website:

Happy Pi Day!

Mrs. Gulch’s cherry pie creation for Coyote Gulch’s birth anniversary March 2020. She also grew the cherries.

February 2026 was #Earth’s fifth-warmest February on record — Jeff Masters (YaleClimateConnections.org)

Land and Ocean Temperature Percentiles for January–December 2025 (°C). Red indicates warmer than average and blue indicates colder than average.

Click the link to read the article on the Yale Climate Connections website (Jeff Masters):

March 11, 2026

February 2026 was the world’s fifth-warmest February in analyses of global weather data going back to 1850, NOAA’s National Centers for Environmental Information, or NCEI, reported March 11. The European Copernicus Climate Change Service also rated February 2026 as the fifth-warmest February on record, while NASA had it tied for fourth-warmest. The global-average temperature for December 2025 to February 2026 was the fifth-highest on record.

Figure 1. Departure of temperature from average for February 2026, the world’s fifth-warmest February since record-keeping began in 1850. Record-high February temperatures covered 5.1% of the Earth’s surface. No land or ocean areas observed record-cold February temperatures. (Image credit: NOAA/NCEI)

Global land areas had their sixth-warmest February on record in 2026, while global oceans had their second-warmest February, falling just 0.16 degrees Celsius (0.29°F) shy of the record set in 2024, NOAA said. Africa had its second-warmest February, and South America and Asia experienced their seventh- and eighth-warmest February, respectively. While North America, Europe, Oceania, the Arctic, and the Antarctic all experienced above-average February temperatures, none ranked among the top 10.

Snow cover in February was well below average over the Western U.S. and much of Asia and Europe. Overall, Northern Hemisphere snow cover during February 2026 was the third-lowest since records began in 1967.

Remember all that snow that fell from the Carolinas to Boston? I bet you assume this has been quite a snow season overall. Well, for the Lower 48, this is the least snowy season (through February) for any year since at least 1940-41 when looking at all years through February. Thanks humans!

Climatologist49 (@climatologist49.bsky.social) 2026-03-09T01:19:05.902Z

Warm and dry in the U.S.

As detailed in our post from Tuesday, in the contiguous U.S., winter 2025-26 was the second-warmest and fifth-driest in records going back to 1895. February was the fourth-warmest and fifth-driest February on record. According to the March 5 U.S. Drought Monitor report, about 55% of the continental U.S. was in drought at the beginning of March, up from the 43% coverage at the beginning of the year. Snow-covered area across the Western United States was 38% of the average for February, ranking last in the 26-year satellite record. It was the second month in a row to reach a record low.

Folks still thawing out might be wondering: How bad a U.S. winter was it overall? Very bad – that is, if you’re concerned about long-term warming and intensified drought impacts. (2nd warmest and 5th driest on record.) @climateconnections.bsky.socialyaleclimateconnections.org/2026/03/we-j…

Bob Henson (@bhensonweather.bsky.social) 2026-03-09T22:05:42.867Z

An El Niño event looking more likely to develop this year

A weak La Niña event continues in the Eastern Pacific, NOAA reported in its February monthly discussion of the state of the El Niño/Southern Oscillation, or ENSO (the next discussion is scheduled for March 12). La Niña conditions are expected to end in the February-April 2026 period (60% chance), with ENSO-neutral conditions then persisting through August (56% chance). An increasing chance of El Niño conditions is predicted as 2026 progresses, according to the Columbia University International Research Institute for Climate and Society forecast issued February 19. Update: On March 12, in its monthly ENSO discussion, NOAA issued an El Niño Watch; they noted that if El Niño does materialize later this year, there is now a 1-in-3 chance that the event will be a strong one.

The forecast for the August-September-October peak of hurricane season called for a 61% chance of El Niño, a 34% chance of ENSO-neutral, and a 5% chance of La Niña. NOAA is giving a 35% chance of moderate or stronger El Niño conditions if an El Niño event develops. El Niño conditions tend to suppress Atlantic hurricane activity through an increase in wind shear, but La Niña conditions tend to have the opposite effect. The most recent ENSO forecast from the European model was very bullish on a significant El Niño event developing by late spring or summer and continuing through at least fall 2026.

Seeing this ENSO forecast shared a bit. Let me put my ENSO hat on for a sec to say a couple things.1. This uses a 1981-2010 climo which will boost the anomaly numbers.2. This doesn't use the Relative Oceanic Nino index (RONI), which would slash these anomaly numbers by, my guess, 0.5C1/2

Tom Di Liberto (@tdiliberto.bsky.social) 2026-03-06T16:42:12.286Z

Last month, NOAA switched to using the Relative Oceanic Niño Index, or RONI, as its standard ENSO monitoring tool. This tool uses sea surface temperatures across the tropics to adjust the Oceanic Niño Index, making it a better gauge of how ENSO is expressed in a warming climate.


Read: A new and better way to keep tabs on El Niño


Arctic sea ice: third-lowest February extent on record

Arctic sea ice extent during February 2026 was virtually tied with February 2017 as the third-lowest in the 48-year satellite record, behind only February 2025 and February 2018, according to the National Snow and Ice Data Center. Overtopping this depleted ice was an atmosphere more frigid than the recent norm, as the Arctic had its 45th warmest February since 1850 – but the coldest since 2009.

 Antarctic sea ice extent in February 2026 was near the long-term average, ranking as the 21st-lowest in the 48-year record. The Antarctic had above-average temperatures in February, ranking as the 13th-warmest since 1850. Antarctic sea ice reached its minimum extent for the year, at 2.58 million square kilometers (996,000 square miles) on February 26, 2026, ranking 16th-lowest in the 48-year satellite record.

The latest El Miño/Southern Oscillation (#ENSO) diagnostic discussion is hot off the presses from the Climate Prediction Center

Click the link to read the discussion on the Climate Prediction Center website:

March 12, 2026

ENSO Alert System Status: La Niña Advisory / El Niño Watch

Synopsis: A transition from La Niña to ENSO-neutral is expected in the next month, with ENSO-neutral favored through May-July 2026 (55% chance). In June-August 2026, El Niño is likely to emerge (62% chance) and persist through at least the end of 2026.

La Niña continued in February 2026, with below-average sea surface temperatures (SSTs) persisting in the east-central equatorial Pacific Ocean. The latest weekly Niño-3.4 index value was -0.5°C, with the westernmost (Niño-4) and easternmost (Niño-1+2) indices at -0.2°C and +0.6°C, respectively. The equatorial subsurface temperature index (average from 180 -100°W) continued to increase, reflecting the strengthening of above-average subsurface temperatures across the Pacific. Over the east-central equatorial Pacific, low-level wind anomalies were easterly, while upper-level wind anomalies were westerly. Convection was suppressed over the Date Line and convection was enhanced over Indonesia. The traditional and equatorial Southern Oscillation indices were positive. Collectively, the coupled ocean-atmosphere system remained consistent with La Niña.

The North American Multi-Model Ensemble (NMME) average, including the NCEP CFSv2, points toward ENSO-neutral through the late Northern Hemisphere Spring 2026, with a transition to El Niño thereafter. Even though model forecasts are relatively less accurate this time of year, the increasing odds of El Niño are supported by the large amount of heat in the subsurface ocean and the expected weakening of the low-level trade winds. If El Niño forms, the potential strength remains very uncertain, with a 1-in-3 chance that it would be “strong” during October-December 2026 (Niño-3.4 ≥ +1.5°C). In summary, a transition from La Niña to ENSO-neutral is expected in the next month, with ENSO-neutral favored through May-July 2026 (55% chance). In June-August 2026, El Niño is likely to emerge (62% chance) and persist through at least the end of 2026.

#Colorado ski towns see ‘strong’ decline in spring break bookings due to low-snowfall season, market study shows: Steamboat reservations for March down 10%; Western Slope towns promote off-mountain spring break activities — Steamboat Pilot & Today #snowpack

The Yampa River Core Trail runs right through downtown Steamboat. Photo credit City of Steamboat Springs.

Click the link to read the article on the Steamboat Pilot & Today website (Andrea Teres-Martinez). Here’s an excerpt:

March 12, 2026

Fewer families are booking spring break vacations to Colorado resort destinations, as weaker-than-normal ski conditions cause drops in reservations made later in the season. Amid the potential for a lower-revenue spring break tourism season, some Western Slope ski towns are focusing on promoting off-mountain activities for families. For most resort towns across Colorado’s western mountains, spring break is a strong period for tourism. Travelers from both in and out of state book trips to the mountains in hopes of hitting the slopes before the end of ski season, and businesses organize seasonal events to draw in visitors. This year’s near historically dry conditions, however, have meant fewer winter bookings to Colorado’s resort destinations — and spring break bookings are seeing the impacts…Colorado’s spring break season, though still bringing in bookings, will likely end with lower revenue for mountain destinations compared to previous years, Foley said. Soard added that the considerable decrease in bookings will likely also lead to impacts for the town’s sales tax collections.

Westwide SNOTEL basin-filled map March 13, 2026.