In the past two to three years there’ve been important advances both in enteric methane‑reducing feed additives and in manure‑focused technologies, and several options have progressed from the laboratory to commercial use.
What’s new?
3‑NOP (Bovaer): Now the most advanced commercial additive, approved in 60+ countries and marketed in the U.S. by Elanco, with typical methane reductions of about 30% in dairy and beef cattle at very low doses. It works by inhibiting a key enzyme in the rumen’s methanogenesis pathway without harming animal performance1.
Red seaweed and bromoform products: Asparagopsis‑based seaweed supplements can cut enteric methane by over 80–90% in controlled studies, and work is shifting toward purified bromoform or standardized products rather than raw seaweed to control variability and safety. Several pilot trials are underway in Australia, the EU, and the U.S., but broad regulatory approval is still pending2.
Other additives under study: Research programs (e.g., Teagasc, CSU AgNext) are testing oils, grain‑industry by‑products, probiotics, and other inhibitors; some trials in housed cattle report up to 30% methane reduction with no productivity loss, though pasture‑based delivery remains a major challenge3.
Adoption status: A recent technical review notes that methane‑inhibiting feed additives are now the fastest‑emerging enteric solution, with strong private investment but limited on‑farm uptake so far due to cost, regulation, and farmer skepticism4.
It was early June, and we sat out in the shade in our backyard in Silverton, Colorado, wearing short-sleeves and shorts and drinking cold beverages under a cloudless blue sky. That, in itself, made the day memorable. Blizzards are as likely on Memorial Day as barbecues in this mountain town, elevation 9,318 feet, and sweater-free days usually don’t come along until July.
The winter of 2001-2002 had been unusually mild and a warm April and May had melted what little snow had fallen; the Animas River’s spring runoff had peaked at historically low levels a couple weeks earlier. I, for one, wasn’t too worried. By then it was understood that the climate was warming, and that it could wreak havoc on the planet, but the idea of rising sea levels and devastating heat waves felt pretty abstract in the Colorado high country. Besides, as an amateur historian, I had read accounts of similarly dry and warm winters from the San Juan Mountains’ past: In 1879, the snow was all melted from the highest peaks by May (giving way to the Lime Creek Burn that summer); sleighing was impossible” on Silverton’s streets during the 1890-91 winter; and the newspaper ran a photo of a water wagon suppressing dust on Greene Street on New Year’s Day, 1918, during “one of the most delightful winters ever experienced.”
Vallecito Reservoir during Missionary Ridge Fire via George Weber Environmental.
This, it seemed, was just another one of those occasional weird years, so we figured we might as well enjoy it. Then someone noticed what looked like puffy cumulonimbus cloud rising up in the gap formed by the Animas River gorge. It wasn’t a cloud at all, but a billowing tower of smoke from the Missionary Ridge Fire, ignited that afternoon on a slope about 35 miles south of where we sat. Over the coming weeks, the blaze would eat through 73,000 acres of parched scrub oak and aspen and conifer forest, along with 83 structures. It eclipsed the 26,000-acre Lime Creek Burn as the state’s largest wildfire on record, but lost the title to the Hayman Fire (138,114 acres) that was burning at the same time across the state.
Aerial view from the south of Hayman Fire June 30, 2002. Road traversing from left to right is U.S. Highway 24. Town of Manitou Springs is in lower part of photo, Colorado Springs to the right. Garden of the Gods park defined by three upright orange rock formations in right center just below smoke line. Creative Commons Attribution-Share Alike 4.0 International license.
And it was then that we realized this was no normal abnormality, and that 2002 would go down as the Water Year of our Discontent: dry, smoky, and catastrophic for irrigators and river rafters alike.
This year is shaping up to be even more dire. Indeed, with temperatures in Silverton climbing into the 60s this week, I’m sure a few people have shed some layers and soaked up the sun — in March. Now, however, we know that this is no anomaly, but part of a long-term trend toward aridification, most likely caused or at least exacerbated by climate change. Call it the “new normal” if you’d like, but just remember the words of Bruce Cockburn: “The trouble with normal is it always gets worse.”
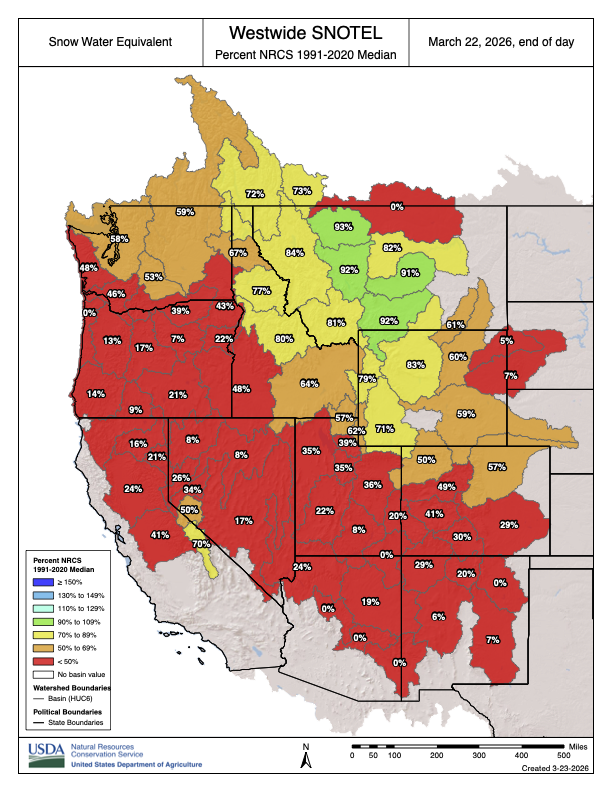
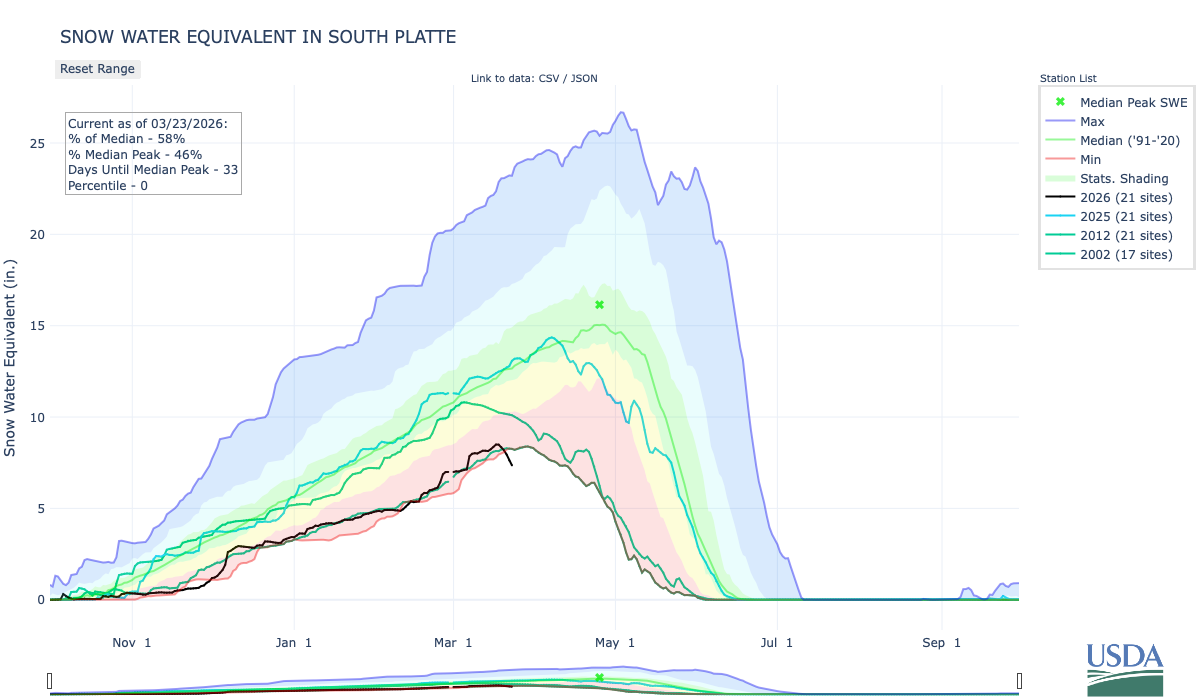
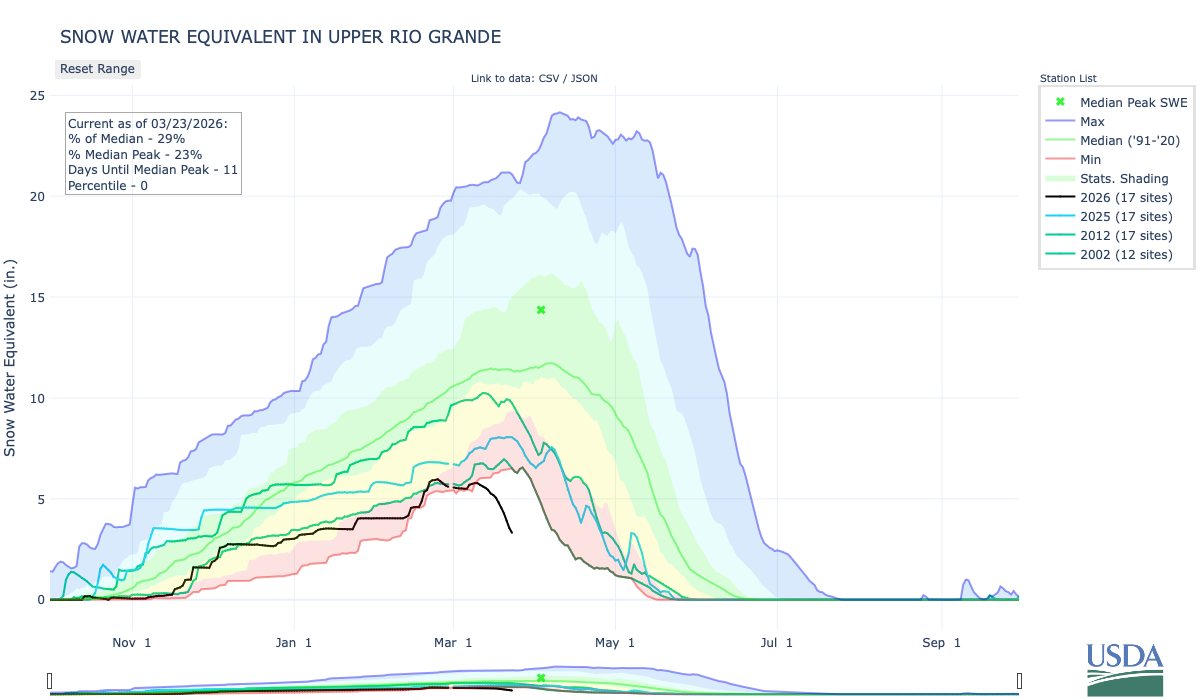
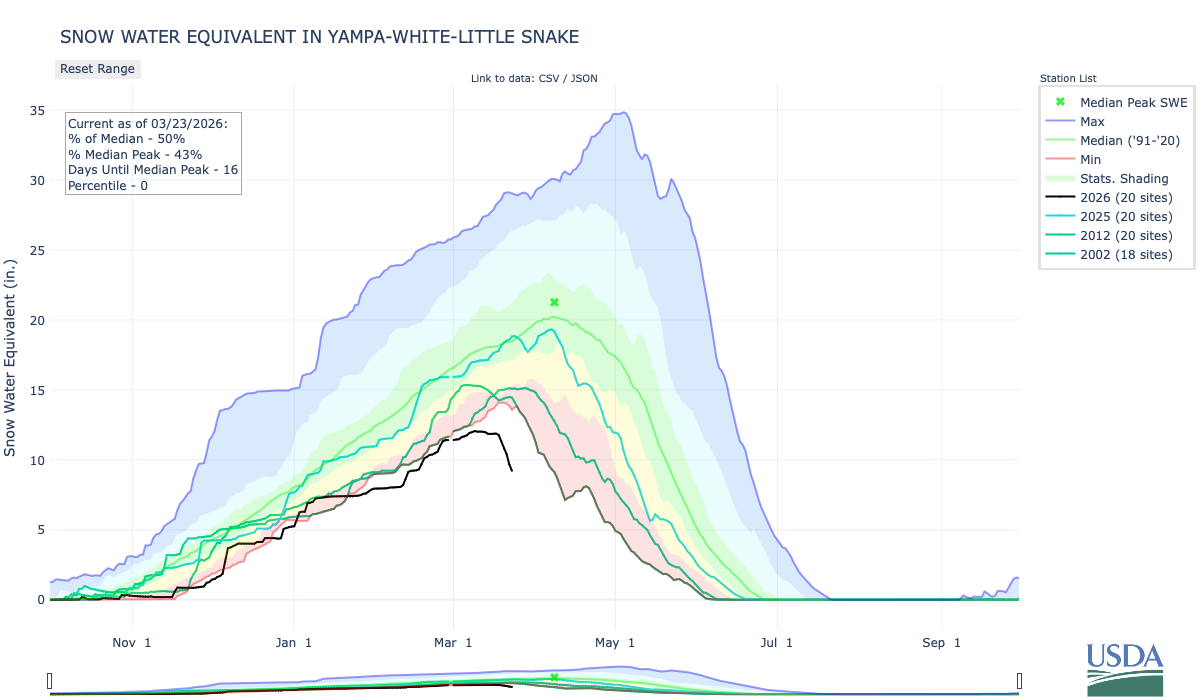
I wanted to wait until April to give this assessment, on the off chance that the weather might shift radically in the last days of March in a way that might give us all some hope. While anything’s still possible, I’ve seen enough to bet that, unfortunately, we may already have seen peak snowpack in many places, making this the driest water year on record by far. And besides, I wanted to get the spring runoff “predict the peak” streamflow contest going before, well, the streamflows actually peaked.
A crappy snow year does not necessarily lead to a nasty fire season, since so many other factors come into play. The same can sort of be true about the peak of the spring runoff. That’s more about timing: A fast melt after a dry winter can result in a bigger, albeit short-lived, peak, than a slow melt of a relatively abundant snowpack. The river’s average flows across the entire water year are much more closely tied to snowpack, but those can also be affected by a big monsoon season.
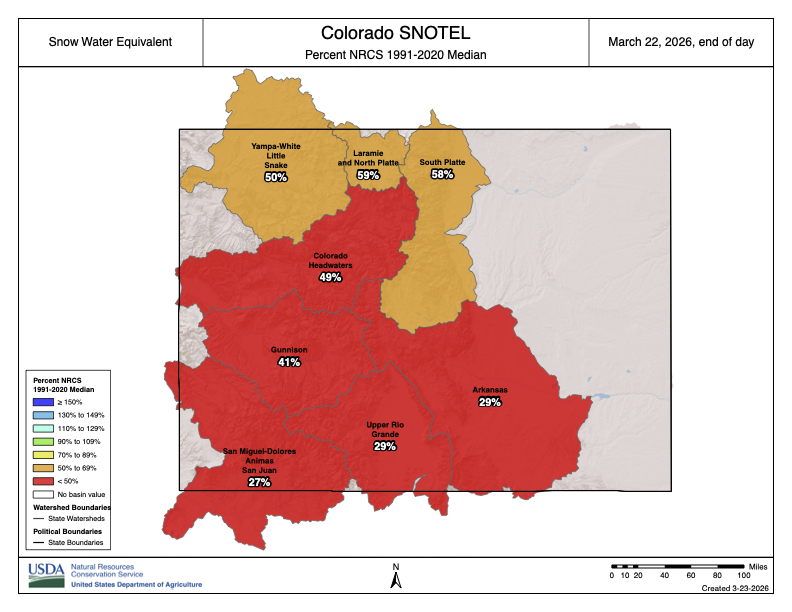
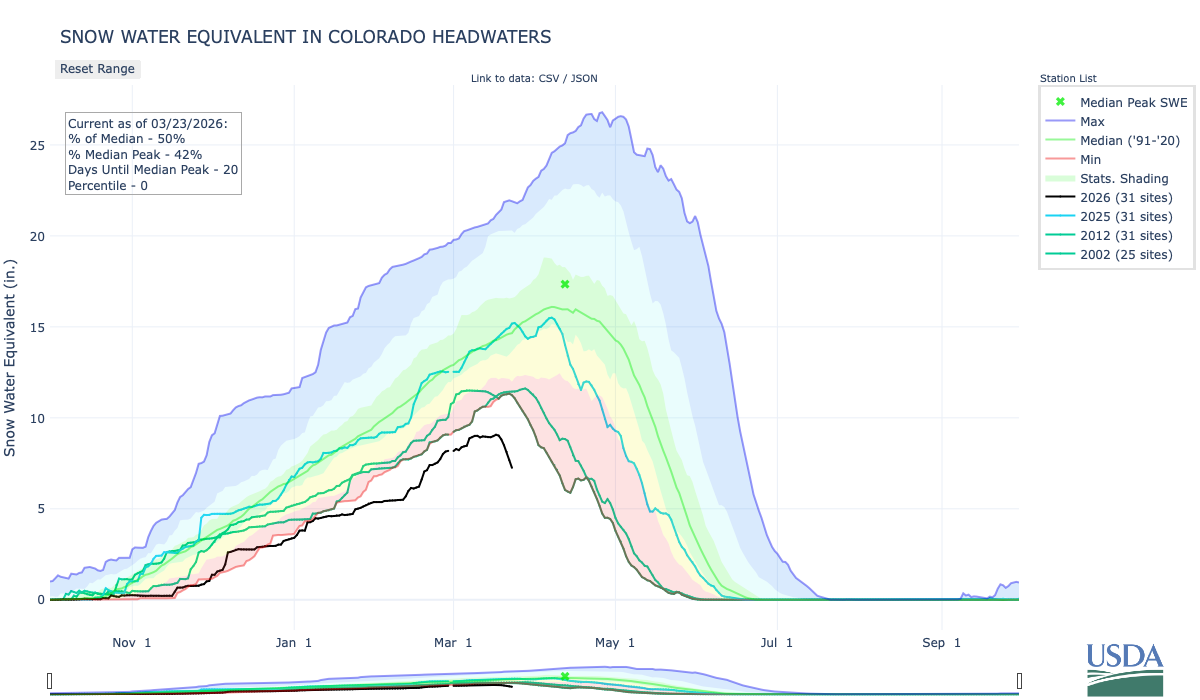
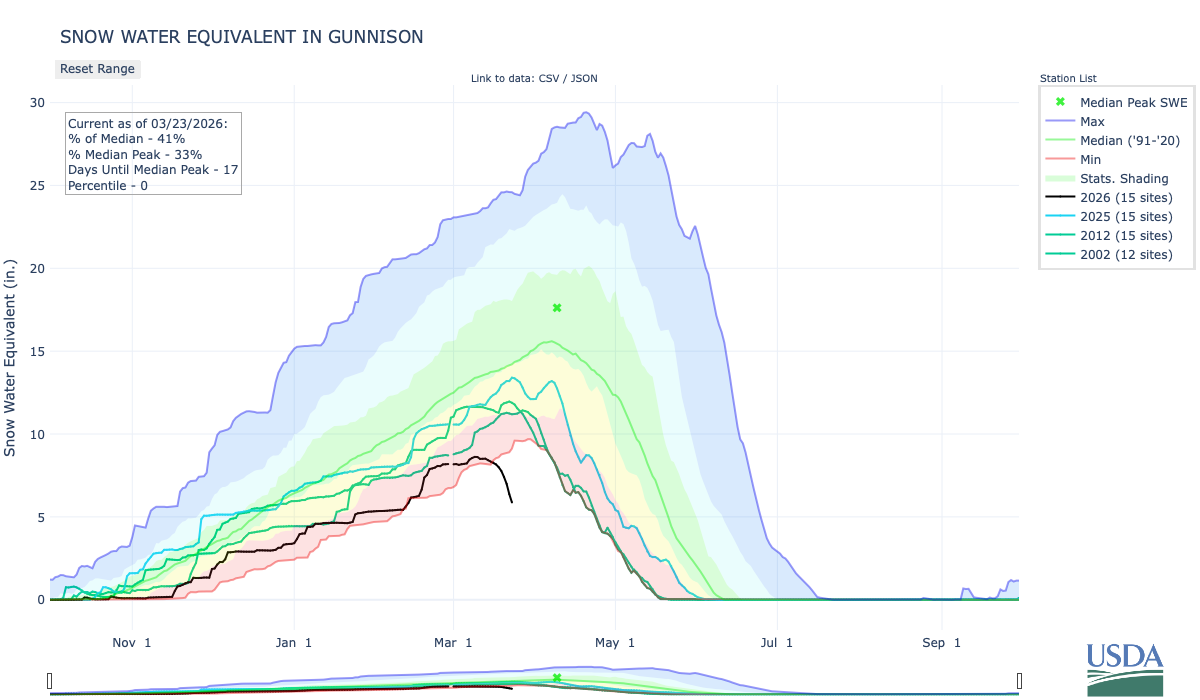
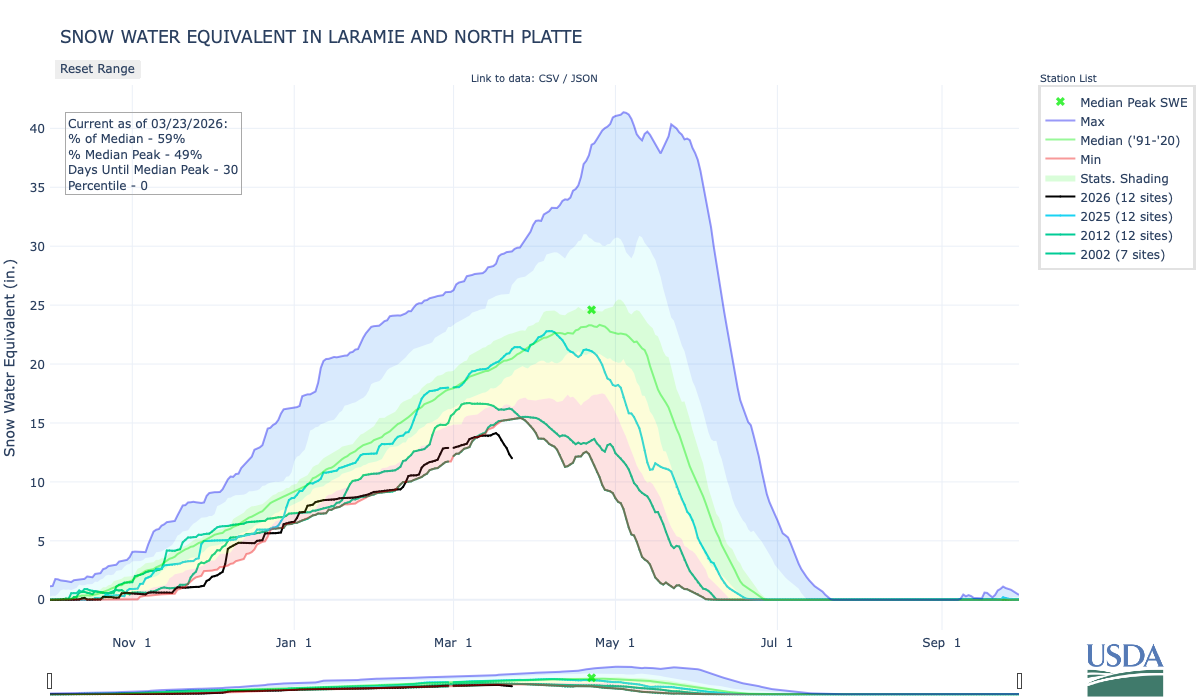
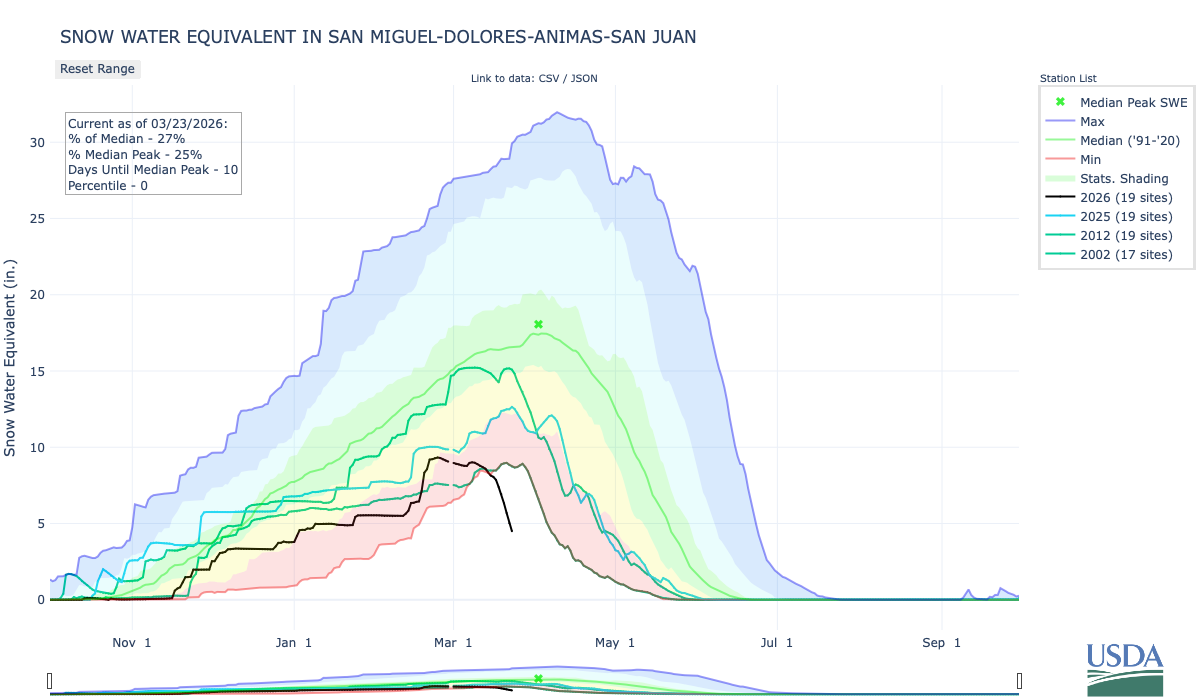
Still, looking back at similar years in the past can help with predicting flows this year. I’m going to focus on the Animas River in Durango, because it’s my home river, it is unimpeded by dams or major upstream diversions, and it is a good proxy for a lot of other Southwestern rivers, since its headwaters are located in the same mountain range as those of the Rio Grande, the Gunnison, the Dolores, the San Miguel, the San Juan, and the Uncompahgre rivers. If the runoff is weak in the Animas, it is also likely to be weak in all of those other rivers.
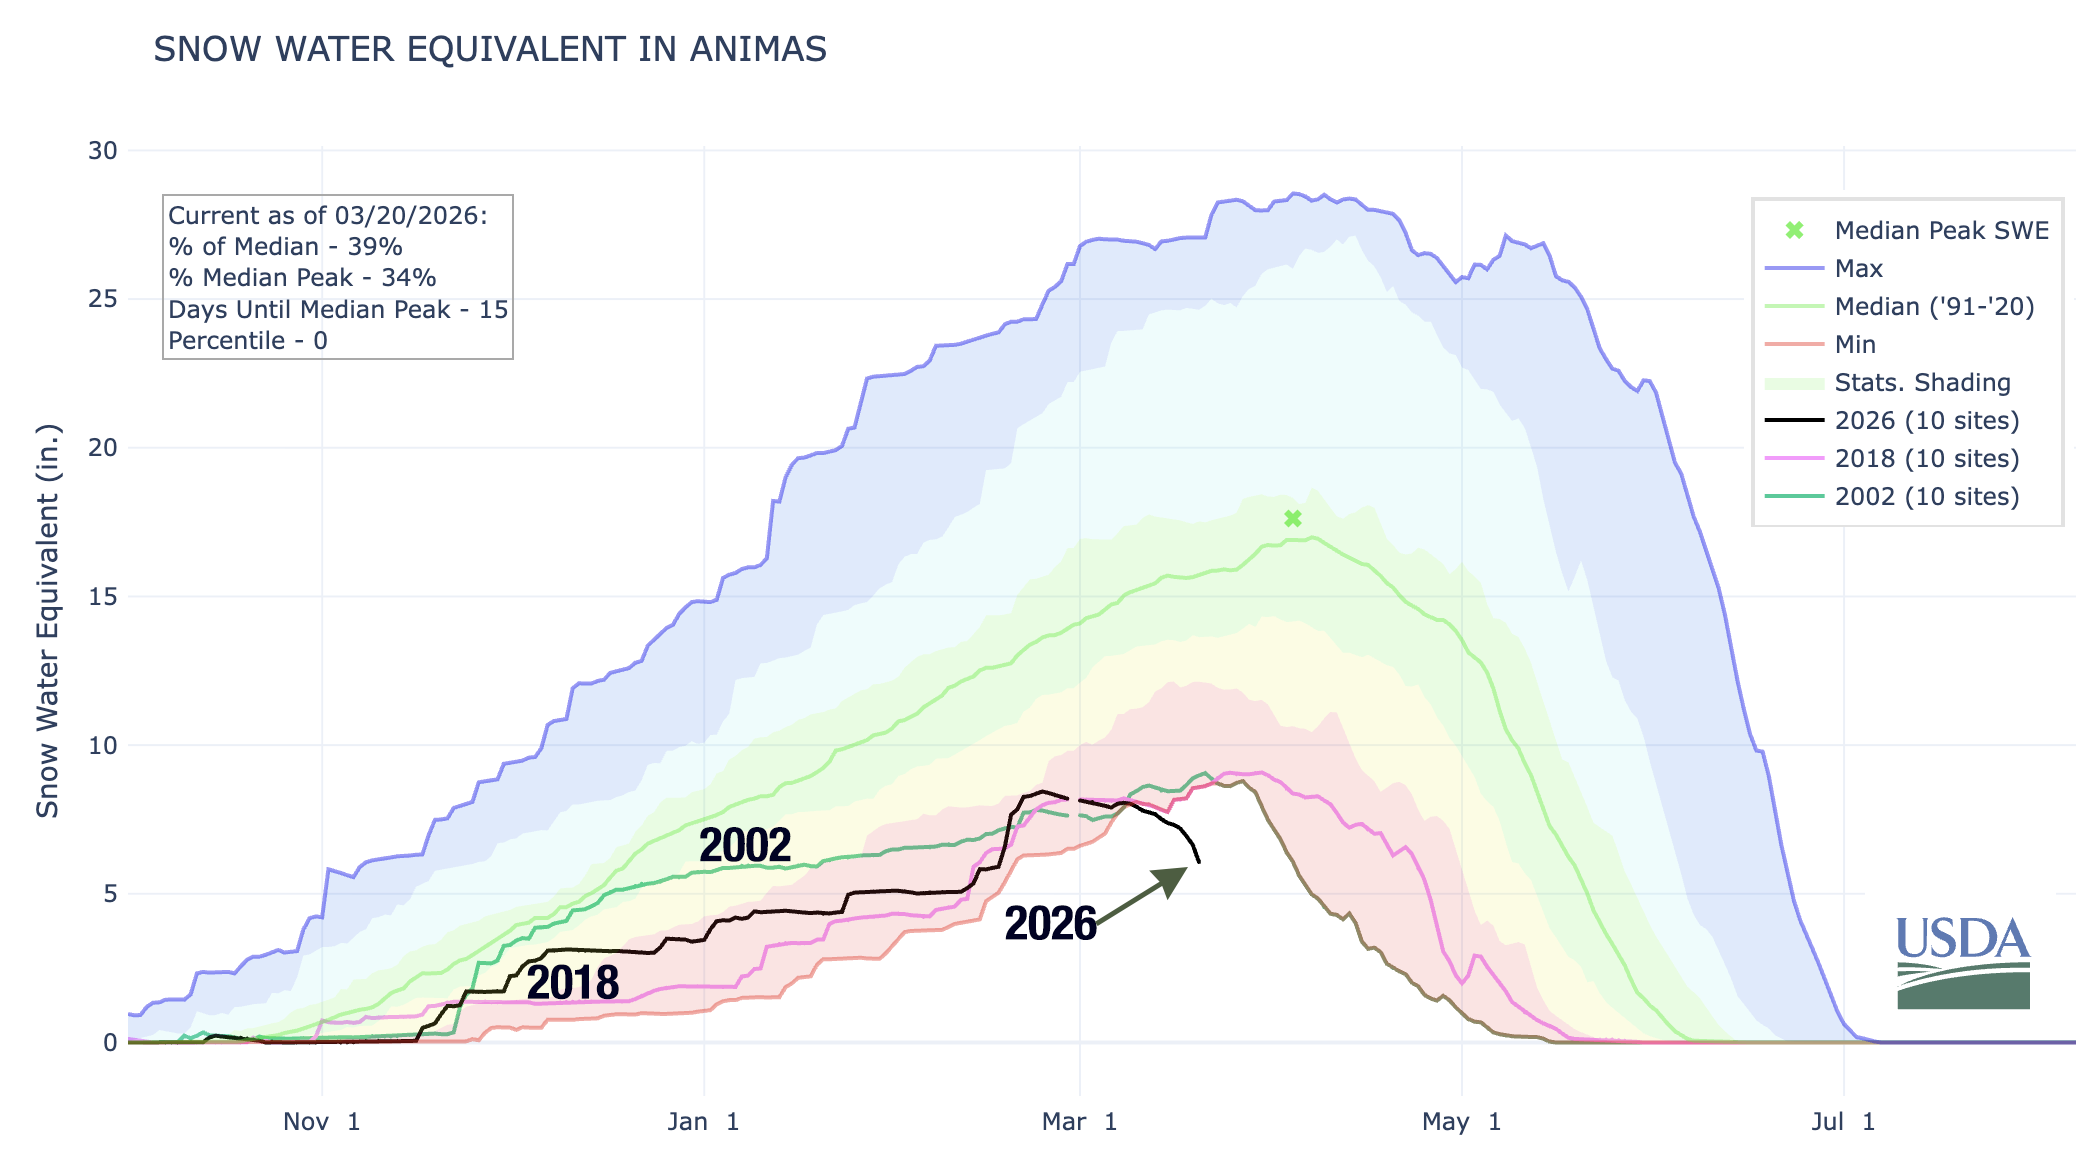
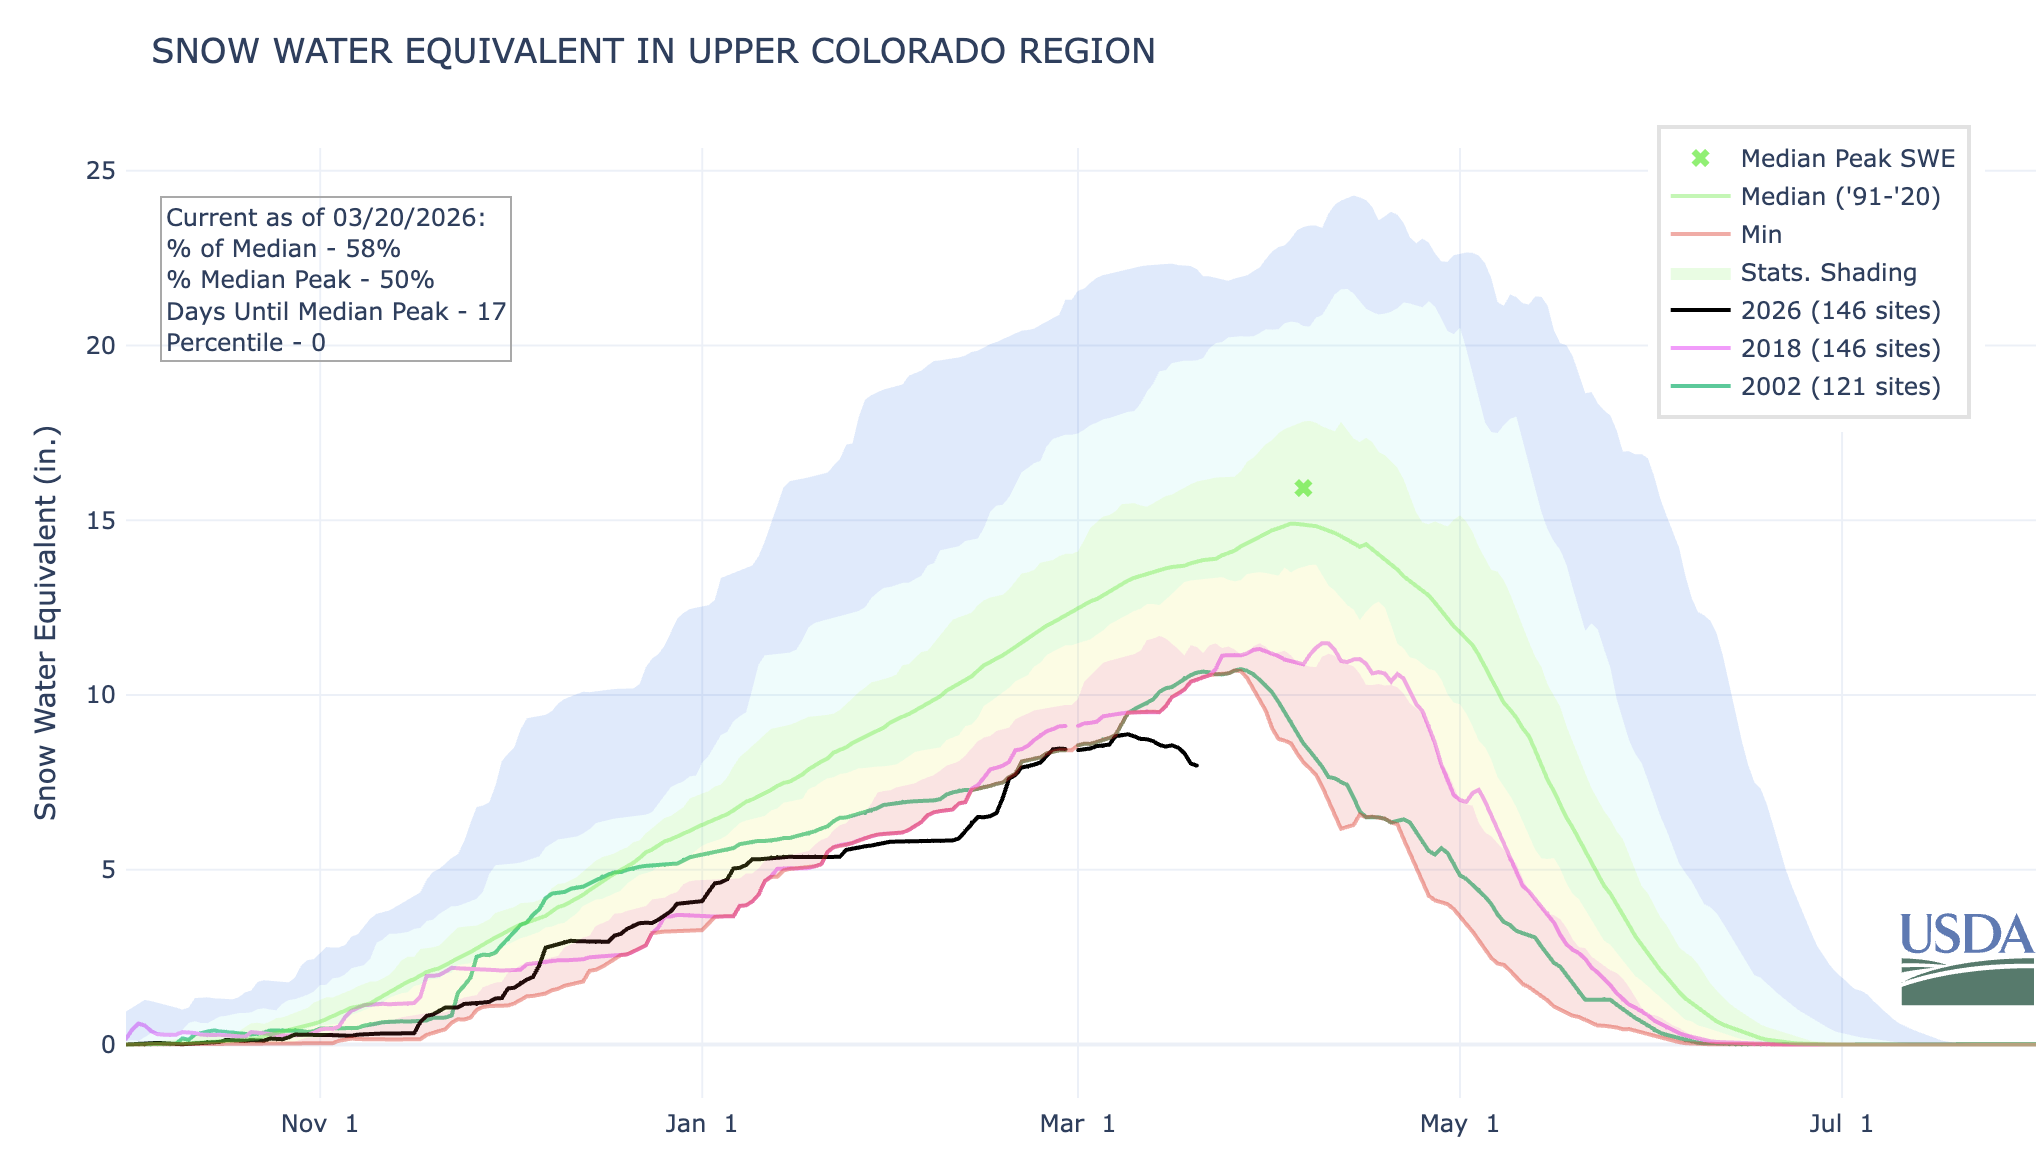
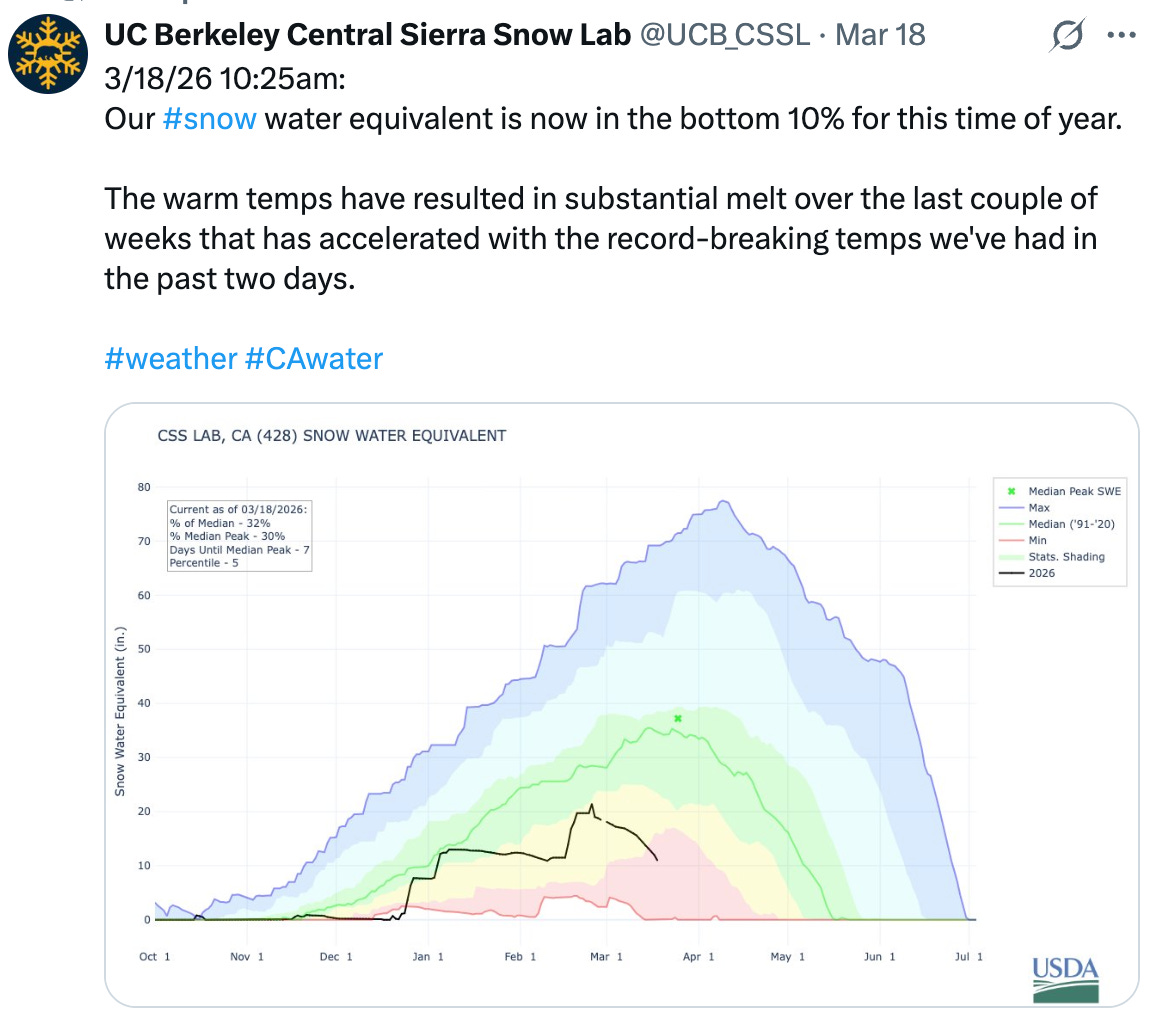
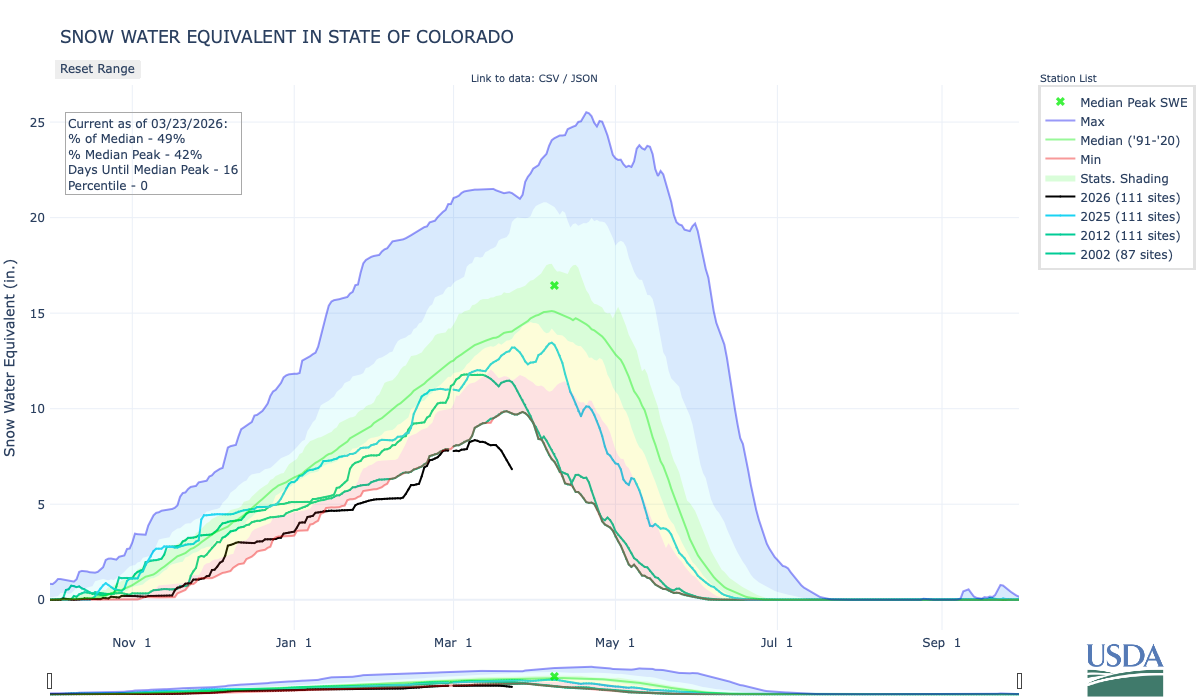
The snowpack graph shows that the current heat wave has really taken a toll, and probably launched the spring runoff.
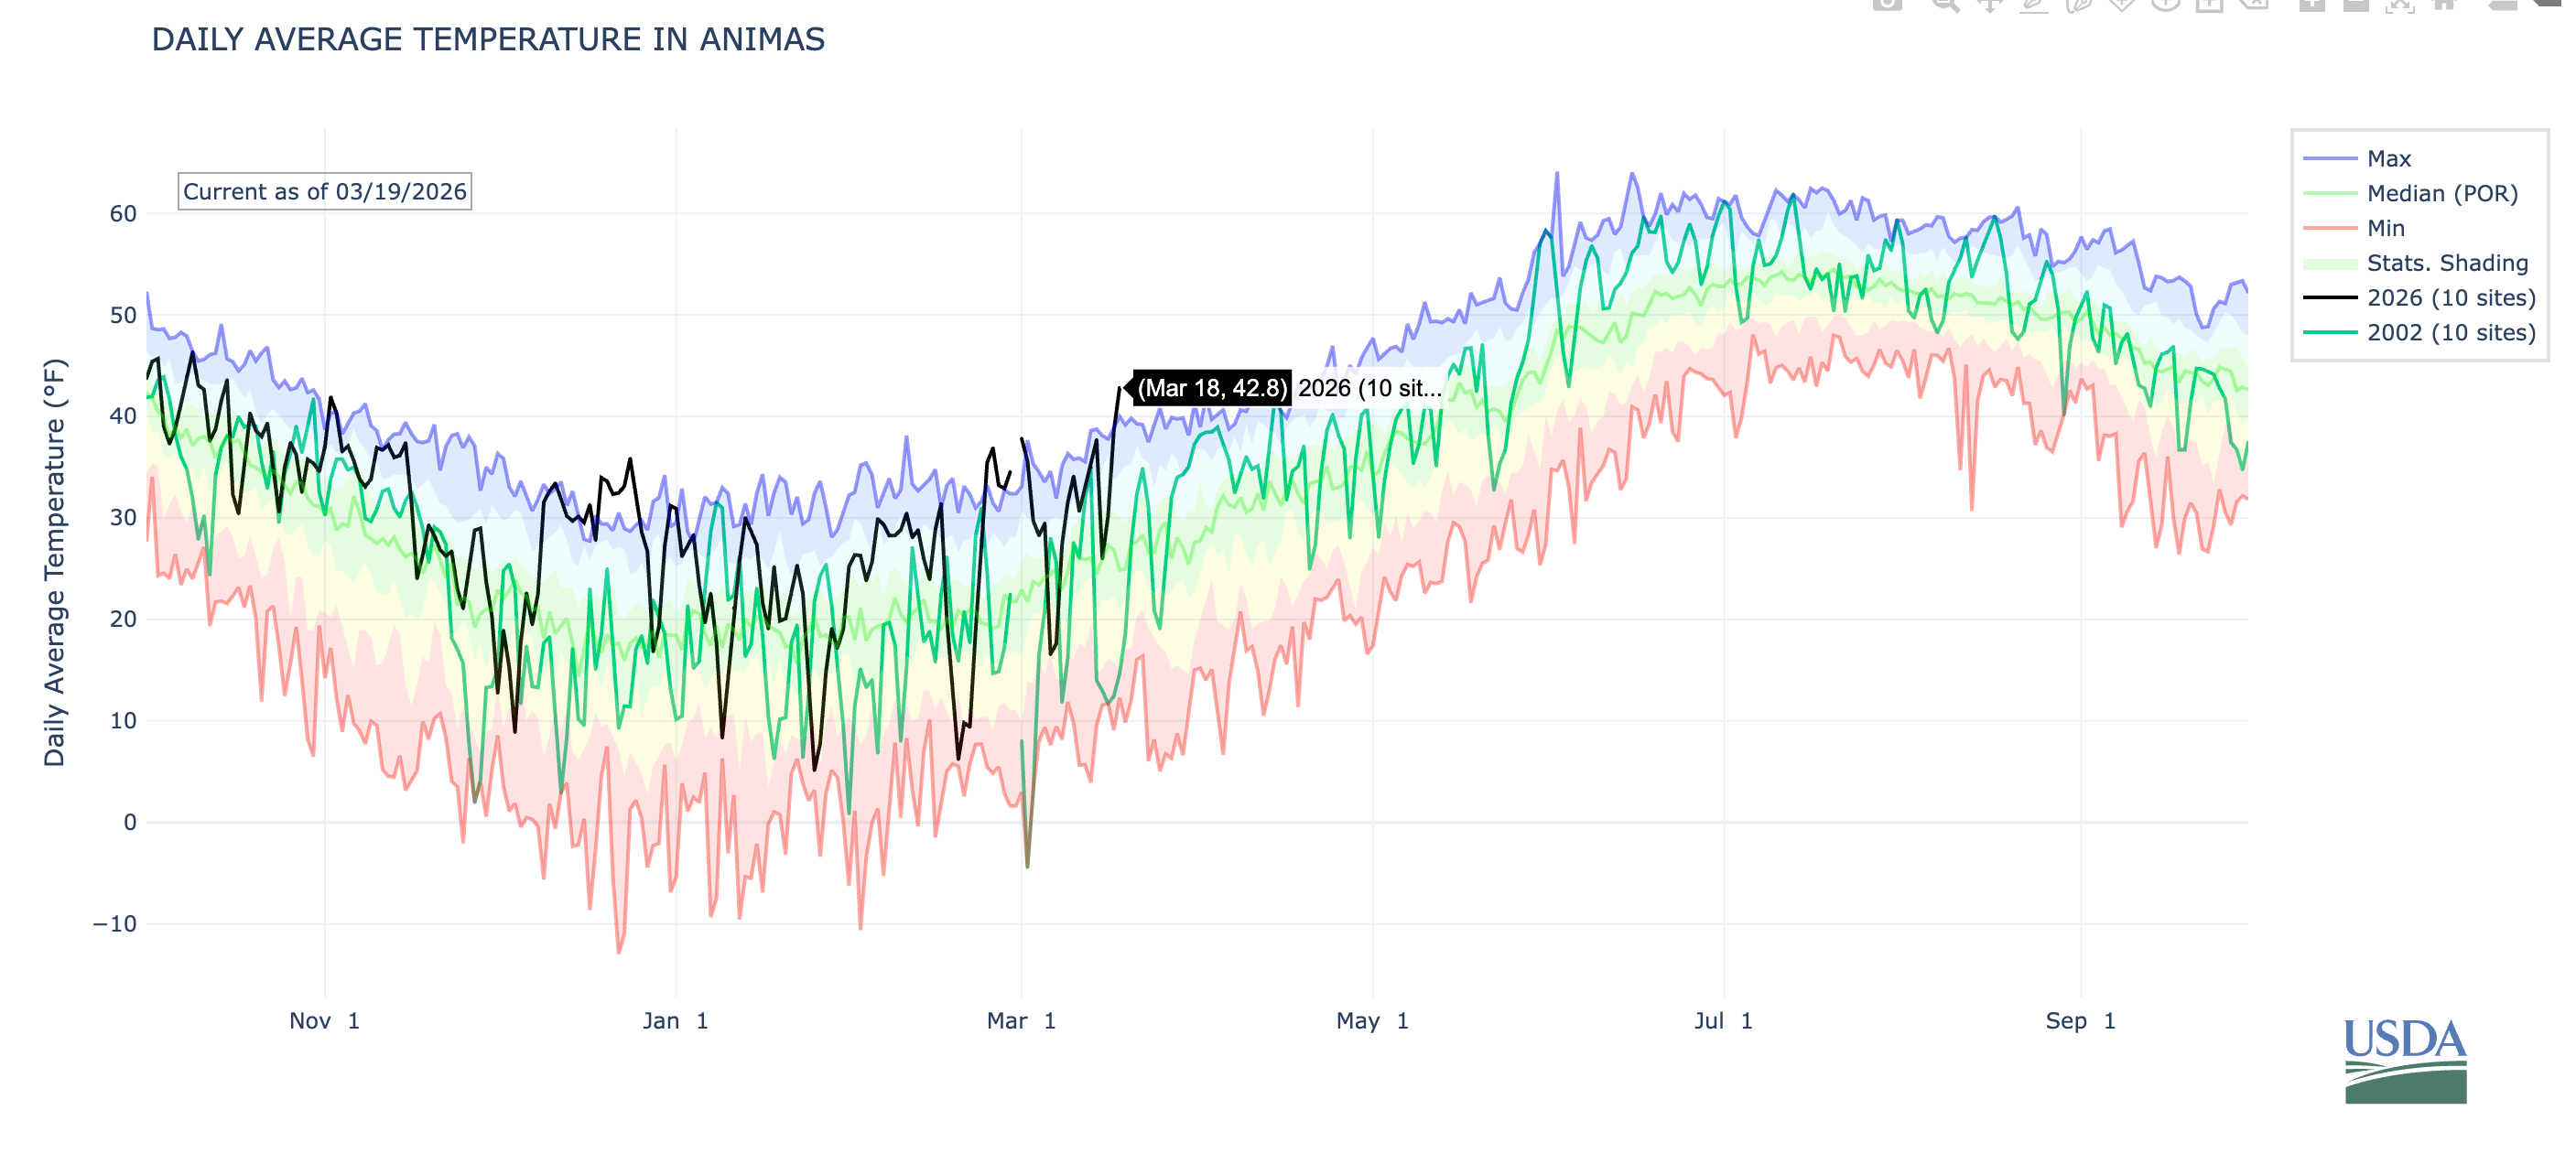
Here’s the temperature graph for the Animas watershed. You can see that it reached a record high for the date of 42.8° F. That doesn’t seem too warm until you consider that the median temperature for March 18 is about 25° F. Probably more significant than this one little blip is the fact that daily temperatures have far exceeded “normal” on dozens of days this winter. Also note the contrast with 2002 (the darker green line).
When you talk to Colorado climate folks and old-timers with good memories, you’ll often hear that the 1977 water year was even drier than 2002. Unfortunately, SNOTEL records typically go back only to the early 1980s, so it’s difficult to make a good apples-to-apples comparison. But by looking at the “natural flow” of the Colorado River, which is the calculated estimate of how much the river would carry without any human intervention, it appears that 1977 was, indeed, the driest winter across the Upper Colorado River Basin since at least 1900.
However, historic Animas River flow data suggest that 2002 was actually drier in southwestern Colorado.
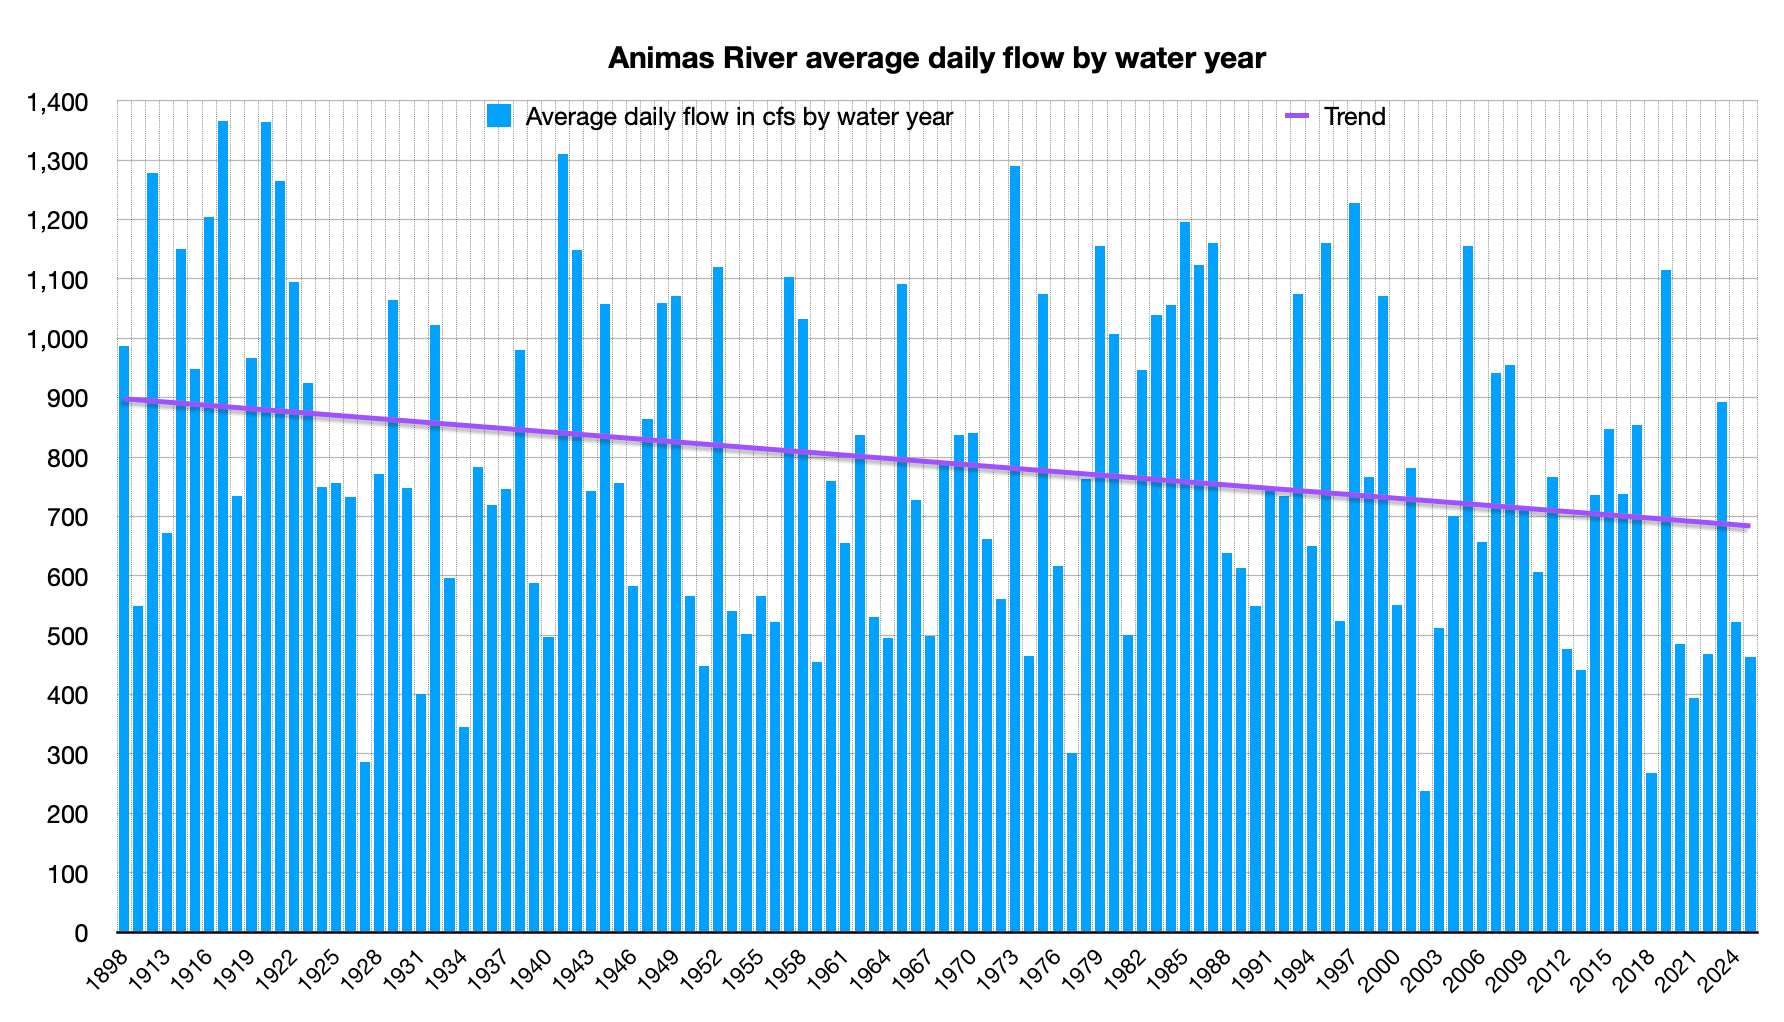
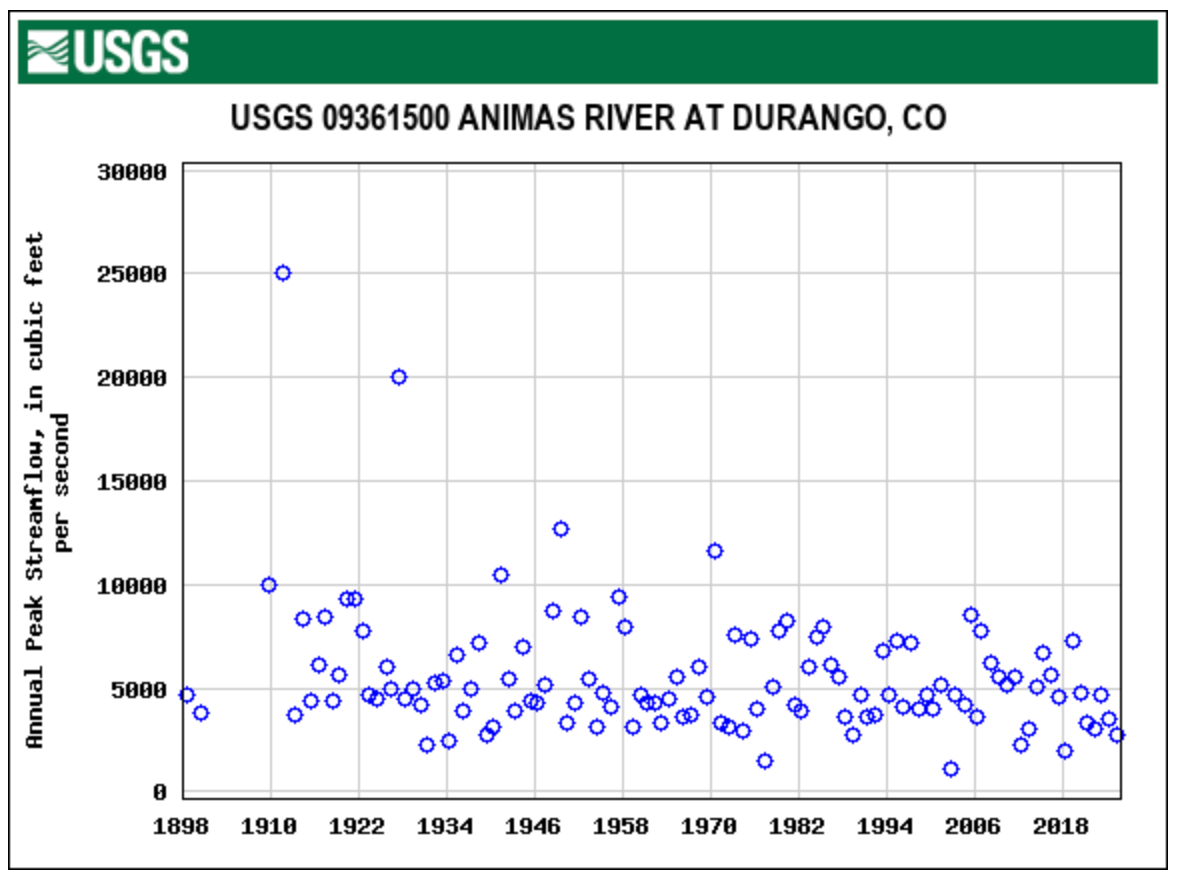
Here’s the average annual daily flow for the Animas. Note that there are several years missing between 1898 and 1911; apparently the USGS did not record flows during those years.
Average stream flows on the Animas River have trended downward over the last century and some, but the river has struggled through extreme dry years in the past. Source: USGS.
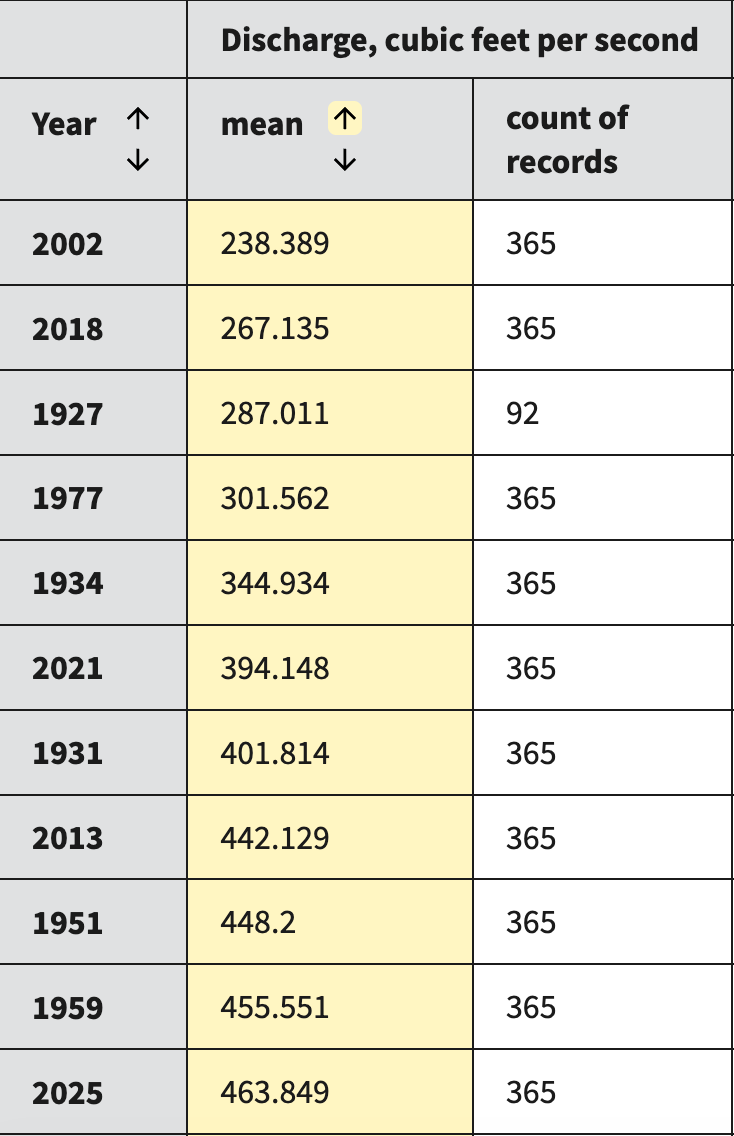
Because that graph isn’t so easy to read, here’s a table showing the eleven lowest average daily flow water years. Note that in 1927 they only had 92 records, potentially skewing the results. The 2002 and 2018 water years were lower than in 1977. If snowpack levels correlate with annual average flows, then we could expect this year’s to be around 200 cfs, which is pretty damned dismal.
When I took a look at the peak streamflows for the Animas, I was a bit taken aback to see that in 2002 it topped out above 1,000 cfs, which is more than I would have expected.
Then I saw the date: It peaked in September, after the monsoon arrived, not in the spring. The 2002 spring runoff actually topped out on May 21 at 880 cfs, which was far lower than the 1977 spring peak.
Based on all of that, my Animas River peak streamflow prediction is a bit wacky, but I’m standing by it: It will top out at 700 cfs on April 15.
The rest of the Land Desk community will have a chance to predict the peak starting next week, when I’ll announce the terms, the river gauges in the contest, and the prizes for the winner(s). Most likely it will only be open to paid subscribers, so the time to upgrade is now!
We might as well get even more depressed. Here’s the snowpack graph for the Upper Colorado River Basin, showing 2026, 2002, and 2018 — i.e. the dismal years. Note that the spring melt has begun in earnest. If it continues at this rate, runoff will be over by early May.
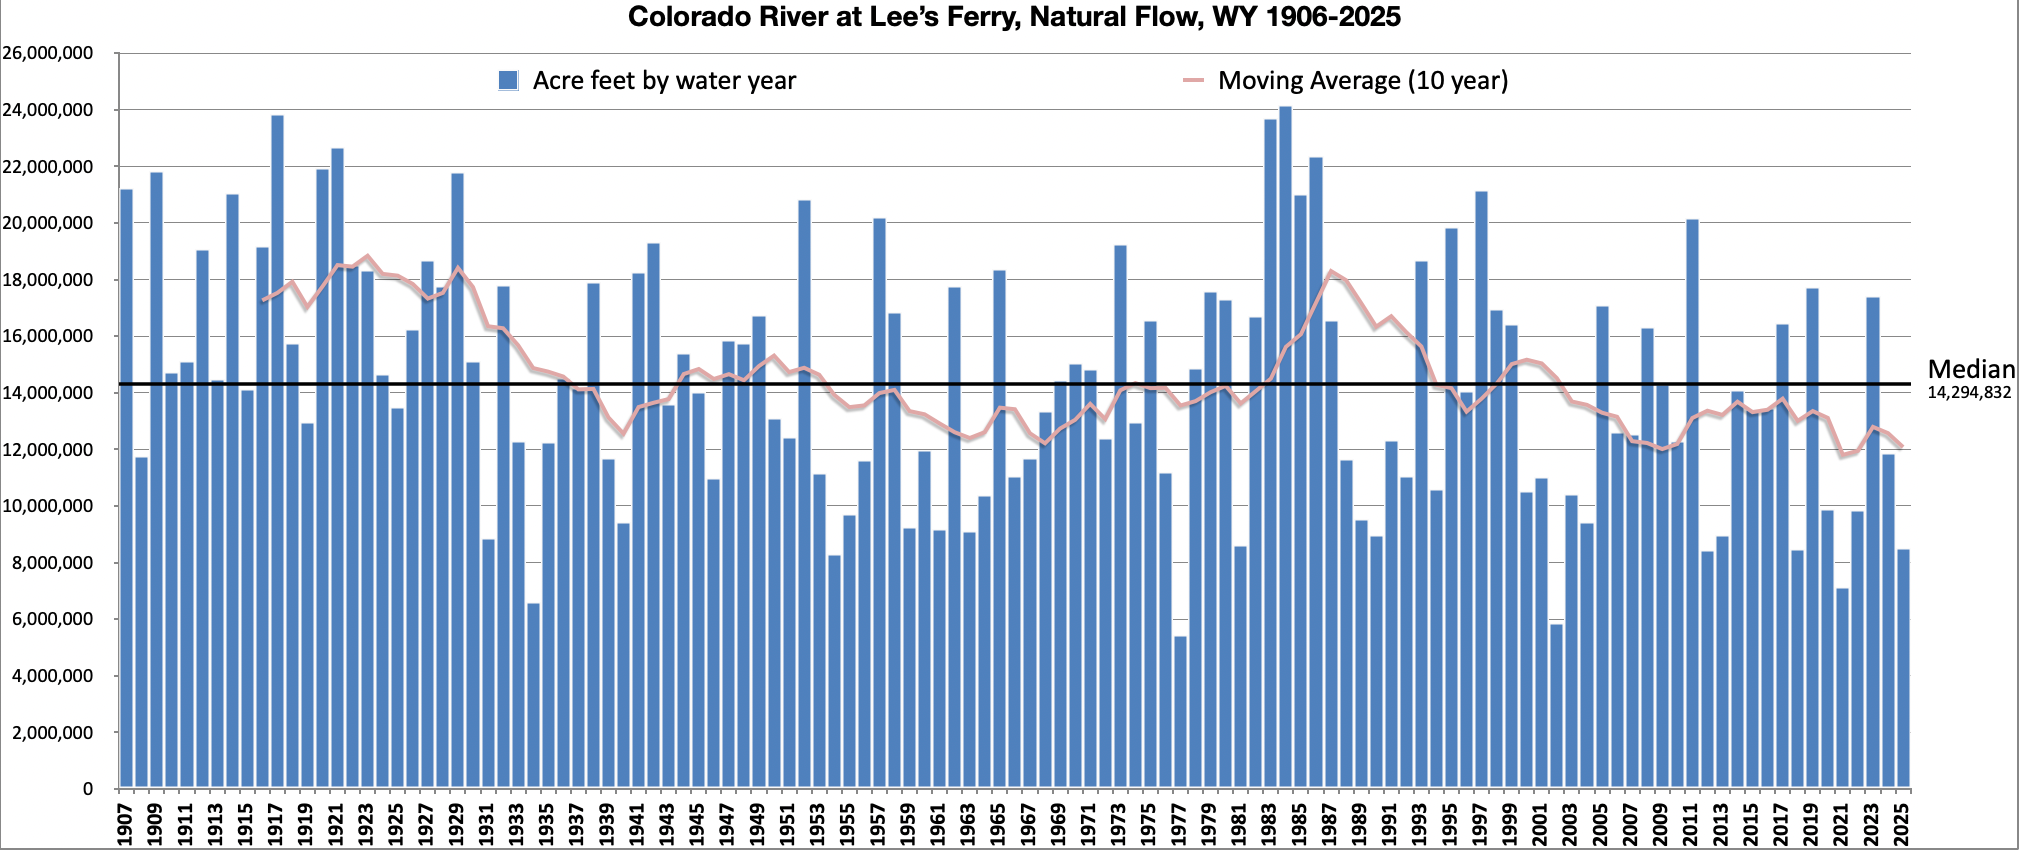
And here’s the natural flow graph for Lees Ferry on the Colorado River. Natural flow is the calculation of how much water would be in the river at that point if there were no human diversions or consumptive use upstream. If you compare this to the historic streamflows on the Animas River, you’ll notice that there is a correlation, but it’s not direct. For example, 1977 was the driest year on record for the Colorado River as a whole, with a total volume of just 5.4 million acre-feet, which is about half what the Lower Basin alone was using throughout the 1990s.
The ten lowest years on record are:
1977: 5.4 MAF
2002: 5.9 MAF
1934: 6.6 MAF
2021: 7.2 MAF
1954: 8.3 MAF
2012: 8.4 MAF
2018: 8.5 MAF
2025: 8.5 MAF (provisional)
1981: 8.6 MAF
1931: 8.9 MAF
It looks like we could be in that 5.4 MAF territory once again. That wasn’t a huge deal in 1977, since it was an anomaly. It is a big deal now.
And just so you know, it’s not just the Colorado River watershed that’s in trouble. Even California, which got pummeled by atmospheric rivers, is losing its snow rapidly.
📖 Reading (and watching) Room 🧐
The Upper Basin and Lower Basin may not have come up with a deal yet on how to save the Colorado River’s massive plumbing system, but they are looking for solutions. One of them is creating an Upper Basin conservation pool. Like a lot of issues related to the rivers, it’s a slightly complicated one. But Heather Sackett of Aspen Journalism gives a really great rundown. She’s always a must-read for those looking to understand what’s going on with the Colorado.
🗺️ Messing with Maps 🧭
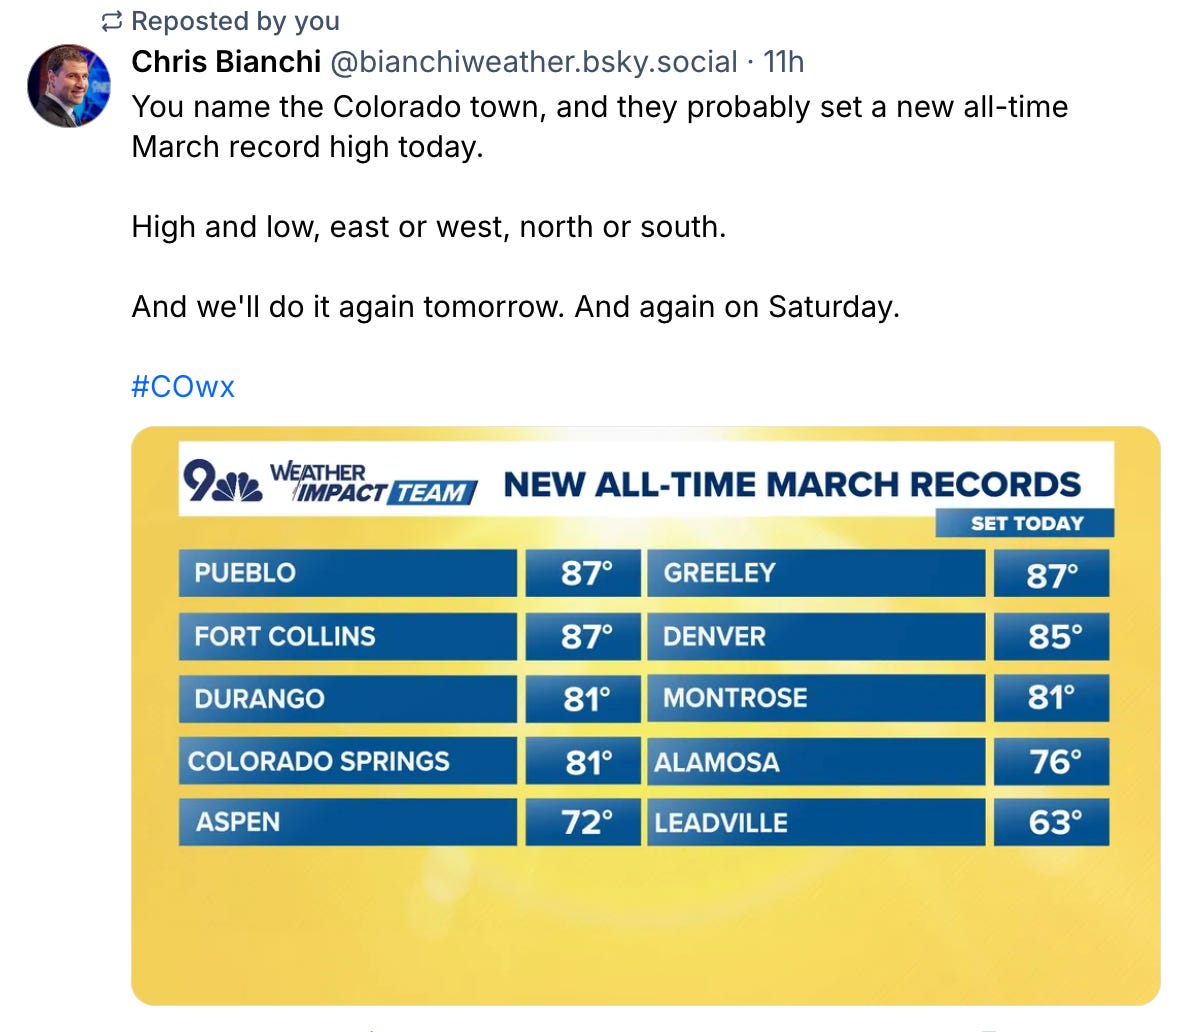
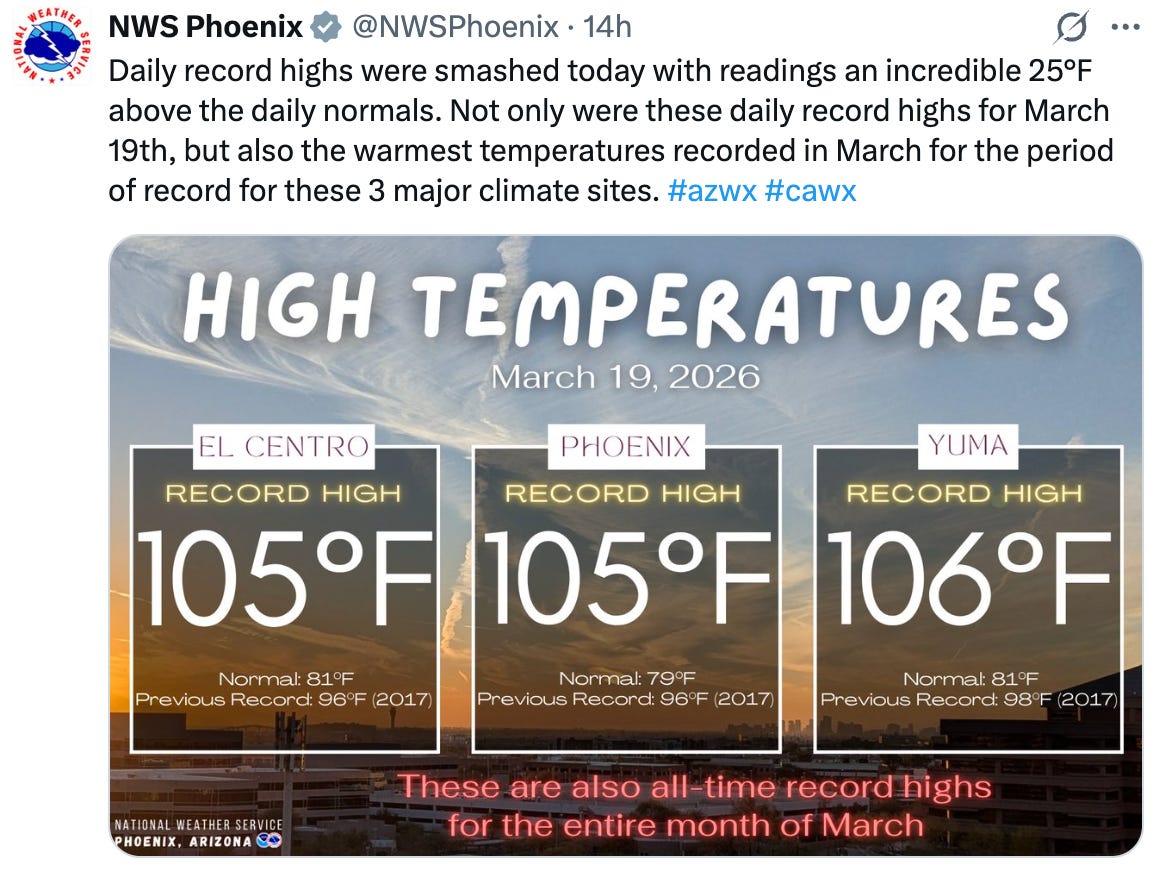
The current heat wave is breaking records across the West. Here’s a little sampling:
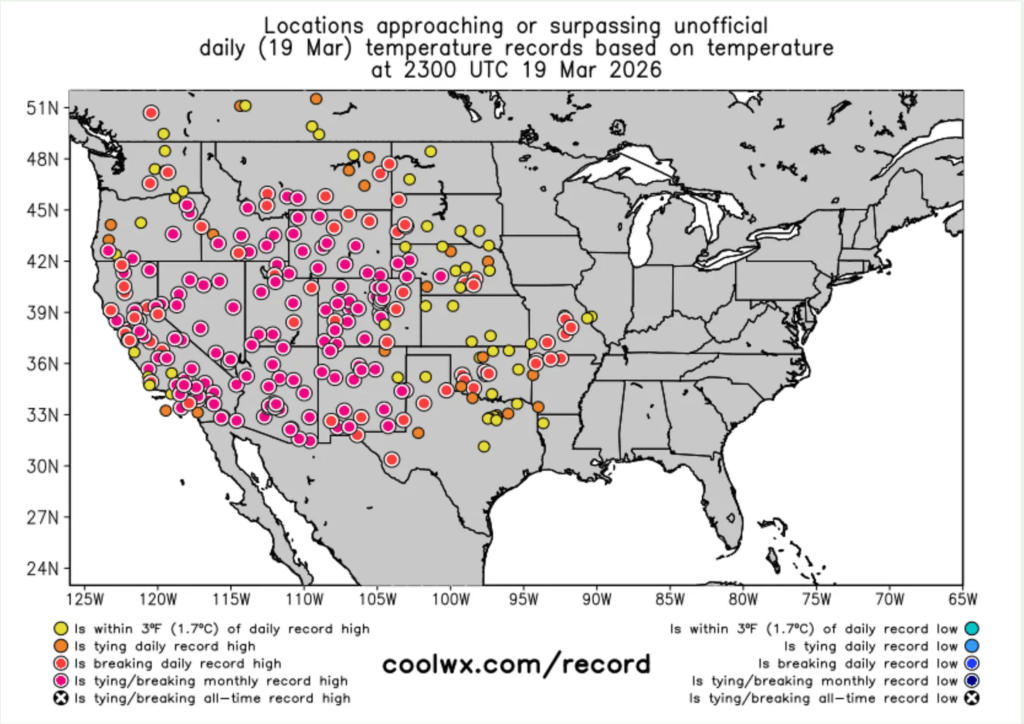
If you want a quick and comprehensive look where those records were broken during the last day, week, or month, check out coolwx.com/record. In the side panel you can click on the United States and the time period you wish to see and it will show an animation of all of the records. It looks kind of like this:
Update: I’ve replaced all the graphics that I published early this morning. I hope they are now accurate. All major basins are showing a big drop which was expected with the record heat the past few days.
Demand for copper is surging because of demand from new technologies, but suppliers are struggling to keep up, and they are likely to fall further behind in the coming years, resulting in shortfalls globally. Even though copper prices are at historically high levels, the financial risk involved in mining means that prices will need to go much higher before mining companies see profit in addressing the supply shortage.
Copper is abundant in the ground, but there’s not enough being extracted to be able to meet the demand. That’s because investors want higher and more reliable returns than copper mines currently offer, and the industry faces complex permitting processes and can’t find enough workers. Our analysis found that for new technologies to continue to develop, and for the global economy to continue to grow, even higher prices are ahead.
Recycling existing copper could help reduce the amount needed from new mines, but it would not be enough to meet the rising demand. Even under generous assumptions, we found that recycling might provide 35% of the global copper supply by 2050, with mining producing the remaining 65%.
The only other way to get more copper is to mine more of it. But building a new mine can take 20 to 30 years – a period during which investors are spending money but not yet getting returns, and a time when costs can rise significantly from preliminary estimates.
If industrial and economic growth is to stay on track in the 2030s, new mines would need to be in the financing and permitting processes right now. But they aren’t.
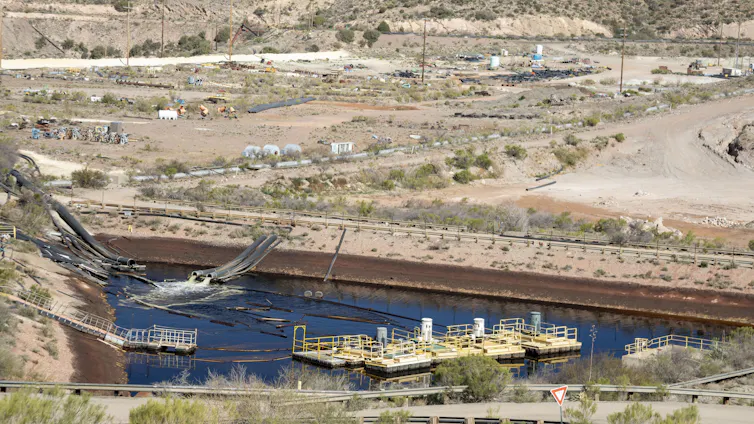
Even Resolution Copper, which started decades ago trying to develop a mine in Arizona outside Phoenix, has more work to do before being able to start mining. Since 1995, the project’s developers have spent several billion dollars on planning, permitting and legal cases.
Once in place, it could meet as much as 25% of U.S. copper demand from a high-concentration body of ore located near existing truck and rail lines.
Evaluating the environmental and community effects of proposed mining projects is essential, but in many countries there are overlapping levels of review that have different, and variable, timelines. And many parts of the process can be appealed to courts by opponents or supporters. That increases costs and imposes time delays for mine developers – and means consumers will have to wait longer, and pay more, for copper-intensive products and services.
Yet even though copper prices are near historic highs – over US$13,000 per ton on the London Metals Exchange – the profit margins are still too low and price swings are too volatile for companies to forecast reliable returns on the risky investment of building new mines.
Metal structures on the site of Resolution Copper’s proposed underground copper mine in Arizona, in a place that has been sacred to Native American people for thousands of years. Jim West/UCG/Universal Images Group via Getty Images
To get a picture of what might be possible if there were a significant global effort to increase copper availability, we evaluated several optimistic scenarios. We looked at faster permitting for new mines, higher recycling rates and smoother mining processes than those currently in place. But even then, economic development drove demand to grow far faster than the available supply.
Existing mines will have decreasing amounts of ore available and will produce less copper in 2050 than they do in 2025. Yet even if all known copper deposits with known mine-opening dates go into production as scheduled copper supplies will not keep up with demand.
Our best-case scenario has global mine production at about 30 million metric tons of copper a year by 2050. But to keep pace with global economic development, the world will need 37 million metric tons of mined copper a year by then.
To meet that additional need, more mines will need to be opened, and extra production developed – including extracting residual copper from old mine debris that was previously viewed as having too little copper to be worth processing.
Higher copper prices will ripple through the economy, raising costs for construction, energy and technology. But pretending those costs can be avoided doesn’t make them disappear. Underinvestment across the supply chain from mines to processing today shows up as bottlenecks tomorrow, including delayed grid upgrades and constrained digital growth.