#Drought news March 26, 2026: Exceptional drought (D4) expanded in northwest #Colorado, while extreme drought (D3) grew across Colorado, southern #Wyoming, and southern #Nebraska

Click on a thumbnail graphic to view a gallery of drought data from the US Drought Monitor website.

Click on the link to go to the US Drought Monitor websiste. Here’s an excerpt:

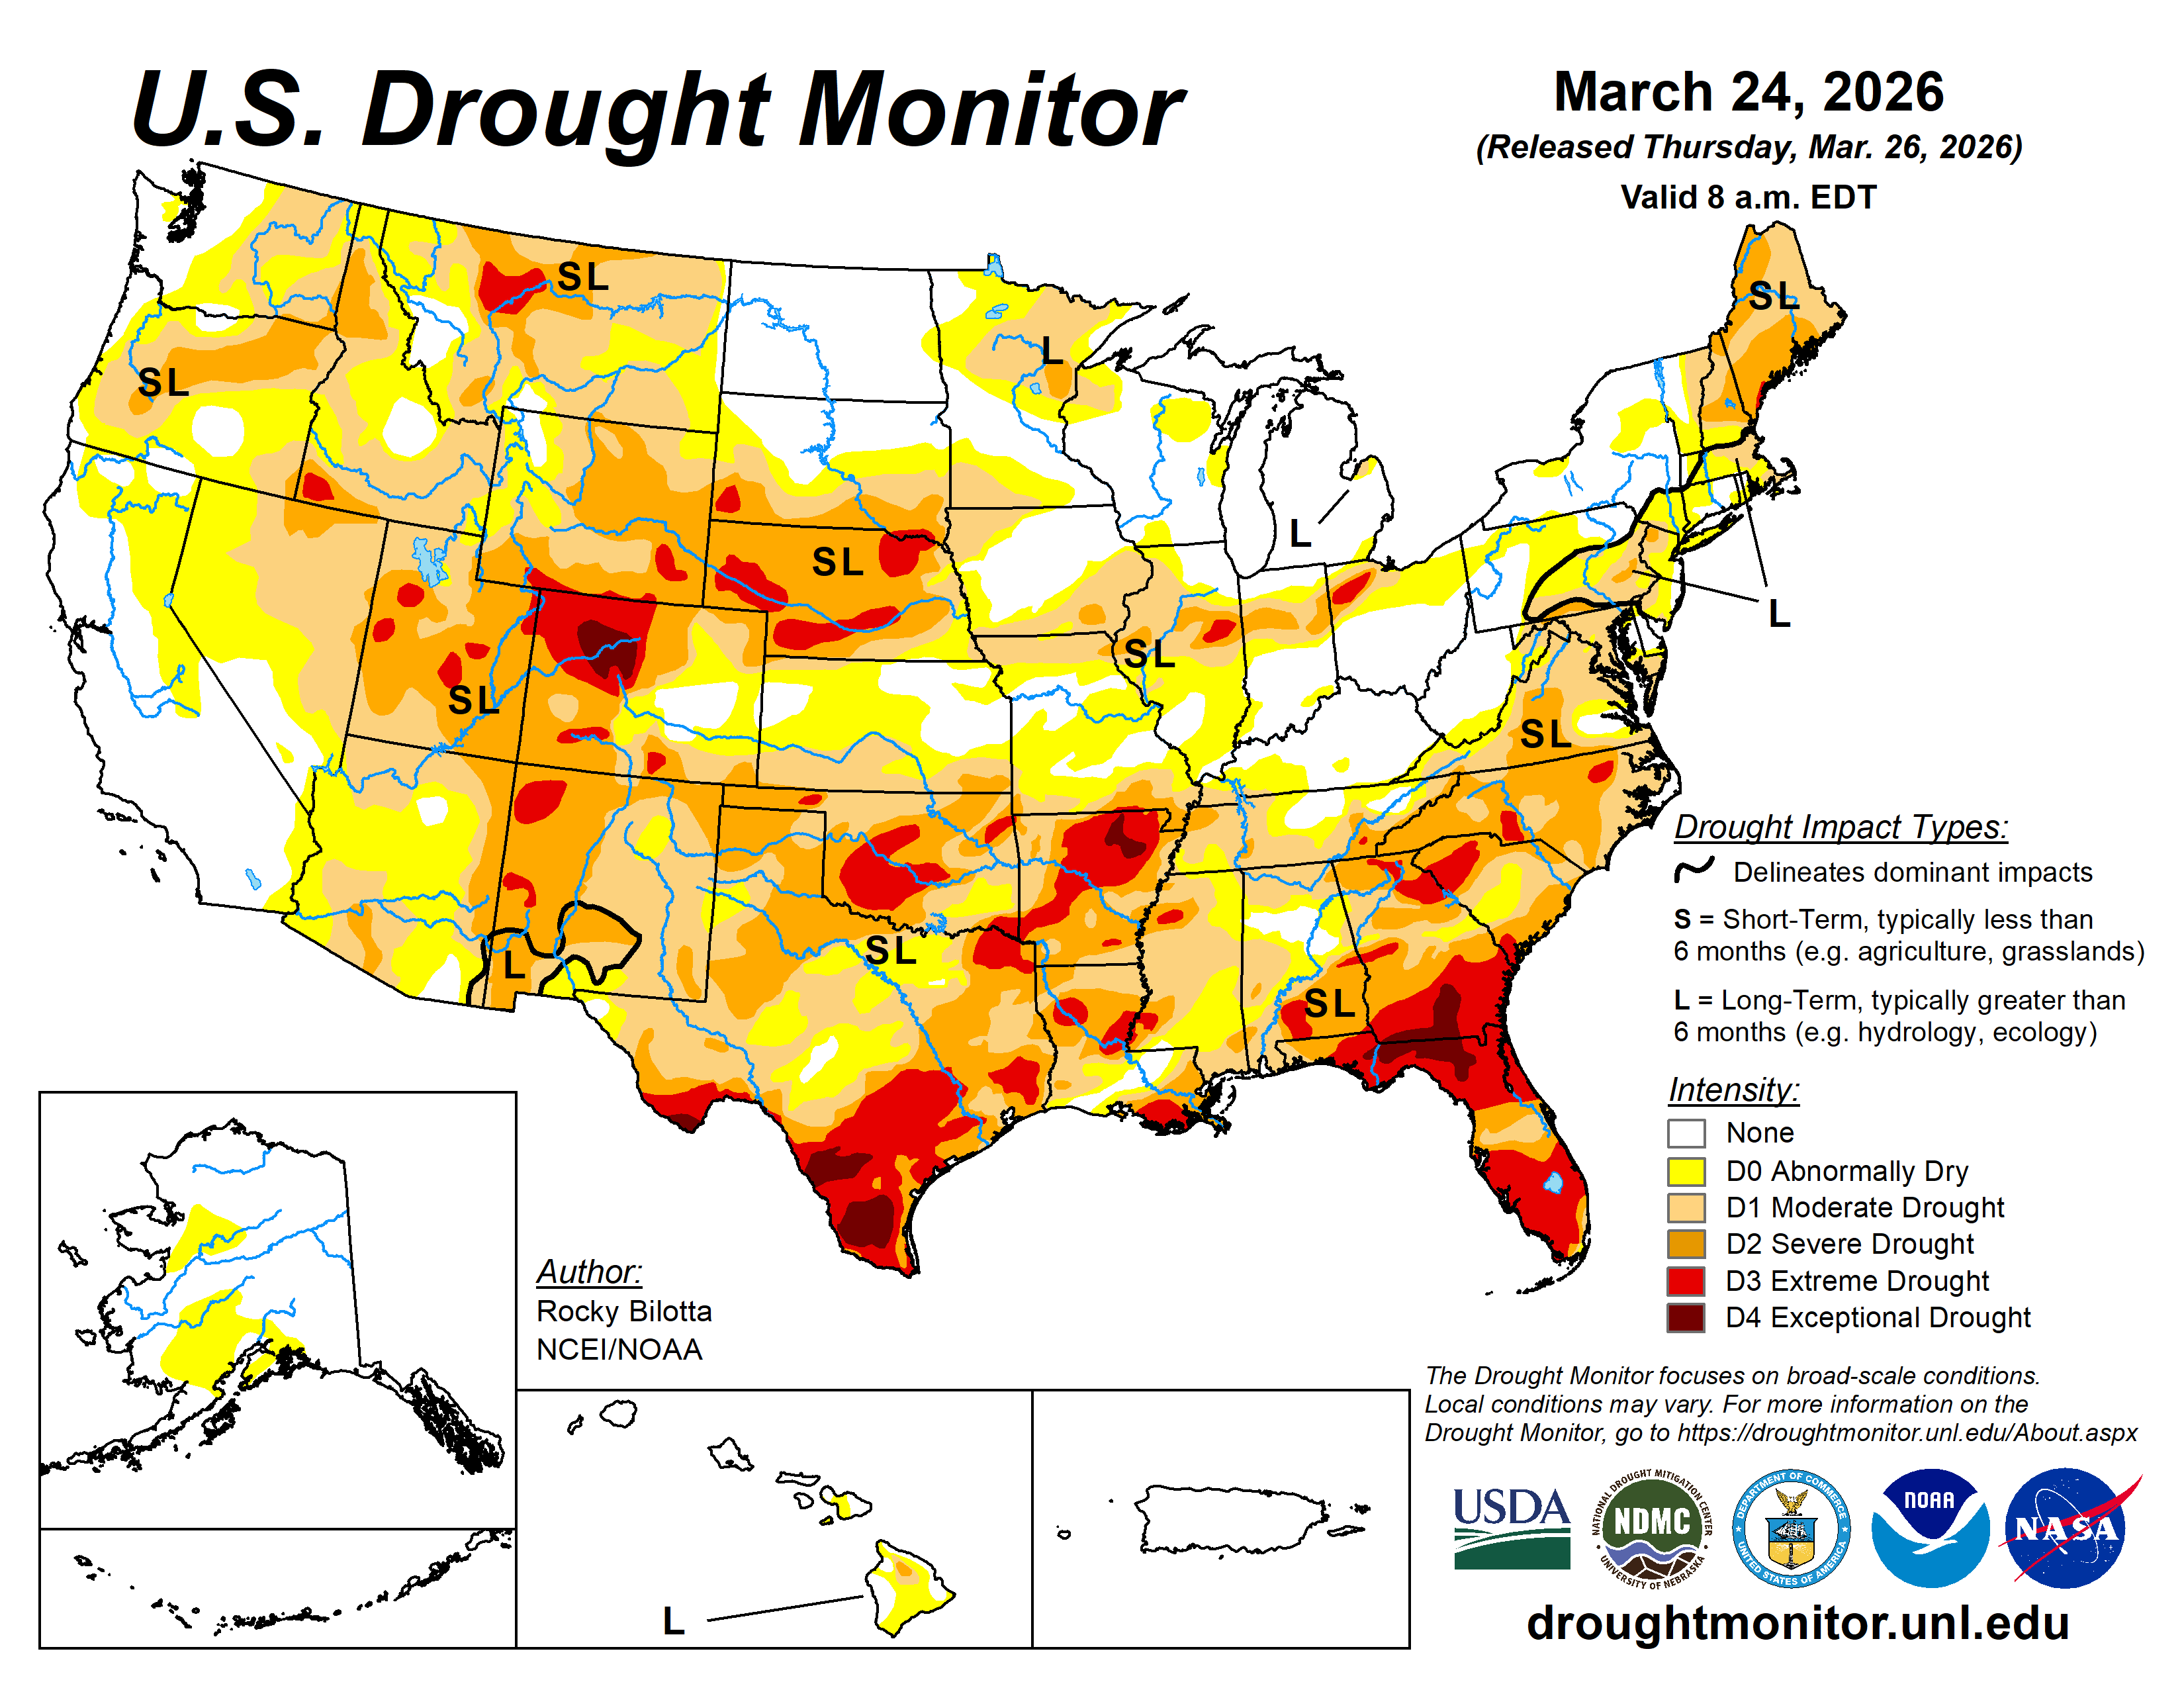
This Week’s Drought Summary

This week, extreme weather events across the United States painted a starkly contrasting picture of drought development and relief. In the West and Plains, a persistent heat dome drove temperatures 20 to 25 degrees above normal, shattering early-season records and significantly increasing evaporative demand. This intense heat, combined with high winds and pre-existing dryness, threatened to rapidly deplete topsoil moisture and fueled explosive, landscape-altering wildfires—most notably the historic Morrill Fire in Nebraska that consumed over 800,000 acres. Ultimately, the combination of soaring temperatures and below-normal precipitation resulted in the expansion of drought and abnormal dryness across portions of the West, Great Plains, and parts of the Southeast.

Conversely, other regions experienced abrupt and volatile moisture influxes that mitigated dry conditions but introduced localized to severe flooding. In the Pacific Northwest, an atmospheric river stalled over Washington, bringing heavy rain and significant snowmelt. Further east, a powerful winter storm delivered a massive precipitation boost in the form of a late-season blizzard, dropping over 50 inches of snow across parts of the Upper Midwest and Michigan’s Upper Peninsula. The most extreme precipitation of the week occurred over the Hawaiian Islands, where a stalled Kona low dumped unprecedented, historic rainfall, resulting in excessive flooding, widespread landslides, and infrastructure damage. Overall, above-normal precipitation resulted in improvements to drought and abnormal dryness across parts of the Midwest, Northeast, Hawaii, and Puerto Rico…
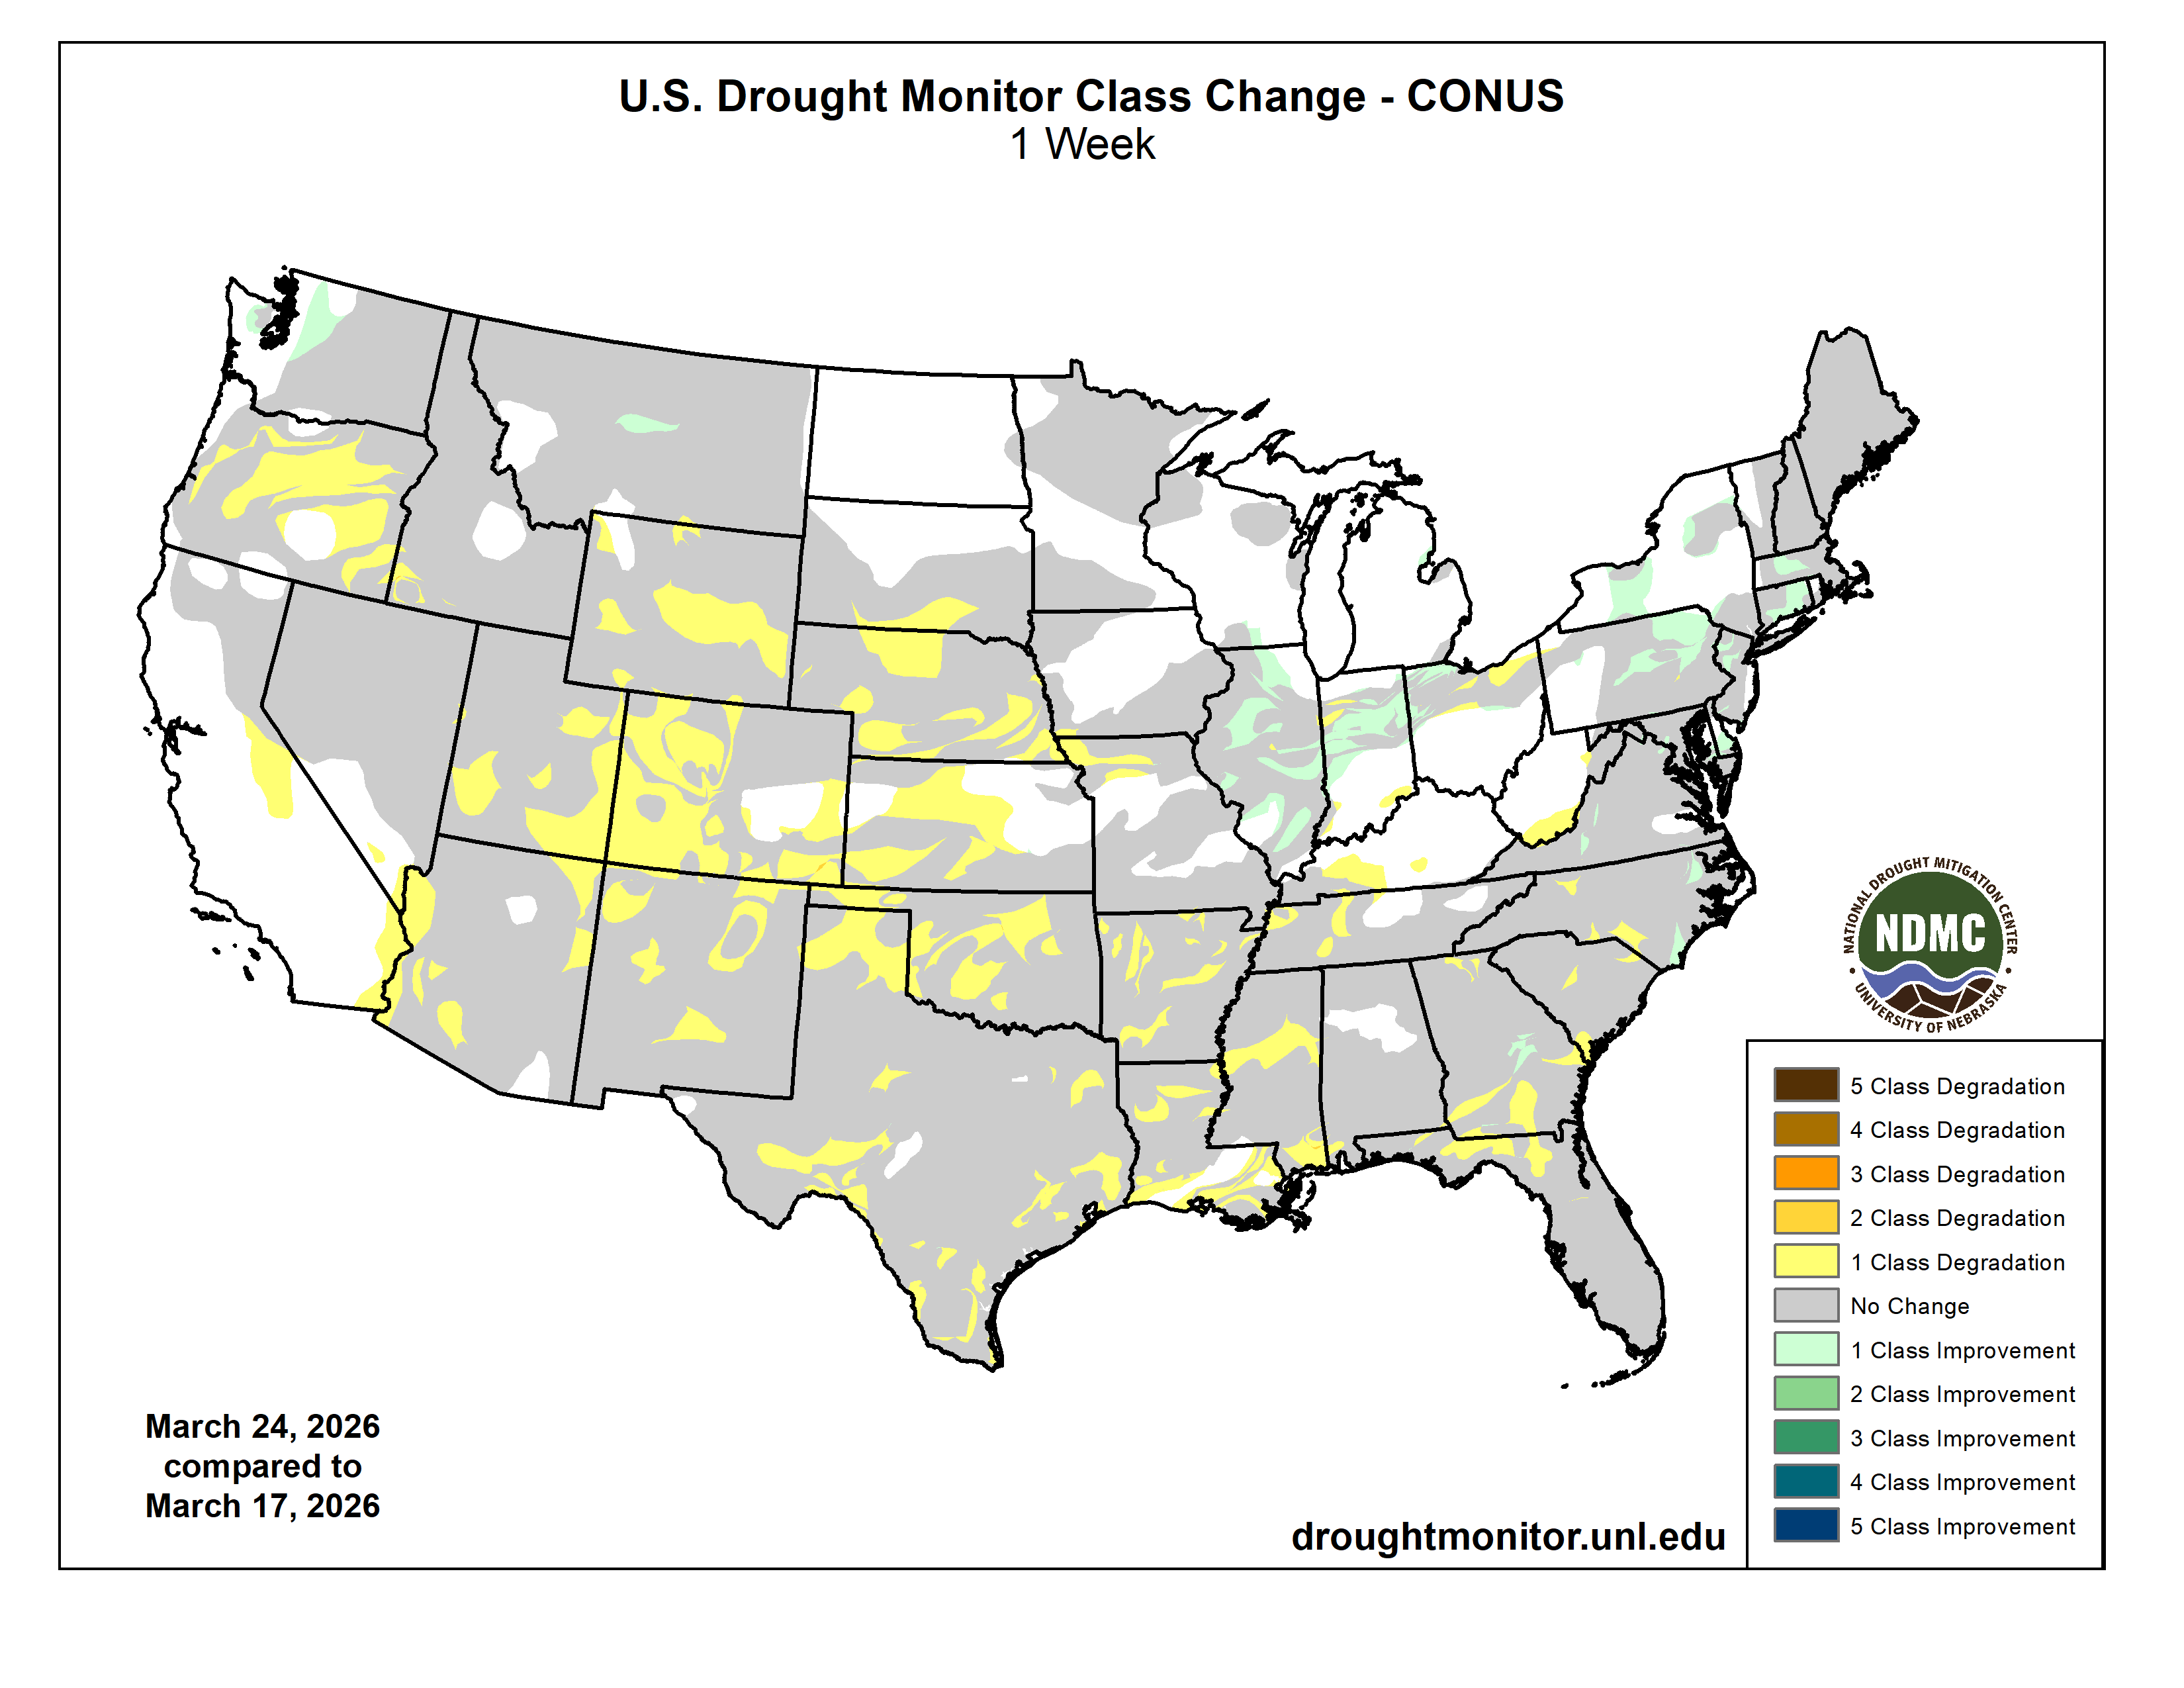
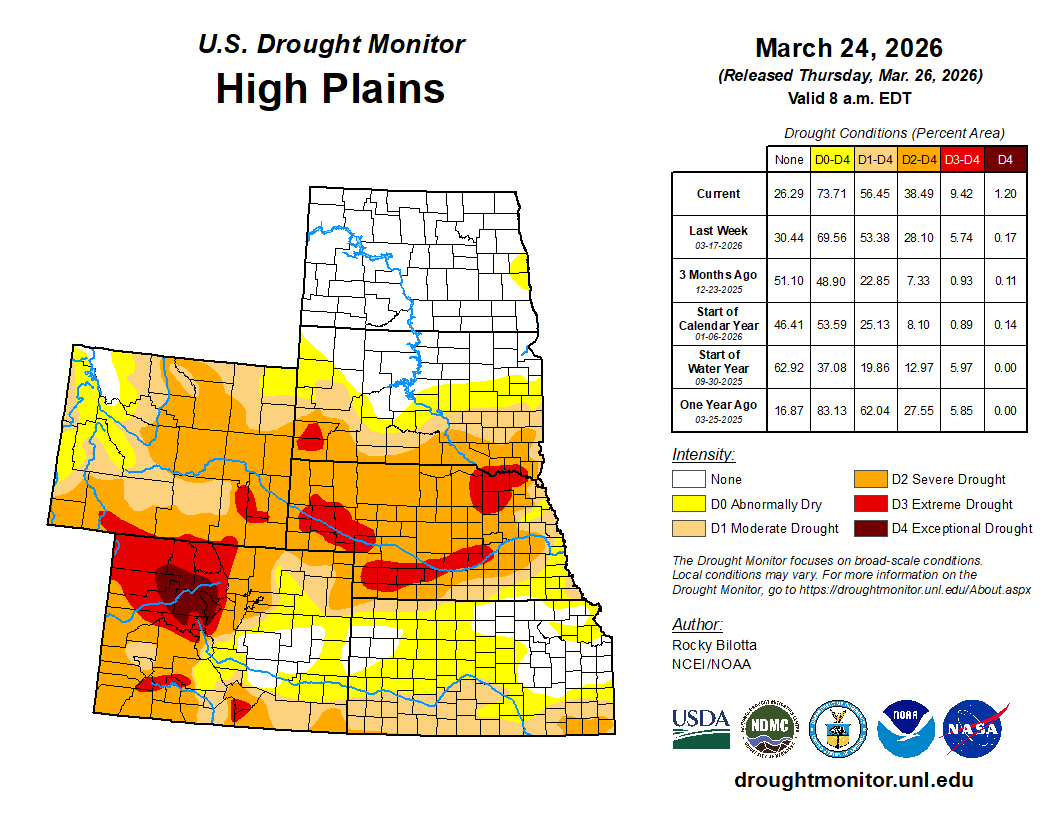
High Plains

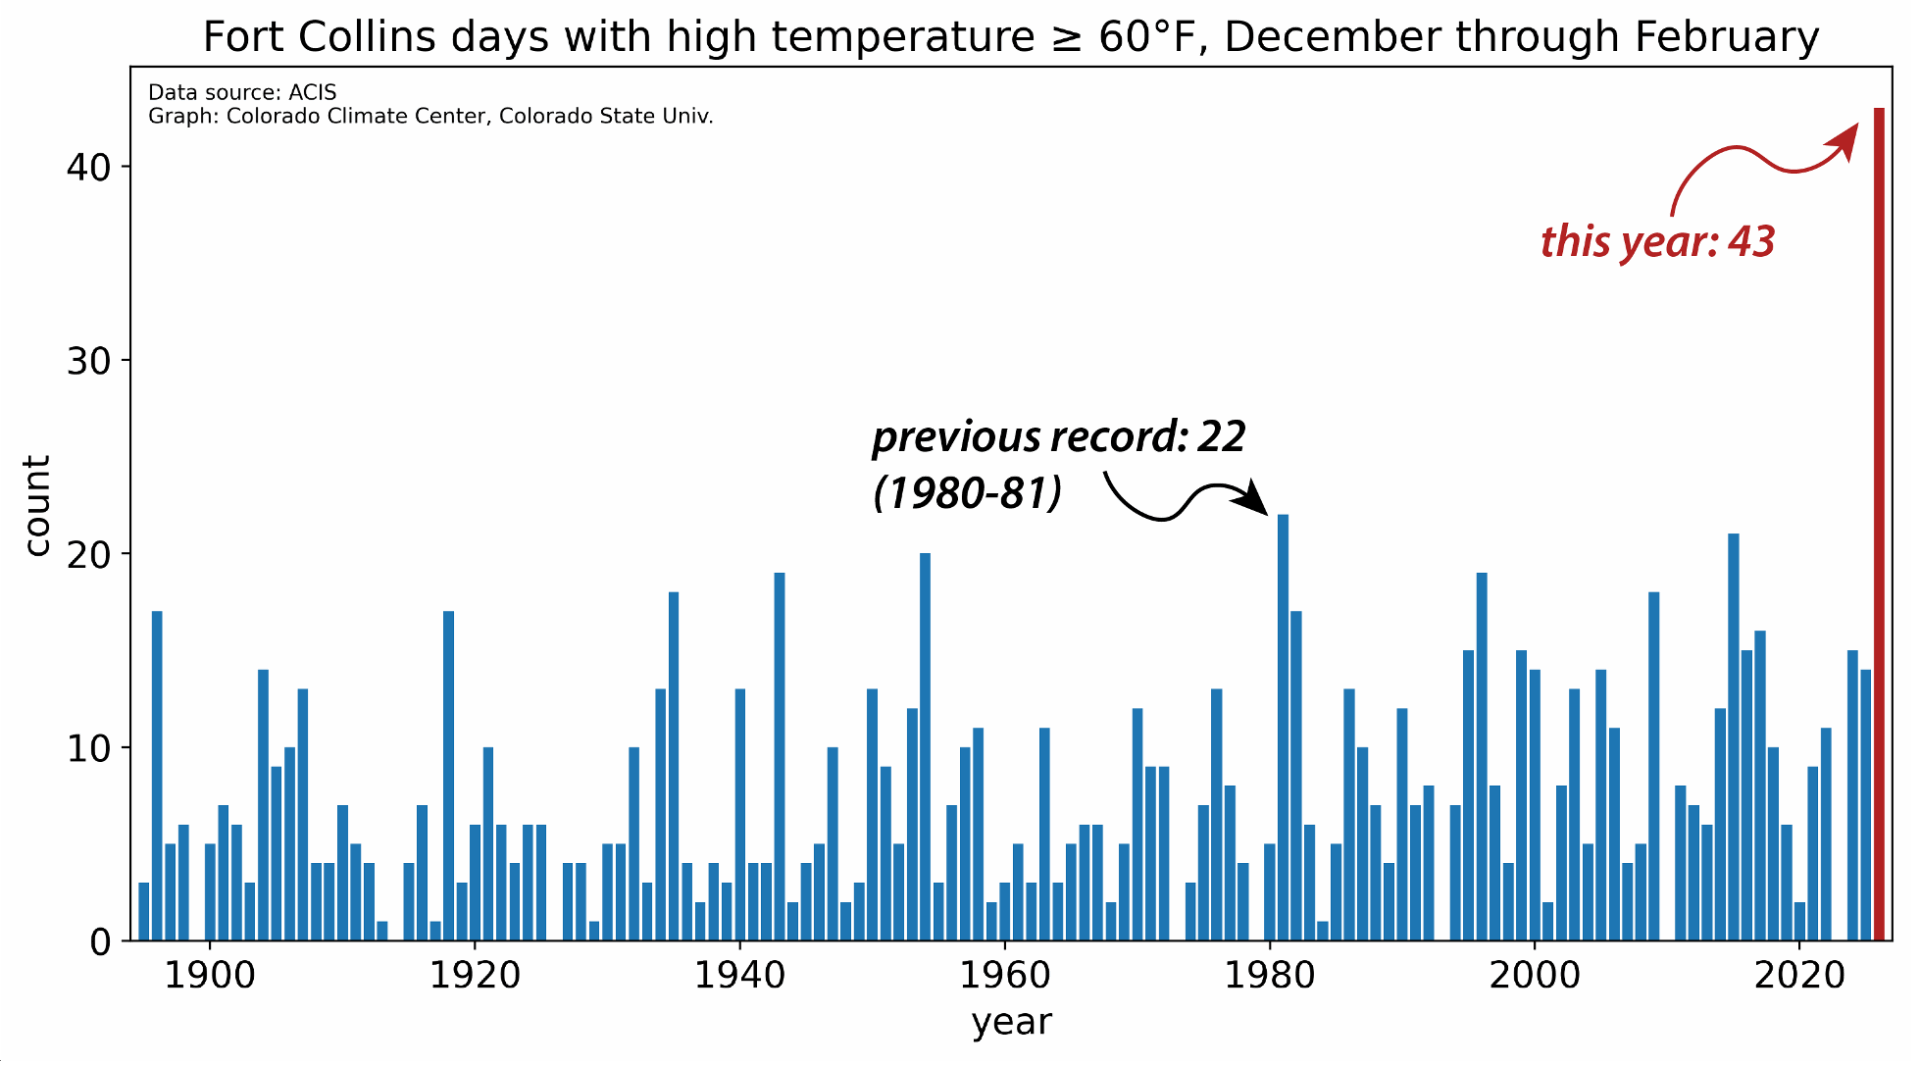
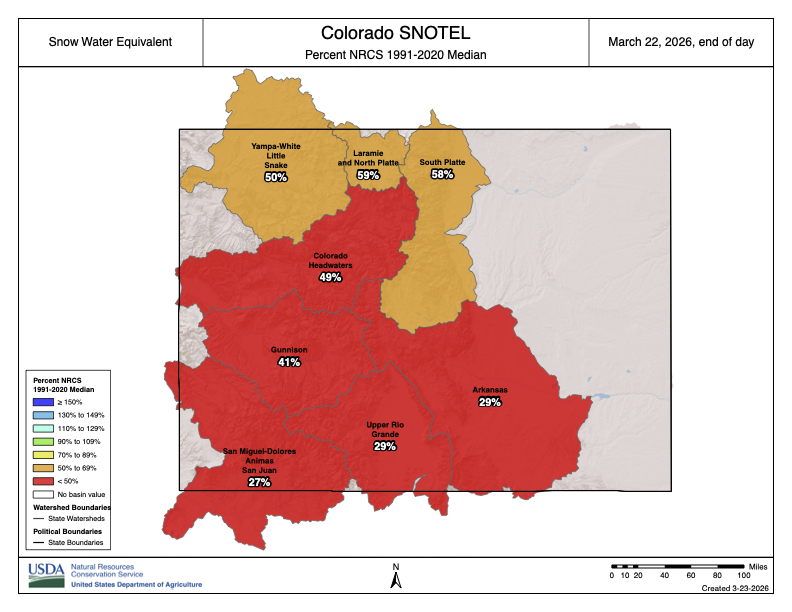
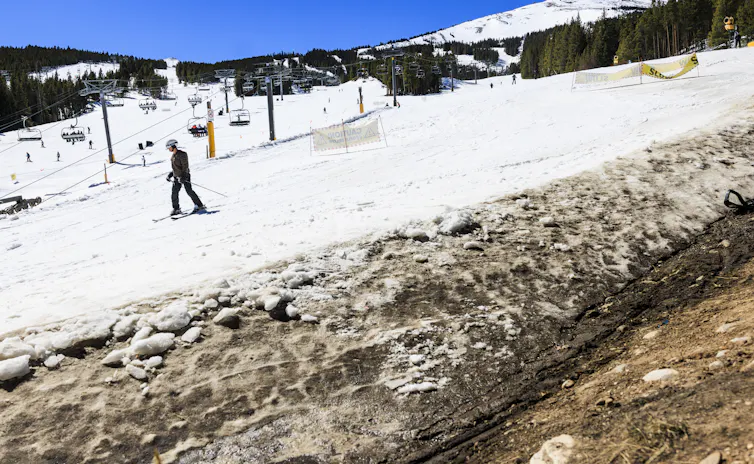
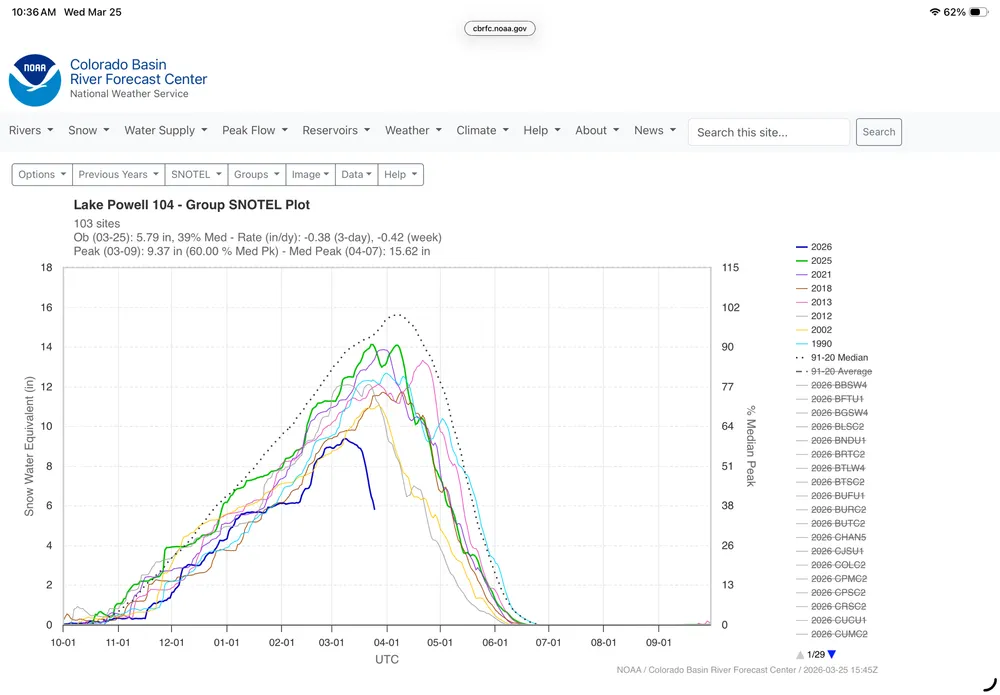
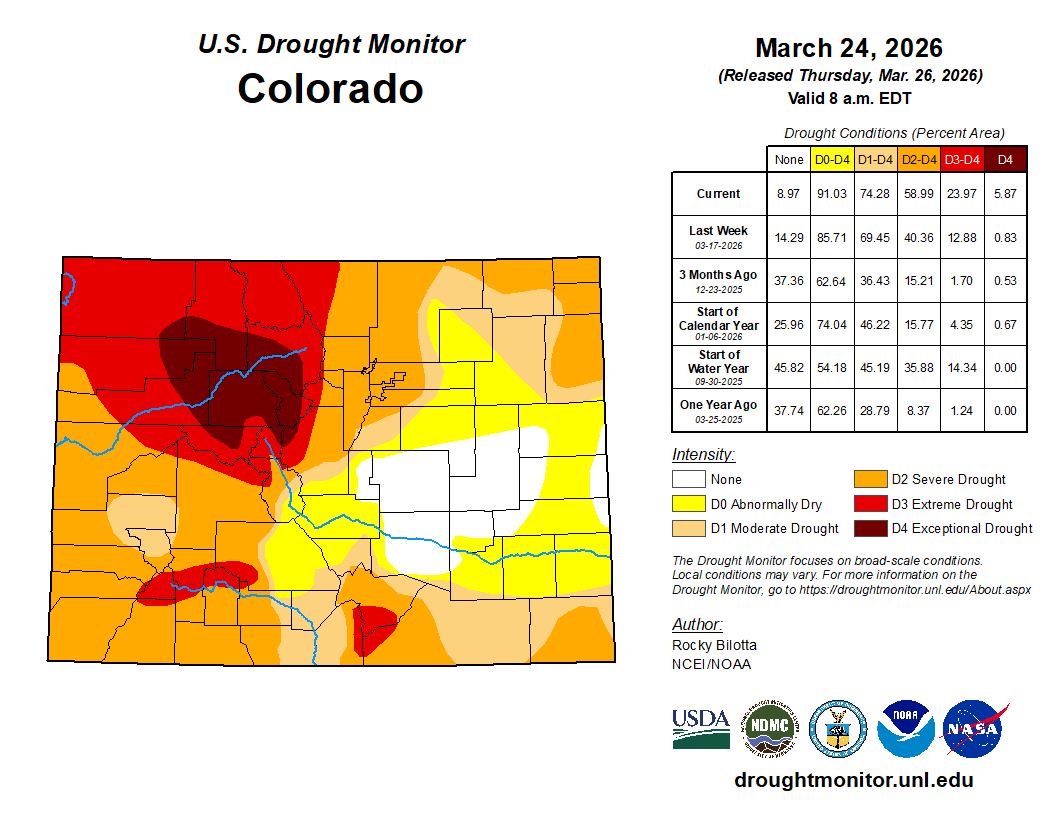
Intense, unseasonable warmth gripped the High Plains, with temperatures soaring up to 25 degrees F above normal, peaking in parts of Wyoming and Colorado. Precipitation was nearly non-existent, particularly across the southern half of the region. This severe, persistent dryness, coupled with rapidly deteriorating drought indicators, forced widespread expansion and intensification of drought categories. Exceptional drought (D4) expanded in northwest Colorado, while extreme drought (D3) grew across Colorado, southern Wyoming, and southern Nebraska. Severe drought (D2) pushed further into central and northern Wyoming, western and southern Colorado, and advanced from Nebraska into South Dakota. Moderate drought (D1) and abnormal dryness (D0) also expanded broadly across Wyoming, Colorado, Nebraska, and Kansas. No drought improvements were made in the High Plains this week…
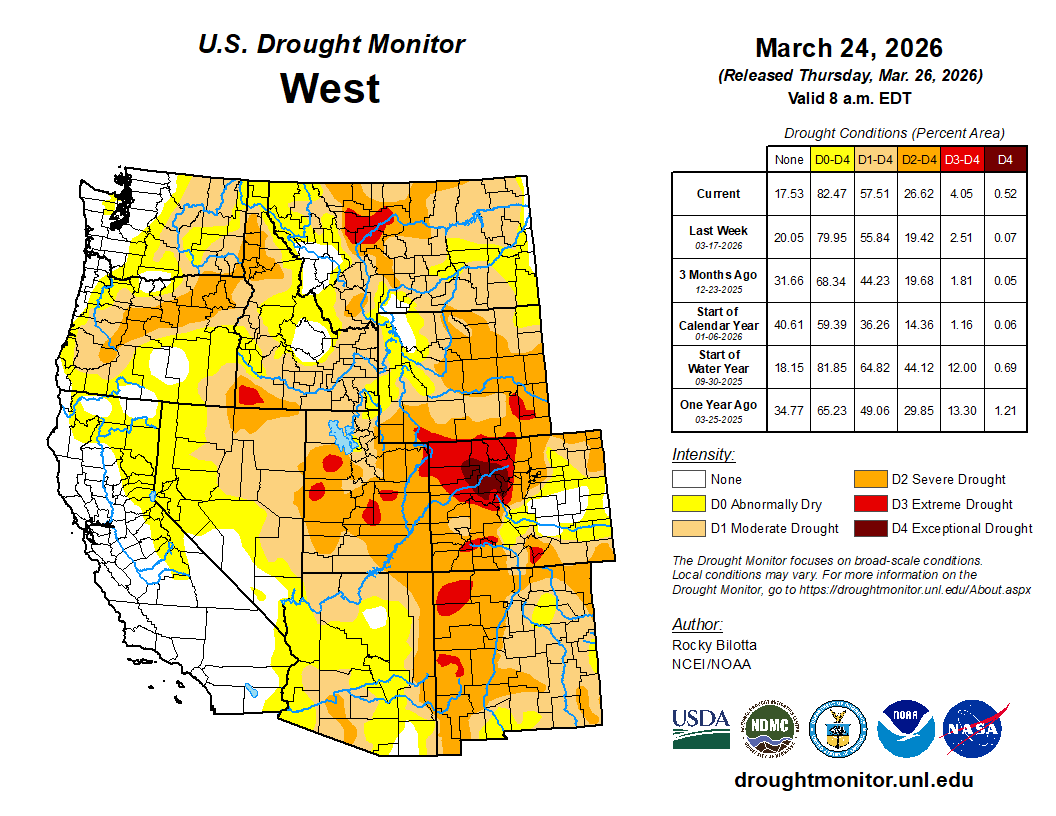
Colorado Drought Monitor one week change map ending March 24, 2026.

West

Anomalous warmth dominated the West, with nearly the much region seeing temperatures 15 to 25 degrees F above normal. Precipitation was largely absent, save for beneficial moisture in parts of Washington and Montana. This localized precipitation allowed for the reduction of severe drought (D2) in central Montana and abnormal dryness (D0) in western Washington. Elsewhere, the combination of soaring temperatures, lacking precipitation, and declining soil moisture and streamflow data resulted in broad drought degradation. Extreme drought (D3) expanded in southern Idaho, central and northeastern Utah, and northwest New Mexico. Severe drought (D2) increased in coverage across Oregon, southern Idaho, southern Montana, southern and eastern Utah, southern and eastern Arizona, and New Mexico. Finally, abnormal dryness (D0) expanded in eastern Oregon and central and southern California…

South

Hot and dry conditions dominated the South this week, driving widespread drought degradation. Temperatures soared 5 to 20 degrees F above normal across the vast majority of the region. This heat was coupled with persistent dryness, as month-to-date rainfall deficits grew to 1 to 3 inches below average (representing only 5% to 50% of normal). Deteriorating short- and long-term indicators justified the introduction and expansion of exceptional drought (D4) in southern Texas and northern Arkansas. Extreme drought (D3) was introduced in the Oklahoma Panhandle and expanded across central Oklahoma, northern Arkansas, southern Texas, and Louisiana. Additionally, severe drought (D2) worsened across parts of Oklahoma, Texas, Arkansas, Louisiana, and Tennessee, while moderate drought (D1) and abnormal dryness (D0) expanded in Texas, Mississippi, and southern Louisiana…

Looking Ahead

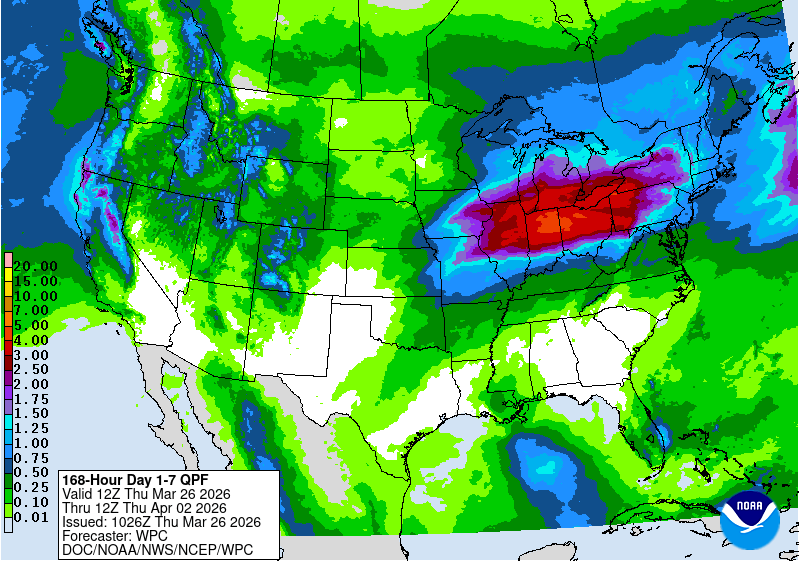
Over the next five days (March 24–28, 2026), the contiguous United States is forecast to experience another week of widespread, record-breaking warmth. A strong upper-level ridge will dominate the western and central U.S., pushing temperatures 20 to 40 degrees above average. This extreme heat, combined with dry conditions and gusty downsloping winds, will elevate fire weather risks across the High Plains on Tuesday and Wednesday. Meanwhile, a deepening low-pressure system will bring even stronger winds to the Northern Rockies. Concurrently, a potent mid-latitude cyclone will track from the Pacific Northwest toward the Canadian Maritimes. This system will initially drop moderate to heavy rain over the Northwest—potentially triggering isolated flooding—alongside high-elevation snow in the Olympics and Cascades. After weakening over the Central U.S., the system is expected to reinvigorate over the East by late next week, delivering a mix of rain to the south and snow to the north across the Great Lakes, Ohio Valley, and Northeast.

Further out, the Climate Prediction Center’s 6–10 day outlook (valid March 29–April 2, 2026) favors above-normal precipitation across much of the contiguous U.S. and Hawaii. Conversely, below-normal precipitation is favored for most of Alaska and along portions of the East Coast, stretching from southern New England to northern Florida. Probabilities for above-normal temperatures are increased across the vast majority of the lower 48 states and Hawaii, while below-normal temperatures are expected to persist across most of Alaska and much of the Northeast.

US Drought Monitor one week change map ending March 24, 2026.

Grim outlook: #Colorado faces limited water supply after record-low #snowpack — Russ Schumacher (Colorado Climate Center) #runoff

Lake Dillon, a reservoir in Colorado’s Summit County, is owned and managed by Denver Water and supplies water to people living in Metro Denver. It is Denver Water’s largest reservoir and provides about 40% of Metro Denver water. A 23-mile-long trans-basin diversion pipeline, called the Harold D. Roberts Tunnel, carries water from the reservoir under the Continental Divide to Denver. Photo credit: Colorado State University

Click the link to read the article on the Colorado State University website (Russ Schumacher):

March 25, 2026

Each day during the winter and spring, one of the first things I look at is the U.S. Department of Agriculture’s website that shows the current status of the snowpack in Colorado’s mountains.

Maybe that sounds like the strange habit of a state climatologist, but I’m far from the only one. Why? Because the snow that falls in our state’s mountains will, when it melts in the spring and summer, become a large portion of the water supply for tens of millions of people.

Those people aren’t only here in Colorado, but are in other states, Tribal nations, and Mexico, drawing their water from the rivers that originate in Colorado. Mountain snow is essential for our winter recreation industry, for farms and ranches that grow our food, for drinking water, for ecosystem health, and much more.

It hasn’t been a pretty sight when I have opened that USDA website each morning this winter. In an average year, our mountains get a lot of snow: In places like the Park Range, the West Elk Mountains or the San Juans, a typical year brings hundreds of inches of snow, carrying more than 40 inches of liquid water. This year, we struggled to get half that. Now, after an unprecedented heat wave in March, the snow is already disappearing quickly.

Figure 1: Map of annual average precipitation over 1991-2020 in Colorado, with color scale matching the colors in the state flag. Data from the PRISM Climate Group. Credit: Colorado Climate Center

As of March 25, averaged across 115 stations in Colorado’s mountains, the snow water equivalent was just 38% of the 1991-2020 average. (The snow water equivalent is the amount of water stored in the snowpack.) This represents the lowest snowpack in more than 40 years – and possibly ever – in Colorado’s mountains. Conditions haven’t been any better along the Front Range and Eastern Plains, which have also lagged far behind the average amount of snowfall.

Figure 2: Statewide snow water equivalent from the SNOTEL network, as of March 25, 2026. The median over 1991-2020 is shown with the green line, the historical range is shown from red (low) to blue (high), and this year is shown in the black line. From USDA/NRCS.

There have been other major snow droughts in the past, notably the winters of 1976-1977 and 1980-1981, that threatened the ski industry and resulted in record-low streamflow on some of Colorado’s rivers. But this snow season has been unrivaled in its warmth. The first five months of the water year – from October through February – were Colorado’s warmest on record by a large margin. And it’s almost certain that we are in the midst of the warmest March on record as well.

The warmth has been remarkably persistent, as relentless ridges of high pressure have prevented the usual snowstorms from moving into the state. The Fort Collins weather station at Colorado State University recorded an astonishing 43 days with a high temperature of 60°F or above during climatological winter (December through February). The previous record, from records dating back to the late 19th century, was 22. Starting March 18, Fort Collins had temperatures higher than had ever been observed in March, four days in a row. This was capped by a high of 91°F on March 21; there had never previously been a 90-degree day in Fort Collins before May.

Figure 3: Number of winter days with high temperatures of 60°F or above at the official Fort Collins weather station on the CSU campus. Winter 2025-2026 had 43 days, far more than the previous record of 22 in 1980-1981. Credit: Colorado Climate Center

Records for March were smashed across the state and the western U.S., at both low and high elevations. One thing we do as state climatologists is put current conditions into historical context, as usually with some investigation, it’s possible to find a past analog to what we’re experiencing now. But the intense and prolonged heat has been unlike anything previously observed in March.

This, of course, is occurring in the context of a long-term trend toward warmer conditions, both globally and locally, largely attributable to increases in greenhouse gases. Per data from the National Oceanic and Atmospheric Administration, nine of the 11 warmest years in Colorado records have occurred since 2012, and Colorado has now warmed by 3°F since the 1890s. Droughts come and go, and they have always been a challenge in Colorado and the West. But warming is making them more likely and more intense. In other words, climate change is water change.

When above-average temperatures and precipitation deficits stack up over the course of months, we start to see drought conditions develop or worsen. The impacts of drought are wide-ranging and include economic and agricultural repercussions. Farmers and ranchers may face lower crop yields and higher costs of feeding livestock. A snow drought like this winter’s can reduce outdoor recreation opportunities and hurt the state’s tourism industry. Drought years also tend to be years with more and larger wildfires.

Drought impacts can be felt a long distance from where the precipitation deficits occur. For example, southeastern Colorado received decent precipitation this winter, but low snow in the mountains hundreds of miles away near Leadville means less water on the Arkansas River, an important source for farmers in southeastern Colorado.

As each winter progresses, even if the mountain snowpack isn’t looking great, we can always look ahead to March and April as the time when big storms are possible and the deficits can be made up. Unfortunately, this year has been just the opposite: Instead of much-needed snowstorms, we’re in an unprecedented March heat wave that is accelerating the melting of what little snow is there. The chances of getting back into the range of average have dwindled away, and if the weather pattern doesn’t turn around in April, we may be headed for uncharted territory for Colorado water.

Colorado SNOTEL basin-filled map March 22, 2026.

2026’s historic snow #drought brings worries about water, wildfires and the future in the West — Alejandro N. Flores (TheConversation.com) #snowpack #runoff #ColoradoRiver #COriver #aridification

The snow drought was evident in Park City, Utah, on Feb. 9, 2026. This golf course is normally used for cross-country skiing in winter. Mario Tama/Getty Images

Alejandro N. Flores, Boise State University

Across much of the Western United States, winter 2026 was the year the snow never came. Many ski resorts got by with snowmaking but shut down their winter operations early. Fire officials and water supply managers are worried about summer.

Where I live in Boise, Idaho, temperatures hit the low 80s Fahrenheit (high-20s Celsius) in mid-March. The same heat dome sent temperatures soaring to 105 F (40 C) in Phoenix.

Ordinarily, water managers and hydrologists like me who study the Western U.S. expect the mountain snowpacks to be at their fullest around April 1. Snowpacks are natural reservoirs of water that farms and communities depend on through the hot, dry summer. Their snow water equivalent, meaning the amount of liquid water in the snowpack, is seen as a bellwether for water supplies.

But the 2026 water year has been anything but ordinary. In fact, its snow drought has few historical analogs.

Data from the U.S. Department of Agriculture’s Natural Resources Conservation Service shows that out of approximately 70 river basins across the Western U.S., only five are at or above the 1991-2020 median snow water equivalent for this time of year. Most of those are clustered around the Yellowstone region of western Wyoming and eastern Idaho.

A map of river basins shows very few with normal snow-water equivalent, primarily near Yellowstone National Park.
The majority of river basins in the Western U.S. were at less than 50% of their 1991-2020 median snow water equivalent on March 23, 2026. Natural Resources Conservation Service National Water and Climate Center

By contrast, 11 basins have less than 25% of the 1991-2020 median, and more than half are below 50%. The headwaters of critically important rivers, including the Colorado, the Columbia and the Missouri, are peppered with basins that are far below historical averages.

Other important measures of snow water storage and ecosystem health, including which areas have snow cover in the Western U.S and how long it’s been there, also point toward snow reserves that are far below recent years.

How did we get here?

Just because the Western U.S. is in a snow drought doesn’t mean it isn’t getting precipitation. Temperatures have been high enough since the start of the water year in October that a lot of what normally would have fallen as snow fell as rain instead.

The West experienced a very warm December at all but the highest elevations, but strong storms also drenched large parts of the region. Washington state was swamped with rain that triggered flooding and melted the existing snowpack.

A chart shows very low snow cover all winter compared to the arc of most years.
The total area of the Western U.S. with snow cover has been exceptionally low compared to the years 2001 to 2025. National Snow and Ice Data Center

Temperatures in January were less extreme but still warmer than historical averages. However, precipitation in January was far below the 1991-2020 average throughout much of the region. February brought precipitation conditions closer to historical averages, but temperatures were much warmer than normal.

The Western U.S., therefore, got a triple whammy: Two of the three critical snow-accumulation months were too warm, and the third was too dry.

Water worries ahead

So what does this mean for water supplies and river flows?

A recent assessment of drought conditions from NOAA’s National Integrated Drought Information System suggests 2026 will be a tight year for water supplies.

Water managers in Wyoming and Washington are already signaling that some water rights holders – cities, irrigation districts, individual farms and industries can take limited amounts of water from rivers, canals and aquifers – can expect to receive less than their full allotment of water in 2026. It’s not unreasonable to expect other states to soon follow suit.

Throughout the Western U.S., water rights are administered according to the Doctrine of Prior Appropriation – those who hold the oldest legitimate claims to water from a river, reservoir or aquifer are entitled to receive their allotments first.

Junior water rights holders who may be at risk of receiving less than their full allotment of water likely have difficult decisions ahead related to the planting and management of their crops. The challenges are compounded by the likelihood of increases in fertilizer and transportation costs associated with the ongoing war in Iran.

In the Colorado River Basin, the U.S. Bureau of Reclamation’s most probable forecast indicates water levels in Lake Powell falling below the minimum power pool elevation in December 2026. That’s bad news for power supplies, because below that level, the Glen Canyon Dam can’t produce hydroelectric power. The dam contributes power for millions of customers across seven states.

What the snow drought means for fire season

Another big concern is whether the historic snow drought is setting up the West for a bad fire season. That’s still an open question.

Rain has meant moisture is available now for plants to grow, but the lack of snowpack that normally keeps meltwater flowing through summer raises concerns about whether those plants will dry out, leaving them ready to burn.

Fire is a historically important feature of the forest and rangeland ecosystems of the West, and these ecosystems are to some degree adapted to large swings in conditions from year to year and season to season.

Because precipitation across much of the West is close to historical averages, there is snow in some of the highest-elevation mountains. And at lower elevations, some of the precipitation that fell as rain likely remains in the soils.

A skier next to open ground with a mountain in the background.
Snowmaking kept slopes skiable amid high temperatures in March 2026 in Breckenridge, Colo., but it wasn’t hard to find dry, exposed land nearby. Michael Ciaglo/Getty Images

Weather conditions in the late spring and summer – how much rain falls and how hot and dry conditions become – will play critical roles in determining the shape forests and rangelands will be in for fire season.

What this winter suggests about the future

The record-low snowpack may be a harbinger of what a warmer future will look like in the region. Many researchers have investigated how climate change will influence snowpacks and water supply throughout the Western U.S., but questions and critical challenges remain.

Among them: In years like this, with near-normal precipitation but low snowpack, are there difficult-to-observe stores of water in the deeper subsurface that can help buffer against loss of snow for periods of time? That’s one of several questions my colleagues and I have been working on.

This year’s snow drought presents a timely, albeit high-stakes, stress test for the West. Everyone will be watching.

Alejandro N. Flores, Professor of Geoscience, Boise State University

This article is republished from The Conversation under a Creative Commons license. Read the original article.

This is a graph of #snowpack above #LakePowell using 104 snow measuring stations. It was 9 inches of water on March 7, now 6 inches. Other dry years shown.There is no historical analog to this — Brad Udall #ColoradoRiver #COriver #aridification

Colorado River snowpack evolution since Oct 2025. Melt started about March 7. Down to 6
Inches now from 9 inches then. There is no historical analog.

#Hawaii teens take on the state – and win: Young plaintiffs helped secure a landmark climate settlement with the Hawaii Department of Transportation — YaleClimateConnections.org

(Image credit: Karsten Winegeart / Unsplash)

Click the link to read the article on the Yale Climate Connections website:

March 16, 2026

Transcript:

At a young age, Charlotte Madin of Oahu, Hawaii, saw the impacts of climate change firsthand, including wildfires that rained ash from the sky, and destruction to the beautiful coral reefs near her home.

Madin: “Seeing that happen in real time in front of me was really scary for me.”

Four years ago, as a young teenager, Charlotte and 12 other young people sued Hawaii’s Department of Transportation. They said the agency was not doing enough to cut climate pollution and protect children’s futures.

Charlotte testified in a deposition.

Madin: “It was very intimidating. I remember being really, really nervous for the days leading up to the deposition.”

But she says her efforts were worth it.

As part of a landmark settlement, the Department of Transportation agreed to create plans to decarbonize the transportation sector by 2045.

Madin: “And it was just so incredible to hear that all of our hard work … had paid off.”

Now in 11th grade, Charlotte serves on a youth council created by the settlement to advise on transportation planning. 

So she’s still speaking up for a healthy climate – and wants other young people to know they can, too.

Madin: “Utilizing the power of democracy and utilizing the legal system, you can do big things with your voice.” 

Reporting credit: Sarah Kennedy / ChavoBart Digital Media

Environmental Research Letter: #Snowpack decline kindles more severe fire in the western United States — Jared A. Balik, Jonathan D. Coop, and Sean A. Parks

Figure 1. Forested regions across western contiguous US with ⩾20 mm maximum snow water equivalent (SWEmax) over the 1985–2021 study period. Pixels are color-coded according to their respective Hydrologic Unit Code Level 2 (HUC2) regions. Solid black lines delineate extents of HUC2 regions, while dotted white lines denote state boundaries.

Click the link to access the research letter on the IOP Science website (Jared A. Balik, Jonathan D. Coop, and Sean A. Parks). Here’s the abstract:

Climate change is reducing winter snowpack and advancing spring snowmelt across the western United States, interacting with El Niño–Southern Oscillation (ENSO) teleconnections that drive spatially predictable interannual fluctuations that contribute to high- or low-snow winters. Early snowmelt extends the fire season, enhancing opportunities for ignition and increasing fuel dryness, both of which contribute to greater burned areas. However, relationships between snowpack on burn severity, a measure of forest loss and expected biogeochemical and hydrological impacts of fire, have not been examined. Here, using remotely sensed snow and fire data spanning 1985–2021, we examined how snowpack quantity and timing of spring snowmelt influence annual area burned and burn severity at the watershed scale. Early snowmelt was associated with earlier occurrences of fire ⩾400 ha and greater annual area burned, whereas low snowpack water content was associated with more severe burn outcomes including greater mean composite burn index (CBI) and larger proportions of high severity fire (CBI ⩾ 2.25). Thus, low-snow winters with early snowmelt may prime forested watersheds to dry, burn, and experience high severity fire. These outcomes are consistent with enhanced fuel dry-down: early snowmelt extends the dry-down window while low snowpack quantity portends greater fuel aridity during the dry period. Our findings also highlight how the ENSO interacts with directional warming: El Niño phases amplify trends of snowpack loss and increasing area burned severely in northwestern watersheds but dampen these trends in southwestern watersheds, while La Niña phases exert the opposite effect. Projected warming, potentially accompanied by greater ENSO variability and extremes, points toward a future of reduced snowpack, earlier snowmelt, and increased area burned at high severity in forests where snowpack historically buffered fire risk, with attendant losses in forest carbon storage and disrupted hydrological function of forested watersheds.

Navajo Dam Operations Meeting [Virtual] – April 21, 2026 1-3pm — Reclamation #SanJuanRiver #ColoradoRiver #COriver #aridification

The San Juan River near Navajo Dam, New Mexico, Aug. 23, 2015. Photo credit: Phil Slattery Wikimedia Commons

From email from Reclamation:

March 20, 2026

Reclamation conducts Public Operations Meetings three times per year to gather input for determining upcoming operations for Navajo Reservoir. Input from individuals, organizations, and agencies along with other factors such as weather, water rights, endangered species requirements, flood control, hydro power, recreation, fish and wildlife management, and reservoir levels, will be considered in the development of these reservoir operation plans. In addition, the meetings are used to coordinate activities and exchange information among agencies, water users, and other interested parties concerning the San Juan River and Navajo Reservoir. The next meeting will be held virtually on April 21st


Microsoft Teams

Join the meeting now

Meeting ID: 247 128 548 928 44

Passcode: Yn6ih2Q6


Dial in by phone

+1 202-640-1187,,923961898# United States, Washington

(833) 436-1163,,923961898# United States (Toll-free)

Find a local number

Phone conference ID: 923 961 898#

Join on a video conferencing device

Tenant key: teams@conferencing.doi.gov

Video ID: 114 427 248 3

More info