Want to solve #ClimateChange? This #California farm kingdom holds a key — The Los Angeles Times #ColoradoRiver #COriver #aridification

Southern California’s Imperial Valley. Ted Wood/The Water Desk

Click the link to read the article on The Los Angeles Times website (Sammy Roth). Here’s an excerpt:

…welcome to the Imperial Valley. Wedged in Californiaโ€™s southeastern corner, itโ€™s one of the most important places youโ€™ve probably never been. To one side of [Ralph] Strahmโ€™s farm is the Sonoran Desert at its most stark, where creosote-studded washes give way to glimmering sand dunes and craggy mountain peaks. To the other side is an astonishingly productive agricultural empire. Nearly half a million acres of lush green fields sprawl into the distance, popping out lettuce, sugar beets, onions, cattle feed and more…

But keeping the vegetable aisle stocked comes at a cost. Imperial County farm barons use more Colorado River water than the rest of California combined. And as the planet heats up, thereโ€™s less and less water to go around…

Clean energy advocates see Imperial as an ideal place for solar farms and battery projects that can help solve the American Westโ€™s energy and water crises. The land is flat; the sunlight, abundant. The Colorado River desperately needs relief. And Imperial is one of Californiaโ€™s poorest counties, its agriculture-heavy economy practically crying out for diversification and higher-paying jobs But resistance to change runs deep, particularly among the few hundred families who own all the farmland. Agriculture is the only way of life many of them have known, and theyโ€™re raring to defend it. Their ancestors settled here a century ago, staking an early claim to the Colorado and carving canals to carry its riches through the desert. Again and again, theyโ€™ve faced pressure to sell water to coastal cities. Theyโ€™re ready to pounce on anything that smells like a water grab. And to some of them, solar power smells like a water grab…

Lurking beneath these battles are urgent questions with no easy answers: What is the landโ€™s best use? Who gets to decide? And how do we balance water conservation, food production and clean power generation in an era of climate emergency?

A solar farm off CO 17 in Alamosa County. The San Luis Valley produces 10 percent more power per solar panel than anywhere else in the state due to its base elevation of 7,500 feet and more days of sun than the Front Range and anywhere else in Colorado. Photo by Owen Woods via The Alamosa Citizen

#Snowpack levels in major Summit County river basin reach 121% above 30 year median (January 20, 2023) thanks to recent storm systems — The Summit Daily #BlueRiver #ColoradoRiver #COriver

Click the link to read the article on the Summit Daily website (Cody Jones). Here’s an excerpt:

According to the National Weather Service, the last winter storm frontย  โ€” which hit Summit County from the evening of Tuesday, Jan. 17, to Wednesday afternoon โ€”ย  brought anywhere from 3 to 7 inches of fresh snow, though local ski resorts reported higher totals at their high-elevation snow stakes…The new snow helped to further push the Blue River Basinโ€™s snowpack in the right direction to aid summer runoff and water levels…According to data from theย National Resources Conservation Service,ย the Blue River Basinโ€™s snowpack and snow water equivalent is currently reading at 9.6 inches as of Thursday, Jan. 19. This weekโ€™s snowfall boosted the snowpack from 9.4 inches on Wednesday and 8.9 inches from the beginning of the week on Sunday, Jan. 15…Currently the snowpack in the Blue River Basin is at 121% of the 30-year median and 58% of the median peak.

West snowpack basin-filled map January 19, 2023 via the NRCS.

The Spring Predictability Barrier: weโ€™d rather be on Spring Break — NOAA

Click the link to read the article on the NOAA website (Michelle L’Heureux):

Itโ€™s that time of year again when ENSO forecasters stare at the latest analysis and model forecasts and shake their heads in frustration. Why?  Weโ€™re in the heart of the so-called โ€œSpring Predictability Barrier,โ€ which is when the models have a harder time making accurate forecasts. Itโ€™s like trying to predict the next episode of Mad Men based on the tiny amount of detail given in the โ€œas seen on the next episodeโ€ clips. As we know from Tomโ€™s posts on verification (hereherehere), there are many ways to measure the accuracy, or skill, of seasonal climate predictions. Here, we will focus on just one measure (1), but there are other ways to gauge the spring barrier.

What is the Spring Barrier?

Is the Spring Barrier like a brick wall? In other words, do we smack right into it and cannot see or predict anything beyond it? No, not really. It is more like a lull or a valley in ENSO forecasting accuracy. After the spring (or the autumn for our friends in the Southern Hemisphere), the ability of the models to predict becomes increasingly better. Keep in mind that, in general, the skill of the models get better the closer you get to the period of time you are predicting. If you want to know whether it is going to rain, you are usually better off using a prediction the day before than you are a week out. The same is true in seasonal climate outlooks. However, during the spring, even making an ENSO forecast for the coming summer is pretty difficult.

April 2015 is almost over, and so how useful have the model forecasts been if we want to predict ENSO for the May-June-July (MJJ) season (2)? As you will see, the Spring Barrier is the climate forecasterโ€™s equivalent of mayhem. In a perfectly predictable world, we would be able to predict 100% of ENSO variability.ย  But statistical models (3) barely register a pulse, describing almost none of the fluctuations in ENSO during the MJJ season. State-of-the-art dynamical model (4) donโ€™t fare much better, only accurately predicting about less than a third (33%) of ENSO variability in the MJJ season. So, even for the closest period coming up, ENSO forecasters canโ€™t say a lot about it!

The skill (or forecasting ability) of model runs based on February, March, and April observations to predict the May-July (MJJ) average value in the Niรฑo-3.4 SST region (ENSO). Results shown here are an average correlation coefficient from each of the 20 models between 2002-2011 (data used from Barnston et al, 2012). Percent Explained Variance (%) is calculated by squaring the correlation coefficient and multiplying by 100 (see footnote #1). Models that explain all ENSO variability would equal 100%, while explaining none of the ENSO variance would equal 0%. Graphic by Fiona Martin based on data from NOAA CPC and IRI.

Now letโ€™s shift our attention to making an ENSO prediction for the coming winter season (for the November-January seasonal average). How useful are the models? Well, if youโ€™re running a model using October data as input, then youโ€™re in pretty good shape as you can expect close to 90% of the winter ENSO fluctuations to be predicted. In terms of lead time, thatโ€™s the same horizon as a forecast made in April for May-June-July (MJJ), and yet there is a huge difference in forecasting ability (5).

The skill (or forecasting ability) of model runs based on February-October observations to predict the November-January (NDJ) average value in the Niรฑo-3.4 SST region (ENSO). Results shown here are an average correlation coefficient from each of the 20 models between 2002-2011 (data used from Barnston et al, 2012). Percent Explained Variance (%) is calculated by squaring the correlation coefficient and multiplying by 100 (see footnote #1). Models that explain all ENSO variability would equal 100%, while explaining none of the ENSO variance would equal 0%. Graphic by Fiona Martin based on data from NOAA CPC and IRI.

However, hope slowly grows as we emerge from the spring. In particular, models run based on May data are getting close to explaining half of the coming winter variability, which isnโ€™t shabby. 

But, still, predictions are still far from assured. Using July and August data, about three-quarters of the winter ENSO fluctuations are predicted by the models. So while forecast โ€œsurprisesโ€ are becoming less frequent, they still lurk around.

Overcoming the Spring Barrier?

So, why is the accuracy of the models so bleak during the spring? Is there reason to believe that more model development will improve upon the low skill we see during the spring? While there are many ideas on why the spring barrier exists, there are no definitive culprits (Webster and Yang, 1992, Webster, 1995, Torrence and Webster, 1998, McPhaden, 2003, Duan and Wei, 2013). 

One of the reasons that the spring barrier is said to exist is because spring is a transitional time of year for ENSO (in our parlance,ย signals are low and noise is high). The spring is when ENSO is shifting aroundโ€” often El Niรฑo/La Niรฑa events are decaying after their winter peak, sometimes passing through Neutral, before sometimes leading to El Niรฑo/La Niรฑa later on in the year. It is harder to predict the start or end of an event than to predict an event that is already occurring. There is also weaker coupling between the ocean-atmosphere in the spring due to a reduction in the average, or climatological,ย SST gradientsย in the tropical Pacific Ocean. However, for various reasons, these factors donโ€™t fully explain why we see lower skill (6).

Seasonal allergies… the real cause of the Spring predictability barrier. Illustration by Emily Greenhalgh, NOAA Climate.gov.

One โ€œclueโ€ for the barrier lies in the fact the dynamical models perform better compared to the statistical models during the spring (see figure above: the blue bars are larger than the green bars). In fact, just during the last decade, dynamical models have slightly edged statistical models in their overall ENSO forecast ability because of their improvement during the spring (Barnston et al., 2012). During the other seasons, running a statistical or dynamical model gives you about the same amount of ENSO forecast skill. 

What is special about dynamical models during the spring? One of the attributes of dynamical models is that they are run more frequently using the most recent observed data as input. Many statistical models are built on monthly or seasonal (3-month) average data, so by comparison, are receiving inputs that are relatively older.  Dynamical models also ingest a lot more observations (such as the subsurface ocean) using complex data assimilation schemes. These qualities may allow dynamical models to โ€œseeโ€ better and potentially lock onto potentially important changes that occur during the spring. But keep in mind this increased skill is relative to the statistical models– the dynamical model skill is still low overall.    

As Eric Guilyardi wrote inย his blog postย last week, there is room to improve models by better understanding their errors and improving the assimilation of observational data. Potentially, with more research and development, we will see the models become more skillful during the spring. Until then, ENSO forecasters would rather be on spring break.

Footnotes:

(1) As a first step, we calculate the โ€œcorrelation coefficientโ€ or the Pearsonโ€™s correlation coefficient. We also introduced this concept in Tonyโ€™s blog post discussing the ENSO skill over the past couple of years. The correlation coefficient ranges between 0 (no skill) and -1/+1 (perfect skill). However, in the figures above, we put it in terms of โ€œexplained variance,โ€ by squaring the coefficient and multiplying by 100. Explained variance can range from 0% to 100%. 0% means that the models describe none of the variability of the ENSO index (the wiggles or ups and downs in the time series). 100% means that the models predict all of the fluctuations in the ENSO. So, ideally, want to see 100% variance explained even though that will never happen because our world is not perfectly predictable. 

(2) We use data gathered during a 10-year period of operational model runs, which are presented on the IRI/CPC plume of Niรฑo-3.4 SST index predictions (Barnston et al., 2012). Un-gated copy is available here

(3) Statistical models: computer models that predict how current conditions are likely to change by applying statistics to historical conditions. Physical equations of the ocean and atmosphere are not used. These models can be run on a small desktop computer.

(4) Dynamical models: computer models that predict various oceanic, atmospheric, and land parameters by solving physical equations that use current โ€œinitialโ€ conditions as input. State-of-the-art dynamical models must be run on high-performance supercomputers.

(5) Because of the limited length of the operational model runs, we expect that the 95% level of significance isnโ€™t achieved until the explained variance is greater than ~45% (based on 9 degrees of freedom and using the sampling theory of correlations). Therefore, there is a fair chance that values not reaching that threshold may be randomly achieved and therefore are not particularly meaningful. 

(6) In the opinion of the author and some of her colleagues, there is a bit of a chicken-egg problem by arguing that lower skill of the models is due to the transitional nature of ENSO or the low signal-to-noise ratio in the spring. Low predictability and low signal-to-noise go hand-in-hand.  One does not cause the other. Also, the fact that the climatological SST gradient is at a minimum during the spring doesnโ€™t clearly explain why ENSO — which is a departure from climatology (or anomaly) — would also be impacted (and the opposite should be true in the autumn when the SST gradient is maximized– yet ENSO peaks during the winter). 

References:

Anthony G. Barnston, Michael K. Tippett, Michelle L. L’Heureux, Shuhua Li, and David G. DeWitt, 2012: Skill of Real-Time Seasonal ENSO Model Predictions during 2002โ€“11: Is Our Capability Increasing?. Bull. Amer. Meteor. Soc., 93, 631โ€“651.

Duan, W. and Wei, C. (2013), The โ€˜spring predictability barrierโ€™ for ENSO predictions and its possible mechanism: results from a fully coupled model. Int. J. Climatol., 33: 1280โ€“1292. doi: 10.1002/joc.3513

McPhaden, M. J. (2003), Tropical Pacific Ocean heat content variations and ENSO persistence barriers, Geophys. Res. Lett., 30, 1480, doi:10.1029/2003GL016872, 9.

Torrence, C. and P. J. Webster, 1998: The Annual Cycle of Persistence in the El Niรฑo-Southern Oscillation. Q. J. Roy. Met. Soc., 124, 1985-2004.

Webster, P. J. , 1995: The annual cycle and the predictability of the tropical coupled ocean-atmosphere system. Meteor. Atmos. Phys., 56, 33-55.

Webster, P. J. and S. Yang, 1992: Monsoon and ENSO: Selectively Interactive Systems. Quart. J. Roy. Meteor. Soc., 118, 877-926.

#GunnisonRiver, #TaylorRiver earn Gold Medal trout fishery status — #Colorado Parks & Wildlife

A rainbow trout is pictured during survey work of the Taylor River below Taylor Park Reservoir. (Jerry Neal/CPW photos taken from video)

Click the link to read the release on the Colorado Parks & Wildlife website (John Livingston):

Years of consideration and conservation work all led to a golden moment for two pristine rivers in central Colorado.

During its meeting Jan. 18 in Colorado Springs, the Colorado Parks and Wildlife Commission welcomed the Gunnison and Taylor Rivers as the newest Gold Medal trout fisheries in the state. CPWโ€™s Gold Medal Program showcases the most elite fisheries throughout the state.

The stretches nominated and approved include 20 miles of the Taylor River below Taylor Park Reservoir and 12.5 miles of the Gunnison River starting west of the town of Gunnison at Twin Bridges extending up to the town of Almont.

โ€œIโ€™m pretty excited to be able to announce these two waters into our Gold Medal Program,โ€ said CPW Assistant Aquatic Section Manager Josh Nehring. โ€œItโ€™s an achievement that came about by a lot of work by a lot of people over a number of decades. Itโ€™s amazing to see the quality of fisheries that we have here.โ€

Fisheries in Colorado may be designated by CPW as โ€œGold Medalโ€ if they meet two qualifying criteria. The standard is 60 pounds of fish per acre along with at least 12 quality trout of 14 inches or greater per acre.

With the addition of the Gunnison and Taylor Rivers, Colorado now boasts 19 Gold Medal sections on 13 rivers that total roughly 362 miles. The state also has three lakes that have earned Gold Medal designation.

While the Gunnison and Taylor are newly-designated Gold Medal streams, CPW aquatic biologists believe the rivers have produced Gold Medal quality trout fishing since the 1990s. 

CPW Aquatic Biologist Dan Brauch said that while the rivers had met the biological criteria for designation for decades, it was important to ensure the streams provided long-lasting fish habitat for all life stages of trout.

โ€œSignificant work went into maintaining conditions on the Gunnison and Taylor Rivers to allow those fisheries to continue to persist,โ€ Brauch said. โ€œWe have sampled the rivers quite a few times in the last 10 years, and we continued to see good numbers of quality-size trout and abundant trout.

โ€œThe Gunnison and Taylor Rivers really represent a successful conservation story with lots of partners that have made this fishery what it is today.โ€

CPW surveys streams regularly through the process of electrofishing. Fish are collected, weighed, measured and returned to the water. Data collected through these surveys provides invaluable data for CPW to assess the health of a fishery and to determine waters worthy of Gold Medal nomination.

โ€œIt does take quite a bit of work to get fisheries to this standpoint,โ€ said Nehring, who grew up in neighboring Montrose and has enjoyed fishing the two rivers since he was a child. โ€œJust the habitat that goes into it, the monitoring of the fisheries, making sure our regulations are appropriate and we arenโ€™t getting too many fish harvested. There are a lot of things that go into making sure the system is healthy.โ€

Brauch and Nehring thanked a multitude of public and private partners that have come together throughout time to support the Gunnison and Taylor fisheries as work has been done to improve and protect trout habitat through the Gold Medal stretches.

While celebrating the conservation success story that has led to Gold Medal status for the rivers, CPW Area Wildlife Manager Brandon Diamond encouraged anglers to help protect these resources for generations to come.

โ€œItโ€™s extremely important right now for all water users and conservation-minded people, including anglers, to view these incredible resources through a stewardship lens,โ€ Diamond said. โ€œAnd I strongly encourage all of us to evaluate how we can contribute to the long-term conservation of these waters and how we fit in as stewards of the land and river resources.

โ€œThe Gold Medal designation is certainly something we are locally proud of. The Gunnison Valley has always been very supportive of wildlife conservation values, and we hope to continue that relationship moving forward.โ€

The latest seasonal outlooks through April 30, 2023 are hot off the presses from the #Climate Prediction Center

#Drought news January 19, 2023: Heavy precipitation helped erase areas of abnormal dryness in parts of #WA, #OR, W. #WY, W. #Colorado, #AZ and #NM

Click on a thumbnail graphic to view a gallery of drought data from the US Drought Monitor website.

Click the link to go to the US Drought Monitor website Here’s an excerpt:

This Week’s Drought Summary

An atmospheric river brought heavy rain and high-elevation snow across part of the West, leading to drought improvements in California, the Pacific Northwest, the northern Rockies and the Great Basin. A band of heavy rainfall, combined with severe weather, impacted the Southeast, leading to areas of drought improvement in Georgia. Meanwhile, persistent dryness led to the expansion of drought in the Carolinas. Drought in the High Plains remains largely unchanged; much of the excess moisture is tied up in snowpack and its effects on soil moisture and groundwater recharge remain to be seen. Drought expanded across parts of the South where short-term moisture deficits on top of longer-term drought continue to build…

High Plains

Much of the High Plains remained in a holding pattern last week. Areas that received abundant snowfall over the Water Year are slow to make improvements due to the long-term nature of drought in the region. Until spring melt shows verified evidence of soil moisture and groundwater recharge, it will be difficult to tell how much effect snow has had on drought conditions. Severe (D2) drought improved in eastern North Dakota, which has received 16 to 20 inches of snow this season. No areas deteriorated significantly, except for areas of abnormal dryness (D0) in South Dakota and Colorado…

Colorado Drought Monitor one week change map ending January 17, 2023.

West

The long-term drought continues across California, the Great Basin and parts of the Pacific Northwest. However, a barrage of atmospheric river events โ€“ streams of moisture in the atmosphere that transport water vapor from the tropics โ€“ has reduced the drought intensity over the past few weeks. In California, 1-category improvements were made along the Northern Coast, around the Delta and along the South Coast region. While precipitation over much of the state was over 300% of normal over the previous 2 weeks (2 to 12.5 inches, depending on location), deficits have been years in the making. While this last round of rain has helped return smaller reservoirs to the historical averages, many of the larger reservoirs still remain below the historical average for this time of year. Historically, long-term drought is interrupted by a period of abnormally wet weather. However, itโ€™s too early to tell if the wet weather is enough to end the drought. Many other parts of the West also saw improvements to drought and abnormally dry areas. In Oregon, 1-category improvements were made to extreme (D3) and severe (D2) drought in the southeast and near Klamath County based on above-average snow water equivalent and improvements to long-term indicators such as 6- to 24-month precipitation and shallow groundwater. In Idaho, severe (D2) and moderate (D1) drought improved where precipitation deficits over the past 12 months and streamflows show improvement. In Utah, areas of D3 and D2 improved based on precipitation in excess of 300% of normal (3 to 10 inches, depending on location) over the last 30 days and its resulting effect on streamflows, soil moisture, and groundwater. Heavy precipitation helped erase areas of abnormal dryness in parts of Washington, Oregon, western Wyoming, western Colorado, Arizona and New Mexico. The only places in the West seeing an expansion of drought were Oregon and Colorado. In Oregon, D1 was introduced in the south Willamette Valley and central Oregon Cascades and D1 and D2 expanded in the north-central part of the state. These expansions were in response to below-normal water-year-to date precipitation on top of longer-term deficits and groundwater impacts…

South

Much of Oklahoma and Texas missed out on this weekโ€™s precipitation events, resulting in the expansion of drought. In Oklahoma, temperatures averaged 10 to 13 degrees above normal over the previous 2 weeks while precipitation has been less than 50% of normal over the past 4 months. Extreme (D3) drought expanded in response to well-below-normal (10th percentile or lower) measurements of streamflow, groundwater and soil moisture conditions. Texas also saw a swath of degradations from the north-central region to South Texas where short-term moisture deficits, on top of longer-term drought, have continued to build, and streamflow, soil moisture and groundwater levels range from below (10th to 24th percentile) to well below normal (10th percentile or lower). In the eastern part of the region, last weekโ€™s rainfall erased lingering areas of abnormal dryness…

Looking Ahead

The National Weather Service Weather Prediction Center forecast for the remainder of the week (valid January 18 โ€“ January 20) calls for a winter storm to bring freezing rain and snowfall to the High Plains and Upper Midwest. To the southeast, showers and thunderstorms are expected with localized areas of heavy rainfall. Chances will increase for a wintry mix of snow, sleet and freezing rain along the East Coast as the storm system moves into the northeast on Thursday. Much of the southern U.S. can expect unseasonably warm temperatures. Meanwhile, another storm system is expected to move southeastward through the Pacific Northwest into the Northern Rockies, the Great Basin, California and the Desert Southwest, bringing rain and snow at lower elevations and heavier mountain snow. Moving into next week (valid January 21 โ€“ January 25), the forecast calls for a storm system to track from the central Plains to the Northeast, bringing strong winds and wintry weather to the northern regions and rain to the south. At 8 โ€“ 14 days, the Climate Prediction Center Outlook (valid January 25 โ€“ January 31) calls for below-normal temperatures over most of the country except for the Northeast, Southeast and Alaska. The Northeast can expect near-normal temperatures, while the Southeast and Alaska have the greatest probability of warmer-than-normal temperatures. Most of the U.S. can expect near- to slightly above-normal precipitation. Only the Pacific Northwest and northern Minnesota have increased odds for below-normal precipitation.

US Drought Monitor one week change map ending January 17, 2023.

Interior Assistant Secretary Trujillo Highlights Bipartisan Infrastructure Law #Drought Resilience Investments in #Colorado: $5 million investment in Prairie Waters Projects to expand water supplies in #Aurora #SouthPlatteRiver

Click the link to read the article on the Department of Interior website:

Assistant Secretary for Water and Science Tanya Trujillo wrapped up a multi-day visit to Colorado today, where she highlighted investments from President Bidenโ€™s Bipartisan Infrastructure Law and Inflation Reduction Act in drought resilience.

The Bipartisan Infrastructure Law allocatesย $8.3 billionย for Bureau of Reclamation water infrastructure projects over the next five years to advance drought resilience and expand access to clean water for families, farmers, and wildlife. The investment will repair aging water delivery systems, secure dams, complete rural water projects, protect aquatic ecosystems and fulfill Indian Water Rights Settlements. The Inflation Reduction Act is investing another $4 billion to address the worsening crisis. Combined these two initiatives represent the largest investments in climate resilience in the nationโ€™s history and provide a once-in-a-generation opportunity for the work of the Interior Department.

UV pretreatment Peter D. Binney Purification Facility.

Today [January 13, 2023] , she joined Congressman Jason Crow, Colorado Department of Agriculture Commissioner Kate Greenberg, and Aurora Mayor Mike Coffman to tour the Binney Water Treatment facility in Aurora to celebrate a recent $5 million investment from the Bipartisan Infrastructure Law that will allow the city to expand the Prairie Waters Project (PWP), securing more clean, reliable water. The funding is part ofย $84 millionย announced last month from the Bipartisan Infrastructure Law to advance innovative drought resilience efforts.

The City of Aurora constructed the PWP after the severe drought in 2002 to improve drought resiliency. The project is an innovative potable reuse system, which captures and treats river water to provide up to 10 million gallons of clean water to Aurora residents per day. With Bipartisan Infrastructure Law funding, the City will expand the PWP by constructing a second radial well and pump station and increasing the overall water recovery capacity by 4,500 acre-feet annually.

On Thursday, Assistant Secretary Trujillo spoke at the Four States Irrigation Council Annual Meeting to highlight how investments from both laws will support western communities. While in Colorado, Assistant Secretary Trujillo also visited with staff at the U.S. Geological Surveyโ€™s (USGS) Fort Collins Science Center and at the Denver Federal Center in Lakewood, Colorado. The Bipartisan Infrastructure Law provides $510.7 million over the next five year to advance scientific innovation through integrated mapping of critical minerals that power many household appliances and clean energy technologies and through a $167 million investment for the USGS Energy and Minerals Research Facility in Golden, Colorado.

Assessing the seasonal evolution of snow depth spatial variability and scaling in complex mountain terrain — USGS #snowpack

View of the Bridger Range looking south from the summit of Sacagawea Peak. By Rperry99 at the English-language Wikipedia, CC BY-SA 3.0, https://commons.wikimedia.org/w/index.php?curid=31376982

Click the link to access the article on the USGS website (Northern Rocky Mountain Science Center):

Dynamic natural processes govern snow distribution in mountainous environments throughout the world. Interactions between these different processes create spatially variable patterns of snow depth across a landscape. Variations in accumulation and redistribution occur at a variety of spatial scales, which are well established for moderate mountain terrain. However, spatial patterns of snow depth variability in steep, complex mountain terrain have not been fully explored due to insufficient spatial resolutions of snow depth measurement. Recent advances in uncrewed aerial systems (UASs) and structure from motion (SfM) photogrammetry provide an opportunity to map spatially continuous snow depths at high resolutions in these environments. Using UASs and SfM photogrammetry, we produced 11 snow depth maps at a steep couloir site in the Bridger Range of Montana, USA, during the 2019โ€“2020 winter. We quantified the spatial scales of snow depth variability in this complex mountain terrain at a variety of resolutions over 2 orders of magnitude (0.02 to 20โ€‰m) and time steps (4 to 58โ€‰d) using variogram analysis in a high-performance computing environment. We found that spatial resolutions greater than 0.5โ€‰m do not capture the complete patterns of snow depth spatial variability within complex mountain terrain and that snow depths are autocorrelated within horizontal distances of 15โ€‰m at our study site. The results of this research have the potential to reduce uncertainty currently associated with snowpack and snow water resource analysis by documenting and quantifying snow depth variability and snowpack evolution on relatively inaccessible slopes in complex terrain at high spatial and temporal resolutions.

#Arizona city cuts off a neighborhoodโ€™s #water supply amid #drought — The Washington Post #ColoradoRiver #COriver #aridification

Rio Verde Foothills. Photo credit: VRBO

Click the link to read the article on The Washington Post website (Joshua Partlow). Here’s an excerpt:

Some living here amid the cactus and creosote bushes see themselves as the first domino to fall as theย Colorado Riverย tips further into crisis. On Jan. 1, the city of Scottsdale, which gets the majority of its water from the Colorado River, cut off Rio Verde Foothills from the municipal water supply that it has relied on for decades. The result is a disorienting and frightening lack of certainty about how residents will find enough water as their tanks run down in coming weeks, with a bitter political feud impacting possible solutions.

The cityโ€™s decision โ€” and the failure to find a dependable alternative โ€” has forced water haulers like [John] Hornewer to scour distant towns for any available gallons. About a quarter of the homes in Rio Verde Foothills, a checkerboard of one-acre lots linked by dirt roads in an unincorporated part of Maricopa County, rely on water from a municipal pipe hauled by trucks. Since the cutoff, their water prices have nearly tripled. The others have wells, though many of these haveย gone dryย as the water table has fallen by hundreds of feet in some places after years of drought [ed. and over pumping]…

This grim [Colorado River] forecast prompted Scottsdale to warn Rio Verde Foothills more than a year ago that their water supply would be cut off. City officials stressed their priority was to their own residents and cast Rio Verde Foothills as a boomtown of irresponsible development, fed by noisy water trucks rumbling over city streets. โ€œThe city cannot be responsible for the water needs of a separate community especially given its unlimited and unregulated growth,โ€ the city managerโ€™s office wrote in December…Scottsdale Mayor David Ortega was unmoved when his Rio Verde Foothills neighbors cried foul.

โ€œThere is no Santa Claus,โ€ he said in aย statementย last month. โ€œThe megadrought tells us all โ€” water is not a compassion game.โ€

For the past several years, some residents have sought to form their own water district that would allow the community to buy water from elsewhere in the state and import what they need, more than 100 acre-feet of water per year. Another group prefers enlisting a Canadian private utility company, Epcor, to supply the community, as it does with neighboring areas. But political disputes have so far foiled both approaches. The water district plan โ€” which supporters say would give them long-term access to a reliable source of water โ€” was rejected in August by the Maricopa County supervisors. The supervisor for the area, Thomas Galvin, said he opposed adding a new layer of government to a community that prizes its freedom, particularly one run by neighbors with the authority to condemn property to build infrastructure. [Thomas] Galvin preferred Epcor, a utility that, if approved, would be regulated by the Arizona Corporation Commission.

Key takeaways from the omnibus spending package: Whatโ€™s in it for rivers? — @AmericanRivers

The Rappahannock River | Virginia. Photo credit: American Rivers

Click the link to read the article on the American Rivers website (Jaime Sigaran):

On December 20, 2022 appropriators released the highly anticipated fiscal year 2023 omnibus spending package which includes modest environmental and conservation funding increases.

In the remaining days of 2022, weโ€™re happy to share some important wins for rivers โ€“ including funding for critical clean water and river restoration programs, as well as new Wild and Scenic River designations. While thereโ€™s much to be thankful for, the bill still has a number of shortcomings. In this blog, we break down the funding and policy highlights. 

On December 20, appropriators released the highly anticipated fiscal year 2023 omnibus spending package which includes modest environmental and conservation funding increases. Overall, the bill would fund the government at $1.7 trillion for most of 2023 โ€“ $858 billion toward defense and $772.5 billion in domestic spending.  

The omnibus spending bill funds federal agencies such as the Environmental Protection Agency (EPA) and Department of Interior (DOI). The EPA received a $576 million increase from current levels to support the agencyโ€™s science, environmental, and enforcement work. The bill also includes $14.7 billion for DOI programs, an increase of $574 million above fiscal year 2022. 

These funding increases support river restoration and river health goals across the country.  

Key Takeaways From The Omnibus Spending Package:ย 

  • General increases to EPA, DOI, and National Oceanic and Atmospheric Administration 
  • Additional supplemental funding for National Park Service to restore 500 of the 3,000 staff positions that have been lost over the past decade 
  • $40 billion for disaster recovery and drought 
  • $600 million to address water issues in Jackson, Mississippi. 
  • $682 million for EPAโ€™s geographic program including $92 million for Chesapeake Bay Program and $368 million for the Great Lakes Restoration Initiative 
  • $1.67 billion for EPAโ€™s Clean and Drinking Water State Revolving Funds 
  • $50 million for EPAโ€™s Sewer Overflow & Stormwater Reuse Municipal Grant program 
  • $65 million for Bureau of Reclamationโ€™s WaterSMART grants 

KEY RIVER BUDGET PRIORITIES & PERFORMANCE: 

AgencyProgramFY 23 Rec. from 
American Rivers
Omnibus Spending bill 12/20/22About the Program
EPAReducing Lead in Drinking Water$100M$25MReduces the concentration of lead in drinking water.
EPASewer Overflow and Stormwater Reuse Municipal Grants Program $280M$50M Manages combined sewer overflows, sanitary sewer overflows, and stormwater flows. 
USBRDam Safety Program $200M $210.2M Ensures Reclamation dams do not present unreasonable risk
USBRKlamath Project $25M $34.8M Provides funding to improve water supplies in the Klamath River Basin. 
USBRLower CO Operations Program $45M $46.8M Implements the Drought Contingency Plan and the Lower Colorado Multi-species Conservation Program. 
USBRYakima River Basin Water Enhancement Project $30M $50.3M Enhances streamflows and fish passage for anadromous fish in the Yakima River Basin. 
CorpsUpper MS River Restoration $55M $55M Ensures the viability and vitality of Upper Mississippi River fish and wildlife. 
CorpsEngineering with Nature $12.5M $20M Aligns natural and engineering processes to deliver economic, environmental, and social benefits 
FEMAFloodplain Mgmt. & Mapping $200M $206M Improves floodplain management, develops flood hazard zone maps, and educates on the risk of floods 
FEMANational Dam Safety Program $92M $9.65M Reduces the risks to human life, property, and the environment from dam related hazards. 

Policy Wins for Wild and Scenic Rivers, Western Waterย 

In addition to the funding noted above, American Rivers is very pleased to share that key provisions supporting river restoration are advancing. We applaud the hard work championed by Senators Richard Shelby (R-AL) and Patrick Leahy (D-VT) and many others on the Hill to make this omnibus spending bill a bipartisan effort. Though we are disheartened that we didnโ€™t get to see the bipartisan, bicameral public lands and water package, we can celebrate two new Wild and Scenic River designations: the York River in Maine and Housatonic River in Connecticut. Together these bills would designate more than 70 river miles. Two Wild and Scenic River studies from Florida were also added.ย 

Upper Mississippi River, IA. Photo credit: American Rivers

Several western water bills made it into the omnibus spending bill which will improve drought resilience, boost water supply, and support wetland conservation. For example, the Colorado River Basin Conservation Act (S. 4579/H.R. 9173) would allow DOI to continue to partner with Upper and Lower Basin states alike, to keep more water in the Colorado River and its reservoirs, by incentivizing voluntary water conservation projects at the user level.  

Shortcomings in the Omnibus Spending Bill 

The omnibus spending bill falls short of meeting bold river health goals that are grounded in advancing scientific efforts, supporting enforcement, and directing growth in river communities that could have benefited from additional funding. While we noticed gains in WaterSMART, Dam Safety Program, Yakima, and Klamath Projects under Bureau of Reclamation, American Rivers noted less than optimal funding levels for the Central Valley Project Restoration Fund in California and the Columbia and Snake River Salmon Recovery Project in the Pacific Northwest.ย 

Ansel Adams The Tetons and the Snake River (1942) Grand Teton National Park, Wyoming. National Archives and Records Administration, Records of the National Park Service. (79-AAG-1). By Ansel Adams – This tag does not indicate the copyright status of the attached work. A normal copyright tag is still required. See Commons:Licensing., Public Domain, https://commons.wikimedia.org/w/index.php?curid=118192

The Army Corps of Engineers programs such as Engineering with Nature, Floodplain Management Services, Sustainable Rivers Program, and the Upper Mississippi River Restoration programs did not suffer significant cuts. Nor did NOAA programs specifically Pacific Coastal Salmon Recovery Fund. However, we acknowledge small reductions in funding to the Flood Hazard Mapping and Risk Analysis Program (RiskMAP). 

Another item American Rivers noticed is large money carve outs for โ€œCommunity Project Funding Itemsโ€ also known as earmarks. When taken out of the Clean Water and Drinking Water State Revolving Fund (SRFs) capitalization grants, it leaves the EPA programs with less than half of what these programs received in Fiscal Year 2021. The long-term viability of the SRFs is in question and American Rivers will work hard to ensure its success in future years so high-priority projects are not delayed or increase the risk to public health and the environment. 

Weโ€™re disappointed the sweeping omnibus legislation did not boost more funding to protection, restoration, and enhancement of fish and wildlife, but are hopeful that the focus in drought resilience in the Southwest, water infrastructure in Jackson, Mississippi, as well as modest increases to Corps, DOI, NOAA and EPA programs will continue to place a focus on water quality and quantity.

The snow gods are giving the #ColoradoRiver and all of us in the basin a little breathing room this water year — @LukasClimate #COriver #aridification (January 17, 2023)

Upper Basin now at >150% of the median SWE for mid-January, and almost 75% of the peak SWE–about three months ahead of the typical peak.

Being in the know about the mountain snow: Tracking the snowflakes critical to the spring runoff and water supply for 1.5 million people — @DenverWater #FraserRiver #BlueRiver #SouthPlatteRiver #ColoradoRiver #COriver

Click the link to read the article on the Denver Water website (Jay Adams):

When it comes to supplying water to 1.5 million people, the spring runoff is the most important time of the year for Denver Water. 

Thatโ€™s why having good information about the snowpack is critical. Mountain snow is Denver Waterโ€™s primary source of water for its customers.

When the snow that piles up in the mountains over the winter starts to melt, the water flows into rivers and streams that fill storage reservoirs. The spring runoff typically starts at the end of April and wraps up in late June or early July.

But the work to count the snowflakes starts long before that.ย 

โ€œWe keep track of the snowpack through measurements on the ground, from the sky and from automated sensors,โ€ said Nathan Elder, water supply manager at Denver Water. โ€œWe monitor the snow all winter because it constitutes the majority of our water supply and has major impacts on how we operate.โ€

In 2022, theย snowpack peakedย below average in the areas where Denver Water catches the snowmelt. A below-average snowpack affects the amount of water available to capture and store in the spring.

Denver Water’s collection system via the USACE EIS

“We would like to completely fill our reservoir system every runoff season,” said Elder. “In the years when we don’t hit that mark, it makes following the utility’s annual summer watering rules even more critical for the Denver metro area.”  

Watering two days a week should be enough for most landscapes for most of the summer. (Only water a third day, if needed, during periods of extreme heat or dryness.)

Following the summer watering rules will help keep reservoir levels higher, in case next winter’s snowpack is below average.ย 

The Fraser River south of Winter Park on April 29, 2022. The snowpack in the areas where Denver Water captures snowmelt peaked below average for the 2021-2022 winter season. Photo credit: Denver Water.

The snowpack data, reservoir forecasts and customer water use are some of the key factors used to determine if Denver Water might need to impose additional watering restrictions beyond the regular summer watering rules, which run from May 1 through Oct. 1.

Hereโ€™s a closer look at the primary ways Denver Waterโ€™s planning team keeps track of Coloradoโ€™s snowpack. 


Spread the word, forward this story. Did you get this from a friend? Sign up here for Denver Waterโ€™s free, weekly TAP email.


On the ground

Four times a year from January through April, Denver Water crews strap on boots and snowshoes and sometimes ride snowcats to trek into the forest to measure the snow in Grand, Park and Summit counties, the primary areas where the utility collects its water supply for customers in metro Denver.

Each journey follows a specific, predetermined route called a snow course.

Each snow course has 10 designated stops where workers jab a hollow tube into the snow to capture and weigh a sample of the snowpack.ย 

At each stop, the crew conducts a four-step process:

  • Collect a sample by dropping the pole into the snow until it hits the ground.
  • Measure the depth of snow in the tube.
  • Get the weight of the snow by weighing the snow-filled tube and subtracting the weight of the empty tube.
  • Calculate the density of the snow using the depth and weight measurements. 

Using these measurements, crews calculate the snow water equivalent, or SWE, to determine the water content. 

For example, if 10 inches of snow has a density of 10%, the snow water equivalent โ€” the amount of water left behind if those 10 inches of snow melted โ€” is 1 inch of water.ย 

Rob Krueger, facility supervisor for Denver Water, uses a specially designed hollow tube to collect a snow sample near Berthoud Pass. Photo credit: Denver Water.

Denver Water shares the data collected on each snow course with the National Resources Conservation Service, or NRCS. Denver Water is one of 15 agencies that sends people out to collect snow data at 95 locations across Colorado in partnership with the NRCS.

The information helps the agency develop water supply forecasts and monitor snowpack trends over time. 

The NRCSโ€™s forecasts are used by water provides, dam operators, farmers, ranchers, recreationists and communities to make important decisions about their water supply.

Denver Waterโ€™s Rob Krueger (left) and Adam Clark work out of the utilityโ€™s Moffat Collection System office in Winter Park. Here they are weighing a snow sample to calculate how much water it contains. Photo credit: Denver Water.

Silent sentries

Along with data collected by hand, Denver Water uses information from snow telemetry sites, or SNOTEL, sites during the winter. 

SNOTELs, basically automated backcountry weather stations, were first installed in the 1970s and are operated by the NRCS. The federal agency currently has more than 900 SNOTEL sites collecting data in remote, high-elevation mountain watersheds across the western U.S.

At each site, a bladder about the size of a queen-sized waterbed and filled with antifreeze monitors and reports the weight of the snow falling on it, providing information about the water content frozen in the snow. SNOTEL sites send data multiple times per day, although some sensors report hourly.

Denver Water uses information from 13 SNOTELs located in its 4,000 square miles of watershed.ย 

A SNOTEL site on Berthoud Pass in Grand County captures snow measurements throughout the winter. The National Resources Conservation Service manages the SNOTEL sites, which transmit information daily. There are over 900 automated SNOTEL sites across the western U.S. Photo credit: Denver Water.

From the air

Starting in 2019, Denver Water began getting data about the snowpack from the air, usingย Airborne Snow Observatoryย planes stuffed with high-tech equipment flying over the snow-covered mountains.ย 

The plane uses beams of light to measure the depth of the snow fields below and capture reflections from the frozen surface. The equipment pings the snowโ€™s surface at up to 10 locations every square meter, and powerful computers crunch reams of data.

The flights provide an assessment of the amount of water frozen in place in the snow across hundreds of square miles that is more accurate than anything Denver Water has ever had before. 

โ€œThe data we get from the Airborne Snow Observatory flights quantifies all of the snowpack in river basin below, rather than trying to build a picture of the snowpack in basin using just a few selected point measurements we get from the SNOTELs and the snow courses,โ€ said Nathan Elder, Denver Waterโ€™s manager of water supply. โ€œImagine trying to watch a high-definition TV that only has 10 of its thousands of pixels working; you just donโ€™t get the whole picture.โ€

And in the face of increasingly variable weather patterns related to climate change, having better information and more accurate forecasts of the seasonal runoff will be more important in the future, he said.

The view from an Airborne Snow Observatory plane as it flies over a mountainous region to capture data on the snowpack. Photo credit: Airborne Snow Observatories Inc.

Putting it all together 

Elderโ€™s planning team uses data from the snow-measuring methods and combines it with other data such as soil conditions and weather forecasts to determine how much water the winter snowpack will send into Denver Waterโ€™s reservoirs. 

โ€œHaving people hike into the forests to measure the snow by hand is very important for water planners because they give us the โ€˜boots-on-the-groundโ€™ information we use to verify the data we get from the machines in the SNOTELs and the Airborne Snow Observatory flights,โ€ Elder said. 

The forecasts โ€” in turn โ€” help determine how Denver Water will manage the water stored in its reservoirs to meet customer demands in the city and determine if additional water restrictions are needed. 

The water supply forecasts are also used to provide information to communities, businesses and other water managers about flooding concerns, water levels for boating on reservoirs, maximizing water rights and how to manage water supplies to benefit the environment.

โ€œManaging water is a very complex business,โ€ Elder said. โ€œThe more information and data we can get, the better decisions we can make.โ€

โ€œWe are not going to be afraid to litigateโ€ to protect #Coloradoโ€™s water rights: Attorney General Phil Weiser said era of lower basin states over-consuming #ColoradoRiver โ€œis overโ€ — The #Denver Post #COriver #aridification

Lees Ferry streamgage and cableway on the Colorado River, Arizona. The point where the upper and lower Colorado River basins divide the river. (Public domain.)

Click the link to read the article on The Denver Post website (Nick Caltrain). Here’s an excerpt:

Coloradoโ€™s attorney general is seeking toย reinforce his officeโ€™s water-focused legal team so it could be prepared for upcoming fights over the Colorado River. Attorney General Phil Weiser, who was just re-elected to a second term, said his office needs to be prepared for litigation or negotiation with other stakeholders to defend Coloradoโ€™s water rights. Heโ€™s not asking for an overhaul of the office โ€” his ask to the Joint Budget Committee is for two new positions, and water and natural resources make up an overall small percentage of his officeโ€™s total budget โ€” but he noted that โ€œthe challenges with water are heating up.โ€

โ€œThe era of the lower basin states taking as much water as they wanted โ€” up to 10 million acre-feet when theyโ€™re only entitled 7.5 โ€” is over,โ€ Weiser said recently…

Ideas on bolstering the water supply โ€” or at least not drinking too deep from it โ€” vary. Weiser said his focus is on protecting the stateโ€™s share. Lawmakers have said water will be a โ€œcenterpieceโ€ of this legislative session. House Speaker Julie McCluskie, a Democrat from Dillon, has also singled out lower basin states for overusing their allotment. Weiser noted the strain on the reservoirs and the pressure that puts on water users up and down the river. Navigating the legal rapids will require negotiation or litigation, he said.

โ€œWeโ€™ve got to be prepared for either way,โ€ Weiser told reporters after his investiture ceremony Thursday. โ€œWe are not going to be afraid to litigate and protect our rights, and as we can find collaborative solutions, weโ€™ll work hard to do that.โ€

[…]

If lawmakers approve the request this spring for more water specialists, it would bring the departmentโ€™s total staff working on interstate water issues to 11, including eight attorneys, according toย budget documents. The internal team has already won legal victories against other states and the federal government, as well as saved the state money on outside experts, according to the proposal.

In the Amazon, Indigenous and Locally Controlled Land Stores Carbon, but the Rest of the Rainforest Emits Greenhouse Gases — Inside #Climate News #ActOnClimate

Adapted from File:South America (orthographic projection).svg by User:Luan, (CC-BY 3.0) and File:Amazon biome outline map.svg by User:Aymatth2 (CC-BY-SA 4.0). By CactiStaccingCrane – Own work, CC BY-SA 4.0, https://commons.wikimedia.org/w/index.php?curid=122066796

Click the link to read the article on the Inside Climate News website (ย Bob Berwyn and Katie Surma):

Forests managed by Indigenous peoples and other local communities in the Amazon region draw vast amounts of planet-warming carbon dioxide out of the atmosphere while the rest of the rainforest has become a net source of the greenhouse gas, a new report has found. 

The discrepancy results from differences in deforestation rates between the two types of land. 

The study from the World Resources Institute, a nonprofit global research organization focused on solving environmental challenges, adds to a growing body of evidence showing that land held by Native peoples and other local communities around the world has better environmental outcomes than government and privately owned land.

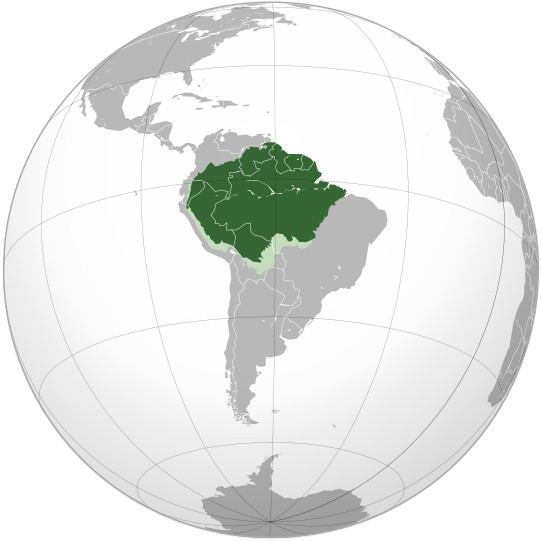
The WRI study, published on Jan. 6, marks the first time researchers have quantified the forest carbon benefits of Indigenous territories and land stewarded by local communities in the Amazon region, which spans Bolivia, Brazil, Colombia, Ecuador, French Guiana, Guyana, Peru, Suriname and Venezuela.ย 

From 2001 to 2021, forested areas in the Amazon managed by Indigenous communities removed about 340 million more metric tons of carbon from the air each year than they emitted, an amount equivalent to the annual carbon emissions of the states of California and Massachusetts combined. Land managed by other local communities had similar outcomes, researchers found.

Impact of deforestation on natural habitat of trees. By Daniele Gidsicki – https://www.flickr.com/photos/dgidsicki/1469098242, CC BY 2.0, https://commons.wikimedia.org/w/index.php?curid=76979668

All other forested land in the Amazon region was a net source of carbon over the same time period because of high rates of forest loss.

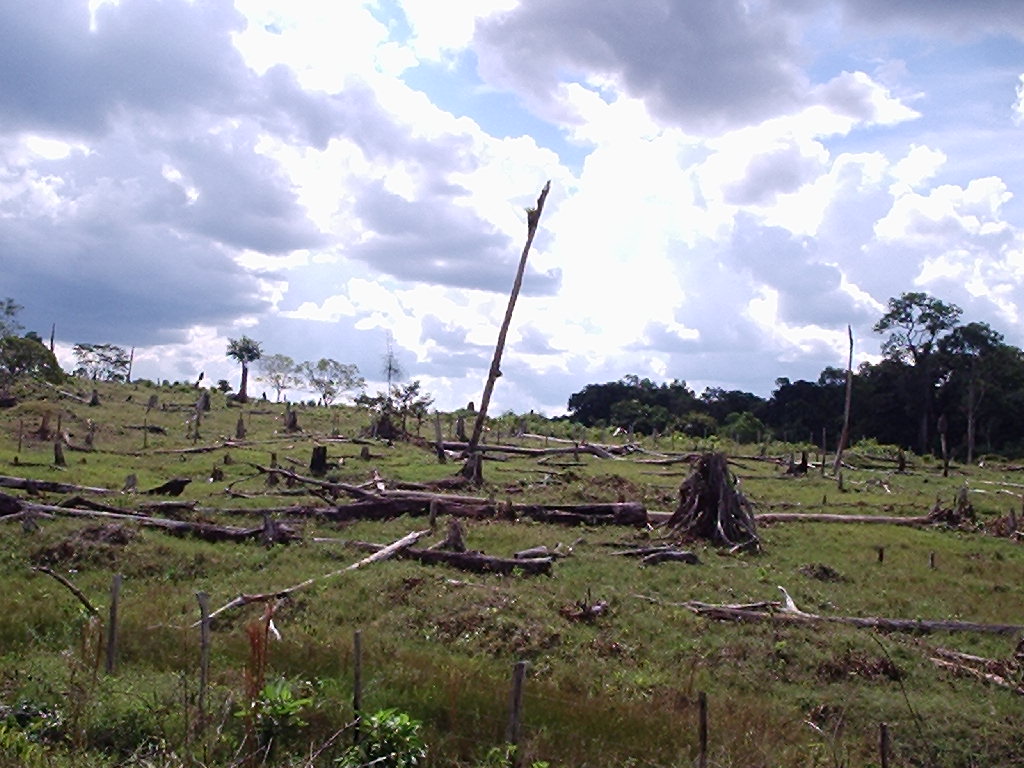
While the main contributors to planetary warming are greenhouse gases released from the burning of fossil fuels, forests can also become a source of carbon dioxide emissions. Trees store carbon dioxide within their leaves, branches, trunks and roots. When they are destroyed through fires or clear-cutting, once-sequestered carbon is released into the atmosphere. In the Amazon region, drivers of deforestation include development from industrial agriculture, cattle ranches, mining, oil extraction and other activities, both legal and illegal.

The WRI reportโ€™s findings add an exclamation point to the evidence that Indigenous peoples and local communities are a major force in preserving the Amazon rainforest amid the rapid deforestation on land held privately or by governments.

According to Peter Veit, a co-author of the report and the director of WRIโ€™s Land and Resource Rights Initiative, about 17 to 18 percent of the Amazon has been deforested in the last 50 years. Scientists estimate that once those levels get to 20 to 25 percent, the rainforest will hit an irreversible tipping point from which the region will transform into grasslands and savannah. The change would result in the release of an estimatedย 123ย billion tons of carbon into the atmosphere, kill off thousands of plant and animal species and wipe out hundreds of distinct human cultures tied to the rainforest.

โ€œWe are very close to that tipping point,โ€ Veit said. 

The WRI report comes as land not just in the Amazon region but throughout the world is under increasing pressure for food production, resource extraction and other demands linked to human population growth. 

About half of Earthโ€™s land is stewarded by Indigenous and other local communities. Many of those groups have insecure land tenure, making them vulnerable to land theft, appropriation and related violence. Each year, about 200 land defenders, including many Indigenous people, are killed, although that estimate is widely considered an undercount. 

Veit suggests that governments can support Indigenous and local communities in protecting their territories by integrating their efforts into national climate plans, giving them secure title to their land and increasing direct funding to those communities. 

โ€œWeโ€™re showing one of many reasons that forests controlled by Indigenous peoples should be valued,โ€ said David Gibbs, a researcher at Global Forest Watch and a co-author of the report. The research, he said, โ€œadds to the list of reasons that we already have to help protect those communities.โ€ย 

The Benefits of Local and Indigenous Control

In general, Indigenous peoples and local communities manage their land in a sustainable way based on customs and cultural values that are intertwined with the forest. 

โ€œFor Indigenous people and other communities, their land is a primary source of food, medicine, fuelwood and construction materials, as well as employment, income, welfare, security, culture and spirituality,โ€ the report notes. 

That interdependence with intact forests creates an incentive for communities to sustainably manage their lands, Veit says. 

If left alone, most of those communities would continue to live as they have for hundreds of years. But they are increasingly under threat from outside pressures like legal and illegal mining, logging and agriculture, he said. 

While all forest in the Amazon region both stores and emits carbon, Indigenous lands capture more carbon than they emit each year when the entirety of that flux is considered. Veit and Gibbs said their analysis identified which Indigenous territories have higher carbon emissions and found that those communities may face greater pressures from resource extraction.

In Brazil, home to the greatest portion of the Amazon rainforest, the Indigenous communities in forests with the greatest carbon emissions are located in the countryโ€™s southeast, an area known as the โ€œarc of deforestation.โ€ In Peru, Indigenous lands that were net sources of carbon were located in regions dominated by gold mining. 

Of all the ways that governments can help communities defend their forestland from incursions that could increase the carbon emissions, Veit said that providing them with secure land title is the most important. 

In Brazil, the demarcation and formal titling of Indigenous peoplesโ€™ land stopped under former President Jair Bolsonaroโ€™s administration, which held power from 2019 to 2022. Bolsonaro also defunded governmental agencies tasked with enforcing the rights of Indigenous peoples. Over the course of his presidency, deforestation rates in the country surged.

While obtaining legal title to land is important, the type of legal title communities obtain also makes a difference in their ability to defend their land from incursions by resource extraction and agricultural interests.

In most Amazonian countries, national governments reserve ownership of material that lies below the surface of the land, making it easier for them to grant companies licenses for mining and other extractive activities. 

โ€œWhen you get security of land, you donโ€™t get security like we do in the United States of all subsurface rights,โ€ Veit said. โ€œYour rights in the Amazon extend 10 inches below the surface and thatโ€™s it.โ€ 

Veit has done research comparing the legal authority granted to extractive companies through means such as mining concessions with the legal rights given to landowners like Indigenous communities. 

โ€œThey donโ€™t compare,โ€ he said. โ€œThe natural resource rights holders have tremendous power to go onto and use land.โ€ Human rights experts have advocated for communitiesโ€™ gaining greater control over their territories and a right of refusal when governments and businesses seek to engage in resource extraction on or near their land. 

โ€œMany governments around the world still view themselves as the best holders of common property rights to resources,โ€ Veit said. โ€œItโ€™s ridiculous. Thereโ€™s a real mistrust that communities can manage these important resources despite the evidence that shows that they can.โ€ 

Amazon Emissions in Flux

The WRI report is based in part on a 2021 study in the journal Nature Climate Change that offers one of the best estimates of how much carbon dioxide was emitted by forests and how much they removed from the atmosphere globally in the last 20 years. The paper concluded that, during the 2001 to 2019 study period, forests sequestered about twice as much as they emitted each yearโ€”storing about 7.6 billion metric tons per year, or 1.5 times more than the United States emits annually.

The Amazon is a big part of that global equation, but the international team of authors acknowledged in their opening paragraphs how challenging the measurements are at global and regional scales. Emissions and absorption can take place simultaneously within regions, depending on when and where the forests are disturbed and managed, they wrote. 

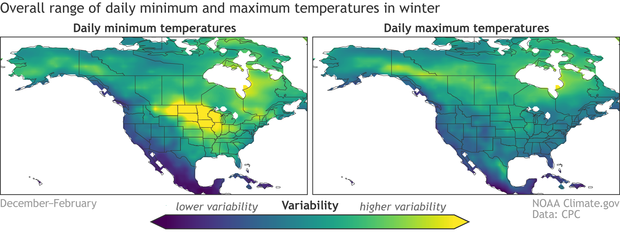
The carbon fluxes, as scientists call them, also have high seasonal variability, and itโ€™s not easy to distinguish between natural fluctuations and those caused by disturbances like fires and logging. All of that makes it hard to reproduce them in global climate models, although measuring them accurately is โ€œincreasingly important for climate policy,โ€ the paper noted.

The scientists found that during the study period, forests in the Brazilian Amazon were a net source of .22 gigatons of carbon dioxide emissions per year but that the forests spanning all nine countries of the greater Amazon River basin (526 million hectares) were a net carbon sink, taking up .10 gigatons of carbon dioxide. By contrast, they noted, the net sink in forests of Africaโ€™s Congo River basin (298 million hectares) was approximately six times stronger than in the Amazon basin.

The main reason is the far lower rate of human disturbance in the Congo River forests, Gibbs said. 

Aspinall Unit Operations Meeting January 19, 2023 #GunnisonRiver #ColoradoRiver #COriver #aridification

Blue Mesa Reservoir is the largest storage facility in Colorado in the Upper Colorado River system. Prolonged drought and downriver demand is shrinking the reservoir. Credit: Tom Wood, Water Desk

From email from Reclamation (Erik Knight):

The next Aspinall Operations meeting is scheduled for this Thursday, January 19th, start time 1:00pm

The meeting will be open to in-person attendance at the Western Colorado Area Office in Grand Junction.

445 West Gunnison Ave

Grand Junction, CO

The meeting will also be available to attend virtually via Microsoft Teams.  Please click on this link to attend the meeting virtually.

This link should open in any smartphone, tablet, or computer browser, and does not require a Microsoft account.

The meeting agenda with handouts will be emailed out prior to the meeting.

For any questions please email or call at the number below.

Erik Knight

970-248-0629

WCAO-GJ

Update of the forecasted Powell inflows chart. Past 2+ weeks has been very good for the Upper Basin. Jan 1st: @nwscbrfc forecast called for 105% of average inflows. Jan 17th forecast: 125% of average — @LukasClimate #ColoradoRiver #COriver #aridification

Long way to go, but really low Colorado River flows are off the table.

Variable streamflow response to forest disturbance in the western United States — USFS

Disturbances that do not remove the entire canopy, such as this beetle-caused tree mortality, tend to result in decreased rather than increased water yield.

Click the link to read the article on the USFS website (Sara A. Goeking and David Tarboton):

Forest disturbance is expected to lead to increased streamflow โ€“ but in very dry watersheds, the opposite is often true.

Forest disturbance is typically expected to lead to increased runoff – and therefore more water available for aquatic ecosystems and people – because loss of forest vegetation results in less water being taken up and transpired by plants. However, recent studies in the western U.S. have found no change or even decreased streamflow following forest disturbance due to drought and insect epidemics.

We investigated streamflow response to forest cover change using hydrologic, climatic, and forest data for 159 watersheds in the western U.S. during 2000โ€“2019. Forest change and disturbance were quantified in terms of net tree growth (total growth volume minus mortality volume) and mean annual mortality rates, respectively, from the U.S. Forest Service’s Forest Inventory and Analysis database. Annual streamflow was analyzed using multiple methods to understand the contributions of precipitation, temperature, aridity, and tree mortality.

Many watersheds exhibited decreased annual streamflow even as forest cover decreased. This decreased streamflow was not attributable to precipitation and temperature changes in many disturbed watersheds, yet streamflow change was not consistently related to disturbance, suggesting drivers other than disturbance, precipitation, and temperature.

Multiple regression analysis indicated that although change in streamflow is significantly related to tree mortality, the direction of this effect depends on aridity. Specifically, forest disturbances in wet, energy-limited watersheds (i.e., where annual precipitation exceeds potential evapotranspiration [PET]) tended to increase streamflow, while post-disturbance streamflow more frequently decreased in dry, water-limited watersheds (where the PET to precipitation ratio exceeds 2.35).

Effect of tree mortality and aridity on change in annual streamflow (ฮ”Q) for 2000โ€“2009 vs. 2010โ€“2019, based on 159 watersheds. PET=potential evapotranspiration; P=precipitation.

Key Findings

  • While streamflow often increased following forest disturbance, it decreased in some watersheds.
  • The direction of streamflow response to forest disturbance (increase vs. decrease) is dependent on aridity.
  • Tree mortality during 2000-2019 was highest in arid watersheds โ€“ the same watersheds where disturbance tends to result in decreased streamflow.
  • Forest disturbances in wet, energy-limited watersheds tended to increase streamflow, while post-disturbance streamflow more frequently decreased in dry, water-limited watersheds.

Other Resources

Disturbance effects on water yield in western coniferous forests

Using Forest Inventory & Analysis data for broad-scale assessments of vegetation effects on water resources

Featured Publications

Variable streamflow response to forest disturbance in the western US: A large-sample hydrology approach

Goeking, Sara A. ; Tarboton, David G. , 2022

Leery of open forum, #water group struggles to inform public: #Wyomingโ€™s #ColoradoRiver Working Group serves as a conduit between water users and state engineerโ€™s office — WyoFile #GreenRiver #COriver #aridification

Members of the public packed the Sublette County Public Library in Pinedale Sept. 27, 2022 for a water meeting organized by the Wyoming State Engineer’s Office. (Dustin Bleizeffer/WyoFile)

Members of a working group created by Gov. Mark Gordon to โ€œdisseminate informationโ€ and โ€œact as a sounding board for the public and stakeholdersโ€ regarding Colorado River Compact issues reported Monday mounting public frustration about access to information. 

The Colorado River Working Group, formed in 2021, essentially acts as a consulting body and communications conduit between water users in the Green River and Little Snake River basins and the State Engineerโ€™s Office. 

At a meeting of the group on Monday members said constituents are confused. Members also reported fielding complaints from stakeholders who canโ€™t get the information they need to stay abreast of the fast-moving and complex topic that stands to impact water users in the state.

At the same meeting, State Engineer Brandon Gebhart insisted the body isnโ€™t subject to the stateโ€™s open meetings laws and said heโ€™s hesitant to take questions from the public during working group meetings. Though Mondayโ€™s meeting was open to the public โ€” as were six previous meetings โ€” none have been live-streamed or otherwise made available to anyone not in attendance, according to the engineerโ€™s office.

Thatโ€™s by design, according to Gebhart. 

โ€œIโ€™m a little concerned that if we start one of these [live-streamed presentations] that we wouldnโ€™t get through any of the topics before the questions start coming in,โ€ Gebhart told working group members. In a follow-up with WyoFile Tuesday, Gebhart added, โ€œMy general concern about doing public webinars is being unable to get through the numerous and complex topics we need to cover if we get slowed down by multiple public questions.โ€

Chris Brown of the Wyoming Attorney Generalโ€™s Office discusses the implications of the Colorado River Compact with water users in Pinedale Sept. 27, 2022. (Dustin Bleizeffer/WyoFile)

The working groupโ€™s meetings are intended to hash out information and discuss how to disseminate it with water users, Gebhart said. The groupโ€™s outreach is primarily done directly between the groupโ€™s members and their constituents.

Though there was no formal call for public comments or questions at the Monday meeting, members of the working group, SEO and the attorney generalโ€™s office did field some questions from members of the public in attendance.

Under pressure

The main topic of discussion Monday was how the SEO is scrambling to entice eligible water users to take part in a conservation program that pays them to voluntarily leave water in streams that flow to the Colorado River. 

Explaining the program and eligibility requirements to myriad water users is complicated, particularly as many in the ag community are leery of government-sponsored programs aimed at reducing water use, according to the SEO. A tight timeframe makes the effort more challenging. The Upper Colorado River Commissionannounced a call for System Conservation Pilot Program proposals Dec. 14 with a filing deadline of Feb. 1.

The SEO, which is overseeing the program in Wyoming, is eager to enroll as many participants as possible, according to the agency. The state and its upper basin partners need to demonstrate progress in cultivating various voluntary water conservation efforts to build a case against the potential for mandated cuts under the Colorado River Compact or federal intervention. The agency is relying on members of the working group to help field questions and explain the potential benefits of the program. But so far, confusion reigns, members indicated.

Rep. Albert Sommers irrigates his ranch near Pinedale from where he trails cattle to Union Pass, seen on the horizon (Angus M. Thuermer Jr./WyoFile)

โ€œConservation districts โ€” they really donโ€™t know enough about whatโ€™s going on and they canโ€™t ask enough questions,โ€ Rep. Albert Sommers (R-Pinedale), a member of the working group, told fellow members. โ€œThere just needs to be more formal outreach in the country.โ€

Industrial water users in southwest Wyoming โ€” trona mines, natural gas processors and electrical power utilities โ€” โ€œare yearning for information,โ€ working group member Aaron Reichel of Genesis-Alkali said.

Sen. Larry Hicks (R-Baggs), also a member of the working group, said โ€œthereโ€™s a lot of concerns with this System Conservation Pilot Project.โ€ Concerns include โ€œthe timeframe to get [information], who to contact, whoโ€™s going to answer these questions to put together an application, whatโ€™s eligible โ€” all those questions. Iโ€™m just getting inundated with this stuff because of the timeframe of this.โ€

Working group structure

Gordon, anticipating the need to protect the interests of Wyoming water users from the impacts of the Colorado River crisis, formed the Colorado River Working Group in 2021 and appointed eight members. The group includes two representatives for municipal water users, one for agriculture, one for environmental interests, two for industrial water users and two legislators โ€” Sen. Hicks and Rep. Sommers.

Gordon โ€œtasked members with helping to more broadly disseminate information about key Colorado/Green/Little Snake River Basin issues to interested stakeholders, and for members to provide insights as Wyoming navigates important river issues,โ€ Gebhart told WyoFile via email, adding that the SEO relies on the working group to enhance its own public outreach efforts.

In forming the group, Gordon agreed to the SEOโ€™s suggestion that it not be subject to the stateโ€™s open meeting laws, according to Gebhart, though the group has decided to mostly adhere to open meetings standards so far. 

Gordonโ€™s office didnโ€™t directly answer what justifies the working groupโ€™s exemption from the stateโ€™s open meetings laws. As a gubernatorial appointed group convened by a state agency to address issues with a critical public resource the body would appear at a glance to be obligated to operate transparently โ€” but such quasi-governmental groups can and do exist, according to Bruce Moats, a Wyoming attorney who specializes in First Amendment and Wyoming media law.

โ€œThe group appears to exist in a kind of a gray area,โ€ Moats said. โ€œThe question is, why is it necessary to have the option to close meetings [to the public] when you have exemptions under the public meetings law that allow for that. Just why?โ€ 

At the urging of group members Monday, Gebhart agreed to consider hosting a webinar that provides members of the public the chance to ask questions about Colorado River issues and the SEOโ€™s efforts to enroll water users in the SCPP.

โ€œWe are not trying to limit information getting to the public,โ€ Gebhart told WyoFile. โ€œUltimately, our goal is to get more, and accurate, information to those potentially affected by the current situation.โ€

Wyoming rivers map via Geology.com

Aridification/Saturation Watch — @Land_Desk #snowpack (January 17, 2023)

West snowpack basin-filled map January 17, 2023 via the NRCS.

We just did the snowpack data aย couple weeks ago, so Iโ€™m not going to do it again. But holy relentless train of atmospheric rivers is there ever a lot of moisture falling from the sky. Look at these rainfall totals! Still, itโ€™s interesting that of those nine precipitation totals, only three set new 16-day records. Yes, this is some wacky weather, but itโ€™s not unprecedented, yet.

Judging from snowpack levels across the West, it would appear that each successive range of mountains wrings a little less moisture out of the clouds than the previous one. So California is getting buried, Utah is having one powder day after another, and Colorado is looking pretty darned good.

Pretty good in northern Colorado, too, but surprisingly not way ahead of last year at this time. This is for Rabbit Ears Pass:

And all of this new snow on top of that stuff that fell back in October and November and then rotted =ย avalanche danger. So be careful out there.

One change could save Oak Creek โ€˜millionsโ€™ at Sheriff Reservoir; Earthquake potential reveals new risk — Steamboat Pilot & Today

Photo credit: Medicine Bow National Forest

Click the link to read the article on the Steamboat Pilot & Today website (Dylan Anderson):

Oak Creek could save โ€œmillionsโ€ off the projected $14 million price tag for fixes at Sheriff Reservoir after updated engineering on the project showed the townโ€™s water source needs a much smaller spillway than originally thought. While the town previously believed the new spillway needed to be 300 feet wide, the updated work shows it only needs to be about 60 feet wide, according Steve Jamieson, an engineer with W. W. Wheeler that has been consulting for the town on the project. That is still twice the size of the existing spillway…

The recent work resulted from a Comprehensive Dam Safety Evaluation, which looked at ways the dam could fail during normal loading, flood loading and earthquake loading. The highest risk found was due to a gate failure, something that Jamieson said isnโ€™t surprising as the town works to replace the original head gate on the nearly 70-year-old dam. Oak Creek has gone through a bid process for this work twice, butย each effort failedย to find a contractor the town could afford. A gate failure wouldnโ€™t lead to loss of life, the analysis showed, but it would compromise the townโ€™s water source, making the impact significant. The new risk identified is called a โ€œliquefaction failure,โ€ and it is related of the areaโ€™s seismic activity. While noticeable earthquakes are not common in Routt County, they are not unheard of. Since 2000, Routt County has seen approximately two-dozen earthquakes, with the largest being a 3.5 magnitude event about 10 miles northwest of Oak Creek in 2011, according to theย U.S. Geological Survey.

The latest #Drought Monitor update shows improvement across most of the area compared to a year ago. However, more precipitation is needed to erase multiple years of drought conditions across the #ColoradoRiver basin. #utwx #cowx #azwx — Colorado Basin RFC

State legislators look to create a commission for #Wyoming’s stake in the #ColoradoRiver — Wyoming Public Radio #COriver #aridification

Green River Basin

Click the link to read the news brief on the Wyoming Public Radio website (Will Walkey). Here’s an excerpt:

The Wyoming State Legislature begins its lawmaking session this week. One bill, called the โ€œColorado River Authority of Wyoming Act,โ€ would create a board and commissioner to manage Wyomingโ€™s water in the Colorado River Basin. The systemย drains about 17 percentย of the Cowboy Stateโ€™s land area and is critical for agriculture, energy development and residential use in cities. The entire Colorado River Basinย is currently under stressย due to drought conditions and human development in the Southwest. The bill, sponsored by Rep. Albert Sommers (R-Pinedale) and Sen. Larry Hicks (R-Baggs) is similar to those previously passed inย severalย other statesย that depend on the Colorado River.

โ€œWe feel it’s very important to have those people that are actually going to be affected that live in the Colorado River Basin [to] have an opportunity to participate in these policy-level decisions thatโ€™s going to affect your everyday life,โ€ Hicks said.

The commission would include nine members, including five representatives from the Green River Basin appointed by commissioners in Sublette, Sweetwater, Lincoln and Uinta counties. Plus, one appointee from the Little Snake River Basin recommended by commissioners in Carbon County, as well as the state engineer, the governor or a designee and an at-large member. The authority would meet once a year and would include an official commissioner appointed by the governor who could represent Wyoming in negotiations with other states in theย Colorado River Compact, a seven-state agreement that allocates river resources. However, any changes to water rights would still need to be approved by the state legislature, governor and relevant federal authorities.

#Water leaders to lawmakers: No โ€˜silver bulletโ€™ in #Arizonaโ€™s water crisis — The Arizona Mirror

The 1980 Arizona Groundwater Code recognized the need to aggressively manage the stateโ€™s finite groundwater resources to support the growing economy. Areas with heavy reliance on mined groundwater were identified and designated as Active Management Areas (AMAs). The five AMAs (Prescott, Phoenix, Pinal, Tucson, and Santa Cruz) are subject to regulation pursuant to the Groundwater Code. Each AMA carries out its programs in a manner consistent with these goals while considering and incorporating the unique character of each AMA and its water users. Credit: ADWR

Click the link to read the article on The Arizona Mirror website (Jerod MacDonald-Evoy):

The day after Gov. Katie Hobbs delivered her first State of the State, outlining plans to address the stateโ€™s growing water crisis, the heads of the stateโ€™s water agencies stood before lawmakers to deliver an at times grim reality of the stateโ€™s water future. 

โ€œI do not believe that any of the (Active Management Areas) are at a safe-yield,โ€ Tom Buschatzke, director of the Arizona Department of Water Resources, told the House Natural Resources, Energy and Water Committee on Jan. 10. 

Active Management Areas, generally referred to as AMAs, were created in 1980 in an effort to help the state manage its groundwater resources as the state continued to grow. Only the AMA in Tucson is near a safe-yield, meaning the amount of water withdrawn is balanced with the amount recharging it, but Buschatzke said that Tucson has reached that by storing large amounts of Colorado River water delivered by Central Arizona Project. 

Approximatelyย 82% of Arizonaโ€™s populationย resides within the stateโ€™s five AMAs.ย 

But Buschatzke did not see it as a failure, and instead focused on telling the committee that solutions will need to be explored and that, in the future, more and more groundwater will begin to be pumped by municipalities across the state. 

โ€œIt is not a failure in my mind in any way shape or form,โ€ Buschatzke said, adding that the state needs to find more renewable water supplies, look to find ways to move water from one state to another or even from other sources outside the state

โ€œThere is no silver bullet,โ€ Buschatzke said. โ€œBut I think we have to embrace the success we have.โ€ 

The hearing also comes after Hobbs released an ADWR report showing areas in the West Valley cannot support planned development. Hobbs has accused former Gov. Doug Ducey of directing the agency to keep the report secret. 

Lawmakers didnโ€™t directly reference or ask about the report, but questions about development and its impact on water became a hot-button issue during the hearing. 

Rep. Barbara Parker, R-Mesa, asked Buschatzke if he would be willing to help the legislature โ€œeducateโ€ the public that agriculture uses more water than development. ADWR estimates from 2019 provided to the committee showed that agriculture made up for approximately 72% of water use, municipal 22% and industrial around 6%. 

โ€œThey always want to be down on a builder,โ€ Parker said, additionally asking Buschatzke if he thought Hobbsโ€™ speech unfairly targeted homebuilders. 

Buschatzke said that mandatory conservation requirements on farmers in AMAs have been efficient and have given them an advantage over California farmers. Both stateโ€™s farmers have been hit dramatically by the drought and recent cuts in Colorado River water. Arizona is facing a 21% cut in Colorado River allocation this year because of the drought and an alarming decrease of water in Lake Powell.

โ€œWe have done great things in this state โ€” and there is more we can do and there is more we will have to do,โ€ he said, adding that Hobbsโ€™ new Water Policy Council will hopefully address some of these issues. 

Rep. Stacey Travers, D-Phoenix, asked Buschatzke if the state should close a loophole that allows developers to get around a state law that says that every new home must have a 100-year supply of water by declaring the homes are being built as rental properties. Buschatzke deflected, and said such a policy change would be up to the governor. 

โ€œPerhaps that is an issue to be further discussed by Governor Hobbsโ€™ water council,โ€ he said. 

Lawmakers also heard from Central Arizona Projectโ€™s newly appointed general manager, Brenda Burman, who spoke to lawmakers on her third full day on the job. 

CAP oversees the 336-mile aqueduct that runs from Lake Havasu to Tucson, delivering Colorado River water to Maricopa and Pima counties. 

Burman reiterated what Buschatzke said, telling lawmakers that new solutions are needed to get water to more people and in a renewable way. She also mentioned the impacts of climate change on the stateโ€™s water supply, pointing out that water that in the past would have made its way into the Colorado River is now being absorbed into drier soil due to the prolonged drought. 

Both Buschatzke and Burman were asked by Rep. Oscar De Los Santos, D-Laveen, if they believed that climate change had impacted Arizonaโ€™s water supply and if they believed human activity had created climate change. Both agreed that climate change was impacting our water, but neither answered if they believed that human beings were the cause. 

Studies have definitively shown that climate change is occurring and human beings are contributing to it. 

โ€œIโ€™m no climatologist and Iโ€™m no expert in this,โ€ Parker said shortly after De Los Santos had asked Burman about climate change. โ€œI want to channel my inner Hohokam Indian. Iโ€™m an Arizona native, and I wish we could have that crystal ball and predict that everything was, you know, climate change. I donโ€™t know if the Hohokam didnโ€™t have fossil fuel problems in the past, but they went through a serious drought in the past, as we know, and they disappeared as an agricultural community.โ€

Parker then asked what CAP was doing to prepare for another โ€œcurveballโ€ from โ€œMother Nature.โ€ 

Burman explained that CAP has been storing water from times when the state experiences excessive rains, and noted that the Hohokam lived during a time of very dry years followed by very wet years. The state is currently in its 27th consecutive year of drought.

The hearing marked the beginning of what will likely be a long session for one of the two committees that will hear a slew of bills related to a key part of Hobbsโ€™ agenda in the coming months. Lawmakers were amicable to the Hobbs appointees, stating they looked forward to working with them in the future. 

โ€œWe need to work together, and I think we have come a long way,โ€ Republican Chairwoman Gail Griffin said at the end of the hearing.

Snow #Drought Current Conditions and Impacts in the West — NIDIS #snowpack (January 16, 2023)

Click the link to read the update on the NIDIS website:

Key Points:

  • A continuous barrage of atmospheric rivers have made landfall in central and northern California, spreading copious amounts of mountain snowfall in the Sierra Nevada, Great Basin, and parts of the Upper Colorado River Basin.
  • Snow water equivalent (SWE) is currently at 200% to over 300% of normal for much of this region, with record high SWE for this time of year at a number of SNOTEL sites in the Sierra Nevada.
  • There are still small areas of snow drought in isolated regions, including the Sangre De Cristo Mountains, straddling the New Mexico-Colorado border. 
  • The northern Rockies is another region to keep an eye on, with many locations at near-to-slightly below normal SWE in northern Idaho, western Montana, and northern Wyoming.ย 

The big story at the moment is the abundance of snow, not the lack of snow, across a large swath of the West. An almost continuous barrage of atmospheric rivers, beginning in the last few days of December, have made landfall in central and northern California, spreading copious amounts of precipitation (including mountain snowfall) in the Sierra Nevada, Great Basin, and parts of the Upper Colorado River Basin. These storms have been largely beneficial for drought improvements, but excessive rainfall has caused major flooding in parts of California. Snow water equivalent (SWE) is currently at 200% to over 300% of normal for much of this region, with record high SWE for this time of year at a number of SNOTEL sites in the Sierra Nevada. Even more encouraging is that many locations, especially at higher elevations, have already exceeded water year peak SWE values that typically occur from mid-March to mid-April. One example is Mammoth Pass, California, in the eastern Sierra Nevada, which currently has 37.4 inches of SWE, 314% of median for the date, and 104% of median water year peak.ย 

All that said, there is still a small spatial extent of snow drought in isolated regions. The Sangre De Cristo Mountains, straddling the New Mexicoโ€“Colorado border, is one of those regions. SWE at most SNOTEL sites in the Sangre De Cristo Mountains is in the range of about 40%โ€“70% of normal. This area has been in the southeast of the storm track with minor impacts but not nearly the amounts of snow that have fallen further north and west. The snowpack in southeastern Arizona and southwestern New Mexico in the Gila Mountains has improved substantially since mid-December. The northern Rockies is another region to keep an eye on, with many locations at slightly below normal SWE (75%โ€“90%) and a number of locations in northern Idaho, western Montana, and northern Wyoming in the 15thโ€“30th percentile.

In Alaska, where observations are limited, most SNOTEL sites indicate that SWE is near normal to above normal, with very limited snow drought. An interesting pattern that set up in early December brought heavy snowfall to the Anchorage area but much less snow a short distance to the southeast around Turnagain Pass. SWE at the Anchorage Hillside SNOTEL site is currently 157% of normal SWE, whereas SWE at Mt. Aleyska, less than 50 miles away, is at just 71% of normal SWE. Snowpack is also below normal along the south side of the Alaska Range with very little snowfall since mid-December.

Stations with SWE Below the 30th Percentile

Snow water equivalent (SWE) percentiles for locations in the western U.S. at or below the 30th percentile as of January 9, 2023. Stations above the 30th percentile* are shown with a black โ€œxโ€. Only SNOTEL and other Cooperative Snow Sensor stations with at least 20 years of data were used. Stations where the median SWE value for the date is zero are not shown. Data Source: USDA Natural Resources Conservation Service.

Snow Water Equivalent Percent of Water Year Peak

Snow Telemetry (SNOTEL) snow water equivalent (SWE) values as a percentage of the USDA Natural Resources Conservation Service (NRCS) 1991โ€“2020 median water year peak. Only stations with at least 20 years of data are included in the station averages. This map is valid as of January 9, 2023. For an interactive version of this map, please visit NRCS.

Daily SWE at Mammoth Pass, California

Daily snow water equivalent (SWE values) at the Mammoth Pass, California Cooperative site. Values for the 2023 water year through January 9, 2023 are shown in blue, and the NRCS 1991โ€“2020 median is shown in red. The January 9 value has already exceeded the water year peak median that occurs around April 1. Data are from the NRCS.

* Quantifying snow drought values is an ongoing research effort. Here we have used the 30th percentile as a starting point based on partner expertise and research. Get more information on the current definition of snow drought here

For More Information, Please Contact:

Daniel McEvoy
Western Regional Climate Center
Daniel.McEvoy@dri.edu

Amanda Sheffield
NOAA/NIDIS California-Nevada Regional Drought Information Coordinator
Amanda.Sheffield@noaa.gov

Britt Parker
NOAA/NIDIS Pacific Northwest Regional Drought Information Coordinator
Britt.Parker@noaa.gov

Just one meal of caught fish per year is a significant dose of #PFAS: โ€œThese fish are incredibly contaminated.โ€

Click the link to read the article on the Environmental Health News website (Grace van Deelen):

People who eat just one U.S. freshwater fish a year are likely to show a significant increase of a cancer-causing chemical in their bloodstream, new research warns.

An analysis of U.S. government data derived from more than 500 fish samples revealed that the majority of fish living in streams, rivers and lakes across the country are contaminated with per- and poly-fluoroalkyl substances (PFAS) at levels almost 300 times higher than found in fish from other sources, including ocean and farmed fish, according to the paper published recently in the journal Environmental Research. 

Importantly, perfluorooctanesulfonic acid (PFOS), a type of PFAS known to be particularly harmful, was the largest contributor to total PFAS levels found in freshwater fish samples, averaging 74% of the total, according to the study.

The U.S. Environmental Protection Agency (EPA)ย considers PFOSย specifically to be a hazardous substance that โ€œmay present a substantial danger to human healthโ€ due to its links to cancer and effects on reproductive, developmental, and cardiovascular health, and warns that the chemical โ€œmay present a substantial danger to human health.โ€ Other PFAS have also been linked to cancer, immune deficiencies, thyroid disease, and other health problems.

Great Lakes Watershed.

Freshwater fish represent an important U.S. food source, especially for people living on a low income. About 660,000 people in the U.S. eat fish they catch themselves three or more times per week.

โ€œConsuming a single freshwater fish could measurably increase PFAS levels in your body,โ€ said David Andrews, a senior scientist at the Environmental Working Group (EWG) and one of the authors of the paper. โ€œThese fish are incredibly contaminated.โ€

Many studies have shown that PFAS chemicals are pervasive in the environment and the new analysis underscores the growing understanding that humans and animals have little avenue for escaping contamination. The research paper found that fish from all 48 continental U.S. states showed PFAS contamination, and only one of the samples did not contain any detectable PFAS.

The study also found higher levels of PFAS among fish from the Great Lakes as compared to water bodies elsewhere, indicating that the Great Lakes are particularly vulnerable to contamination. According to Andrews, this could be because the water in the Great Lakes empties into the ocean much more slowly than other water bodies, aiding the accumulation of PFAS.

Heidi Pickard, a PhD candidate at Harvard University who studies PFAS in aquatic ecosystems and was not involved in the new study, said the results are likely an underestimate of the actual contamination present in fish, given the lack of ability to test for all of the thousands of PFAS chemicals and PFAS precursors โ€” chemicals that break down to form PFAS once they enter the environment.

โ€œWeโ€™re only starting to be able to measure and quantify [other PFAS compounds],โ€ she said.

A ubiquitous pollutant

PFAS are also often referred to as โ€œforever chemicalsโ€ because they do not break down in the environment and bioaccumulate, persisting in the bodies of humans and animals. There are more than 4,000 man-made PFAS compounds used by a variety of industries for such things as electronics manufacturing, oil recovery, paints, fire-fighting foams, cleaning products and non-stick cookware.

According to one nationwide study, 97% of Americans have detectable levels of PFAS in their blood, and the chemical is a ubiquitous pollutant in water and soil across the country.

The Biden Administration is implementing a series of steps to try to restrict PFAS from contaminating water, air, land, and food as well as to clean up PFAS pollution and speed up research on other PFAS issues.

Related: PFAS on our shelves and in our bodies

The findings are โ€œvery concerningโ€ to communities that frequently consume fish from local waterways, said Andrews. The general U.S. population varies greatly in their frequency of fish consumption; anglers, individuals living near water bodies, and immigrant communities coming from cultures with high fish consumption are usually considered the highest consumers.

These people are at higher risk of PFAS contamination; for example, aย 2017 studyย found that higher consumption of fish and shellfish was associated with elevated levels of some PFAS. Aย 2022 studyย of Burmese immigrant anglers in New York State found elevated levels of PFOS in the anglers compared to the general population. Some people, said Pickard, rely on freshwater fish for subsistence and may not be able to afford substituting store-bought fish for locally caught fish.

Catching and eating fish is also a sovereign right for Indigenous tribal nations.

Regulation lacking

While the EPA recognizes that eating U.S. freshwater fish exposes fishers to PFOS, there are currently no federal fish consumption regulations to protect fishers from these or other PFAS chemicals. Only 14 of 50 states have implemented PFAS-specific fish consumption advisories, which does not reflect the full extent of the contamination problem, according to the research paper.

For example, many states in the Great Lakes region use guidelines set by the Great Lakes Consortium for Fish Consumption Advisories to determine regulations. Those guidelines are based on the Environmental Protection Agencyโ€™s 2016 drinking water standards.

Related: What are PFAS? 

In 2022, the EPA substantially lowered the drinking water standards โ€” by about three orders of magnitude โ€” with new interim guidelines. If fish advisories across the country were updated to reflect the EPAโ€™s interim guidelines, nearly all fish from rivers, lakes and streams could be considered unsafe, according to the research paper.

Sean Strom, an environmental toxicologist at the Wisconsin Department of Natural Resources, said a lack of funding and scientific capacity among state agencies is likely hindering the creation of new consumption advisories. States that have been monitoring PFAS for longer are more able to enact public health measures in response to changing science, according to Strom.

There is growing evidence that PFAS are affecting other wildlife across the country. The results for freshwater fish, said Andrews, is โ€œjust scratching the surfaceโ€ of the likely contamination by industrial chemicals happening in ecosystems worldwide.

Pickard agreed and said more research is needed to show how PFAS are impacting the lives and health of wildlife.

โ€œWe have a significant challenge in being able to assess ecological risk for all these PFAS and what thatโ€™s going to mean for species,โ€ she said. โ€œWhat are the biological effects going to be for them?โ€

Cleaning up the countryโ€™s water bodies is unlikely, according to Ranier Lohmann, a professor of marine chemistry who studies PFAS at the University of Rhode Island.

โ€œThereโ€™s not an easy solution to widespread, low-level contamination,โ€ he said.

Editor’s note: This story was produced in collaboration with The New Lede. 

From Your Site Articles

Related Articles Around The Web

PFAS contamination in the U.S. via ewg.org.

Report: The Path to Universally Affordable #Water Access: Guiding Principles for the Water Sector — US Water Alliance

Click the link to access the report on the US Water Alliance website (Mami Hara and Oluwole A. (OJ) McFoy). Here’s the preface:

Water is essential to public health, but the standard, locally-reliant utility revenue model is a precarious way to fund such a fundamental public good. With rising infrastructure and pollution costs, exclusive reliance on local ratepayersย places significant pressure on themโ€”especially those whoย canโ€™t afford their water and sewer bills. Unaffordable water can have very real and harmful consequences, and those consequences become even more severe when water access is lost.

To date, most innovations in affordability, cost control,ย and customer protection have come from local leadersโ€”ย and even more are needed. Eight cities in the US Water Alliance network heard that call to action in spring 2020 as the COVID-19 pandemic wreaked havoc on the economy, disrupting livelihoods, businesses, and all levels of government. With the support of the US Water Alliance, utilities and community partners in each city began a deep exploration of policies and programs that could move them away from the practice of shutting off service or imposing liens for low-income customers behind on their bills.

Each city is making real progress to safeguard water access. Collectively, their work also reveals a key insight:ย the biggest wins are much larger than any single utility policy or program. They lie in creating an environment and context in which water shutoffs for low-income people areย not necessary in the first place.

Creating that context and cultivating our collective under- standing of water and wastewater services as essential public goods will take collective effort. We hope that the insights and principles in this report support local leaders in their affordability and access efforts, while also inspiringย the state and federal policymakers who have a significantย role in ensuring everyone, regardless of income, has access to lifeโ€™s most essential resource.

#RioGrande compact case: #Texas vs. #NewMexico — @AlamosaCitizen

Map showing new point to deliver Rio Grande water between Texas and New Mexico, at an existing stream gage in East El Paso. (Courtesy of Margaret โ€œPeggyโ€ Barroll in the joint motion)

From the Alamosa Citizen “Monday Briefing” newsletter:

Speaking of the Rio Grande, Texas and New Mexico, and to a degree Colorado, have been arguing since 2013 about water from the Rio Grande that Texas says New Mexico shorts it. Now the case has aย proposed settlement. The biggest change the two sides have agreed on is that the gage station in El Paso, not Elephant Butte Reservoir in New Mexico, would be where Texasโ€™ share of the Rio Grande would be measured. The agreement still needs a sign off from the U.S. Supreme Court.

Bureau of Reclamation completes project at #GlenCanyonDam to protect local #water supply during extremely low lake levels #ColoradoRiver #COriver #aridification

Mechanic apprentice Joseph Sams grinds a coupling that is part of the new lower water intake for the city of Page. Reclamation crews at Glen Canyon Dam constructed the new intake as a precaution as Lake Powellโ€™s elevation is at historically low levels.

Click the link to read the article on the Bureau of Reclamation website:

Reclamation crews at Glen Canyon Dam recently completed a new water intake connection to accommodate the low water levels at Lake Powell. These efforts ensure water will be delivered to the city of Page, Arizona, and the LeChee Chapter of the Navajo Nation even if Lake Powell drops to 3,370 feet. Elevation 3,370 feet is known as โ€œdead poolโ€ and is the point at which no โ€œexcessโ€ water can be passed through the dam, only the volume of water that enters the reservoir will be able to be delivered downstream.

Lake Powellโ€™s elevation is expected to drop to a post-filled, all-time low (below 3,522.24) before the end of the month andย projectionsย show that this year it is at risk of dropping below minimum power pool (elevation 3,490 feet), which is the lowest point the dam can currently generate hydropower. The increased risk to Lake Powellโ€™s water level also raised concern about the stability of the local water supply.

A valve for the new lower intake hangs above the work area below Glen Canyon Dam Bridge as crews prepare to put the valve into place.

The city of Page was first established in 1957 for workers who were constructing Glen Canyon Dam.& In 1975, Page became a municipality, which prompted an agreement with Reclamation to deliver raw water from Lake Powell to their municipal water system, which now delivers treated water to the areaโ€™s 7,500 residents, the Navajo Nation community of LeChee, and the local businesses that serve an estimated 3 million tourists each year.

Reclamation personnel Damion Thomas (left) and Randolph Sloan (right) prepare to lower a valve down into what is referred to as a vault, where the valve will tap into two bypass tubes to construct a lower water supply for the nearby communities.

With the completion of this project, the water delivery system can now draw water from Lake Powell at three different elevations: (1)ย the main intake at a reservoir elevation of 3,480 feet, (2) the backup which taps into two penstocks and can access water at elevation 3,462 feet, and (3) the latest and lowest intake which taps into two bypass tubes (also referred to as river outlet works) and can access water as low as elevation 3,362 feet.

The new intake taps into two bypass tubes and then connects to the waterline leading to the municipal water treatment system.

โ€œWorking with personnel from the city of Page and the LeChee Chapter, we started looking for solutions,โ€ said Reclamation Upper Colorado Basin Region Deputy Power Manager Bob Martin. โ€œOur engineers and mechanical crews explored a number of possible options, and we came up with a relatively easy solution to a potentially large problem for the people who rely on this water source.โ€

This latest intake was made possible through an extension of the original water agreement with the city of Page. Crews at Glen Canyon Dam started construction in October and completed the project in December of 2022. The city provided the supplies and paid for the labor.

Glen Canyon Dam has four bypass tubes, also referred to as river outlet works (ROWs) that can draw water from Lake Powell around elevation 3,370 feet, bypassing the powerplant and sending the water downstream. To send water from the new intake to the city of Page, the bypass tubeโ€™s valve is closed, allowing the pipe to fill with water, creating enough head pressure to send the water through the connected piping leading to Pageโ€™s water treatment facility.

โ€œThe design and construction of this project is proof of Reclamationโ€™s commitment to addressing prolonged drought and critically low reservoir levels,โ€ said UCB Regional Director Wayne Pullan. โ€œWe face the impacts of aridification together. The lower water intake at Glen Canyon Dam provides additional water securityโ€”the promise of a continued dependable and reliable water supply.โ€

Tribal leaders stress education, water issues in first-of-its-kind address to Colorado lawmakers: Chairs of Southern Ute and Ute Mountain Ute tribes highlight need for consultation and cooperation — #Colorado Newsline

Click the link to read the article on the Colorado Newsline website (Chase Woodruff):

Leaders of the two federally-recognized Native American tribes within Coloradoโ€™s borders used part of their first annual address to the stateโ€™s General Assembly to brief lawmakers on the long history of their relations with other governments โ€” beginning with a treaty with the Spanish more than a century before the United States existed.

โ€œThe Ute people have been here since time immemorial,โ€ Chairman Manuel Heart of the Ute Mountain Ute Tribe said. โ€œWe as the Ute people have lost a lot over time, up to the present day, 2023 โ€ฆ We all claim these lands as our homelands, but let us look at the past history and what has been taken away.โ€

Heart and Melvin J. Baker, chairman of the Southern Ute Tribe, stressed attention to education and water issues in separate speeches to nearly 100 Colorado lawmakers gathered for a joint session of the state Legislature on Wednesday. They were the first addresses delivered underย Senate Bill 22-105, a law passed last year that invites tribal representatives to give an annual address modeled on the governorโ€™s State of the State speech.

โ€œTodayโ€™s address marks an historic step forward in strengthening our partnership with Coloradoโ€™s Tribes and uplifting the priorities, concerns and accomplishments of those communities,โ€ Senate President Steve Fenberg of Boulder and Majority Leader Dominick Moreno of Commerce City, both Democrats, said in a statement.

The Southern Ute and Ute Mountain tribes are headquartered on reservations in southwest Coloradoโ€™s La Plata and Montezuma counties, respectively, where they were forcibly relocated in the late 19th century following a gold and silver rush in the San Juan Mountains. A third Ute tribe is headquartered on the Uintah and Ouray Indian Reservation in eastern Utah.

In general, Baker said, the two tribes have a strong working relationship with state and local agencies in Colorado.

โ€œWhen we look at other states, we often see friction between the states and the tribes within (their) borders, but not in Colorado,โ€ he said. โ€œColorado is the leader among all states when it comes to honoring the tribal-state relationship.โ€

But both chairmen faulted lawmakers for legislative efforts that have not always taken tribal concerns and sovereignty into account, like its 2019 referral of a sports-betting measure to the statewide ballot, where it was approved by voters. Heart and Baker said that their tribes werenโ€™t consulted on the measureโ€™s language, and have faced hurdles in setting up sports books at tribal casinos.

โ€œThere are times when you legislate that you may not remember that there are two sovereign tribes within your borders,โ€ said Baker.

Education a priority

Heart praised the Legislatureโ€™s passage of Senate Bill 21-116, which prohibits the use of American Indian mascots by public schools and went into effect last year. But he noted that Coloradoโ€™s curriculum standards donโ€™t include specific teachings on the history of the Utes, and called on lawmakers to change that.

โ€œIt is important that future generations are provided with this history and knowledge,โ€ Heart said. โ€œNow is the time to ensure that the oldest continuous residents of this country, their history be required in the curriculum in the public education system.โ€

Other recent legislation passed by the General Assembly includes the creation of a new state office to investigate cases involving missing and murdered Indigenous people. The Colorado Bureau of Investigation last month launched a Missing Indigenous Persons Alert system, which was activated for the first time on Jan. 3 following the disappearance of Wanbli Oyate Vigil, a 27-year-old Denver resident who was found deceased by police two days later.

Heart said a priority for the Ute Mountain Utes is to improve the quality of education on tribal lands. The tribeโ€™s efforts have included the opening of a new charter school in 2021, where students are taught the Ute language and other cultural traditions alongside standard elementary instruction. He spoke of the long-lasting damage caused by the boarding schools where many Native American children were sent under federal forced-assimilation policies as recently as the early 20th century.

โ€œThe boarding school era was an atrocity,โ€ Heart said. โ€œIt had a devastating impact on three to four generations of tribal families in a very negative way, right up to today.โ€

Baker urged lawmakers to consult and cooperate with the Southern Ute Tribe on issues including oil and gas and clean-energy development, as well as regional water management in an age of worsening drought driven by climate change. Both tribes hold key water rights within the Colorado River system, where states, tribal governments and federal agencies are negotiating ahead of a 2026 deadline that could reshape the riverโ€™s future.

โ€œPlease remember that our most important resource is water,โ€ Baker said. โ€œIt is essential that we work together for the protection of those water rights so they are present for future generations.โ€

January 2023 #LaNiรฑa update, and the #ENSO Blog investigates, part 2 — NOAA

Click the link to read the post on the ENSO Blog website (Emily Becker):

Hello from the 103rd Annual Meeting of the American Meteorological Society! Your trusty ENSO correspondent is writing to you from Denver, CO this January. (ENSO = El Niรฑo/Southern Oscillation, the entire El Niรฑo/La Niรฑa system.) Today I have an overview of current conditions and the forecast, before getting back to the question I posed last monthโ€”how does ENSO affect daily temperatures during the winter? Letโ€™s get to it, as thereโ€™s a lot of ground to cover this month!

Current events

The sea surface in the tropical Pacific has been cooler than the long-term average (1991โ€“2020, currently) since mid-2020, and it remains so. However, we did see some weakening of this pattern over the past few weeks.

Sea surface temperatures in the tropical Pacific Ocean from mid-November 2022 through early January 2023 compared to the long-term average. East of the International Dateline (180หš), waters remained cooler than average, a sign of La Niรฑa. Graphic by Climate.gov, based on data from NOAAโ€™s Environmental Visualization Lab.ย Description of historical baseline period.

What we did not see weaken was the La Niรฑa-like atmospheric pattern over the tropical Pacific. The atmosphere typically responds to La Niรฑaโ€™s cooler-than-average sea surface with a stronger-than-average Walker circulation: more rain and clouds over Indonesia than average, less over the central tropical Pacific, and stronger winds, both the near-surface, east-to-west winds, and the upper-level, west-to-east winds. In December, all these patterns were still clearly present.

We also regularly take the temperature of the subsurface tropical Pacific, as the water at depth can supply the surface. Thereโ€™s been a substantial amount of cooler-than-average water under the surface since late summer, but this weakened a lot over Novemberยญโ€“December. However, the subsurface in the eastern Pacific is still relatively cool.

La Niรฑa is still in force, then. Whatโ€™s to come, you ask?

Looking ahead

Letโ€™s get right to the punchline: thereโ€™s anย 82% chanceย that La Niรฑa will have ended and neutral conditions will reign by springtime (Marchโ€“May). Forecasting the exact season (any three-month average is a โ€˜seasonโ€™ in the ENSO-monitoring world) that La Niรฑa will end (Januaryโ€“March? Februaryโ€“April?) is always challenging, since the range of potential outcomes shown in the forecast models is still substantial even just a couple months ahead. Ourย dynamical computer models, computer programs that use complex mathematical equations to predict how current conditions will evolve in the future, are leaning toward an earlier transition. However, the statistical models, which make predictions based on how similar conditions from past years evolved, are thinking neutral conditions will arrive a little later. The forecast team is favoring the statistical modelsโ€™ outlook, in part due to that strong La Niรฑa-like atmospheric circulation I mentioned above.

NOAA Climate Prediction Center forecast for each of the three possible ENSO categories for the next 8 overlapping 3-month seasons. Blue bars show the chances of La Niรฑa, gray bars the chances for neutral, and red bars the chances for El Niรฑo. Graph by Michelle L’Heureux.

You may notice those red bars lurking way over on the right of this chart. Is El Niรฑo in store for next fall/winter??? We need to see more signs of El Niรฑo before we would start expecting that. Itโ€™s still more than 6 months away, and the probabilities for neutral+La Niรฑa are still pretty close to even with El Niรฑo. Also, since ENSO is a seasonal pattern, we need to be able to expect that El Niรฑoโ€™s characteristic warmer-than-average tropical Pacific would be present for more than one or two months in a row. We donโ€™t have strong physical signs right now, either, like a large amount of warmer-than-average water looming under the surface, and the Walker circulation is still amped up. Stay tuned, for sureโ€”but for the moment, we are not issuing an El Niรฑo Watch.

One more thing to mention this monthโ€”California is getting deluged with rain and snow right now with a series of atmospheric rivers. You may be saying โ€œhey wait, I thought La Niรฑa meant California and the southwest would be dry this winter!โ€ Itโ€™s true, typical La Niรฑa impacts include a drier-than-average southwestern U.S. and more rain and snow than average in the Pacific northwest. But ENSO only makes certain seasonal impactsmore or less likelyโ€”itโ€™s not a guarantee of a drier/colder/warmer/wetter winter. If it were a guarantee, it would make our jobs a lot easier! In fact, we have a fairly recent example of another winter that deviated from expected La Niรฑa impacts, 2016โ€“17.

Also, itโ€™s currently impossible to predict short-term weather patterns months in advance. Right now, we can only say that La Niรฑa winters tend to be drier across the southern U.S. Maybe in time weโ€™ll have the capability to predict this type of subseasonal variability months in advance. You can bet there will be a lot of research into understanding the weather and climate drivers behind this extreme rain/snow pattern and if/how climate change factors in.

You promised me daily temperature!

Not a lot of space left in my column for an update on my little investigation into how ENSO affects daily temperature during the winter! So, Iโ€™ll just introduce the next steps and get to the details in an upcoming post.

I looked at the winter daily average temperature in Decemberโ€™s post, including the overall range of daily temperature and how that range looked during El Niรฑo and La Niรฑa separately. We found that, generally, La Niรฑa winters had a wider range of daily temperature across much of North America, with some decreased range in the vicinity of the Hudson Bay. El Niรฑo winters were generally opposite.

We certainly had some extreme temperature swings across a lot of the U.S. over the past few weeksโ€”is that you, La Niรฑa? Just like the heavy rain and snow that California is currently experiencing, we canโ€™t take one short-term example and extend it to the entire season. (Again, weโ€™ll learn a lot from the research that will be conducted about this recent weather.)

But the average temperature isnโ€™t what we really notice, as we go about our daily business. Weโ€™re more likely to notice the highest and/or lowest temperature.

The average variability of daily low temperatures (left) and high temperatures (right) within winter. Yellow regions show where the range of daily temperatures in winter is greatest, while blue shows regions with the narrowest range. The range is assessed using the standard deviation of daily low or high temperature averaged over all winters (Decemberโ€“February), 1950โ€“2020. Daily temperature data source is Berkeley Earth. Map by climate.gov based on analysis by Emily Becker.

Here, weโ€™re looking at the range of daily low and high temperatures during Decemberโ€“February for all winters from 1950โ€“2020. Overall, there is a lot more range in daily low temperatures than highs, especially in the middle of the continent. Only in the subtropical regions of North America do daily maximums vary more than minimums. Details of my analysis are in the footnote.

Thatโ€™s all I have room to talk about this month! Weโ€™ll have to wait for next month to see how ENSO affects the pattern of daily maximum and minimum temperatures we see above and get into some discussion about the physical factors behind these patterns. That is, if thereโ€™s time! Thanks for conducting this science-on-installment experiment with me.

Footnote

Details on the analysis:

  • The maps show the standard deviation of daily maximum or minimum temperature for each winter averaged over all winters 1950โ€“2020.
  • Daily temperature data: I used Berkeley Earth daily average temperature dataset. Itโ€™s also available here.
  • Years included: 1950โ€“2020. Berkeley Earth is available through near-present, but the data I downloaded ended in 2020. Iโ€™ll update with 2021โ€“2022, but I donโ€™t expect the overall results to change.
  • Programming language: I used Python. Jupyter notebook available upon request.

2022 was worldโ€™s 6th-warmest year on record: Antarctic sea ice coverage melted to near-record lows — NOAA

North American Drought Monitor map November 2022.

Click the link to read the article on the NOAA website (John Bateman):

The planet continued its warming trend in 2022, with last year ranking as the sixth-warmest year on record since 1880, according to an analysis by scientists from NOAAโ€™s National Centers for Environmental Information (NCEI).

Below are highlights from NOAAโ€™s 2022 annual global climate report:

A world map plotted with color blocks depicting percentiles of global average land and ocean temperatures for the full year 2022. Color blocks depict increasing warmth, from dark blue (record-coldest area) to dark red (record-warmest area) and spanning areas in between that were “much cooler than average” through “much warmer than average.” (NOAA NCEI)

Climate by the numbers

Earthโ€™s average land and ocean surface temperature in 2022 was 1.55 degrees F (0.86 of a degree C) above the 20th-century average of 57.0 degrees F (13.9 degrees C) โ€” the sixth highest among all years in the 1880-2022 record.  

It also marked the 46th-consecutive year (since 1977) with global temperatures rising above the 20th-century average. The 10-warmest years on record have all occurred since 2010, with the last nine years (2014-2022) among the 10-warmest years.

The 2022 Northern Hemisphere surface temperature was also the sixth highest in the 143-year record at 1.98 degrees F (1.10 degrees C) above average. The Southern Hemisphere surface temperature for 2022 was the seventh highest on record at 1.10 degrees F (0.61 of a degree C) above average. 

Map of global average surface temperature in 2022 compared to the 1991-2020 average, with places that were warmer than average colored red, and places that were cooler than average colored blue. Based on data from NOAA’s National Centers for Environmental Information. (NOAA Climate.gov, using NOAA NCEI data)

2022 as ranked by other scientific organizations

NASA scientists conducted a separate but similar analysis, determining that 2022 ranked as Earthโ€™s fifth-warmest year on record, tied with 2015. The European Commission’s Copernicus websiteoffsite link ranked 2022 as the globeโ€™s fifth-warmest year on record.

An annotated map of the world plotted with the year’s most significant climate events. Please see the story below as well as the report summary from NOAA NCEI at http://bit.ly/Global202212 offsite link. (NOAA NCEI)

Other notable climate findings and events

  • Global ocean heat content (OHC) hit a record high: The upper ocean heat content, which addresses the amount of heat stored in the upper 2,000 meters of the ocean, was record high in 2022, surpassing the previous record set in 2021. The four highest OHCs have all occurred in the last four years (2019-2022).
  • Polar sea ice ran low: The 2022 annual Antarctic sea ice extent (coverage) was at a near-record low at 4.09 million square miles. Only the year 1987 had a smaller annual extent. During 2022, each month had an extent that ranked among the five smallest for their respective months, while the months of February, June, July and August had their lowest monthly extent on record.

In the Arctic, the average annual sea ice extent was approximately 4.13 million square miles โ€” the 11th-smallest annual average sea ice extent in the 1979-2022 record, according to data from the National Snow and Ice Data Centeroffsite link.

  • Global tropical cyclones were near average: A total of 88 named storms occurred across the globe in 2022, which was near the 1991-2020 average. Of those, 40 reached tropical cyclone strength (winds of 74 mph or higher) and 17 reached major tropical cyclone strength (winds of 111 mph or higher). The global accumulated cyclone energy (ACE) โ€” an integrated metric of the strength, frequency and duration of tropical storms โ€” was the fourth lowest since 1981.
  • December 2022 was warm: The average temperature across global land and ocean surfaces in December was 1.44 degrees F (0.80 of a degree C) above the 20th-century average. This ranks as the eighth-warmest December in the 143-year NOAA record. 

Regionally, Africa tied 2016 for its second-warmest December on record. South Americaโ€™s December ranked fourth warmest on record, while Europe saw its 10th warmest. Although North America and Asia both had an above-average December temperature, neither ranked among the 20 warmest on record.

More: Access NOAA NCEIโ€™s year-end 2022 global climate report and images.

Webinar: The Upper #ColoradoRiver and #SanJuanRiver endangered fish recovery programs: Whatโ€™s at stake as reauthorization looms? — @WaterEdCO #COriver #aridification

Readย aboutย the federal role in Colorado water management, including the endangered fish recovery programs,ย and get prepped for the webinar by checking out theย Fall 2022 issue of Headwaters magazine,ย The Federal Nexus.
Photo by Nathan Vargas, U.S. Fish and Wildlife Service

#Snowpack news January 14, 2023

West snowpack basin-filled map January 13, 2023 via the NRCS.

The latest (#ENSO) Diagnostic Discussion is hot off the presses from the #Climate Prediction Center

Plume of ENSO model predications December 2022. Credit: Climate Prediction Center

Click the link to read the discussion on the Climate Prediction Center webiste:

ENSO Alert System Status:ย La Niรฑa Advisory

Synopsis: A transition from La Niรฑa to ENSO-neutral is anticipated during the February- April 2023 season. By Northern Hemisphere spring (March-May 2023), the chance for ENSO-neutral is 82%.

During December, below-average sea surface temperatures (SSTs) weakened over the equatorial Pacific Ocean. All of the latest weekly Niรฑo index values were between -0.7oC and -0.8oC. The subsurface temperature anomalies also weakened substantially, but below-average subsurface temperatures persisted near the surface and at depth in the eastern equatorial Pacific Ocean. However, the atmospheric circulation anomalies over the tropical Pacific Ocean did not notably weaken. Low-level easterly wind and upper-level westerly wind anomalies remained across most of the equatorial Pacific. Suppressed convection persisted over the western and central tropical Pacific, while enhanced convection was observed around Indonesia. Overall, the coupled ocean-atmosphere system continued to reflect La Niรฑa.

The most recent IRI plume predicts that La Niรฑa will transition to ENSO-neutral during the Northern Hemisphere winter 2022-23. Interestingly, the dynamical models indicate a faster transition (January-March) than the statistical models (February-April). At this time, the forecaster consensus favors the statistical models, with a transition to ENSO-neutral in the February-April 2023 season. The sustained atmospheric circulation anomalies and the weakening downwelling oceanic Kelvin wave do not support an imminent transition. However, lower accuracy during times of transition, and when predictions go through the spring, means that uncertainty remains high. In summary, a transition from La Niรฑa to ENSO-neutral is anticipated during the February-April 2023 season. By Northern Hemisphere spring (March- May 2023), the chance for ENSO-neutral is 82%

#Water supply and growth: New annexation rule passes in #ColoradoSprings — KOAA #ColoradoRiver #COriver #aridification

Colorado Springs with the Front Range in background. Photo credit Wikipedia.

Click the link to read the article on the KOAA website (Bill Folsom), Here’s an excerpt:

The ongoing drought in the west motivated a request from Colorado Springs Utilities for an update to city ordinances on annexing new developments into the city. With five in favor and four against, City Council approved the change saying for any development annexations to be considered, the city’s water supply has to be at 130% of what is needed for existing residents. Mayor John Suthers supported the change saying tough decisions are being forced by the current water crisis along the Colorado River Basin.

“Our citizens are asking a simple question, ‘Can you ensure weโ€™ll have enough water?’ This ordinance acts in the public interest and answers that question loud and clear,” said Suthers…

Many developers from the community spoke against the change saying it will make large developments outside the city almost impossible.

Suthers Tweeted, “If we do nothing to maintain a buffer between our water supply and our water usage, and the city suffers a major curtailment of our Colorado River water, further drought will put us in an untenable situation, and we will be responsible for a failure of public policy.”

Colorado Springs Utilities (CSU) recommendedย the 130% number following an in-depth review of the organization’s capacity and ability to provide water to the city’s citizens.ย  Utilities maintain that the city’s 30% margin buffer allows CSU to consistently provide water year in and year out.

2022โ€™s billion-dollar disasters: #ClimateChange helped make it USโ€™s 3rd most expensive year onย record — The Conversation #ActOnClimate #KeepItInTheGround

Several areas were hit with 1,000-year floods in 2022. Leandro Lozada/AFP via Getty Images

Stacy Morford, The Conversation

U.S. weather disasters are getting costlier as more people move into vulnerable areas and climate change raises the risks of extreme heat and rainfall, National Oceanic and Atmospheric Administration officials warned as they released their annual billion-dollar disasters report on Jan. 10, 2023.

Even with an average hurricane season, 2022 had the third-highest number of billion-dollar disasters in the U.S. since 1980.

In all, there were 18 disasters that each caused more than US$1 billion in damage in the U.S. The list included three hurricanes, two tornado outbreaks, a destructive fire season, several extreme storms and a drought that disrupted sectors across the economy.

Map showing disasters, including several severe storms
2022 had 18 disasters that exceeded $1 billion each in damage. NCEI/NOAA

It was also the third-costliest year, with past years adjusted for inflation, due primarily to Hurricane Ianโ€™s widespread damage in Florida. Together, the 2022 disasters topped $165 billion, with damage still being tallied from Decemberโ€™s winter storms.

Several scientists wrote about the yearโ€™s U.S. weather disasters and connections to climate change. Here are three essential reads from The Conversationโ€™s archive:

1. Hurricane Ian

The most expensive U.S. weather disaster of 2022 was Hurricane Ian, which grew into a monster of a storm over the warm waters of the Gulf of Mexico in late September.

Ian hit the barriers islands off Fort Myers, Florida, with 150-mph winds, tying for the fifth-strongest wind speed at U.S. landfall on record. Its storm surge swept through coastal neighborhoods, where the population has boomed in recent years, and its rainfall caused flooding across a large swath of the state. Twenty inches of rain fell in Daytona Beach, triggering erosion, with devastating consequences.

At least 144 deaths were attributed to the storm in Florida alone, and the total damage neared $113 billion.

Houses on a road, now underwater, are torn apart, with water on both sides.
Hurricane Ianโ€™s wind and storm surge tore up homes and roads on the Gulf Coast. Win McNamee/Getty Images

Did global warming play a role?

In some ways, yes, but there are still a lot of unknowns when it comes to hurricanes, explained climate scientists Matthew Barlow of UMass-Lowell and Suzana Camargo of Columbia University.

For example, โ€œit is clear that climate change increases the upper limit on hurricane strength and rain rate, and that it also raises the average sea level and therefore storm surge,โ€ Barlow and Camargo wrote.

Less clear is global warmingโ€™s influence on hurricane frequency, though research points to an uptick in the strength of storms that do form. โ€œWe expect more of them to be major storms,โ€ the scientists wrote. โ€œHurricane Ian and other recent storms, including the 2020 Atlantic season, provide a picture of what that can look like.โ€

Globally, 2022 was the fifth or sixth warmest year in over 140 years of record-keeping, according to data sets from NASA and NOAA. The last eight years have been the warmest on record. Ocean temperatures were also at record highs in 2022.

2. The drought

The second-costliest disaster, at over $22 billion, was the widespread drought across much of the U.S. West and parts of the Midwest. It left reservoirs near record lows, disrupted farming in several states and temporarily shut down barge traffic on the Mississippi River.

At one point, 2,000 barges were backed up along the river, where 92% of U.S. agriculture exports travel. https://www.youtube.com/embed/MM-menv6EJA?wmode=transparent&start=0 The Mississippi River drought in October 2022.

Rivers the size of the Mississippi can be slow to respond to droughts, but during the flash drought of 2022, the river fell 20 feet in less than three months โ€“ even though its major tributaries were flowing at normal levels, wrote earth scientists Ray Lombardi, Angela Antipova and Dorian Burnette of the University of Memphis.

They described the dramatic drop in the riverโ€™s water levels as a โ€œpreview of a climate-altered future.โ€

โ€œWarmer atmospheric temperatures have the potential to evaporate more water, causing drought, and to hold more water, causing extreme rainfall,โ€ the scientists wrote. โ€œOver the past 100 years, year-to-year changes from very dry to very wet in the Mississippi River Valley have become more frequent. We expect this trend to continue as global temperatures continue to rise because of climate change.โ€

3. Extreme storms and flooding

A girl in rain boots walks through a mud-filled yard. Damaged mattresses and other belongings from a flooded house are piled nearby.
Flash flooding swept through mountain valleys in eastern Kentucky in July 2022, killing more than three dozen people. It was one of several destructive floods. Seth Herald/AFP via Getty Images

Many of 2022โ€™s billion-dollar disasters involved extreme storms, including hail, deadly tornado outbreaks, and a derecho that damaged property from Wisconsin to West Virginia.

It was also a summer of flooding, beginning with rain falling on snow that turned the Yellowstone River into a record-shattering torrent. St. Louis, Dallas, eastern Kentucky, southern Illinois and Death Valley were all hit with 1,000-year floods. Storms in the South knocked out Jackson, Mississippiโ€™s fragile water supply for weeks.

Climate models have consistently shown that extreme rainfall events will become more common as the climate warms, wrote University of Dayton climate scientist Shuang-Ye Wu.

Some of that is basic physics โ€“ warmer air increases the amount of moisture that the atmosphere can hold by about 7% per degree Celsius. Increased humidity can enhance latent heat in storms, increasing their intensity and leading to heavier rainfall, Wu explained. https://datawrapper.dwcdn.net/RYI24/10/

Even though humans are becoming more adept at managing climate risks, research published in 2022 found that extreme flooding and droughts are still getting deadlier and more expensive, and the costs are likely to continue to rise.

โ€œThis past summer might just provide a glimpse of our near future as these extreme climate events become more frequent,โ€ Wu wrote. โ€œTo say this is the new โ€˜normal,โ€™ though, is misleading. It suggests that we have reached a new stable state, and that is far from the truth.โ€

This article was updated with NOAAโ€™s release of global temperature data on Jan. 12, 2023. It is a roundup of articles from The Conversationโ€™s archives.

Stacy Morford, Environment + Climate Editor, The Conversation

This article is republished from The Conversation under a Creative Commons license. Read the original article.

Department of Interior needs to review agricultural use of #water amid negotiations for #ColoradoRiver cuts — Bruce Babbit for The #Nevada Independent #COriver #aridification

A center-pivot irrigation system that replaced a less efficient irrigation system in Diamond Valley through a Nevada Department of Agriculture grant. (Courtesy of Nevada Department of Agriculture)

Click the link to read the guest column on Nevada’s only statewide nonprofit newsroom The Nevada Independent website (Bruce Babbit):

As Lake Mead continues to decline toward dead pool, federal officials are requesting the  Colorado River states  to offer major cuts in water usage.

Nevada has responded with a detailed and innovative plan set forth in a  December 20, 2022 letter to the Bureau of Reclamation,  calling for basic reform of water management throughout the entire Colorado River system. It is centered on protecting water levels in Lake Powell  and Lake Mead with new rules for apportioning reduced water deliveries throughout the system.

The plan assures that water levels behind Glen Canyon Dam in the upper basin will not fall below a level necessary to protect hydropower production and the structure of the dam itself.

For Lake Mead in the lower basin the plan would set rules assuring that water levels cannot fall below a new โ€œLake Mead Protection Levelโ€ sufficient to provide an 18 month reserve for โ€œpublic, health and safetyโ€ of municipal users.

The plan calls on the three lower Basin states, Arizona, California and Nevada, to offer a million and a half acre feet of reductions, in addition to cuts previously agreed upon in the 2019 Drought Contingency Plan (DCP). This new round of cuts calls for โ€œequitable sharing of evaporation and system lossesโ€ย  among the three states in proportion to their โ€œaverage annual consumptive use for the period 2019 to 2021.โ€ย 

Reaching consensus on such an inventive, far reaching proposal, will take time. The seven basin states and the Interior Department have until 2026, when current regulations expire, to reach agreement on new rules. 

However, one critical provisionโ€”the 1.5 million acre feet reduction in diversions from Lake Meadโ€”cannot wait that long. It must be agreed upon and implemented immediately to avoid disaster.  

Arizona and California have not responded in public.  They remain on the sidelines, unable  to summon the political will to either agree or to propose an alternative.   

The reason Arizona and California are internally deadlocked can be summed up in one word: agriculture. Irrigated agriculture uses more than 70 percent of  the water allocated to the two states from Lake Mead.  A fair settlement will not be possible unless agriculture takes its share of the cuts. 

Agricultural Irrigation districts in Arizona and California resist offering cuts, claiming an absolute priority under century-old legal doctrines. They claim an unqualified priority right to continue growing alfalfa for cattle feed that comes ahead of an adequate water supply for Los Angeles, Phoenix, Tucson, San Diego and Los Angeles. 

The Interior Department has the power to break this deadlock. The department, as water master of the lower Colorado River, has broad authority over water allocation and management. A federal regulation, known as Section 417, gives the department authority to limit agricultural water deliveries to that amount โ€œreasonably required for beneficial use.โ€

What is reasonably required is a judgment that can take into account many factors, including the needs of cities, towns, power plants, mineral extraction, recreation, and more. And what is reasonable for irrigation allocations in normal years may be entirely unreasonable when Hoover Dam, Glen Canyon Dam and the entire Colorado River system are at risk of collapse. 

It is now time for the Interior to use its Section 417 authority for an expansive review of all agricultural use contracts and to reduce allocations to reflect a fair measure of burden sharing.  This review should begin in an open and transparent process without further delay.

Bruce Edward Babbitt is an attorney and politician from the state of Arizona. A member of the Democratic Party, Babbitt served as the 16th governor of Arizona from 1978 to 1987, and as President Bill Clinton’s secretary of the interior from 1993 to 2001.

#Aurora poised to double capacity of Prairie Waters riverbank filtration project with federal grant — The Aurora Sentinel #SouthPlatteRiver

Prairie Waters schematic via Aurora Water.

Click the link to read the article on The Aurora Sentinel website (Max Levy). Here’s an excerpt:

Aurora is planning an expansion to its innovative Prairie Waters project with the help of a $5 million federal grant, a project that city staffers say could recover enough water to support thousands of homes. The grant, which the federal government says the city is likely to receive, would be used toward the $11.5 million undertaking of digging a new pump station and radial well, which would draw water from below the South Platte River.

โ€œDrought has been something weโ€™re needing to tackle and handle more and more as the years go on, and so having this resource come from the South Platte instead of the mountains is definitely a drought resiliency component,โ€ said Aurora Water staffer Justin Montes, who applied for the federal grant…

Radial wells consist of a single vertical shaft ending in multiple horizontal shafts that radiate outward like the spokes of a wheel. The radial well and pump station would be part of an expansion to the Prairie Waters project including another radial well that the city plans to dig in 2024. Aurora Water representatives say the entire expansion has the potential to double the water recovered by the project, which uses wells dug near the South Platte River to collect water that has been absorbed and naturally filtered by the riverbank. By the time water is collected by the wells, it has already passed through hundreds of feet of sediment beneath the South Platte, filtering out pathogens, organic chemicals and other contaminants. Montes said the process can also filter out debris introduced by wildfires.

Would you believe that 2/3 of total precipitation observations in NOAA’s dataset came from: @CoCoRaHS volunteer observers in 2022?! Incredible stat from Imke Durre at our session celebrating 25 years of the network — @Russ_Schumacher #AMS2023

A young Nolan Doesken with a rain gauge via @realwaterplease

โ€˜Last nail in the coffinโ€™: #Utahโ€™s #GreatSaltLake on verge of collapse — The Guardian #aridification

PHOTO CREDIT: McKenzie Skiles via USGS LandSat The Great Salt Lake has been shrinking as more people use water upstream.

Click the link to read the article on The Guardian website (Maanvi Singh). Here’s an excerpt:

Emergency measures are required to avert a catastrophe in Utahโ€™s Great Salt Lake, which has been drying up due to excessive water use, a new report warns. Within years, the lakeโ€™s ecosystems could collapse and millions will be exposed to toxic dust contained within the drying lakebed, unless drastic steps are taken to cut water use. A team of 32 scientists and conservationists caution that the lake could decline beyond recognition in just five years. Their warning is especially urgent amid a historic western megadrought fueled by global heating. To save the lake, the report suggests 30-50% reductions in water use may be required, to allow 2.5m acre-feet of water to flow from streams and rivers directly into the lake over the next two years.

โ€œWe really need to increase the speed of our response, and also increase our ambition for how much water we restore to the lake,โ€ said Ben Abbott, an ecologist at Brigham Young University and one of the reportโ€™s lead authors…

Despite growing political momentum, Abbott said that existing policies and action plans will not be enough to save the lake from collapse. Already, the lake has lost 73% of its water and 60% of its surface area, as trillions of litres of water are diverted away from it to supply farms and homes. As a result, the lake is becoming saltier and uninhabitable to native flies and brine shrimp. Eventually, the lake will be unable to sustain the more than 10 million migratory birds and wildlife that frequent it. Declining lake levels could also make magnesium, lithium and other critical minerals extraction infeasible within the next two years. Dust from the exposed lakebed could further damage crops, degrade soil and cause snow to melt more quickly โ€“ triggering widespread economic losses for Utahโ€™s agriculture and tourism industries. Toxic sediment, laced with arsenic, from the lakebed can exacerbate respiratory conditions and heart and lung disease, and could increase residentsโ€™ risk for cancer…

The climate crisis, which has increased average temperatures in northern Utah by 4F since the early 1900s, is further imperilling the lake, fuelling more severe droughts and heatwaves. But studies suggest that only about 9% of the lakeโ€™s decline due to evaporation and reduced runoff can be blamed on climate change. A legacy of water overuse is the main threat to the largest saltwater lake in the western hemisphere, and huge water diversions to irrigate vast operations to grow alfalfa and hay are no longer sustainable in Utah, Abbott said, nor are lush lawns in cities and suburbs.

Imperial Irrigation District (IID) Vice President and Division 2 Director JB Hamby will serve as Chairman of the #ColoradoRiver Board of #California #COriver #aridification

The All-American Canal conveys water from the Colorado River to the Imperial Valley in Southern California. The Imperial Irrigation District is the largest user of Colorado River water. CREDIT: HEATHER SACKETT/ASPEN JOURNALISM

Click the link to read the article on the Imperial Valley Irrigation District website:

Imperial Irrigation District Vice President and Division 2 Director JB Hamby will serve as Chairman of the Colorado River Board of California following his unanimous election during Wednesdayโ€™s meeting held in Ontario, California.

Imperial Irrigation District Vice President and Division 2 Director JB Hamby will serve as Chairman of the Colorado River Board of California following his unanimous election during Wednesdayโ€™s meeting held in Ontario, California.

Hamby has served on the Colorado River Board since April of 2021 and is IIDโ€™s fourth member to serve as its chairman. IIDโ€™s Executive Superintendent, President, and Division 1 Director Evan T. Hewes served as the boardโ€™s first chairman from 1938 to 1947, followed by the districtโ€™s Executive Officer Munson J. Dowd from 1962 to 1965, and last by Division 3 Director Lloyd Allen from 2002 to 2006.

As chairman, Hamby serves ex-officio as the Colorado River Commissioner for the State of California. The commissioner is responsible for conferring with representatives of the seven Colorado River basin states and United States on the use of Colorado River water and safeguarding the rights and interests of the state, its agencies, and citizens, pursuant to the federal Boulder Canyon Project Act and the California Water Code.

โ€œThis is a historic time of reckoning on the Colorado River where growing demand over the decades exceeds a shrinking supply due to chronic drought and aridification,โ€ Hamby said. โ€œProtecting Californiaโ€™s stake on the Colorado River is vital to our future in Southern California. I look forward to working closely with the boardโ€™s member agencies โ€” both agricultural and urban โ€” to develop solutions that respect the Law of the River for the benefit of all Californians.โ€

The Colorado River Board is composed of representatives of the Coachella Valley Water District, Imperial Irrigation District, Los Angeles Department of Water and Power, the Metropolitan Water District of Southern California, Palo Verde Irrigation District, San Diego County Water Authority, and the state directors of Water Resources and Fish and Wildlife.

Californiaโ€™s Colorado River contractors have proposed to conserve up to an additional 400,000 acre-feet of water in Lake Mead each year, beginning in 2023 through 2026. The water, which would otherwise be consumed by Californiaโ€™s communities and farms, would leave up to 1.6 million acre-feet of water behind Hoover Dam at Lake Mead as part of a seven state and federal effort to stabilize the rapidly declining Colorado River system.

California has the largest entitlement to Colorado River water of the seven basin states which serves drinking water to over 19 million people in Southern California and irrigates over 600,000 acres of highly productive agricultural lands that produce fruits, vegetables, and other crops that are a core part of the national and global food supply.

Data dashboard: #RoaringForkRiver basin #snowpack reaches 126% of average: ย 18.1 inches of SWE recorded at Schofield Pass — @AspenJournalism (January 13, 2023)

Click the link to access the dashboard on the Aspen Journalism webiste (Laurine Lassalle):

Aspen Journalism is compiling a data dashboard highlighting metrics of local public interest, updated weekly.

Snowpack at McClure Pass roughly 150% of average

Snowpack in the Roaring Fork basin reached 126% of average for Jan. 8 with 9.7 inches of snow-water equivalent, according to NOAA. Recent snowfall has increased the basin snowpack by 43% in the past two weeks.

SNOTEL sites that monitor snowfall throughout the winter measured the snowpack at Independence Pass at 94.9% of average on Jan. 8, with a โ€œsnow water equivalentโ€ (SWE) of 7.4 inches, up from 6.81 inches on Jan. 8. Last year on Jan. 8, the SNOTEL station up the pass (located at elevation 10,600 feet) recorded an SWE of 8.58 inches, or 110% of average.

The monitoring station at McClure Pass located at elevation 9,500 feet recorded a SWE of 11.18 inches on Jan. 8, or 149.1% of average. Thatโ€™s up from a SWE of 9.09 inches on Jan. 1. Last year, on Jan. 8, the station also measured a snowpack holding 8.39 inches of water.

On the northeast side of the Roaring Fork Basin, snowpack at Ivanhoe, which sits at an elevation of 10,400 feet, reached 8.5 inches on Jan. 8, or 123.2% of average.

Snowpack at Schofield Pass reached 18.11 inches on Jan. 8, which represents 123.2% of average. Schofield Pass sits at an elevation of 10,700 feet between Marble and Crested Butte.

Snow water equivalent โ€” the metric used to track snowpack โ€” is the amount of water contained within the snowpack, which will become our future water supply running in local rivers and streams.

Colorado snowpack basin-filled map January 12, 2023 via the NRCS.

Emergency measures needed to rescue #GreatSaltLake from ongoing collapse — Brigham Young University #ActOnClimate

Figure 1. A bridge where the Bear River used to flow into Great Salt Lake. Photo: EcoFlight.

Click the link to access the paper on the Brigham Young University website (Benjamin W. Abbott, Bonnie K. Baxter, Karoline Busche, Lynn de Freitas, Rebecca Frei, Teresa Gomez, Mary Anne Karren, Rachel L. Buck, Joseph Price, Sara Frutos, Robert B. Sowby, Janice Brahney, Bryan G. Hopkins, Matthew F. Bekker, Jeremy S. Bekker, Russell Rader, Brian Brown, Mary Proteau, Gregory T. Carling, Lafe Conner, Paul Alan Cox, Ethan McQuhae, Christopher Oscarson, Daren T. Nelson, R. Jeffrey Davis, Daniel Horns, Heather Dove, Tara Bishop, Adam Johnson, Kaye Nelson, John Bennion, Patrick Belmont). Here’s the executive summary:

  1. Great Salt Lake is a keystone ecosystem in the Western Hemisphere. The lake and its wetlands provide minerals for Utahโ€™s industries, thousands of local jobs, and habitat for 10 million migratory birds1โ€“4. Fertilizer and brine shrimp from the lake feed millions of people worldwide5,6. The lake provides $2.5 billion in direct economic activity yearly7โ€“10, as well as increasing precipitation, suppressing toxic dust, and supporting 80% of Utahโ€™s wetlands11โ€“17.
  2. Excessive water use is destroying Great Salt Lake. At 19 feet below its average natural level since 1850, the lake is in uncharted territory18โ€“22. It has lost 73% of its water and 60% of its surface area23โ€“26. Our unsustainable water use is desiccating habitat, exposing toxic dust, and driving salinity to levels incompatible with the lakeโ€™s food webs1,24,27โ€“29. The lakeโ€™s drop has accelerated since 2020, with an average deficit of 1.2 million acre-feet per year. If this loss rate continues, the lake as we know it is on track to disappear in five years.
  3. We are underestimating the consequences of losing the lake. Despite encouraging growth in legislative action and public awareness, most Utahns do not realize the urgency of this crisis. Examples from around the world show that saline lake loss triggers a long-term cycle of environmental, health, and economic suffering30โ€“35. Without a coordinated rescue, we can expect widespread air and water pollution, numerous Endangered Species Act listings, and declines in agriculture, industry, and overall quality of life1โ€“4,36.
  4. The lake needs an additional million acre-feet per year to reverse its decline. This would increase average streamflow to ~2.5 million acre-feet per year, beginning a gradual refilling. Depending on future weather conditions, achieving this level of flow will require cutting consumptive water use in the Great Salt Lake watershed by a third to a half. Recent efforts have returned less than 0.1 million acre-feet per year to the lake37, with most conserved water held in reservoirs or delivered to other users rather than released to the lake.
  5. Water conservation is the way. While water augmentation is often discussed (pipelines, cloud seeding, new reservoirs, and groundwater extraction, etc.), conservation is the only way to provide adequate water in time to save Great Salt Lake33,38โ€“41. Conservation is also the most cost effective and resilient response42,43, and there are successful examples throughout the region44โ€“48. Ensuring financial, legislative, and technical support for conservation will pay huge dividends during this crisis and for decades to come1,38,46,49.
  6. We need to increase trust and coordination. New legislation allows users to return water to the lake while retaining rights50. However, lack of trust and cooperation between farmers, cities, managers, and policymakers is hobbling our response33,38. Users often have financial disincentives to conserve, and farmers often lack legal counsel to navigate policy changes.
  7. We call on the governorโ€™s office to implement a watershed-wide emergency rescue. We recommend setting an emergency streamflow requirement of at least 2.5 million acre-feet per year until the lake reaches its minimum healthy elevation of 4,198 feet51. Executive leadership is needed for water leasing, farmer compensation, water donations, and conveyance52. Every major water user needs to be educated, empowered, and assured that their conserved water will be shepherded to Great Salt Lake. We need clear thresholds that trigger binding emergency conservation measures to stop the lakeโ€™s collapse.
  8. We call on the legislature to fund and facilitate the rescue. Recent bills have laid the groundwork, and a surge of funding is now needed to lease or purchase water and support farmers and cities to dramatically reduce consumption. Likewise, legislation is needed to put in place the policies, accounting, and monitoring for water shepherding to the lake and long- term sustainable water use52.
  9. We call on every water user and manager to conserve water and support state efforts. We are in an all-hands-on-deck emergency, and we need farmers, counties, cities, businesses, churches, universities, and other organizations to do everything in their power to reduce outdoor water use. We believe that our community is uniquely suited to face this challenge, but only if we implement a unified and pioneering rescue. By taking a โ€œlake firstโ€ approach to water use, we can leave a legacy of wise stewardship for generations to come.
Satellite photo of the Great Salt Lake from August 2018 after years of drought, reaching near-record lows. The difference in colors between the northern and southern portions of the lake is the result of a railroad causeway. The image was acquired by the MSI sensor on the Sentinel-2B satellite. By Copernicus Sentinel-2, ESA – https://scihub.copernicus.eu/dhus/#/home, CC BY-SA 3.0 igo, https://commons.wikimedia.org/w/index.php?curid=77990895

Possible deal to end #RioGrande SCOTUS case becomes public: #NewMexico would deliver #Texas its #water at the state line; new guidelines for farmers south of Elephant Butte — Source New Mexico

Visitors to Elephant Butte State Park fish despite the diminishing water levels that have exposed wide sand flats all around the lake, on Sept. 23. (Corrie Boudreaux/El Paso Matters)

by Danielle Prokop, Source New Mexico
January 11, 2023

A proposed agreement between Texas, New Mexico and Colorado was unsealed Monday, months after the states announced a deal to end nearly a decade-old Supreme Court case over Rio Grande water. 

The deal would amend the 83-year old legal basis for how the three states split water from the river under the Rio Grande Compact. If allowed by the Supreme Court, the decree would end the lawsuit thatโ€™s called Original No. 141 Texas v. New Mexico and Colorado. The case has stretched over nine years and cost New Mexico and Texas taxpayers tens of millions of dollars.ย  Map showing new point to deliver Rio Grande water between Texas and New Mexico, at an existing stream gage in East El Paso. (Courtesy of Margaret โ€œPeggyโ€ Barroll in the joint motion)

Map showing new point to deliver Rio Grande water between Texas and New Mexico, at an existing stream gage in East El Paso. (Courtesy of Margaret โ€œPeggyโ€ Barroll in the joint motion)

Among the changes, Texasโ€™ share of Rio Grande water would be measured at a point on the state line at an El Paso Gage instead of NMโ€™s current requirement to deliver Texasโ€™ water 100-plus miles upstream at the Elephant Butte Reservoir. 

The agreement offers a new set of calculations to determine what water is owed to southern New Mexico farmers and far west Texans, and incorporates groundwater pumping in the formulas. 

Finally, it also offers conditions for New Mexico and Texas to handle disputes about over- or under-deliveries of Rio Grande water. 

To provide water for those deliveries, the New Mexico Office of the State Engineer could shut down wells, or use other limits such as paying farmers to retire land from farming to save irrigation water, court documents show. 

In sworn statements attached to the proposed agreement, top water officials from New Mexico and Texas urged the Supreme Court to accept the proposal. 

Bobby Skov, the Rio Grande compact commissioner for Texas, called the deal โ€œfairโ€ and โ€œconsistent with the compact.โ€ 

State Engineer Mike Hamman, who is also New Mexicoโ€™s compact commissioner, said the agreement resolves the long-standing issues between the two states and offers clear directions for how to stay in compliance with the agreements. 

โ€œI anticipate the consent decree will help the states avoid future conflicts,โ€ Hamman wrote. 

A key change to the document includes transfers of water between New Mexico and Texas irrigation districts to balance out years when New Mexico pumping or diversions cause not enough Rio Grande water to reach the state line. Courtesy photo showing the both Elephant Butte Reservoir, where Texasโ€™ Rio Grande water is currently stored to new location to measure New Mexicoโ€™s compliance with delivering water at the existing El Paso Gage, just over 100 miles downstream. (Courtesy of Willian Hutchison declaration).

Courtesy map showing the both Elephant Butte Reservoir, where Texasโ€™ Rio Grande water is currently stored to new location to measure New Mexicoโ€™s compliance with delivering water at the existing El Paso Gage, just over 100 miles downstream. (Courtesy of Willian Hutchison declaration).

If the state fails to meet new delivery requirements for three consecutive years, then the agreement requires the state to send additional water from the New Mexico irrigation district to the Texas irrigation district. 

In order to provide water to make up for any shortfalls, Hamman offered seven bullet points in his letter supporting the agreement. 

Hamman said the N.M. Office of the State Engineer could curb groundwater pumping; monitor groundwater pumping, buy water rights to retire groundwater wells; fallow farmland temporarily; increase conservation in both municipal and agricultural use; or attempt to import water to the Lower Rio Grande. 

Hamman warned the state office will enforce well shutdowns if voluntary or compensated measures arenโ€™t working. 

New Mexico is still embroiled in the lengthy court process that started in 1996 to determine the legal order of water rights between Caballo Reservoir and the state line for farmers, municipalities, businesses and the federal government. 

As for next steps, a hearing on the proposed decree is tentatively scheduled for February 2023.

HOW WE GOT HERE

The Supreme Court case was sparked by decades of litigation over the Lower Rio Grande โ€” the region between Caballo Reservoir and where the river often evaporates above Fort Quitman, about 90 miles along the Texas-Mexico border.  

In 2014, Texas filed a complaint in the Supreme Court alleging New Mexico groundwater pumping below Elephant Butte illegally captured Rio Grande water promised to Texas.

The proposed agreement is the product of monthslong confidential negotiations between the parties in the case โ€” New Mexico, Texas, Colorado and the federal government. The discussions included input from impacted organizations such as farming associations, the two regional irrigation districts, the cities of Las Cruces and El Paso, New Mexico State University, and water utilities in Albuquerque and El Paso. 

In earlier filings, the federal government and El Pasoโ€™s major irrigation district asked the special master overseeing the case to throw out the proposed decree because it was the result of an incomplete settlement and makes concessions the states cannot enforce, according to legal filings. 

Last week, Judge Michael Melloy overruled the federal governmentโ€™s arguments that the proposed agreement must be kept secret, ordering most of the documents to be made public.

The United Stateโ€™s objections to the proposed decree remain filed under seal, and are not public at this time.

Source New Mexico is part of States Newsroom, a network of news bureaus supported by grants and a coalition of donors as a 501c(3) public charity. Source New Mexico maintains editorial independence. Contact Editor Marisa Demarco for questions: info@sourcenm.com. Follow Source New Mexico on Facebook and Twitter.

Map of the Rio Grande watershed. Graphic credit: WikiMedia

#California suddenly has so much snow. But even this extraordinary bounty isnโ€™t enough — The Los Angeles Times (January 12, 2023) #snowpack

We are seeing the best start to our snowpack in over a decade. But it is only a start โ€“ most of the winter season has yet to unfold, major reservoirs hold below-average storage, and last years’ experience demonstrates that powerful storms can punctuate but not end a drought. Photo credit: California DWR

Click the link to read the article on The Los Angeles Times website (Haley Smith). Here’s an excerpt:

At the UC Berkeley Central Sierra Snow Laboratory in Donner Pass on Wednesday, snow was piled so high that lead scientist Andrew Schwartz no longer needed stairs to exit the second floor.

โ€œWe just walk directly out onto the snow!โ€ Schwartz said. The nearly 11 feet of snow surrounding the lab was the deepest heโ€™d seen so far this year. 

The piles of powder are the result of aย series of powerful atmospheric river stormsthat have pummeled California over the last two weeks. The storms have claimed at least 19 lives as they topple trees, overtop levees and send people scrambling for higher ground.

West Drought Monitor map January 10, 2023.

But while the storms have delivered chaos, they have also helped to make a dent in drought conditions. The stateโ€™s snow water equivalent โ€” or the amount of water contained in the snow โ€” was 226% of normal on Wednesday, marking a high for the date not seen in at least two decades. The last time snowpack neared such a high on Jan. 11 was in 2005, when it was 206% of normal,ย according to state data. Even more promising, the Sierra snowpack on Wednesday measured 102% of its April 1 average, referring to the end-of-season date when snowpack in California is usually at its deepest. This is the first time thatโ€™s happened on Jan. 11 in at least 20 years…

DWR water operations manager Molly White said reservoirs were also seeing boosts from the storms, with some smaller reservoirs recovering fully from drought-driven deficits. But the stateโ€™s two largest reservoirs, Lake Shasta and Lake Oroville, remain far from full, topping out atย 42% and 47% of capacity, respectively,ย on Wednesday…

[John] Abatzoglou said Wednesdayโ€™s snowpack levels were impressive, and noted that the most recent U.S. Drought Monitor update saw the worst category, โ€œexceptional drought,โ€ย erased from Californiaโ€™s map altogether. Only a week before that update, more than 7% of the state was in that category.

Article: Rhetoric and frame analysis of ExxonMobil’s #ClimateChange communications — Science Direct #ActOnClimate #KeepItInTheGround #ExxonKnew

Graphical abstract from

Click the link to access the paper on the Science Direct website (Geoffrey Supran and Naomi Oreskes). Here’s the summary:

Highlights

  • ExxonMobilโ€™s public climate change messaging mimics tobacco industry propaganda
  • Rhetoric of climate โ€˜โ€˜riskโ€™โ€™ downplays the reality and seriousness of climate change
  • Rhetoric of consumer โ€˜โ€˜demandโ€™โ€™ (versus fossil fuel supply) individualizes responsibility
  • Fossil Fuel Savior frame uses โ€˜โ€˜riskโ€™โ€™ and โ€˜โ€˜demandโ€™โ€™ to justify fossil fuels, blame customers

SCIENCE FOR SOCIETY A dominant public narrative about climate change is that โ€˜โ€˜we are all to blame.โ€™โ€™ Another is that society must inevitably rely on fossil fuels for the foreseeable future. How did these become conventional wisdom? We show that one source of these arguments is fossil fuel industry propaganda. ExxonMobil advertisements worked to shift responsibility for global warming away from the fossil fuel industry and onto consumers. They also said that climate change was a โ€˜โ€˜risk,โ€™โ€™ rather than a reality, that renewable energy is unreliable, and that the fossil fuel industry offered meaningful leadership on climate change. We show that much of this rhetoric is similar to that used by the tobacco industry. Our research suggests warning signs that the fossil fuel industry is using the subtle micro-politics of language to downplay its role in the climate crisis and to continue to undermine climate litigation, regulation, and activism.

696 One Earth 4, 696โ€“719, May 21, 2021 ยช 2021 The Author(s). Published by Elsevier Inc. This is an open access article under the CC BY-NC-ND license (http://creativecommons.org/licenses/by-nc-nd/4.0/).

SUMMARY
This paper investigates how ExxonMobil uses rhetoric and framing to shape public discourse on climate change. We present an algorithmic corpus comparison and machine-learning topic model of 180 ExxonMobil climate change communications, including peer-reviewed publications, internal company documents, and advertorials in The New York Times. We also investigate advertorials using inductive frame analysis. We find that the company has publicly overemphasized some terms and topics while avoiding others. Most notably, they have used rhetoric of climate โ€˜โ€˜riskโ€™โ€™ and consumer energy โ€˜โ€˜demandโ€™โ€™ to construct a โ€˜โ€˜Fossil Fuel Saviorโ€™โ€™ (FFS) frame that downplays the reality and seriousness of climate change, normalizes fossil fuel lock-in, and individualizes responsibility. These patterns mimic the tobacco industryโ€™s documented strategy of shifting responsibility away from corporationsโ€”which knowingly sold a deadly product while denying its harmsโ€”and onto consumers. This historical parallel foreshadows the fossil fuel industryโ€™s use of demand-as-blame arguments to oppose litigation, regulation, and activism.


Godalmighty, #ExxonKnew Absolutely Everything: Especially exactly how much they were going to heat the earth — Bill McKibben #ActOnClimate #KeepItInTheGround

Bill McKibben, right, conferring with Land Institute founder Wes Jackson at the 2019 Prairie Festival, has strongly motivated many, including some CRES members. Photo/Allen Best

Click the link to read the post on the Substack website (Bill McKibben):

An important new study that came out a few minutes ago makes painfully clear precisely how much (and precisely how precisely) Exxon understood climate change, back in the days when it could have made a huge difference if theyโ€™d simply been honest. [ed. emphasis mine]

Itโ€™s not, of course, as if we didnโ€™t know a lot of this story already, and in some depth. In 2015, the Pulitzer Prize-winning website Inside Climate News published a landmark series of reports drawing on archives and whistleblowers to demonstrate that Exxon had set its scientists to work studying what we then called the greenhouse effect back in the 1970s, and that those scientists had reached the same conclusion as researchers working at NASA and elsewhere: the carbon dioxide coming from the fossil fuel industry was about to heat the earth in dramatic fashion. That was huge newsโ€”and it explains the picture above, when I staged a one-man sit-in at an Exxon station near me till the police took me away in handcuffs. I was desperate that this story not go awayโ€”and it didnโ€™t. It helped fuel the massive fossil fuel divestment campaign, as well as a score of lawsuits aimed at making Exxon pay up.

But this new studyโ€”from Harvardโ€™s Naomi Oreskes and Geoffrey Supran, and Stefan Rahmstorf of the Potsdam Institute for Climate Impact Researchโ€”actually looks at the specific results that Exxonโ€™s scientists predicted back in those years, and sees how well they panned out. Remarkably well: their temperature projections had an average โ€œskill scoreโ€ of roughly 75%, which is higher than many government researchers.

“‘These findings corroborate and and add quantitative precision to assertions by scholars, journalists, lawyers, politicians and others that ExxonMobil accurately foresaw the threat of human-caused global warming, both prior to and parallel to orchestrating lobbying and propaganda campaigns to delay climate action action,’ the authors write.”

As lead author Geoffery Supran (who has just taken up a new post at the University of Miami) put it,

“‘This is the nail-in-the-coffin of Exxon Mobilโ€™s claims that it has been fasely accused of climate malfeasance. Our analysis shows that ExxonMobilโ€™s own data contradicted its public statements, which included exaggerating uncertainties, critizing climate models, mythologizing global cooling, and feigning ignorance about whenโ€”or ifโ€”human-caused global would be measurable.'”

What Supran is referring to is the decades-long effort, organized by Exxon and others, to minimize and obfuscate the reality of climate change; its high point may have come when then CEO Lee Raymond went to the World Petroleum Congress in Beijing, just weeks before the Kyoto climate talks, and insisted that the world was cooling, and that even if it wasnโ€™t it would make no difference if people delayed action for a few decades. We now know in greater detail just how precisely Exxonโ€™s scientists had been saying the opposite.

It makes me think, once more, of what may be the greatest climate counterfactual of all. What if, on the night in 1988 that NASAโ€™s Jim Hansen had told Congress about global warming, Exxonโ€™s CEO had gone on the nightly news (which was still a thing then) and said: โ€œThatโ€™s what our scientists have been telling us too. Itโ€™s a real problem.โ€ That seems the minimum any religious or ethical system would require, and it would have had enormous impactโ€”no one was going to accuse Exxon of climate alarmism. We could have gotten down to work as a society.

They chose another course instead, and in certain ways it worked for them: in some of the years that followed, Exxon set the record for highest annual corporate profit. But thatโ€™s not what history is going to remember about them.

Exxonโ€™s private prediction of the future growth of carbon dioxide levels (left axis) and global temperature relative to 1982 (right axis). Elsewhere in its report, Exxon noted that the most widely accepted science at the time indicated that doubling carbon dioxide levels would cause a global warming of 3ยฐC. Illustration: 1982 Exxon internal briefing document

Changes in global temperature (1850-2022) — @Ed_Hawkins #ActOnClimate #KeepItInTheGround

Climate stripes through 2022. Credit: Ed Hawkins

“The data from 2022 is stark, however you look at it. Whether you view the raw figures, or look at the data as another red line added to the climate stripes, the message is clear. Excess heat is building up across the planet at a rate unprecedented in the history of humanity.”

“The latest stripe added is the second-darkest red, but is very close to being in the darkest red category. This is remarkable, given that La Nina has helped to hold temperatures down. When we see a return of a warming phase of El Nino, the darkest red stripes will return.”

“This should be a cause for alarm, but not alarmism. If you think how hot 2022 was, and then realise that those 12 months will likely be one of the coolest years of the rest of our lives, I think we will regret not having acted sooner on these warnings.”

Study: Exxon Mobil accurately predicted warming since 1970s — The Associated Press #ActOnClimate #KeepItInTheGround #ExxonKnew

Click the link to read the article on the Associated Press website (Seth Borenstein and Cathy Bussewitz). Here’s an excerpt:

 Exxon Mobilโ€™s scientists were remarkably accurate in their predictions about global warming, even as the company made public statements that contradicted its own scientistsโ€™ conclusions, a new study says. The study in the journal Science Thursday looked at research that Exxon funded that didnโ€™t just confirm what climate scientists were saying, but used more than a dozen different computer models that forecast the coming warming with precision equal to or better than government and academic scientists.  This was during the same time that the oil giant publicly doubted that warming was real and dismissed climate modelsโ€™ accuracy. Exxon said its understanding of climate change evolved over the years and that critics are misunderstanding its earlier research.

Scientists, governments, activists and news sites, including Inside Climate News and the Los Angeles Times, several years ago reported that โ€œExxon knewโ€ about the science of climate change since about 1977 all while publicly casting doubt. What the new study does is detail how accurate Exxon funded research was. From 63% to 83% of those projections fit strict standards for accuracy and generally predicted correctly that the globe would warm about .36 degrees (.2 degrees Celsius) a decade…

Study lead author Geoffrey Supran, who started the work at Harvard and now is a environmental science professor at the University of Miami, said this is different than what was previously found in documents about the oil company.

โ€œWeโ€™ve dug into not just to the language, the rhetoric in these documents, but also the data. And Iโ€™d say in that sense, our analysis really seals the deal on โ€˜Exxon knewโ€™,โ€ Supran said. It โ€œgives us airtight evidence that Exxon Mobil accurately predicted global warming years before, then turned around and attacked the science underlying it.โ€

The paper quoted then-Exxon CEO Lee Raymond in 1999 as saying future climate โ€œprojections are based on completely unproven climate models, or more often, sheer speculation,โ€ while his successor in 2013 called models โ€œnot competent.โ€

[…]

Exxon, one of the worldโ€™s largest oil and gas companies, has been the target of numerous lawsuits that claim the company knew about the damage its oil and gas would cause to the climate, but misled the public by sowing doubt about climate change. In the latest such lawsuit, New Jersey accused five oil and gas companies including Exxon of deceiving the public for decades while knowing about the harmful toll fossil fuels take on the climate. Similar lawsuits from New York to California have claimed that Exxon and other oil and gas companies launched public relations campaigns to stir doubts about climate change. In one, then-Massachusetts Attorney General Maura Healey said Exxonโ€™s public relations efforts were โ€œ reminiscent of the tobacco industryโ€™s long denial campaign about the dangerous effects of cigarettes.โ€

Record #drought gripped much of the U.S. in 2022: Nation struck with 18 billion-dollar disasters — NOAA #ActOnClimate

Bath tub ring seen at Lake Mead Marina on Wednesday , Aug. 17, 2022. (Jeff Scheid/Nevada Independent)

Click the link to read the article on the NOAA website (John Bateman):

The large coverage and long duration of drought conditions across the U.S. set several records in 2022.

The year was also marked by numerous severe weather events, devastating hurricanes and deadly flooding across parts of the country.  

Here is a summary of the climate and extreme weather events across the U.S. in 2022:

Climate by the numbers

2022 

The average annual temperature across the contiguous U.S. was 53.4 degrees F โ€” 1.4 degrees above the 20th-century average โ€” ranking in the warmest third of the 128-year record. 

Florida and Rhode Island both saw their fifth-warmest calendar year on record while Massachusetts ranked sixth warmest. Four additional states experienced a top-10 warmest year on record โ€” California, Connecticut, Maine and New Hampshire. Alaska saw its 16th-warmest year in the 98-year record for the state.

Annual precipitation across the contiguous U.S. totaled 28.35 inches (1.59 inches below average), which placed 2022 in the driest third of the climate record. Nebraska saw its fourth-driest year on record while California had its ninth driest. Meanwhile, above-average precipitation caused Alaska to have its fourth-wettest year on record.

Drought coverage across the contiguous U.S. remained significant for the second year in a row, with a minimum extent of 44% occurring on September 6 and a maximum coverage of 63% on October 25 โ€” the largest contiguous U.S. footprint since the drought of 2012. 

In the western U.S., drought conditions reached a peak coverage of 91.3% of the region on May 3. Drought coverage across the West shrank as the summer monsoon reduced some of the coverage in the Southwest. The multi-year western U.S. drought resulted in water stress/shortages across many locations in 2022 as some major reservoirs dropped to their lowest levels on record.

Billion-dollar disasters in 2022

Map of the U.S. plotted with 18 separate billion dollar disasters that occurred in 2022. For more, go to https://www.ncdc.noaa.gov/billions/. (NOAA/NCEI)

Last year, the U.S. experienced 18 separate billion-dollar weather and climate disasters, leading to the deaths of at least 474 people. The following 18 events, each exceeding $1 billion, put 2022 in third place (tied with 2011 and 2017) for the highest number of disasters recorded in a calendar year, behind 2021 โ€” with 20 events โ€” and 2020, with a record 22 separate billion-dollar events:

  • One winter storm/cold wave event (across the central and eastern U.S.).
  • One wildfire event (wildfires across the western U.S., including Alaska).
  • One drought and heat wave event (across the western and central U.S.).
  • One flooding event (in Missouri and Kentucky).
  • Two tornado outbreaks (across the southern and southeastern U.S.).
  • Three tropical cyclones (Fiona, Ian and Nicole).
  • Nine severe weather/hail events (across many parts of the country, including a derecho in the central U.S). 

Damages from these disasters totaled approximately $165.0 billion for all 18 events. This surpasses 2021 ($155.3 billion, inflation adjusted) in total costs, which makes 2022 the third most costly year on record, only behind 2017 and 2005; all inflation adjusted to 2022 dollars).  

Hurricane Ian was the most costly event of 2022 at $112.9 billion, and ranks as the third most costly hurricane on record (since 1980) for the U.S., behind Hurricane Katrina (2005) and Hurricane Harvey (2017).

Over the last seven years (2016-2022), 122 separate billion-dollar disasters have killed at least 5,000 people, with a total cost of more than $1 trillion in damages. Five of the last six years (2017-2022, with 2019 being the exception) have each had a price tag of at least $100 billion.

Other notable climate and weather events in 2022

A map of the U.S. plotted with significant climate events that occurred throughout 2022. Credit: NOAA

An average but destructive hurricane season: During 2022, 14 named storms formed in the North Atlantic Basin (four tropical storms, eight hurricanes and two major hurricanes), which is near the historical average. Several notable storms brought destruction and flooding to portions of the U.S. 

Hurricane Fiona brought massive flooding to Puerto Rico, with some areas receiving 12-18 inches of rain. Hurricane Ian, with 150 mph sustained winds, made landfall in southwest Florida resulting in major flooding, damage and loss of life. Later in the year, Hurricane Nicole made landfall along Floridaโ€™s eastern shore, flooding the coast and knocking out power for hundreds of thousands of people. Nicole was the first hurricane to hit the U.S. during November in nearly 40 years.

An above-average tornado year: The preliminary U.S. tornado count for 2022 was approximately 9% above the 1991-2020 average across the contiguous U.S. with 1,331 tornadoes reported. March 2022 had triple the average number of tornadoes reported (293) and the most tornadoes reported for any March in the 1950-2022 record.

Wildfires scorched the West, Alaska: In addition to the active wildfire year across the western U.S., Alaska saw one million acres burned by June 18 โ€” the earliest such occurrence in a calendar year than any other time in the last 32 years. By July 1, 1.85 million acres had been consumed โ€” the second-highest June total on record and the seventh-highest acreage burned for any calendar month on record for Alaska.

More: Find NOAAโ€™s climate reports and download the images from the NCEI climate monitoring website.