Click the link to read the article on The Land Desk website (Jonathan P. Thompson):
September 3, 2024
🌵 Public Lands 🌲
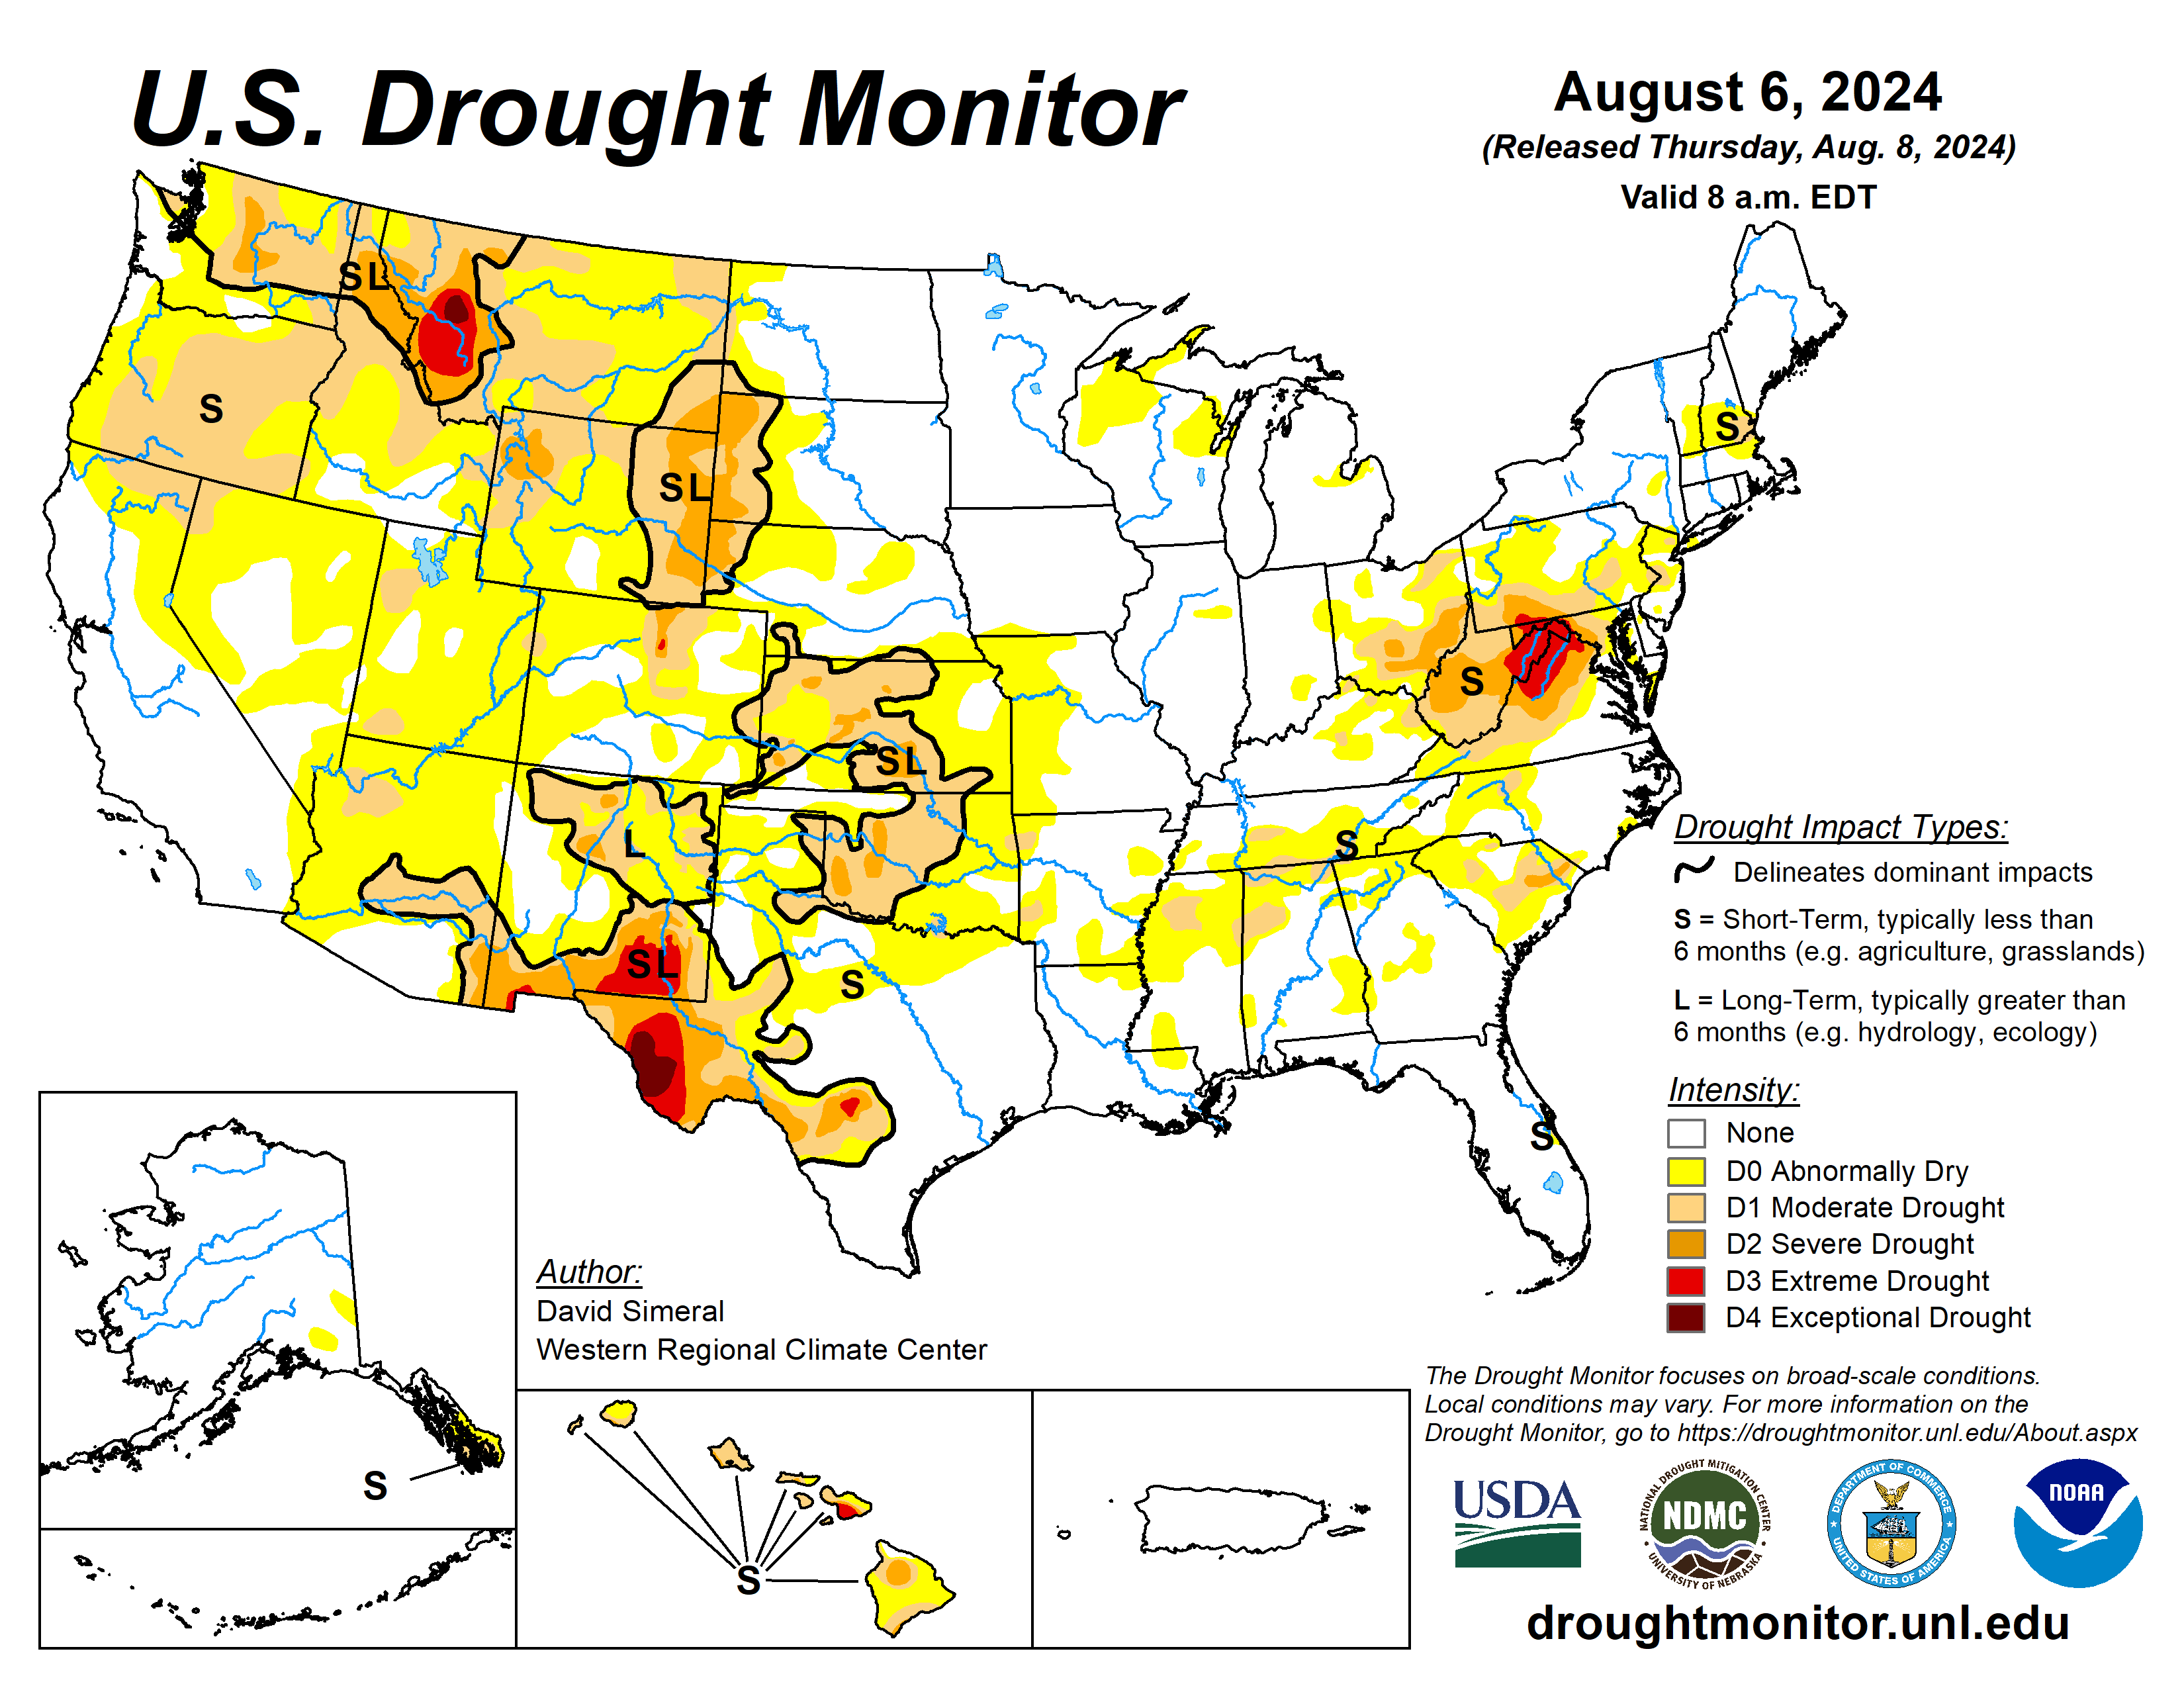
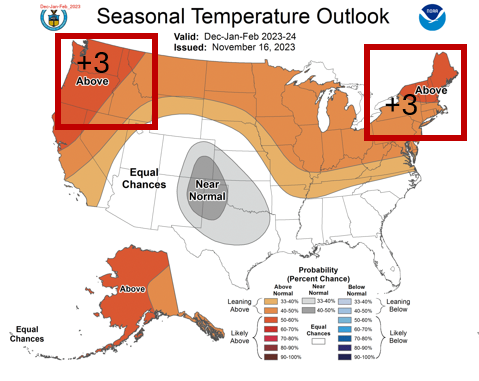
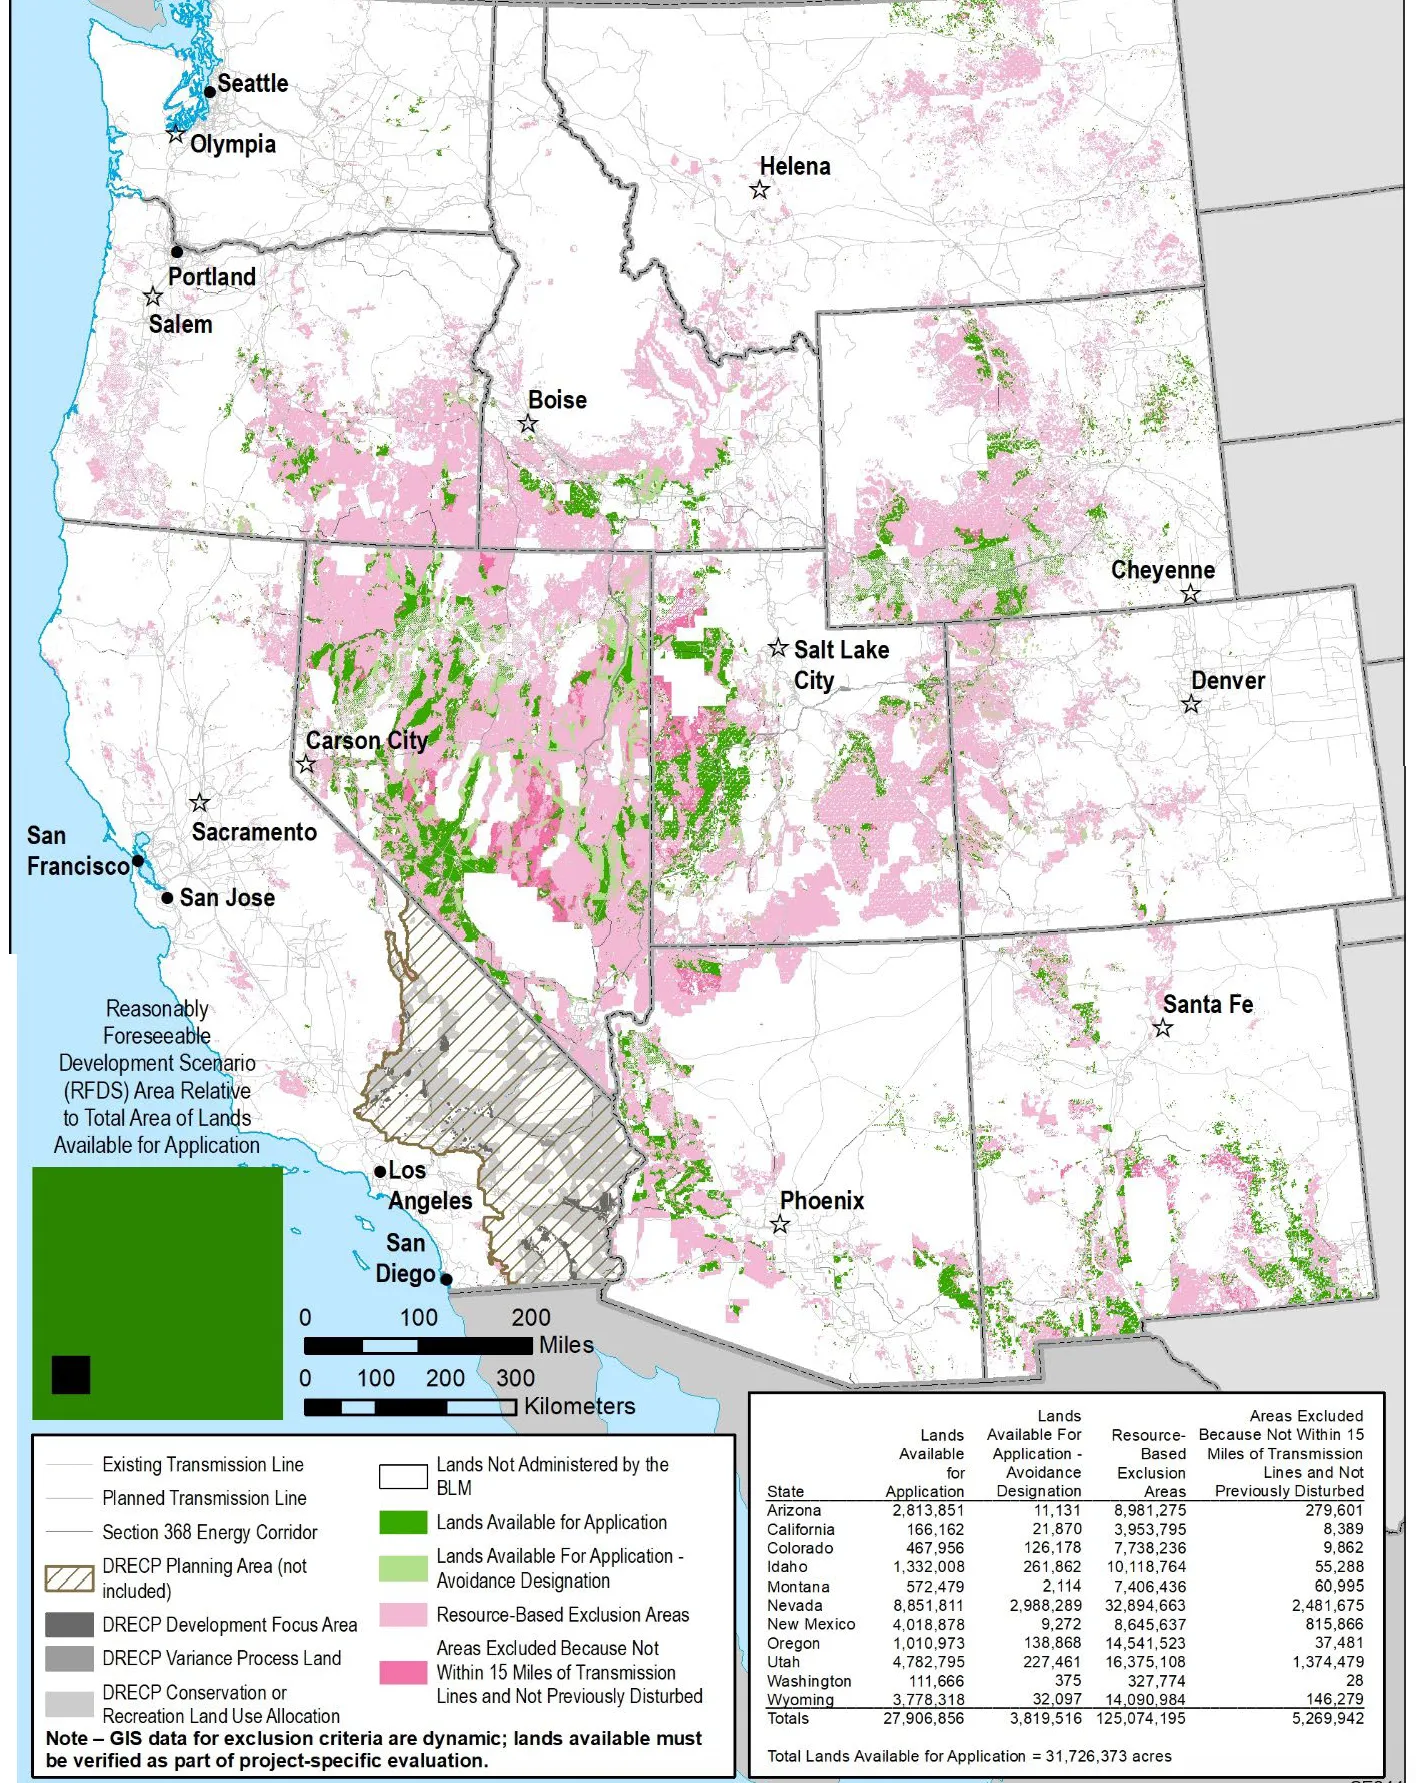
THE NEWS: Last week the Bureau of Land Management released the final environmental review of its Western Solar Plan, which guides utility-scale solar development on public lands. The proposed “roadmap” is similar to the draft proposals and puts millions of acres off-limits to any future solar development, while making 31 million acres available for potential development — subject to BLM approval on a project-by-project basis. The proposal has drawn mixed reactions from industry, conservation groups, and politicians.
THE CONTEXT: When the feds approve a big oil and gas drilling project or propose ending coal leasing, the response from various quarters is usually predictable. Not so with big solar and wind. So when a big plan like this comes out, I tend to check out the responses to it, often even before delving into the plan, itself.
Here’s a sampling from across the spectrum:
- The Solar Energy Industries Association, in a prepared statement, tentatively celebrated the proposal, writing: “… we’re pleased to see that BLM listened to much of the solar industry’s feedback and added 11 million acres to its original proposal. While this is a step in the right direction, fossil fuels have access to over 80 million acres of public land …” Now, the group added, it would work to push the feds to streamline the permitting process for individual projects.
- The Wilderness Society, a national environmental group, also likes the plan, saying it focuses “solar projects toward lands near transmission with fewer resource conflicts and away from protected landscapes, habitats, and other places where development is not appropriate.” That, it said, will help in the fight to mitigate climate change.
- The Center for Biological Diversity, which had pushed the agency to limit large-scale solar projects to previously disturbed lands near existing transmission lines, was decidedly less enthused. In a statement, the group wrote: “There’s room on public lands for thoughtfully sited solar energy projects. We don’t need to destroy tens of millions of acres of wildlife habitat to achieve our clean energy goals. This plan allows for death by a thousand cuts, where inappropriately sited industrial projects can proliferate across sensitive public lands throughout the West.”
- And desert-preservationist Chris Clarke’s subhead on his Letters to the Desert take says is it all: “I ordered a solar eclipse, not a solar apocalypse.” He points out that Nevada will take the brunt of the plan, with “the equivalent of 130 Las Vegases being offered up” to solar developers. All of that land won’t be developed — it doesn’t need to be to generate all the power the nation needs. Which makes the plan, as Clarke puts it, “a recipe for solar sprawl, with 3,000-acre plots and 7,000-acre plots spread across the landscape.”
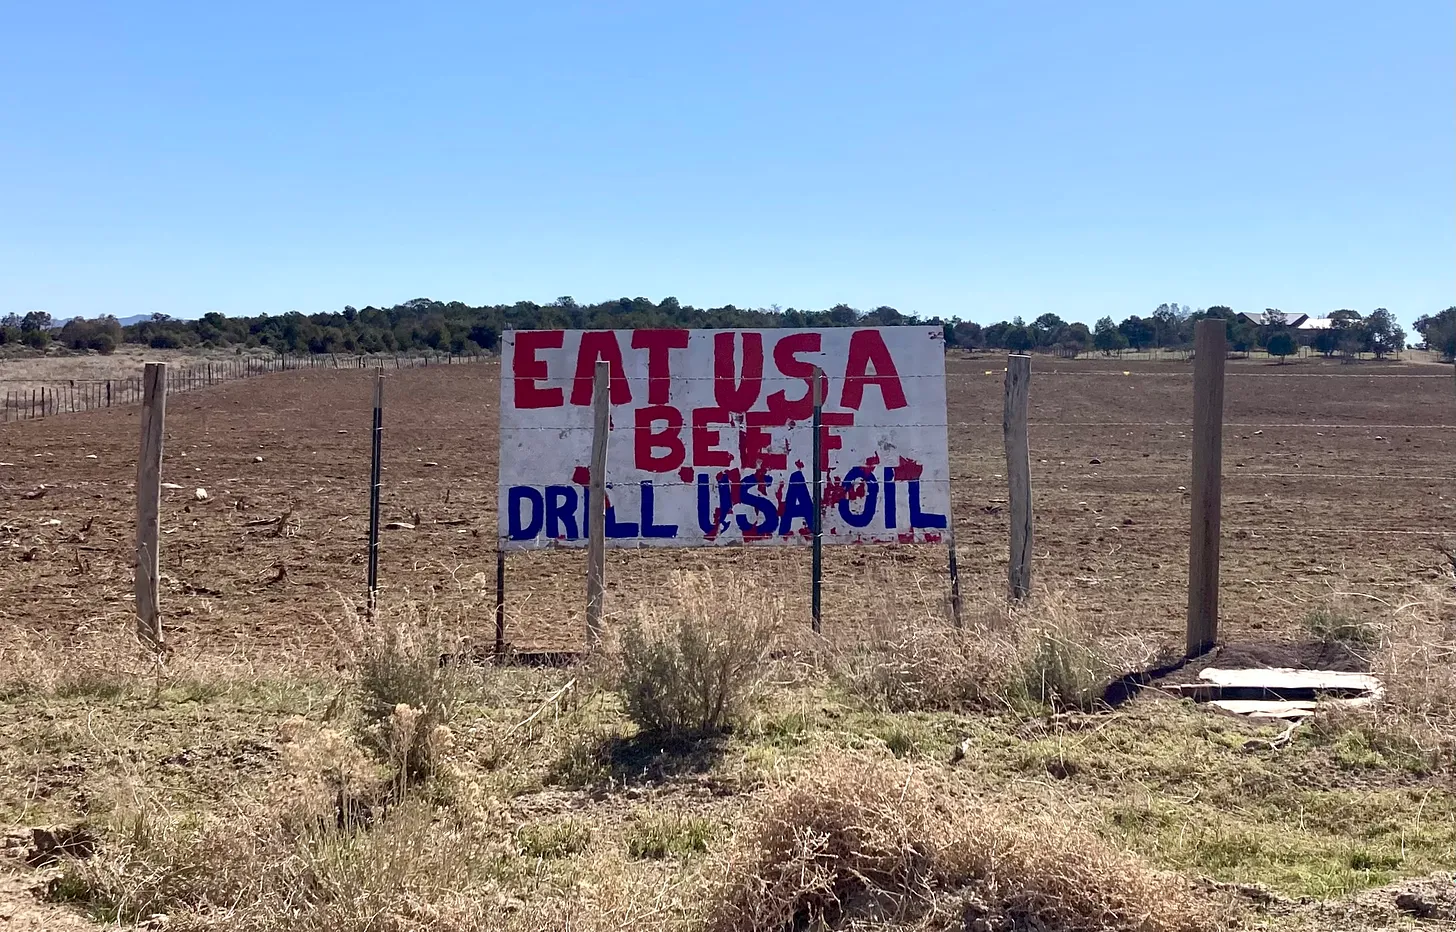
- And then there’s U.S. Sen. Cynthia Lummis, a Wyoming Republican, who came out with a scathing statement in which, predictably, she rails about Democrats destroying the so-called western way of life: “The Biden-Harris administration is hellbent on destroying the western way of life by closing off access to public lands for oil and gas drilling, grazing, recreation and industries our states rely on to stay afloat, all in the name of climate extremism.”
Okay, I probably shouldn’t have included Lummis’ statement, simply because it is rather misinformed and might give readers the wrong idea. But it’s important to include because it brings up a common misperception about this plan. It is not opening up an additional 31 million acres to development (nor is it closing any land to other uses). A lot of BLM land was already open to solar leasing and right of way applications under the 2012 plan; this proposal simply extends the plan to more states and tweaks the focus for the existing states. Under the “no action” alternative, i.e. the status quo, 59.5 million acres would be open to solar applications, nearly twice as much as under the proposed alternative.

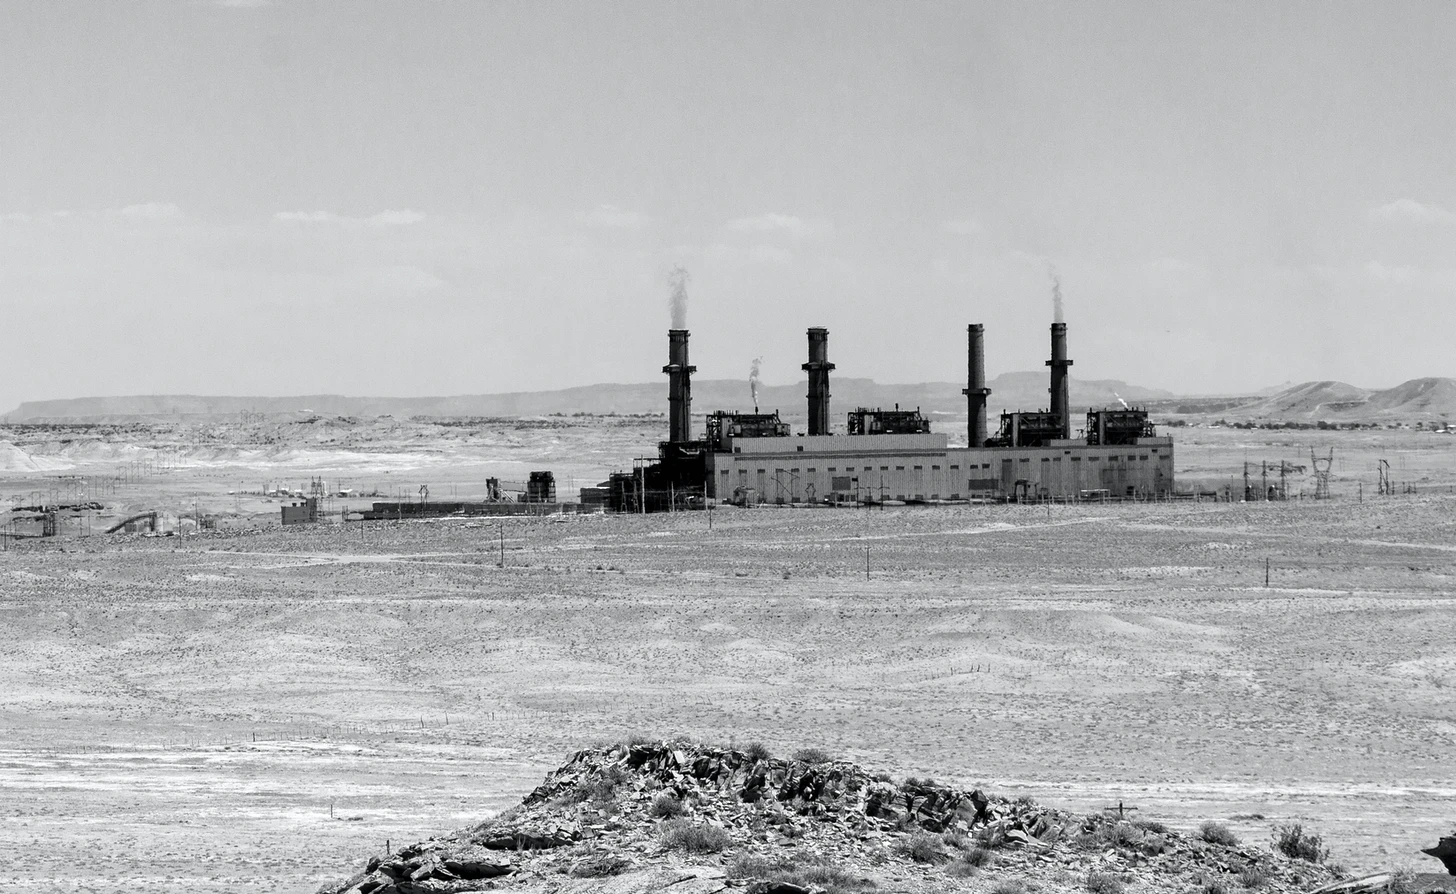
Lummis can rest assured that few if any oil rigs will be blocked under this plan. The BLM was careful to exclude most oil and gas leasing areas from solar development and where it doesn’t, the agency will prioritize existing oil and gas leases over new solar development (though an existing solar right-of-way would block new oil and gas leases). Most of the San Juan Basin, big swaths of southwestern Wyoming, and virtually all of southeastern Utah, for example, are off-limits to solar, less because of cultural or environmental impacts than because those are major oil and gas producing areas.
It’s worth noting that about 80 million acres of federal land are available for oil and gas development, of which 23 million acres are currently under active lease. About 12 million of those acres are producing oil and gas. (In 2008, 47 million acres were under lease to oil and gas companies, with 14 million acres producing.)
By contrast, the solar industry under this plan will be allowed to apply for rights-of-way on some 31 million acres. Under the BLM’s reasonable foreseeable development scenario, about 700,000 of those acres would actually see solar panels before 2045. That’s an enormous amount of land, and it’s probably all that’s needed to meet the region’s demand for solar power — but it’s only a small fraction of the available acreage.

The question then is this: If you only need less than 1 million acres, why open up all 31 million? It seems the answer is simply because that’s what the solar industry wanted, probably because it gives them more flexibility. The problem with that, as Clarke pointed out, is that you’re likely to get a sprawling hodgepodge of massive solar installations scattered across the desert rather than all concentrated in a few places.
The mission of the solar plan was to reduce conflicts by guiding development to the most appropriate areas. I’m sorry to say it hasn’t succeeded. By offering up so much land, the agency almost guarantees more conflict as conservation groups protest and sue over proposals in less-than-appropriate places.
The BLM would have been wiser to go with its Alternative 5, which would have limited development to previously disturbed areas within 10 miles of existing transmission lines (while still excluding development in critical habitat or other protected lands). Even that would have made 8.8 million acres available, giving developers plenty of flexibility for siting, while also giving them more clarity and reducing the chances their proposals will be tied up in litigation. Perhaps the agency could have offered this more restrictive approach to environmental groups in exchange for getting them on board to streamline permitting for these areas, thus further reducing conflict and uncertainty for industry.
Under the plan, proposed developments would continue to be subject to environmental reviews.
There’s still time to alter the plan. The BLM’s protest period is open until Sept. 29. You can weigh in here.
🏠 Random Real Estate Room 🤑
An odd one popped up on my solar energy news feed the other day, with the headline: “Doomsday-ready property north of Lake Tahoe to hit the market for $8 million.” Not cheap, I thought, but a bargain if it will help me get through doomsday. It was featured on the Mansion Global website, the very existence of which makes me vomit a little each time I see it.
It’s a massive home on 10 acres of forest, with a caretaker’s cottage that is nearly twice the size of my house. As for the Doomsday part, it has an artesian well, 72 solar panels, and four 1,000 gallon propane tanks (be careful with the matches y’all; that would be a doomsday fireball, indeed) — though, apparently no bunker or arsenal (though maybe they wouldn’t let on about it until you actually purchase the place).
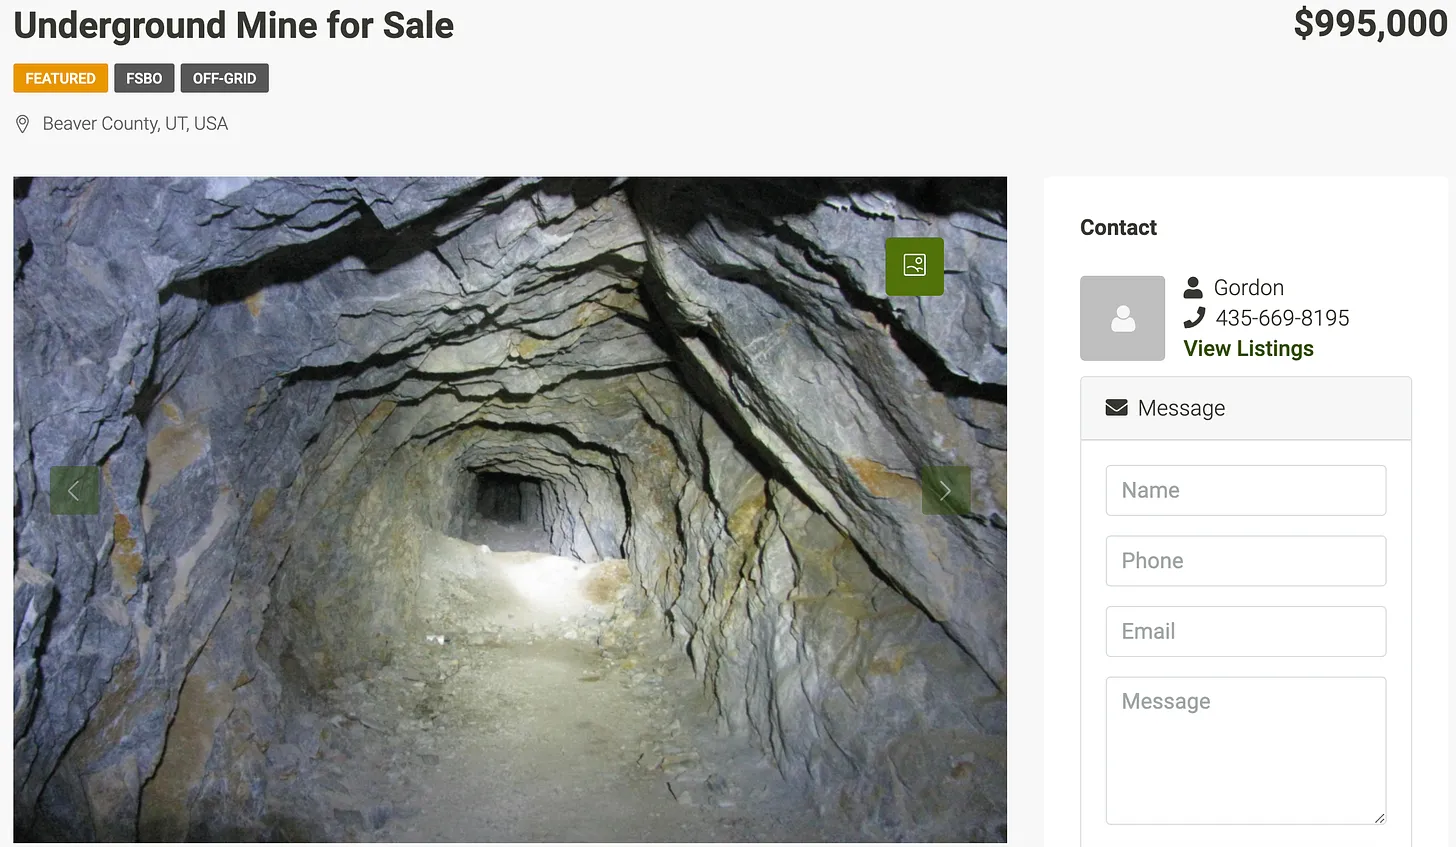
It’s funny because right around the same time another story, this one in the New Yorker, popped up on my feed, entitled: “Real estate shopping for the apocalypse.” It’s a good read, both amusing and a little bit disturbing. But it led me to seek out some doomsday real estate of my own, perhaps in the less-than-$8-million price range. And where does a prepper go? SurvivalRealty.com, of course! There’s actually some cool properties on there, and even a few that aren’t ridiculously expensive. I was surprised, however, to find only one property in Utah: An old scheelite mine in Beaver County where “a couple thousand souls could hold out in a disaster scenario.” Price? $995,000 — or just $500 each for the couple thousand doomsday survivors!