Colorado Territorial Map early 20th Century via Greg Hobbs. Note the large rectanglular area from Four Corners north and east. Those were the lands originally promised to the Ute tribes.
For a second year, the Ute Mountain Ute Tribe and Southern Ute Indian Tribe addressed the General Assembly in their annual State of the Tribes. Signed into law in 2022, Tribal Governments Annual Address to Joint Session requires that any future speaker of the state House of Representatives and the president of the state Senate invite representatives from Colorado’s recognized tribes to give an address to a joint session of the General Assembly on an annual basis.
“The Native Ute people were here long before Colorado was a state, and they deserve to have their voices heard and their needs addressed,” said Rep. Barbara McLachlan. “This annual address helps us forge a path forward together to ensure we’re fostering a strong inter-governmental relationship.”
[…]
Water rights
The Ute continue to experience shortfalls on water despite settlements, according to [Manuel] Heart. Heart stated that there must be a process through legislation to ensure water rights to tribes. [Melvin J.] Baker added that the lack of funding remains a critical issue for the Ute economy that depends on the water projects industrially and agriculturally.
“The Colorado river tribes have been left out of key conversations for too long,” Baker said. “We want a seat at the table, to be heard and part of the decisions, and not be overlooked. We want the commitment to protect water rights and no caps placed on the future developments of water resources.”
In response to this request Friday, a bipartisan resolution was passed by Speaker of the House Julie McCluskie (D); Rep. Barbara McLachlan (D); and Sens. Dylan Roberts (D) and Cleave Simpson (R) to urge Congress to fully fund the Water Infrastructure Improvements for the Nation (WIIN) Act, which would provide $35 million in funding for critical infrastructure projects across the country, including the Pine River Indian Irrigation Project, which carries freshwater to Southern Ute Indian Tribe land.
The Minus Water Treatment System is one of the newest technologies inside Water TAP that is part of an effort to experiment with a more sustainable water treatment technology. Photo credit: Colorado State University
Late last year, a seemingly nondescript black shipping container made its way down National Western Drive and through the garage doors of the Colorado State University Spur campus’s Hydro building, capping off a 1,400-mile journey from Atlanta and the beginning of an effort to experiment with a more sustainable water treatment technology.
“Getting it into this building wasn’t easy,” said Todd Shollenberger, the manager of Spur’s Water Technology Acceleration Platform (TAP) Lab, who helped guide a forklift carrying the unwieldy container over sloped concrete into the facility. “But now that it’s here, it will unlock some of the endless possibilities for this space.”
What’s known as the Minus Water Treatment System is one of the newest technologies inside Water TAP. This shipping container houses a membrane-based ultrafiltration unit that can remove contaminants from stormwater without using more common treatment methods like chemicals or the energy required with ultraviolet light.
Sybil Sharvelle, the technical director of Water TAP and a professor in CSU’s Department of Civil and Environmental Engineering, said the Spur campus’s location in the heart of Denver offers a unique opportunity to test this technology.
“We obtain our stormwater from a roughly 20-acre area that’s heavily industrial and commercial, introducing a litany of contaminants,” she said. “This means that we really get to challenge the system, especially because the quality of stormwater can be highly variable and hard to predict.”
Meet Sybil Sharvelle, Professor of Civil and Environmental Engineering at Colorado State University and head of the Water Technology Acceleration Platform Lab (Water TAP) here in the Hydro building. What excites her about the work that will be done here? Take a listen
That’s where collaboration comes in. The Minus system came to CSU from Georgia Tech, and scientists from the two institutions will work together to develop a machine learning model to make its process more efficient.
“This project represents one of the first efforts of using a membrane filtration system for stormwater reuse, which is an essential strategy of enhancing the resiliency of our water supply in the context of climate change,” said Tiezheng Tong, an associate professor in the Department of Civil and Chemical Engineering who is involved in the project. “It also innovatively applies machine learning to process control, providing a novel avenue to increase the efficiency and reduce the cost of the entire system.”
The goal is that this treated water will be the necessary quality to be used to irrigate edible crops for livestock or human consumption.
“I think this is a really unique problem to try to solve, and since stormwater is often just wasted, it can have applications on a much larger scale,” Sharvelle said. “This really enables the lab to go to the next level.”
One lab, six sources of water
In addition to stormwater, the scientists at the Water TAP Lab can draw on five other sources:
Greywater.
Roof runoff.
Wastewater.
Water from the nearby South Platte River.
Water trucked in from a variety of different sources, encompassing everything
from hydrofracking waste to agricultural runoff.
This water is stored in tanks scattered throughout the lab, and can be pumped through a variety of different treatment systems, including 10 constructed wetlands that incorporate plants for potential filtration.
Sharvelle said the ultimate goal is to figure out more efficient ways to use local water sources and potentially reduce the demand on finite resources like the Colorado River.
“The whole purpose of the lab is to enable the testing of technology to move development and policy forward,” she said.
The Minus system is just one example of the technologies that will make their way through Water TAP in the coming years, and in addition to offering a real-world example of new filtration solutions to businesses, down the line, Sharvelle hopes it can also make the Spur campus itself more efficient in its water usage.
“The hope is that the water treated by the Minus system can be used to irrigate the plants on the green roof at Terra,” Sharvelle said. “The CSU Spur campus offers us endless opportunities to collaborate and test what we do in the real world.”
The shiny new cold-weather air source heat pump installed during summer 2023 at Coyote Gulch Manor.
Click the link to read the article on the Grist website (Alison F. Takemura):
Installing a heat pump now is better for the climate, even if it’s run on U.S. electricity generated mostly by fossil fuels. Here’s why.
March 17, 2024
This story was originally published by Canary Media.
You might consider heat pumps to be a tantalizing climate solution (they are) and one you could adopt yourself (plenty have). But perhaps you’ve held off on getting one, wondering how much of a difference they really make if a dirty grid is supplying the electricity you’re using to power them — that is, a grid whose electricity is generated at least in part by fossil gas, coal, or oil.
That’s certainly the case for most U.S. households: While the grid mix is improving, it’s still far from clean. In 2023, renewable energy sources provided just 21 percent of U.S. electricity generation, with carbon-free nuclear energy coming in at 19 percent. The other 60 percent of power came from burning fossil fuels.
So do electric heat pumps really lower emissions if they run on dirty grid power?
The answer is an emphatic yes. Even on a carbon-heavy diet, heat pumps eliminate tons of emissions annually compared to other heating systems.
The latest study to hammer this point home was published in Joule last month by the National Renewable Energy Laboratory. The team modeled the entire U.S. housing stock and found that, over the appliance’s expected lifetime of 16 years, switching to a heat-pump heater/AC slashes emissions in every one of the contiguous 48 states.
In fact, heat pumps reduce carbon pollution even if the process of cleaning up the U.S. grid moves slower than experts expect. The NREL team used six different future scenarios for the grid, from aggressive decarbonization (95 percent carbon-free electricity by 2035) to sluggish (only 50 percent carbon-free electricity by 2035, in the event that renewables wind up costing more than their current trajectories forecast). They found that depending on the scenario and level of efficiency, heat pumps lower household annual energy emissions on average by 36 percent to 64 percent — or 2.5 to 4.4 metric tons of CO2 equivalent per year per housing unit.
That’s a staggering amount of emissions. For context, preventing 2.5 metric tons of CO2 emissions is equivalent to not burning 2,800 pounds of coal. Or not driving for half a year. Or switching to a vegan diet for 14 months. And at the high end of the study’s range, 4.4 metric tons of CO2 is almost equivalent to the emissions from a roundtrip flight from New York City to Tokyo (4.6 metric tons).
Eric Wilson, senior research engineer at NREL and lead author of the study, told me, “I often hear people saying, ‘Oh, you should wait to put in a heat pump because the grid is still dirty.’” But that’s faulty logic. “It’s better to switch now rather than later — and not lock in another 20 years of a gas furnace or boiler.”
Emissions savings tend to be higher in states with colder winters and heaters that run on fuel oil, such as Maine, according to the study. (Maine seems to be one step ahead of the researchers: Heat pumps have proven so popular there that the state already blew past its heat-pump adoption goal two years ahead of schedule.)
A dirty grid, then, doesn’t cancel out a heat pump’s climate benefits. But heat pumps can generate emissions in the same way standard ACs do: by leaking refrigerant, the chemicals that enable these appliances to move around heat. Though it’s being phased down, the HVAC standard refrigerant R-410A is 2,088 times more potent a greenhouse gas than CO2, so even small leaks have an outsize impact.
Added emissions from heat-pump refrigerant leaks barely make a dent, however, given the emissions heat pumps avoid, the NREL team found. Typical leakage rates of R-410A increase emissions on average by only 0.07 metric tons of CO2 equivalent per year, shaving the overall savings of 2.5 metric tons by just 3 percent, Wilson said.
A 2023 analysis from climate think tank RMI further backs up heat pumps’ climate bona fides. Across the 48 continental states, RMI found that replacing a gas furnace with an efficient heat pump saves emissions not only cumulatively across the appliance’s lifetime, but also in the very first year it’s installed. RMI estimated that emissions prevented in that first year were 13 percent to 72 percent relative to gas-furnace emissions, depending on the state. (Canary Media is an independent affiliate of RMI.)
Both the RMI and NREL studies focused on air-source heat pumps, which, in cold weather, pull heat from the outdoor air and can be three to four times as efficient as gas furnaces. But ground-source heat pumps can be more than five times as efficient compared to gas furnaces — and thus unlock even greater greenhouse-gas reductions, according to RMI.
How much could switching to a heat pump lower your home’s carbon emissions? For a high-level estimate, NREL put out an interactive dashboard. In the “states” tab, you can filter down to your state, building type and heating fuel. For instance, based on a scenario of moderate grid decarbonization in my state of Colorado, a single-family home that swaps out a gas furnace for a heat pump could slash emissions by a whopping 6 metric tons of CO2.
One final takeaway Wilson shared: If every American home with gas, oil, or inefficient electric-resistance heating were to swap it right now for heat-pump heating, the emissions of the entire U.S. economy would shrink by 5 percent to 9 percent. That’s how powerful a decarbonizing tool heat pumps are.
Governor Jared Polis signs non-functional turf law. Photo credit: Allen Best
Click the link to read the article on the Big Pivots website (Allen Best):
March 18, 2024
Bill signed into law on Friday makes thirsty imported grasses a no-no in new road medians and other public places that rarely see human feet. Native grasses OK.
The remarks in the office of Colorado Gov. Jared Polis on Friday afternoon were brief, befitting the bill that was soon to be signed into law, the state’s most aggressive effort yet to curb water allocated to urban landscaping.
“We want folks to be part of the solution around water and to reduce the water needs of their non-functional turf, ranging from Colorado-scaping and xeriscaping to lower-water solutions with different types of grasses that may require less water,” said Polis of SB24-005.
Taking the lectern, Sen. Dylan Roberts, a prime sponsor and a Democrat who represents much of northwestern Colorado, noted an irony. It had snowed hard the previous day along the northern Front Range, where about 75% of Coloradans live, and the snow was extremely wet, even for March.
“It’s funny, with all the snow right now, you might not think that we have to deal with a lot of water scarcity, but we do,” said Roberts, a Frisco resident.
“We know that in Colorado we face a historic drought and we need to put in place every single common-sense tool to save water that we can. And this is one of those.”
Colorado in 2022 began incentivizing removal of what is commonly called non-functional turf. The phrase means imported grass species with high water requirements that typically get almost no use. A legislative allocation of $2 million resulted in grants to about three-dozen communities across Colorado but especially in Front Range cities where 85% of the state’s residents live.
In September 2023, the Colorado Water Conservation Board awarded a $1.5 million grant to Boulder-based Resource Central. The nonprofit was formed in 1976 to encourage conservation. In 2023, it completed 604 lawn-replacement projects along the Front Range. Its marquee program, Garden In A Box, provides low-water plants and has partnerships with several dozen municipalities along the Front Range. The state grant will allow Resource Central to expand its programming to the Western Slope.
In October 2023 a year-round legislative water committee that is chaired by Roberts heard a proposal from Denver Water, Western Resource Advocates and others. That proposal was the basis for the new law.
Instead of incentives to change, the new law draws lines of restraint. Beginning in 2026, local governments can no longer allow the installation, planting or placement of non-functional turf, artificial turf, or invasive plant species. This applies to commercial, institutional, and industrial properties, but also common-interest community property. Read that as HOAs.
Also verboten will be planting of non-functional turf in street rights-of-way, parking lots, median or transportation corridors.
Non-functional turf planted with thirsty imported species will be banned from new road medians and other public and commercial places in Colordo that see few human feet beginning in 2026, a year earlier in projects of state government. Photo/Allen Best
The law applies to new or redeveloped state facilities beginning in 2025.
Imported species such as Kentucky bluegrass can use twice as much water as native grass. Native species such as buffalo and blue gamma or species hybridized for arid conditions will be allowed.
Several Colorado jurisdictions have gone further. Aurora and Castle Rock in 2022 both adopted limits to residential water use for landscaping. The state law does not touch water use at individual homes. The two municipalities both expect substantial population growth but have limited water portfolios for meeting new demand.
Other municipalities and water providers from Broomfield to Grand Junction have also adopted laws crowding out water-thirsty vegetation. Their motives vary but all are premised on Colorado’s tightening water supplies. Cities use only 7% of the state’s water, and roughly half of that goes to landscaping.
Yet developing new sources of water requires going farther afield, usually converting water from agriculture, and can become very expensive. Consider plans by Parker Water and Sanitation District and Castle Rock. They are planning a pipeline to the Sterling area in coming years with a new if smallish reservoir near Akron. In this case, the project has support from an irrigation district in the Sterling area, but all this new infrastructure comes at a great expense.
The bill faced no major opposition in the Legislature, although most House Republicans — nearly all from rural areas — voted against it.
During her time at the microphone, Rep. Karen McCormick, a Democrat from Longmont, emphasized the need to define what constitutes non-functional turf.
“Coming up with those terms of functional versus non-functional turf was really important so that the people of Colorado understand that the choices that we have in these spaces (can result in) beautiful, Western drought-tolerant grasses and bushes and flowers.” she said.
State Rep. Barbara McLachlan, a Democrat from Durango, emphasized cost savings as well as water savings. “If you’re not having a picnic on that little piece of turf or having a soccer game, you probably don’t need to be spending the water and money it takes to keep that alive.”
Sen. Cleave Simpson, a Republican from Alamosa who represents much of southwestern Colorado and the fourth prime sponsor, was not present for the bill-signing.
Rep. Karen McCormick of Longmont said that urban landscapes of great beauty can be created that need less water. Photo/Allen Best
Those present for the bill signing included Denver Water’s Alan Salazar, the chief executive, and Greg Fisher, the manager of demand planning.
A Denver Water staff member decades ago had invented the word “xeriscaping” but the agency had never put much muscle into curbing water use. After all, it had a flush water portfolio. The thinking as explained in Patty Limerick’s book about Denver Water, “A Ditch in Time,” was that if drought got bad enough, the agency could always squeeze residential use for water, as it did in the severe drought summer of 2002.
With new leadership and a worsening story in the Colorado River Basin, Denver had altered its thinking. The city – which provides water for about 1.6 million people, including many of the city’s suburbs – gets roughly half of its water from transmountain diversions. That statistic holds true for the Front Range altogether. Denver’s water rights are relatively senior, but they’re junior to the Colorado River Compact of 1922.
That compact assumed far more water in the river than occurred in most of the 20th century. Flows during the 21st century have diminished, at least in part due to intensifying heat. That heating – and drying – will very likely worsen in coming decades. While Colorado accurately claims that it has not used its full allocations under river compacts, there’s the underlying and shifting hydrology that argues against any certainty.
The city this year will partner with Resource Central, a first, to encourage transformation of front yards with high water demands into less-needy landscapes.
Lindsay Rogers, a water policy advisor for Western Resource Advocates, said the key work during the next couple of years will be to work with local jurisdictions to implement the new law.
“Not only that, they’ll need to figure out how they’re going to enforce their new landscaping standards. And if they do that well, this bill will be hugely impactful.”
She said this bill should be understood as being part of a “growing understanding that everyone needs to do their part to conserve. There are lots and lots of opportunities across the land-use development spectrum.”
At least some of those ideas can be found in a report by a state task force issued in late January. Polis had appointed the 21-member group a year before and gave it the job of examining what steps Colorado could take to reduce water devoted to urban landscaping.
After seven meetings, the task force issued a report in late January that concluded that “the time to rethink our landscapes is now.” It provided 10 recommendations.
Topping the recommendations was a statement in accord with the new law. The task force also called for continued support of turf replacement in existing development, promotion of irrigation efficiency and encouragement of pricing mechanism that steer decisions that promote water conservation.
Considering that it took well more than a century to install the existing urban landscapes, this shift will not be accomplished in a few short years. The climate could shift to produce more water for Colorado, but the warming atmosphere would almost certainly steal those gains.
In short, the water scarcity driving this new law is not going away.
See also this five-part series in 2023 published in collaboration with Aspen Journalism:
Why do trees need sunlight? – Tillman, age 9, Asheville, North Carolina
Trees need sunlight for the same reason you need food. The energy from the Sun’s rays is a crucial ingredient in how plants make their own food that helps them power all their cells. Since trees don’t harvest or hunt food, they have to produce their own. The way they make their food is a unique and important chemical process called photosynthesis.
The cells in plants and all other living things have microscopic components called organelles. One type of organelle in plant cells is the chloroplast, and it contains the pigment chlorophyll, which is what makes leaves green. When chlorophyll receives sunlight, it starts the photosynthesis reaction.
The name photosynthesis comes from the ancient Greek words “photo,” which means light, and “synthesis,” which means to make. During this food-making process, plants take carbon dioxide from the air and water from the ground, and with the energy from sunlight, make glucose. Glucose is a very simple type of sugar. Because it is a simple compound, it is simple to make.
Most of the time, photosynthesis occurs in leaves, and leaves take in sunlight to make food. There are some special plants, though, that actually absorb sunlight on their stems. Some of these include cactuses like the balloon-shaped golden barrel cactus, the spiky Munz’s Cholla and the paddle-shaped prickly pear. Some plants even have roots that can photosynthesize, like the rare palm Cryosophila albida.
Sunlight gives plants the energy to turn water and carbon dioxide into carbohydrates – the food their cells need to live and grow. At09kg/Wikimedia, CC BY-SA
Photosynthesis is billions of years old
Photosynthesis evolved more than 3.5 billion years ago. Initially, only single-celled organisms, kind of like today’s algae, could make sugar this way. Oxygen is a waste product from the photosynthesis process, and over time, these single-celled organisms released enough oxygen to change the Earth’s atmosphere. Ultimately, we and all other animals needed this to happen to be able to live and breathe.
Over time, aquatic plants developed, and gradually plants moved to land around 500 million years ago to better access their most vital resource: sunlight. Plants eventually got taller by around 350 million years ago. This is when the first tree evolved, which grew up to 150 feet tall. These trees looked like the evergreen trees we see today – sort of like pines, firs and spruce. And about 125 million years ago, trees that looked like the maples, oaks and beech trees we see today shared the landscape when dinosaurs ruled the Earth.
Not just good for plants
The Sun provides energy for the Earth. However, we humans are not capable of taking in the sun directly and using it to power our bodies. So how do we make use of the Sun’s energy? Plants do it for us.
Plants take in that energy and make food for us and other animals to eat and oxygen for us to breathe. We wouldn’t exist without plants and photosynthesis.
Like the ancient tiny single-celled organisms from 3.5 billion years ago, some microorganisms today use photosynthesis. Specifically, the algae that you might see living on top of lakes and the ocean do. Chlorophyll is why algae is green.
There are aquatic plants that use sunlight to grow. They typically make use of less sunlight because sunlight does not travel well through water.
In addition, there are a very few animals that can photosynthesize. The pea aphid uses pigment to harvest sunlight to make energy. The Oriental hornet uses a pigment in its exoskeleton to make energy from sunlight. The emerald-green sea slug eats algae and then incorporates chlorophyll from the algae into its body to photosynthesize. Because of this strategy, the sea slug can go nine months without eating.
So the answer to this question – why do trees need sunlight – is to make their food. And thanks to trees and other plants turning sunlight into their food, most of the rest of the living things on Earth get to eat, too!
Hello, curious kids! Do you have a question you’d like an expert to answer? Ask an adult to send your question to CuriousKidsUS@theconversation.com. Please tell us your name, age and the city where you live.
And since curiosity has no age limit – adults, let us know what you’re wondering, too. We won’t be able to answer every question, but we will do our best.
From left, J.B. Hamby, chair of the Colorado River Board of California, Tom Buschatzke, Arizona Department of Water Resources; Becky Mitchell, Colorado representative to the Upper Colorado River Commission. Hamby and Buschatzke acknowledged during this panel at the Colorado River Water Users Association annual conference that the lower basin must own the structural deficit, something the upper basin has been pushing for for years. CREDIT: TOM YULSMAN/WATER DESK, UNIVERSITY OF COLORADO, BOULDER
Colorado’s water and reservoirs are in the thick of disagreements over Colorado River management in a drier future.
All seven Western states in the Colorado River Basin agree that climate change is exacerbating conditions in the basin, and water users need sustainable, predictable water management. They agree that the current rules, which expire in 2026, didn’t do enough to keep reservoirs from dropping to critically low levels. They even agree that water cuts need to happen.
But they’re at loggerheads over how to share the pain — and have been for years. Now, the Lower Basin officials have proposed a plan calling on all basin users, including Coloradans, to make sacrifices.
“This is not a problem that is caused by one sector, by one state, by one basin. It is a basinwide problem, and it requires a basinwide solution,” John Entsminger, Nevada’s top negotiator, said during a news conference March 6.
Basin officials are negotiating Colorado River management in order to create new interstate water sharing rules that will replace the current agreements, which were created in 2007. The overburdened river system provides water to seven Western states, two Mexican states and 30 Native American tribes.
Basin states released competing proposals March 6, outlining their ideas for releasing, storing and cutting back on water use.
The Upper Basin proposal — put forward by Colorado, New Mexico, Utah and Wyoming — only includes cuts to the Lower Basin’s water use, although the four states would continue developing voluntary conservation programs.
The Lower Basin alternative — from Arizona, California and Nevada — looks at the amount of water stored in seven federal reservoirs. When that storage falls below 38% of total reservoir capacity, all seven states would conserve water to cut their collective use by 3.9 million acre-feet. One acre-foot roughly equals the annual water use of two to three households.
That’s a no-go for Upper Basin states, where water supply fluctuates yearly because it primarily relies on mountain snowpack. In 2020, a particularly dry year, the Upper Basin used 4.5 million acre-feet — much less than its legal allotment of 7.5 million acre-feet. In 2021, another drought year, the states had to cut back further.
That’s without any additional water cuts, like those proposed by the Lower Basin.
“When we’re looking at those years, like 2021 when our uses in the Upper Basin were at 3.5 million acre-feet, that represents almost a25% cut,” Commissioner Becky Mitchell, Colorado’s top negotiator, said. “To cut further in a year like that could wreck communities and economies.”
Colorado’s role in the Upper Basin plan
The Upper Basin proposal calls for few changes in the upstream states.
The Upper Basin would keep taking steps to ensure Lake Powell, located on the Utah-Arizona border, could make its required releases downstream, and to reduce Upper Basin water use through voluntary, temporary and compensated cuts, like the system conservation pilot program.
The rest of the proposal is meant to offer guidance to the Lower Basin, Mitchell said.
In the past, officials have changed how water is stored and released at lakes Mead and Powell based on the reservoirs’ elevations. The Upper Basin plan links operations more closely to each year’s available water storage, a high priority for Colorado officials.
In years when Lake Powell is less than 20% full, the Upper Basin states suggested releasing as little as 6 million acre-feet of water downstream. Upper Basin states are legally obligated to let at least 7.5 million acre-feet flow to Lower Basin states (plus some for Mexico) annually, as averaged over a rolling 10-year period.
If reservoir storage dropped to certain trigger levels, Lower Basin states would also cut up to 3.9 million acre-feet in a year.
The approach is designed to replenish depleted water storage in reservoirs, like Mead and Powell. These two enormous reservoirs — which function like savings banks for water users — drained to a third of their volume in the early 2020s, prompting a crisis response among officials and ramping up concerns about water availability in the future.
It would also protect Lake Powell’s ability to release water downstream according to water law, Mitchell said.
“That protects Colorado users. That protects all the Upper Basin states’ users,” Mitchell said. “The rebuilt storage protects all 40 million people — that’s the way that we protect all 40 million is to have a safety net.”
A call for widespread cuts
The Lower Basin officials say that the entire Colorado River Basin — including Colorado and the other Upper Basin states — must cut water use.
In their proposal, Lower Basin officials said they would take responsibility for the structural deficit, which refers to water losses from factors like evaporation, by cutting back on their water use by 1.5 million acre-feet in some years.
Credit: Upper Colorado River Commisstion
In years when the total storage in the system drops below 38%, the Lower Basin says the Upper Basin states need to help out so the basin as a whole can cut 3.9 million acre-feet.
If this plan had been in place since 1971, the states would have started taking cuts around 2000. For most of the past 24 years, the Lower Basin would have taken annual cuts of 1.5 million acre-feet. The Upper Basin would only have faced shortages in 2020 and 2021, according to Lower Basin officials.
“It’s very easy to craft an alternative that doesn’t require any sacrifice, but that’s not what the Lower Basin alternative does,” said JB Hamby, California’s top negotiator, during a March 6 news conference. “The Lower Basin is home to three-quarters of the Colorado River Basin’s population, most of the basin’s tribes, and the most productive farmland in the country. Our proposal requires adaptation and sacrifice by water users across the region.”
What would the Lower Basin option mean for Colorado?
Officials have released written plans, but it will take modeling out many different water supply scenarios to understand the impacts of each proposal, according to water experts.
But under the Lower Basin plan, Colorado could be on the hook for cutting its use by hundreds of thousands of acre-feet, said Colorado water expert Eric Kuhn.
In one hypothetical low-storage scenario, the Lower Basin would cut its use by 1.5 million acre-feet, then the two basins would each conserve an additional 1.2 million acre-feet, Kuhn said.
If Colorado took on a third of the Upper Basin’s obligation — and this is a big “if” — it would mean cutting water use by nearly 400,000 acre-feet.
“If Colorado ever agreed to absorb a certain percentage of the final … cuts, it’ll have a big impact on the state,” Kuhn said. “It’s not theoretical; it would be quite significant.”
For reference, all of the cities, towns and industries in Colorado use a combined total of about 380,000 acre-feet per year from multiple water sources, including the Colorado River, according to the 2023 Colorado Water Plan.
Mandated cuts could even send states into litigation, which is the worst outcome, said one Colorado official. Once the issue moves to the courts, state officials can’t talk to each other, and their future could be in the hands of U.S. Supreme Court justices who may not have expertise in the complex realm of Western water law.
“We’ll talk 1-to-1 cuts when they’re down to 4.5 million acre-feet,” said Steve Wolff, general manager of the Durango-based Southwestern Water Conservation District, referring to the average amount of water used by Upper Basin states. “When you’re still using twice as much as us, why should we agree to a 1-to-1 cut?”
Peter Ortego, general counsel for the Ute Mountain Ute Indian Tribe, said basin tribes that have made agreements to share in future shortages could be impacted. Most tribal nations have senior water rights, which get water first in dry years and should be protected from most water cuts, he said.
Environmental groups say more needs to be done to protect rivers and freshwater resources, which provide vital habitat for wildlife in the arid West.
In recent, very dry years, Colorado trout fisheries, like the Yampa River, have been shut down because of low flows and warmer water temperatures in mid-to-late summer. If modeling shows that federal or state plans would leave less water in the rivers, that would be concerning, said Jennifer Pitt, Colorado River Program director for the National Audubon Society.
Going forward, Pitt and other water experts will be watching for updates from the Bureau of Reclamation’s analysis. That’s when they’ll know more about possible impacts to Colorado.
Until then, Coloradans need to keep one thing in mind, Pitt said.
“This is not Colorado against the rest of the West. This is Colorado, part of a river basin that is shared,” she said. “All those parties need each other to get through some challenging conditions in the future.”
Synopsis: A transition from El Niño to ENSO-neutral is likely by April-June 2024 (83% chance), with the odds of La Niña developing by June-August 2024 (62% chance).
During February 2024, sea surface temperature (SST) anomalies continued to weaken across most of the equatorial Pacific Ocean. In the last week, below-average SSTs emerged in a small region of the eastern equatorial Pacific Ocean (~100°W; [Fig. 1]). The weekly Niño indices weakened but remained positive, with the latest value in Niño-3.4 standing at 1.4°C [Fig. 2]. Area-averaged subsurface temperature anomalies were slightly negative [Fig. 3], reflecting the consequences of an upwelling Kelvin wave and associated below-average temperatures across the equatorial Pacific Ocean [Fig. 4]. Low-level winds were near average over most of the equatorial Pacific, while upper-level wind anomalies were easterly over the east-central Pacific. Convection was enhanced near the Date Line and was suppressed near Indonesia [Fig. 5]. Collectively, the coupled ocean-atmosphere system reflected a weakening El Niño.
The most recent IRI plume indicates a transition to ENSO-neutral during spring 2024, with La Niña potentially developing during summer 2024 [Fig. 6]. While different types of models suggest La Niña will develop, the forecast team favors the dynamical model guidance, which is slightly more accurate for forecasts made during this time of year. Even though forecasts made through the spring season tend to be less reliable, there is a historical tendency for La Niña to follow strong El Niño events. In summary, a transition from El Niño to ENSO-neutral is likely by April-June 2024 (83% chance), with the odds of La Niña developing by June-August 2024 (62% chance; [Fig. 7]).
For those who were on Colorado’s Front Range in 2003, the epic snowstorm in mid-March likely still holds a place in your memory. This was the biggest snowstorm on record at Fort Collins, with 32.2″ of snow in two days on March 18-19. Denver’s 32″ of snow is 2nd only to the 41.3″ in four days in December 1913. There were multiple reports of over 70″ of snow in the foothills around Nederland and Conifer.
The March 2003 storm was also known for very wet snow. Fort Collins received 5.29″ of liquid precipitation over three days, which is in the top-10 wettest 3-day periods and easily the wettest snowstorm. The roofs of multiple commercial buildings caved under the weight of the heavy, wet snow.
Snowfall totals in northern Colorado from the March 2003 snowstorm. Map produced by National Weather Service Boulder. Credit: Colorado Climate Center
At the time, the perception was that the March 2003 storm was very well forecast, far in advance of the storm. (State climatologist emeritus Nolan Doesken confirms this perception.) The forecasts of the March 2021 “Pi Day” storm also got plenty of attention at the time, and with another potentially big snowstorm on the way for the Front Range this week, let’s take a look at how far forecasting has come in the 21 years since the March 2003 storm.
Compared to what’s available today, the information available to forecasters in 2003 was pretty limited. The US essentially ran two numerical weather prediction models: an earlier version of the Global Forecast System (GFS), and the Eta model (predecessor to today’s North American Mesoscale (NAM) model). Ensemble forecasting was still a relatively new concept and not in wide use (more on this in a bit). Reading through National Weather Service forecast discussions leading up to the storm, the guidance from these two models was clearly what forecasters were relying on. Forecasts from the GFS are archived and accessible, but I wasn’t able to find an archive of the Eta model output (except for shorter-range forecasts). Here’s what the GFS liquid precipitation forecasts looked like for the 5 days leading up to the storm, with the observations in the lower right.
NOAA GFS model precipitation forecasts for the 3-day period ending the morning of 20 March 2003, for forecasts nearing the storm (longer lead times in upper left to shorter in lower middle.) The lower right panel shows observations from the PRISM dataset (courtesy of the PRISM climate group, Oregon State University). Archived GFS forecasts obtained from NOAA/NCEI.
These actually don’t look very good. Part of that is the coarse resolution of the model that was available at the time, so details are washed out. But part of it is that the heaviest precipitation wasn’t really predicted in the right place! There’s a signal for substantial precipitation, but it jumps from southern Colorado to Wyoming and never really locks in very well on northern Colorado. There’s also nowhere near the over 6 inches of liquid precipitation (!) that fell in the Front Range foothills.
Fortunately, NWS forecasters are experts at what they do, and they use knowledge of meteorology rather than just what the models are showing. And this knowledge was critical in identifying what was likely to happen. Here are some quotes from the NWS area forecast discussions leading up to the storm:
Approximate time before snow started
Selected text from NWS area forecast discussion
~5 days
IF MODELS DO VERIFY…WE COULD SEE A SIGNIFICANT STORM ALONG THE FRONT RANGE EASTWARD INTO NORTHEASTERN COLORADO MONDAY NIGHT INTO TUESDAY. CONDITIONS MAY IMPROVE ON WEDNESDAY. AT THIS TIME WILL KEEP POPS AT A CHANCE AS WE ARE STILL OUT SOME 156 HOURS.
~4 days
BEST BET LOOKS LIKE THE BEST STUFF WILL BE SOUTH OF US…THOUGH IT COULD STILL BE CLOSE ENOUGH TO GET GOOD SNOW ALONG THE FOOTHILLS NEAR DENVER.
~3 days
NOW FOR THE TROUBLE. ETA SHOWS A PRETTY WELL ORGANIZED CYCLONE DEVELOPING OVER SERN CO SUN NIGHT AND PARKING THERE FOR ETERNITY… MEANWHILE CONSENSUS OF THE OTHER MEDIUM RANGE MODELS HAS BEEN A STRONGER AND SLOWER SOUTHERN SYSTEM…PERHAPS EVEN TOO FAR SOUTH TO BE GOOD FOR US.
~2 days
MODELS ARE COMING INTO BETTER AGREEMENT ON THE DEVELOPMENT OF A MAJOR WINTER STORM MON THROUGH WED…MODELS DEPICT FRIGHTFUL SNOW AMOUNTS…15 TO 20 INCHES FROM THE AVN ON THE PLAINS FROM MON NIGHT THROUGH WED NIGHT. ETA HAS HEAVIER AMOUNTS WITH 12 TO 18 INCHES ALONG THE FRONT RANGE BY TUE AFTERNOON IN THE MIDDLE OF THE EVENT.
~1.5 days
THERE IS GREAT POTENTIAL IN THIS STORM TO PRODUCE THE BIGGEST PLAINS SNOWSTORM SINCE THE OCTOBER BLIZZARD OF 97…IF ALL THE PIECES COME TOGETHER AT THE RIGHT TIME…RIGHT PLACE…AND RIGHT INTENSITY.
~1 day
CONFIDENCE INCREASING ON A BIG SNOW STORM… PERHAPS REALLY BIG…THE AVN GIVES STORM TOTALS OF 15 TO 20 INCHES FROM CHEYENNE TO DENVER AND OUT TO LIMON. THE ETA … SHOWS 35 TO 45 INCHES IN DENVER WITH 8 TO 20 INCHES ON THE MIDDLE PLAINS AND JUST AN INCH IN THE NE CORNER….FOOTHILLS WILL GO NUTS ON WED IF THE ETA IS RIGHT.
start of event
INGREDIENTS ARE ALL COMING TOGETHER FOR SIGNIFICANT SNOW EVENT WHICH WL CONT FOR THE NEXT COUPLE DAYS…FORECAST STORM TOTAL SNOW ACCUMULATIONS FROM THE MODELS ARE HOLDING STEADY…ETA HAS 30 TO 40 INCHES FOR DENVER…GFS IS HOLDING STEADY WITH 15 TO 20 INCHES…. ETA GENERATES A BAND OF 80 INCHES OF SNOW IN THE HIGHER FOOTHILLS… SNOW MODEL GIVES INCH PER HOUR RATES FROM NOW THROUGH WED NIGHT. THE 5 FOOT LIMIT IN THE FOOTHILLS DOES NOT APPEAR TO BE ENOUGH. I WILL TRY 3 TO 8 FEET BUT THERE COULD BE SOME PRIME SPOTS THAT GET EVEN MORE. I SUPPOSE THERES NO DIFFERENCE EXCEPT FOR THE RECORD BOOKS.
Select text from NWS Boulder Area Forecast Discussions leading up to the March 2003 snowstorm. Obtained from the Iowa Environmental Mesonet.
As of about 2 days before the start of the storm, this was a very accurate description of what would happen, especially for 2003 standards. But more than 3 days in advance, there wasn’t much useful information beyond the idea that a storm was possible.
We can compare the graphic above to a similar one for the March 2021 Pi Day storm. For that storm, the GFS forecasts were remarkably consistent from 5 days in advance to when the event started. They all had the heaviest precipitation along the northern Front Range and southern Wyoming, extending out into Nebraska, and that’s what happened. The primary issue with these model runs is that some of them over-predicted the precipitation. So even though there was uncertainty in the details, the fact that there would be a big storm on the northern Front Range was quite clear at least 5 days in advance, which is a big improvement over what was possible in March 2003.
Similar to the above figure, but for GFS model forecasts of precipitation for the March 2021 Pi Day storm. Credit: Colorado Climate Center
A big advance: ensemble forecasting
Today, a critical tool in the forecasting toolbox is “ensemble” forecasting, whereby many different model forecasts are made, using slight tweaks to the initial estimate of the state of the atmosphere, or different assumptions about processes like cloud microphysics, or both. This ideally provides a range of possible outcomes, and allows forecasters to highlight “worst case” and “best case” scenarios. Here’s an example of an ensemble “plume” for the big Pi Day storm in March 2021:
Plume diagram for accumulated precipitation at Fort Collins from NOAA’s Global Ensemble Forecast System. Each colored line represents a different model run, all initialized at 0000 UTC 9 March 2021, out to 10 days. The thick black line is the mean of the 31 different forecasts. The dashed line shows the total precipitation that was observed from this storm in 2021 (2.39″), which is close to the ensemble mean forecast. Available here for current forecasts. Credit: Colorado Climate Center
This forecast was made around 4 days in advance, and again, it’s pretty clear that a big storm is on the way. But was also still a wide range of possible outcomes — from lower-end amounts (around an inch of liquid) to some extreme amounts (5+ inches). The mean (thick black line) was a little over 2.5″ for this forecast, and turned out to be quite close to what happened (Fort Collins recorded 2.39″ of liquid in this storm.) This signal continued as the storm neared, and the NWS issued this remarkably good forecast early on March 12th (backed up by insightful discussions of the meteorology behind the forecast):
(left) Observed snow from the March 2021 “Pi Day” snowstorm (right) NWS snowfall forecast issued at 3:51am MST on March 12, 2021. Credit: Colorado Climate Center
Sure, you can find some details to quibble with (Fort Morgan got more snow than the forecast, while parts of El Paso County got less), but the overall pattern was right on. This level of detail also goes far beyond what was possible in March 2003. NWS now routinely provides the “best case” and “worst case” scenarios, along with probabilities of exceeding certain snow amounts.
Still really difficult: rain vs. snow, details, and bands
You might notice that I mostly showed model depictions of liquid precipitation rather than snowfall. Figuring out the changeover from rain to snow, and what the snow-liquid ratio will be, are big challenges that remain in snowfall forecasting.Think of it this way: on most days, you probably don’t care if the temperature forecast is off by a couple degrees. If the forecast is 70 and it ends up being 68 or 72, no big deal. But when those couple degrees surround 32F, it can be the difference between a huge snowstorm or a miserable cold rain. [ed. emphasis mine] The complex terrain in Colorado complicates this further, because temperature can change rapidly with small changes in elevation. This is one of the big questions about the incoming storm on the eastern plains: there’s been a slam-dunk signal for a lot of liquid for nearly a week, but will it be cold enough for significant snow to accumulate? We shall see…
National Weather Service snow total forecast for the March 13-15, 2024 snowstorm, issued at 2:06pm MDT on March 12, 2024. Some large ranges! From https://www.weather.gov/media/bou/DssPacket.pdf
Another big challenge is when the snow is arranged in “bands”. These bands can cause big snow totals in very localized areas, while nearby spots get next to nothing. One recent example was the 10+” of snow that fell around Greeley on February 9-10, 2024. These are really hard to predict, and when there is a “busted” forecast, it’s often because of these snowbands.
What’s also changed: dissemination of information
The other big change over the last 21 years is how information is communicated. TV meteorologists and newspapers still play an important role in getting the word out, but many people get their weather information from a smartphone app or social media. Most of us have internet-connected computers in our pockets, which makes it much easier to find credible forecast information, if you know where to look.1 But on the other hand, the potential for “hype” ahead of a potential big storm is much greater, as is the criticism that forecasters receive if the predicted totals aren’t right on. (Forecasters don’t ever seem to get equivalent praise for getting it right…)
The improvement in weather prediction over time has been called a “quiet revolution.” No single discovery or advance has led to these improvements, but instead the incremental increase in knowledge, data, and computing power. The forecasts of the March 2003 snowstorm by human forecasters were indeed very good for the time (the computer model output itself, maybe not so great.) But today, although snow forecasting remains difficult, it’s usually possible to see what’s coming a lot farther in advance, and with a lot greater detail.
For further reading
If interested in more reading on Front Range snowstorms:
NWS Probabilistic Winter Snow forecasts. Link is https://www.weather.gov/bou/winter for the Boulder office, change “bou” to “pub”, “gjt”, or “gld” for the other offices serving Colorado.
My own story from March 2003: my girlfriend at the time (now wife) and I had been in Florida for spring break, flying back to Colorado the evening of March 17. Despite the good forecasts noted above, we had no idea about the incoming snowstorm, because people weren’t just on the internet all the time. That wouldn’t happen today! We made a harrowing drive back to Fort Collins just as rain was changing over to snow, but it turns out that if we hadn’t driven back that night we would’ve been stuck at the airport for multiple days.
Although the Upper Gunnison has proven the value of ASO flights, the agency — as well as many other water districts in Colorado — cannot pay for the costly technology alone. This year, the district created an Upper Gunnison Basin ASO funding partnership, a growing collective of local agencies that will divide the cost of running flights.
“For the Western Slope, it’s incredibly important to be able to predict annual hydrology so that we can live within our means on the river,” said District General Manager Sonja Chavez.
The annual cost of conducting snow surveys for the East and the Taylor River watersheds exceeds $300,000. These basins, which encompass roughly 570 square miles, are prioritized because they typically hold the most snow and generate the largest amount of water in the spring…After a $50,000 investment from the water district, the Gunnison County Electric Association, the Lawrence Berkeley National Laboratory, the Upper Colorado River Commission and the Colorado Water Conservation Board (CWCB) helped cover the rest. Chavez said she plans to expand the partnership next winter.
Click the link to access the report on the Reclamation website. Here’s the introduction:
The Colorado River System provides essential water supplies to approximately 40 million people, nearly 5.5 million acres of agricultural lands, hydroelectric renewable power, recreational opportunities, habitat for ecological resources, and other benefits across the southwestern United States and northwestern Mexico (Reclamation, 2012). While the annual flow of the Colorado River and its tributaries varies considerably from year to year, the Colorado River System is currently experiencing prolonged drought and low runoff conditions accelerated by climate change that have led to historically low water levels in Lakes Powell and Mead (Reclamation, 2021). The period from 2000 through 2022 is the driest 23-year period in more than a century and one of the driest periods in the last 1,200 years (Meko et al., 2007).
On August 16, 2022, the Bureau of Reclamation (Reclamation) and Department of the Interior announced several administrative actions for consideration to improve and protect the long-term sustainability of the Colorado River System (Reclamation, 2022a). These actions were identified in the context of the low reservoir conditions as described in Reclamation’s Colorado River Basin August 2022 24-Month Study.
The administrative actions in the Lower Basin included reviewing and prioritizing additional administrative initiatives that would ensure maximum efficient and beneficial use of urban and agricultural water, and address evaporation, seepage, and other system losses in the Lower Basin. As part of that action, this report provides an overview of evaporation and riparian evapotranspiration (ET) losses along the lower Colorado River mainstream. The report presents methodologies that have been used to develop those datasets; however, it does not make recommendations on how to implement or account for system losses from the lower Colorado River mainstream. Data regarding seepage to groundwater were not included in this report. Seepage along the mainstream of the lower Colorado River is not considered to be a loss from the system as water entering the aquifer will re-emerge further downstream within the Colorado River.
Estimates of lower Colorado River mainstream evaporation and riparian ET losses provided in this report were divided into five reaches, as follows:
Reach 1: Lake Mead
Reach 2: Hoover Dam to Davis Dam
Reach 3: Davis Dam to Parker Dam
Reach 4: Parker Dam to Imperial Dam
Reach 5: Imperial Dam to the Northerly International Boundary (NIB) with Mexico
The Rio Grande at Isleta Blvd. and Interstate 25 on Sept. 7, 2023. (Photo by Anna Padilla for Source New Mexico)
Click the link to read the article on the Source NM website (Danielle Prokop):
March 13, 2024
New Mexico and Albuquerque-based irrigation officials have signed off on a first-of-its-kind cooperative agreement for “emergency, short-term and long-term” management of the Rio Grande.
Last week, the Interstate Stream Commission voted unanimously to allow its staff to enter an agreement with the Middle Rio Grande Conservancy District, which was signed Monday evening after receiving approval from the irrigation’s board.
The deal will allow these governing bodies to better manage flood prevention, improve “water conveyance,” meet interstate legal agreements and build species habitat for endangered animals in the Middle Rio Grande, said Hannah Riseley-White, the executive director for the Interstate Stream Commission.
“It exemplifies our commitment to each other to work together in solving and tackling these problems,” she told commissioners in the March 5 meeting.
The five-year agreement will allow for communication and coordination between the state and irrigation district officials and outline responsibilities in the partnership, according to a packet given to commission members.
The Interstate Stream Commission is a division of the New Mexico Office of the State Engineer, charged with the “broad powers” to protect, conserve, develop and investigate New Mexico surface waters – such as rivers, streams and lakes.
The Middle Rio Grande Conservancy District, based in Albuquerque, is the governmental body which oversees irrigation for land between Cochiti Dam to the Bosque Del Apache Wildlife Refuge. Irrigated lands in the district are ballparked between 55,000 to 58,000 acres with about 11,000 active irrigators, said Conservation Program Supervisor Casey Ish.
Top officials for the irrigation district and the state agency said the agreement puts an unofficial two-decade partnership to paper.
The state and district face colliding concerns of climate change causing more fires and floods in the region; difficulty in sending water downstream for legal agreements and a need to build habitats for endangered species, Riseley-White said.
As federal funds pour in from infrastructure and climate-adaptation projects, the agreement will help address difficult reaches in the irrigation district’s area, Jason Casuga, chief engineer and CEO for the irrigation district, told commissioners last week.
In a summary given to commissioners, the partnership is necessary to meet legal obligations to Texas and Mexico users downstream, made in treaties and a nearly 80-year old agreement.
“The looming water crisis is prompting an ‘all hands-on deck’ approach by water managers in the Rio Grande basin to ensure New Mexico can maintain water deliveries within the Middle Rio Grande under the Rio Grande Compact,” the summary said.
Concerns raised by Interstate Stream commissioners
Board members had questions for how the agreement might impact relationships with other irrigation districts and tribal governments of Cochiti, Santo Domingo, San Felipe, Santa Ana, Sandia and Isleta Pueblos.
At the March 5 meeting, board member Phoebe Suina (Cochiti), a hydrologist, asked if any of the six middle Rio Grande Pueblos were consulted, or going to be included formally in future project planning or agreements.
Riseley-White said the state’s intent would be engaging relevant parties, including tribes, on specific projects.
“I think those six Middle Rio Grande Pueblos are important partners for us in figuring out what this needs to look like, and it will be critical to engage with them effectively,” she said.
Casuga further responded that the projects would target “benefiting all middle Rio Grande users.”
“When we get into project specifics and the funding associated with those, that’s when I think we would engage individually with the constituents who would be affected by this,” he said.
Board member Greg Carrasco, a Las Cruces farmer and rancher, asked if this agreement impacts the state’s relationship with other irrigation districts.
Riesely-White replied that the agreement has no impact on other relationships.
State Engineer Mike Hamman addressed the commission, calling the agreement a “starting point” for the state to work with other irrigation districts, Pueblos and other water users to address “mutual interests” and leverage federal dollars.
Hamman noted upcoming settlements in adjudication for the six middle Rio Grande Pueblos’ water rights and the pending settlement agreement in the Rio Grande U.S. Supreme Court lawsuit between Texas and New Mexico, could operationally impact the Rio Grande and Rio Chama.
He said that meeting those legal agreements to ensure water in rivers flows to recipients poses a challenge to both entities, requiring a “symbiotic relationship” to turn it around.
“We’re in a compact-deficit situation drifting towards potential violation in theory,” Hamman said, referencing the Middle Rio Grande’s debit of about 25,000 acre feet owed to Elephant Butte Dam for users downstream in Texas and Mexico.
Hamman said both the irrigation district and the state were concerned about delays in construction on the El Vado Dam, and how that is impacting sending water downstream.
Before the vote, Suina urged soliciting Pueblos’ inclusion on upcoming projects, saying the land and water stewardship of the Pueblos has often been overlooked in the past century of water planning.
She noted that Pueblo governments have pushed back against assertions that the middle Rio Grande is “at the end of its life cycle,” saying that the river itself is a necessity.
“I want to encourage that engagement, encourage the collaboration, I see this [agreement] as a step towards that,” Suina said. “But even in that state, just not to forget our Pueblo communities.”
Suina voted yes, but appended her vote with a comment.
“I have confidence in director Riseley-White to have that Pueblo engagement that enables me to say yes to this,” she said.
Rio Grande and Pecos River basins. Map credit: By Kmusser – Own work, Elevation data from SRTM, drainage basin from GTOPO [1], U.S. stream from the National Atlas [2], all other features from Vector Map., CC BY-SA 3.0, https://commons.wikimedia.org/w/index.php?curid=11218868
Forest Pests Continue to Spread in Colorado Despite Milder Year
Colorado experienced wetter, cooler conditions in 2023 compared to recent years. This was good for many species of trees in areas of Colorado suffering from prolonged drought, but trees will need several years of adequate moisture and lower temperatures to recover, regain their health and ward off attack from bark beetles and other forest pests. Populations of bark beetles and western spruce budworm remain high in forests and a milder year is not enough to reverse recent trends.
Western spruce budworm remains the most widespread forest pest in Colorado, according to aerial survey data from the Colorado State Forest Service and U.S. Forest Service Rocky Mountain Region. Data from the aerial survey also indicate that western balsam bark beetle remains the deadliest forest pest for the second year in a row, despite it impacting fewer acres of Colorado’s forests in 2023.
The storms (Feb. 26-27 and Mar. 2-3) were western Colorado’s first major dust event this year. Windstorms carrying dust from the arid Four Corners region commonly hit the Colorado Rockies in spring, depositing dark layers in the local snowpack. The dust often causes snow to melt faster, meaning there is less water available in local rivers and streams by late summer and fall. Rafting companies and recreators have less time to play, and some farmers and ranchers must stop irrigating earlier. Snow researchers say the combined event was relatively large and may have hit the Roaring Fork watershed harder than other areas. The dust has been visible on Aspen ski mountains, including at the bottom of this year’s FIS Alpine World Cup course on Ajax…
Jeff Derry — executive director of the Silverton-based Center for Snow and Avalanche Studies — said the event was widespread, depositing dust in an area spanning from the San Juan Mountains near Telluride to Rabbit Ears Pass near Steamboat Springs. Andrew Temple, a field assistant at CSAS, said McClure Pass south of Carbondale received more dust than any other site he visited for snow observation this week, including Park Cone east of Crested Butte and Spring Creek Pass south of Lake City…
In April, a dust storm arrived just as local snowpack was hitting its peak, meaning it remained high in the snow layers and affected almost the entire runoff process. Even with last year’s wet, cloudy spring conditions, Deems estimates the dust cut a month off the spring runoff season.
The two groups of Colorado River watershed states — the Upper Basin and the Lower Basin — have each come up with a respective preliminary plan for how to deal with a shrinking supply of water in the river and its tributaries. And, surprise surprise, they don’t agree: They both want the other team to take a bigger hit.
Way back in early 1900s, the question facing these seven states was how to divide up the waters of the Colorado River, first between the two basins, then between the states within each basin. The 1922 Colorado River Compact answered that question. Sort of. The Compact is flawed in many ways, including that the folks who signed onto it thought there was a bunch more water than actually flowed in the river — even back then.
I like to run this one again from time to time, just to remind folks how much the population of the West has grown over the last century. This is what the signers of the Colorado River Compact were dealing with as far as water users go — compared to some 40 million users now. Source: USGS.
Now there’s even less water and higher consumption. If the river users don’t make some major cuts and soon, the reservoirs will dry up and leave the Southwest’s cities, towns, and farms to fight over the diminishing scraps.
“We can no longer accept the status quo of the Colorado River operations,” said Becky Mitchell, Colorado’s representative on the Upper Colorado River Commission, in a press release. “If we want to protect the system and ensure certainty for the 40 million people who rely on this water source, then we need to address the existing imbalance between supply and demand.”
Map of the Colorado River drainage basin, created using USGS data. By Shannon1 Creative Commons Attribution-Share Alike 4.0
So now the question facing the states is similar to the one they asked 102 years ago, but with a twist: How should those deep cuts be divided up now that global heating is depleting the river’s flow?
It’s a tough question with no easy answers. And it’s all made more difficult by a lack of clarity regarding the definition of terms in the original Compact such as “beneficial consumptive use” and “surplus,” and how to measure those things. Where does use of tributaries that run into the Colorado below Lee Ferry, such as the Gila River, the Little Colorado, and the Virgin River fit into all of this?
The “natural flow” is the estimated amount of water that would flow past Lee Ferry (below Glen Canyon Dam) if there were no upstream dams, diversions, or withdrawals. The Colorado River Compact was based on the assumption that about 16 million acre-feet flowed past Lee Ferry per year (which is not unreasonable given the abnormally high flows between 1906 and the late 1920s). In fact, the 1906-1923 median is about 14.5 MAF (with an average of about 14.7 MAF). And the 1991-2023 average is 13.2 MAF. Yikes! Source: Bureau of Reclamation.
Until those definitions are agreed upon, we won’t really know whether the Lower Basin is using the amount of water allocated to it in the Compact (8.5 million acre-feet), or significantly more than that (10.1 million acre-feet). Until we know what “surplus” means, we won’t know who is responsible for ensuring Mexico gets its allocated share. So far there is no agreement on those definitions. (For a detailed and intelligent take on this, please see Eric Kuhn’s and John Fleck’s piece on Fleck’s Inkstain blog).
The good news is that the current proposals aren’t final; there is still time for the basins to negotiate. And the two basins’ representatives are inching closer to accord, finding harmony where it previously eluded them. The two alternatives agree:
That consumption cuts should be triggered not by forecasted water levels in Lake Mead, but by current hydrologic conditions throughout the entire system. However, they differ on how to measure those conditions.
And that the Lower Basin should include evaporation and seepage — totaling an estimated 1.3 million acre-feet per year — in its consumptive use, as the Upper Basin has always done. They plan to offset this loss by cutting consumption by 1.5 million acre-feet per year.
Total losses (evaporation and riparian ET) from Reach 1 through Reach 5. Credit: USBR
The main sticking point comes when reservoirs shrink to critically low levels:
Under the Upper Basin’s plan, as storage levels drop, they would release progressively less water from Lake Powell. So if water storage is 81% to 100% full, then they’d release 8.1 to 9 MAF from Glen Canyon Dam, giving the Lower Basin their full allocation. But if storage is less than 20% full, it would release just 6 MAF per year, giving the Lower Basin 2.5 MAF less than their allocation that year — presumably forcing them to cut that same amount of consumption. Whether and how much consumption the Upper Basin would have to cut under this scenario would depend on how much water is actually in the river. It’s important to note that the Upper Basin does not and has never used its full allocation of 7.5 MAF per year.
Under the Lower Basin’s plan, when the system is between 38% and 70% full, the Lower Basin would cut its consumption by 1.5 MAF per year. When system water levels drop below that, then the Lower Basin would continue its 1.5 MAF per year cuts, and the two basins would share any cuts above that up to a maximum of 3.9 MAF per year. So under the maximum cuts, the Lower Basin would reduce usage by 2.7 MAF while the Upper Basin would cut use by 1.2 MAF.
The Upper Basin’s alternative, summed up. Source: Upper Colorado River Commission.
The Lower Basin’s proposed framework for reductions. The Lower Basin would make all of the cuts (1.5 MAF per year) down to 38%, after which the two basins would evenly split any reductions beyond 1.5 MAF. Source: Lower Basin states.
Both basins’ alternatives mention and acknowledge that many tribal nations’ water rights remain unfulfilled, and yet say little about how the situation might be rectified. And each Basin says its respective plan is the most sustainable, is most likely to keep Hoover and Glen Canyon dams from being compromised, and complies with the Law of the River — or the set of treaties, compacts, and court cases that govern how the river is used.
Yet the sustainability or health of the Colorado River as an entity — a breathing, flowing, living being — is barely mentioned. Little thought is given to the ecosystems, cultures, and creatures the river sustains. I realize that’s not the point of this exercise. And yet, ultimately, it will be the River itself that lays down the law, not century-old compacts or legal precedents or antiquated water rights. Perhaps we ought to pay it a little more respect.
Moderate to heavy rain amounts fell across parts of the Southeast and Northeast this week, leading to localized improvements to ongoing drought and abnormal dryness in the Southeast, and mostly unchanged conditions in the Northeast, aside from western New York, which missed out on the heavier precipitation and saw minor degradations. The central third of the contiguous U.S. saw a mix of improvements and degradations, based on where heavier precipitation did or did not fall and where dry and windy conditions continued. Parts of Illinois, Indiana, Ohio, the Michigan Lower Peninsula, southern Missouri and southeast Kansas saw improving conditions after heavier rains fell there. Meanwhile, moderate drought expanded in northwest Missouri and portions of west-central Wisconsin, Minnesota, northwest Iowa, the far southern Michigan Upper Peninsula and far northeast Wisconsin. Much of Texas remained the same, with a few degradations in the southeast corner and several degradations in central and southern Texas where long-term drought conditions are still causing impacts. Recent dryness and warm and windy weather in northwest Oklahoma and the Texas and Oklahoma panhandles led to abnormal dryness developing there. Short-term dryness and high evaporative demand led to large areas of degrading conditions in northeast Wyoming, while west-central Wyoming, north-central Colorado, northeast Utah, western Montana, and the northern Idaho Panhandle all saw areas of improvement due to lower evaporative demand and improving snowpack recently. In Hawaii, an active trade wind pattern continued, leading to some improvements on the windward (northeast) slopes of the Big Island and Kauai, while a small area of moderate drought developed on the leeward (southwest) portion of Kauai. In Puerto Rico, a few improvements were made where recent rainfall has improved streamflows and crop stress, and lessened rainfall deficits and raised reservoir levels. No changes were made to the Drought Monitor this week in Alaska…
Eastern parts of the High Plains region were mostly warmer than normal this week, with temperatures 8-10 degrees above normal occurring in the eastern Dakotas. Colder-than-normal weather occurred in western Wyoming and parts of Colorado. Localized heavy rains from severe thunderstorms this week occurred in parts of central and southeast Kansas, leading to localized improvements to ongoing drought and abnormal dryness. In south-central and southwest Kansas, abnormal dryness developed where dry weather from the past couple of months combined with warm and windy conditions, similar to those experienced in northwest Oklahoma and parts of the Texas and Oklahoma panhandles. In southwest Nebraska, localized improvements were made to an area of abnormal dryness after a major snowstorm struck the area. Recent dry, warm and windy weather led to a small expansion of abnormal dryness in northeast Nebraska and far southeast South Dakota. In northeast Wyoming and adjacent southwest South Dakota, recent dry, warm and windy weather led to expansions of abnormal dryness and moderate and severe drought. Recent snowpack improvements in the Wyoming Range of west-central Wyoming and in the Never Summer and Medicine Bow Mountains of northern Colorado led to improvements to ongoing abnormal dryness in both areas…
Colorado Drought Monitor one week change map ending March 12, 2024.
Temperatures across the West this week were primarily near normal or colder than normal. Compared to normal, the coldest area was southern Idaho, where temperatures mainly ranged from 6-12 degrees below normal. Portions of central and southeast Montana were 3-6 degrees above normal. Heavy precipitation fell in parts of north-central and northwest California, and along the Oregon and Washington coasts. Elsewhere, precipitation also fell in some of the mountainous parts of the northern half of the West region. After recent heavy precipitation in western Oregon and improvements to streamflow and long-term precipitation deficits, an area of abnormal dryness was removed from west-central Oregon. Given recent wetness, further improvements in the area may occur in coming weeks. In western Montana and northern Idaho, recently improved snowpack and lessening precipitation deficits led to several improvements to ongoing drought and abnormally dry conditions. Due to low evaporative demand and improved long-term precipitation deficits, northeast Utah saw reduced coverage of abnormal dryness this week…
Rainfall amounts this week in the South region varied widely. In western Oklahoma, south Texas, and the Oklahoma and Texas Panhandles, the weather this week was mostly dry. In north-central Texas, portions of Louisiana and Arkansas, central and southern Mississippi, and south-central Tennessee, rainfall accumulations of 1-2 inches occurred, with locally higher amounts. Much of the central and eastern part of the region saw above-normal temperatures, with readings commonly falling into the 2-8 degrees above normal window. In western Texas and the Oklahoma Panhandle, temperatures were generally closer to normal, with most readings falling somewhere between 4 degrees cooler than normal and 4 degrees warmer than normal. In south-central and southeast Tennessee, recent rainfall improved streamflows and precipitation deficits enough to result in improvements. Farther west in west-central and northwest Tennessee and adjacent east-central Arkansas, abnormally dry conditions expanded where short-term precipitation deficits paired with high evaporative demand and lowering streamflow. In areas of recent heavy rainfall in Louisiana, precipitation deficits lessened and soil moisture profiles improved enough for improvements in areas of abnormal dryness and moderate drought. In southeast Texas and nearby southwest Louisiana, abnormal dryness expanded and moderate drought developed where recent dryness and high evaporative demand combined with decreasing soil moisture and streamflow numbers. In central Texas, recent localized dryness occurred on top of long-term dryness and drought, which combined with very low streamflow in many locations to lead to expansion of drought and abnormal dryness areas. In the northeast Texas Panhandle and adjacent Oklahoma Panhandle and northwest Oklahoma, dry weather over the last couple of months combined with high evaporative demand led to the development of abnormal dryness. In these areas, wildfires have been common recently…
Looking Ahead
According to forecasts from the National Weather Service Weather Prediction Center, heavy snowfall is forecast in the Colorado Front Range area near the beginning of the forecast period (March 14-15), while heavy precipitation with this storm system is also likely across other parts of the Four Corners states. Aside from portions of the Four Corners states, much of the West is likely to stay dry through Monday evening. Farther east, through Monday evening, half an inch (or more) of precipitation is forecast from central Nebraska eastward into parts of the Rust Belt. Rainfall amounts of a half inch to 2 inches, with locally higher amounts, is also forecast from central Texas eastward through southeast Oklahoma, Arkansas and southeast Missouri to most of Georgia and Tennessee and southern Kentucky.
The National Weather Service Climate Prediction Center 6-10 day forecast favors near-normal precipitation or above-normal precipitation across the contiguous U.S., covering the period from March 19-23. The highest confidence areas for above-normal precipitation are the Florida Peninsula, along the Gulf Coast, and from the Arizona/New Mexico border northward through Montana. Warmer-than-normal temperatures are favored across parts of the West, especially in Utah, Nevada, California, Idaho, Washington and Oregon, and in parts of the central and southern Great Plains. Below-normal temperatures are favored in the Southeast, excluding the southern Florida Peninsula where near- or above-normal temperatures are favored. Below-normal temperatures are also favored from central Montana eastward through North Dakota and northern South Dakota, Minnesota, Wisconsin and Michigan, with below-normal temperatures slightly favored in the Ohio River Valley and Rust Belt.
In Hawaii, cooler-than-normal temperatures are favored. Below-normal precipitation is likely on all islands except for the Big Island, where near-normal precipitation is favored. Warmer-than-normal weather is favored in Alaska, especially in the western reaches of the state. Wetter-than-normal weather is favored for central, northern and western Alaska, while drier-than-normal weather is favored in southeast Alaska.
US Drought Monitor one week change map ending March 12, 2024.
Westwide SNOTEL basin-filled map March 15, 2024 via the NRCS.
Chile forest fires: At least 112 dead in Valparaíso region | BBC News
Click the link to read the article on the NOAA website (John Bateman):
Last month continued the world’s record-warm streak, with February 2024 ranking as the planet’s warmest February on record — the ninth month in a row of record-warm months.
What’s more, February 2024 wrapped up both hemispheres’ warmest December-through-February period on record, according to scientists from NOAA’s National Centers for Environmental Information.
Below are highlights from NOAA’s latest monthly global climate report:
Climate by the numbers
February 2024 | Season (December 2023 – February 2024)
The February global land and ocean surface temperature was 2.52 degrees F (1.40 degrees C) above the 20th-century average of 53.8 degrees F (12.1 degrees C), ranking as the warmest February in NOAA’s 175-year global climate record.
Looking how continents ranked, Europe, North America and South America had their warmest February on record, while Africa had its second warmest.
The three-month season (December 2023–February 2024) was the Northern Hemisphere’s warmest meteorological winter and the Southern Hemisphere’s warmest meteorological summer on record, with a global surface temperature of 2.45 degrees F (1.36 degrees C) above the 20th-century average.
The year-to-date (January and February 2024) temperature currently ranks as the world’s warmest such period on record. There is a 45% chance that 2024 will be the warmest year in NOAA’s 175-year record and a 99% chance it will rank in the top five.
An annotated map of the world plotted with February 2024’s most significant climate events. See the story below as well as the report summary from NOAA NCEI at http://bit.ly/Global202402 offsite link. (Image credit: NOAA/NCEI)
Other notable climate events
Global sea ice coverage was sparse: Global sea ice extent (coverage) was the fourth smallest in the 46-year record, at 460,000 square miles below the 1991–2020 average. Arctic sea ice extent was slightly below average (by 100,000 square miles), whereas Antarctic sea ice extent was substantially below average (by 370,000 square miles), ranking second smallest on record.
Tropical activity was above average: Eleven named storms spun around the globe in February, which was above the 1991–2020 average of seven named storms. Only two storms made landfall, both bringing gusty winds to northern Australia. The only major tropical cyclone was Very Intense Tropical Cyclone Djoungou, which remained in the central Indian Ocean, well away from any major land masses. There were no active storms in the Pacific Ocean or the North Atlantic, but there was one weak tropical cyclone (Akara) in the South Atlantic, which is notable because atmospheric conditions usually inhibit tropical storm development in that basin.
South Platte River at Goodrich, Colorado, Sunday, November 15, 2020. Photo credit: Allen Best
From email from the Colorado Water Conservation Board (Katie Weeman):
March 13, 2024 (Denver, CO) – The Colorado Water Conservation Board (CWCB) approved 52 Water Plan Grant applications today, which will distribute $17.4 million to fund critical projects to manage and conserve water, improve agriculture, spark collaborative partnerships, and much more. This funding cycle, CWCB received a record 70 applications requesting $25.6 million—$8.2 million more than is currently available.
“Water is on the top of many Coloradans’ minds. And the projects this program funds are critical to meet and mitigate our state’s most critical water challenges,” said Lauren Ris, CWCB Director. “We received significantly more applications than we had funding for this cycle of Water Plan Grants, showing just how much demand there is for this important funding, and how critical it is that we continue to fuel this effort.”
Every year, the Water Plan Grant Program provides millions of dollars of funding for projects in five key categories: Water Storage & Supply, Conservation & Land Use, Engagement & Innovation, Agricultural Projects, and Watershed Health & Recreation. Water Plan Grants support the Colorado Water Plan, and funded projects are wide-ranging and impactful to the state, focusing on enhancing water infrastructure, restoring ecosystems, supporting education and community collaboration, boosting water conservation and efficiency, guiding resilient land use planning, and more.
During this fiscal year, the CWCB awarded 83 grants totaling $25.2 million. CWCB’s Water Plan Grants run on two application cycles: the December application deadline receives final Board approval during the March Board Meeting, and the July deadline receives votes in September. On March 13, 2024, the Board voted to approve December’s 34-project cohort.
This cycle’s project applications are diverse in scope and location. A few examples include:
South Platte River Basin Salinity Study (Agricultural, $464,361): Colorado State University will conduct a comprehensive study on salinization across seven regions in the South Platte River Basin, to understand the severity and variability of salinity in water and land resources.
Denver One Water Plan Implementation Phase 2 (Conservation & Land Use, $200,000): Mile High Flood District will continue Phase 2 of Denver’s One Water Plan, which promotes coordination and collaboration among various city departments, organizations, and agencies in charge of managing all aspects of the urban water cycle.
Watershed PenPal Program (Engagement & Innovation, $136,947): Roaring Fork Conservancy will connect communities across the Roaring Fork Valley and Front Range, fostering understanding of water challenges through discussion, letter writing, and shared experiences.
Park Creek Reservoir Expansion (Water Storage & Supply, $1,750,000): The North Poudre Irrigation Company will expand the Park Creek Reservoir, increasing water storage capacity by 3,010 acre-feet to benefit agricultural use and water management.
South Boulder Creek Watershed Restoration Phase 3 (Watershed Health & Recreation, $1,000,000): Colorado Trout Unlimited will build upon previous phases of this project to support final design and permitting for multiple in-stream diversion structures in South Boulder Creek in Boulder, Colorado.
Looking forward, the CWCB hopes to continue and advance the Water Plan Grant program for decades to come. Projects funded and supported through this program address water-related challenges by harnessing the latest research, tapping into community engagement, and developing innovative solutions that allow water partners, agencies, and Coloradans to work together.
Natural gas flares near a community in Colorado. Colorado health officials and some legislators agree that better monitoring is necessary. Photo credit the Environmental Defense Fund.
Click the link to access the article on the Nature website (Evan D. Sherwin, Jeffrey S. Rutherford, Zhan Zhang, Yuanlei Chen, Erin B. Wetherley, Petr V. Yakovlev, Elena S. F. Berman, Brian B. Jones, Daniel H. Cusworth, Andrew K. Thorpe, Alana K. Ayasse, Riley M. Duren, & Adam R. Brandt). Here’s an excerpt:
As airborne methane surveys of oil and gas systems continue to discover large emissions that are missing from official estimates, the true scope of methane emissions from energy production has yet to be quantified. We integrate approximately one million aerial site measurements into regional emissions inventories for six regions in the USA, comprising 52% of onshore oil and 29% of gas production over 15 aerial campaigns. We construct complete emissions distributions for each, employing empirically grounded simulations to estimate small emissions. Total estimated emissions range from 0.75% (95% confidence interval (CI) 0.65%, 0.84%) of covered natural gas production in a high-productivity, gas-rich region to 9.63% (95% CI 9.04%, 10.39%) in a rapidly expanding, oil-focused region. The six-region weighted average is 2.95% (95 % CI 2.79%, 3.14%), or roughly three times the national government inventory estimate. Only 0.05–1.66% of well sites contribute the majority (50–79%) of well site emissions in 11 out of 15 surveys. Ancillary midstream facilities, including pipelines, contribute 18–57% of estimated regional emissions, similarly concentrated in a small number of point sources. Together, the emissions quantified here represent an annual loss of roughly US$1 billion in commercial gas value and a US$9.3 billion annual social cost. Repeated, comprehensive, regional remote-sensing surveys offer a path to detect these low-frequency, high-consequence emissions for rapid mitigation, incorporation into official emissions inventories and a clear-eyed assessment of the most effective emission-finding technologies for a given region.
I really like the AI image above, created by a couple creatives at American Whitewater, Scott Harding and Kestrel Kunz. for a presentation at the Colorado River Water Users Association convention in January. It shows ‘the people who run the river’ running the river. But if you have ever been in that whitewater situation, you know that the river is really in charge; you run the river on the river’s terms. The guy standing up in the back of the boat is in charge of the boat, giving the others in the boat commands like ‘Five forward (strokes of the oars) on the right!’ ‘Two back on the left!’ ‘Everybody three forward!’ – trying to keep the boat on a ‘line’ he or she perceives through the rocks of the rapids. Thinking like the river to run the river.
We can draw some obvious analogies to Colorado River management – as Scott and Kestrel do in the picture above of the people in suits who ‘run the river.’ But the analogy breaks down quickly around the fact that they are all – we are all – in a boat without a boatman. Instead of all those who are running the river following directions from one person who is using his past experience to pick a line through the rocky places – ‘A 100,000 acre-feet to the Navajo!’ ‘Everybody cut 10 percent!’ – we are doing it through committees, groups, divisions, maybe some factions by James Madison’s classic definition (groups whose acts are ‘adverse to the rights of other citizens, or to the permanent and aggregate interests of the community’).
In this case we have the Lower Colorado River Basin on one side of the raft, the Upper Basin on the other side; they are each forming a perspective on the rocky places ahead and describing a line through them that requires issuing some advice or orders to those with oars on both sides of the boat about forward or backward actions, resulting mostly in quite a lot of noise, in which the intelligence from both sides gets rendered unintelligible….
There are various possible resolutions to such a situation. Some will say we have to have a boatman, one person to whom we will all listen and for whom we will all act obediently. On the real river, boatmen have to earn their right to be that person through experience. But on the metaphorical boat on the allegorical river, it is not always easy to select a boatman to get through the hard places because – what experience counts? What background is necessary and sufficient? What demonstrable skills? And there is always a loud narcissist in the boat who trumps the discourse by trumpeting that he or she is ‘the one, the only one that can get you through this’; those ‘strongmen’ appeal to many in the boat, when the better idea might be to just pull off the river before the hard place, unpack the lunch along with the situation, and work out a plan democratically before plunging in….
That is, in a sense, what is going on today in the Colorado River Region (natural basin plus out-of-basin extensions). Everyone knows that there are hard places as we all try to face up to some hard realities the river is imposing on us (at least partly because of hard things we have imposed on the river).
After a feel-good conference this January of the Colorado River Water Users Association, the seven basin states and representatives from the basin’s 30 First People nations sat down to work out a new set of ‘Interim Guidelines’ for an ‘interim’ beginning in 2027, to replace the tattered, battered and bandaged Interim Guidelines that the Colorado River waterworks have been working off of since 2007 with a ‘use by’ date of 2026.
The structural deficit refers to the consumption by Lower Basin states of more water than enters Lake Mead each year. The deficit, which includes losses from evaporation, is estimated at 1.2 million acre-feet a year. (Image: Central Arizona Project circa 2019)
That larger gathering hung together for several sessions; then, as I understand it, the three Lower Basin states withdrew to figure out how to handle a ‘structural deficit’ that is about one-fourth of their 8.5 million acre-feet (maf) allotment from the 1922 Colorado River Compact, which deficit they finally conceded was their responsibility – just their concession being a major step forward. The ‘other side of the boat,’ the Upper Basin states, began meeting on their own.
Now, just this week, the Basins have each submitted draft plans for post-2026 river management to the Bureau of Reclamation – the Upper Basin Tuesday March 4, and the Lower Basin Wednesday March 5.
I wanted to get something online this same week about this so my faithful readers would not think that I am asleep at the wheel or lost in river history, but there is no way to even obtain and read these plans, let alone try to make sense of them together, before my webmeister’s Friday deadline. So I’ll be back with you either next week or the week following with my two-bits on what’s going on.
Total losses (evaporation and riparian ET) from Reach 1 through Reach 5. Credit: USBR
But we can do a little backgrounding now. The ‘structural deficit’ the Lower Basin has finally conceded it must deal with is a substantial omission not covered in either the 1922 Compact nor in the subsequent elements of the Law of the River. It is, first, a compilation of all the ‘system losses’ from evaporation, bank storage, riparian vegetation, et cetera, from Mead Reservoir to the Mexico border – estimated by the Bureau of Reclamation to be around 1.3 million acre-feet (maf).
It also includes, second, up to 750,000 acre-feet that is the Lower Basin’s share of the Mexican obligation. Responsibility for these has been dismissed by the Lower Basin as being covered by ‘surplus flows’ – anything over the 7.5 maf the Upper Basin is committed to send through the canyons. For most of the 20th century this surplus was legitimate: water not yet being used by the Upper Basin and the Central Arizona Project, plus the occasional blessings of big water years. But for roughly the last quarter century that surplus has largely been a paper accounting; the ‘structural deficit’ that emerged was basically the Bureau drawing down storage in a time of drought to keep nurturing the ‘surplus’ fiction while praying for snow.
The 2007 Interim Guidelines were created to try to address this problem – but without really addressing it. The Guidelines were kind of a shell game, ‘balancing’ the contents of Mead and Powell reservoirs, with tipping points in the storage of both that would precipitate shortages being imposed on the Lower Basin states – but doing obeisance to California’s senior water rights by shorting the other two states first and most. And they continued releasing the substantial ‘structural deficit’ water to not force the Lower Basin states cut back on their own.
These ineffective guidelines led to the Bureau’s realization in 2022 – the centennial year of the Compact – that they might be two or three years from losing the storage in the big reservoirs entirely for much of the year, resulting in the quasi-panicky call to the seven states to cut consumption within a year by 2-4 maf.
I will not go through again all the plans and counter-plans that were proposed and analyzed to answer the Bureau’s call, but do want to call attention to the fact that the situation did revive a spate of ‘Caliphobia,’ when six of the Basin states prepared a plan for a proportionate sharing among the Lower Basin states of cuts that amounted to the structural deficit, but California would only participate if its substantial senior water rights were honored, with the other two states bearing the brunt of the cuts.
The Compact’s Signers. Photo via InkStain
This was – for me, at any rate – just more evidence of the extent to which the Colorado River Compact is a failed document. It was Caliphobia that had brought the seven states together in 1922 – California unenthusiastically – to create the Compact. All seven states had variations on the doctrine of prior appropriation as their foundational water law, and knew that the logic of the law meant they had to honor each other’s senior appropriations. But California was growing so fast, with claims on so much Colorado River water, that the other six states were concerned that there might not be enough water left for their own slower development.
Upper Basin States vs. Lower Basin circa 1925 via CSU Water Resources Archives
Their goal in coming together was to create a division of the river among the seven states that would override appropriation law at the interstate level, eliminating a seven-state appropriation horserace in which California was already lapping the field. California participated in the compact negotiations because Congress said there would be no money to build the big flood control and storage structures California desperately wanted until the seven states were in agreement on how the river’s water would be apportioned.
They were, however, unable to do the seven-state division they needed. They each came from their own state with estimates of their future needs that, in total, added up to half-again more water than even the 18 maf pluvial river carried in that first quarter of the 20th century. They were operating on dreams, not data, and after a couple days of critiquing each other’s numbers and defending their own, that gave up on the seven-state division.
The best they were able to do, in their November ten-day eleventh-hour do-or-die charrette was the two-basin division that gave the four states above the canyons some protection against California growth, but left the other two states below the canyons in the cage, as it were, with the thousand-pound gorilla, California. The Compact goal of ‘promoting interstate comity’ failed when Arizona refused to even ratify the Compact. And as average flows declined from the 1930s on, the Upper Basin’s Compact charge to ‘not cause the flow of the river at Lee Ferry to be depleted below’ the Lower Basin’s apportionment began to make the Upper Basin states feel more like juniors shorted to fulfill a senior water right than participants in an ‘equitable apportionment.’
“New plot using the nClimGrid data, which is a better source than PRISM for long-term trends. Of course, the combined reservoir contents increase from last year, but the increase is less than 2011 and looks puny compared to the ‘hole’ in the reservoirs. The blue Loess lines subtly change. Last year those lines ended pointing downwards. This year they end flat-ish. 2023 temps were still above the 20th century average, although close. Another interesting aspect is that the 20C Mean and 21C Mean lines on the individual plots really don’t change much. Finally, the 2023 Natural Flows are almost exactly equal to 2019. (17.678 maf vs 17.672 maf). For all the hoopla about how this was record-setting year, the fact is that this year was significantly less than 2011 (20.159 maf) and no different than 2019” — Brad Udall
Add in the failure to even mention the basin’s substantial system losses, and the Compact and subsequent Law of the River have not done much to ‘remove causes of present and future controversies,’ culminating in the situation we are in now, with California playing the seniority card on the other states, the Upper Basin and Lower Basin having different ideas about what it actually means to ‘not cause the flow of the river at Lee Ferry to be depleted below’ an average of 7.5 maf/year, and no one really wanting to face the fact that the Compact was written for a river half-again larger than the river we have now – with a modest but steady decline in this river as we continue to warm the world around it. We are going to have to impose, and accept, significant shortages that will have impacts on all of us, on the way we eat nationwide and how much we pay, as well as how we use water everywhere in the region.
What is truly ‘equitable’ when it comes to administering shortages? Or cutting right to the chase – to what extent should the appropriation doctrine dominate the discourse? Is ‘first-come-first-served’ to be the only measure for ‘equitable allocation’?
To put the question another way: could we acknowledge a distinction between water-use issues and all-river issues? Water-use issues can occur between agricultural users, and between agricultural and urban areas, and between urban areas. We have decided culturally to resolve those kinds of issues through the first-come-first-served laws, and whether that is the best way to resolve issues over water use or not, it is the way we do it. (Although it should be noted that, among multi-generation neighbors, with century-old water rights differing by a year or two, seniors seldom place ‘calls’ on their junior neighbors; they work out ‘gentlemen’s agreements’ to share the available water. Appropriation law can be brutal when strictly enforced.)
But all-river issues are matters above and beyond questions of prioritizing water use. Discovering that we are dealing with a river that is only two-thirds the size of the river the Compact was created for is an all-river issue. Trying to figure out how to do long-delayed water justice for 30 First People nations of varying sizes (with two-thirds of them in one state) on a fully appropriated river is an all-river issue. Managing for the unknown but unfolding consequences of a changing, warming climate is an all-river issue.
All-river issues are everyone’s problems, created and perpetrated by everyone, whether consciously or unconsciously; and in a just world everyone would share the pain of resolution in some equitable and proportionate way. With an all-river issue, ‘seniority’ just means the water user has been part of the problem, consciously or unconsciously, for a longer time.
I have some thoughts about how we could deal with some of our all-river issues, which I will no doubt unload on you over the next several posts, but I hope that if you have thoughts on it, you will unload them on me in comments below.
And I also hope some of the people actually at the table(s) are also trying to think beyond the limitations of the Compact and of the foundational law of the river, the prior appropriation doctrine that the Compact wanted to address but couldn’t. Like Becky Mitchell, Colorado’s main negotiator, said, ‘We must plan for the river we have, not the river we dream of.’
Colorado River “Beginnings”. Photo: Brent Gardner-Smith/Aspen Journalism
A motorboat on Yellowstone Lake. (NPS/Diane Renkin)
Click the link to read the article on the WyoFile website (Angus M. Thuermer Jr.):
March 12, 2024
To protect the headwaters of three major Western rivers from invasive, troublesome mussels, Yellowstone National Park wants to require larger boats to undergo a 30-day “dry time” before launching.
New rules up for comment also would ban any boat that’s once been contaminated by invasive Dreissena zebra or quagga mussels, regardless of decontamination cleaning.
The proposal builds on existing rules, including inspection of all watercraft, designed to protect Yellowstone and downstream waters from the fingernail-sized freshwater bivalves that cling to hard structures like boat hulls, docks and irrigation headgates. The proposal would help protect the ecological integrity of Yellowstone Park and the Yellowstone, Missouri and Snake rivers downstream in Idaho, Montana and Wyoming.
Map of the Snake River watershed, USA. Intended to replace older File:SnakeRiverNicerMap.jpg. Created using public domain USGS National Map data. By Shannon1 – Own work, CC BY-SA 4.0, https://commons.wikimedia.org/w/index.php?curid=62294242
Under the proposed rules, boats with inboard, inboard/outboard and inboard jet motors — as well as sailboats — would have to be dried under a certified program for 30 days before launch. “Large, complex, trailered watercraft pose the highest risk of transporting and introducing invasive mussels … because they are difficult to inspect and less likely to … be fully decontaminated,” the park said in a release.
Manual cleaning is not 100% effective, the park said.
Mussels were recently discovered in waters within a day’s drive of Yellowstone, including the first found in the Columbia/Snake drainage last year near Twin Falls, Idaho. The year before, mussels showed up in Pactola Reservoir, South Dakota, not far from Wyoming’s eastern state line.
People can comment online through April 5 or to Yellowstone Center for Resources, Attn: AIS Proposed Changes, PO Box 168, Yellowstone National Park, WY 82190.
Spreading threat
The zebra mussel is native to the Black, Caspian, and Azov Seas and the quagga also comes from that area of Europe. They have infected the Midwest and lower Colorado River drainage.
Zebra Mussels in Lake Ontario. (John Manier/USGS)
They could threaten Yellowstone cutthroat trout, a species the park has spent more than two decades restoring. The mussels can also be destructive to water and power infrastructure, according to the U.S. Department of Interior. There are no known ways to eradicate the mussels. Any invasion would be expensive to mitigate.
Motor- and sailboats falling under the new rule would be inspected and sealed to a trailer for the 30-day dry period. Seals from Yellowstone National Park, Idaho State Department of Agriculture, Montana Fish, Wildlife, and Parks and Wyoming Game & Fish Department would be honored.
Once-infected boats would be banned because of the possibility they could, even if cleaned, cause a false detection during routine DNA monitoring and consequently waste resources.
Exhibit One of the consequences of Utah lawmakers nixing the Bears Ears National Monument land exchange: A company is proposing to build a 460-foot telecommunications tower, complete with two sets of blinking red lights, on state trust land just outside Natural Bridges National Monument in the heart of Bears Ears.
Last month, the San Juan County Planning Commission voted 3-2 to approve a conditional use permit for the tower. The county commission is expected to consider whether to grant the developer a variance, since the maximum structure height for the parcel is 35 feet. The Utah Trust Land Administration and Federal Communications Commission would also need to grant permission prior to construction.
Neither the Bureau of Land Management (which manages Bears Ears NM) nor the National Park Service (which manages Natural Bridges NM) have much say in the matter, because the tower is on state land that would have been included in the swap — if it had occurred. And yet, the ginormous tower (460 feet is really big) would be visible throughout much of both national monuments.
Presumably the tower will extend telecommunication signal to the vast cell phone dead zone that, in my experience, begins around Salvation Knoll and stretches westward to the Henry Mountains. It would have obvious public safety implications by allowing folks to call for help if they happen to venture out on an “Impassible When Wet” road just as an April slush storm is rolling in and end up in a ditch — or worse.
I must admit, there have been times when I’ve been out there that I would have liked to have cell signal so I could let my family know I was alive. Or when access to a current weather forecast may have led me to make better decisions (yeah, right!). Or when being able to work online would have allowed me to stay out in the canyons for a few more precious days. This tower would make all of that possible, I guess.
But is it really worth it? The site of the proposed tower and its red lights is one of the nation’s few remaining dark sky regions, where light pollution has yet to dim out the stars and the night. Similarly it’s one of the only refuges from the otherwise omnipresent social media, text messages, emails, and ringing phones — a digitally dark area, if you will. The tower will disrupt both.
(Thanks to the folks at SUWA for alerting me to this issue).
Reminder
I should have put this link in Tuesday’s dispatch, but spaced it. Anyway, it’s just a reminder that mineral withdrawals for national monuments or other purposes don’t affect existing valid mining claims. Valid ≠ Active. In order for a claim to be valid, the claimant must demonstrate the presence of a valuable mineral deposit there. It’s a small distinction, but an important one. In the end, however, the point remains: a national monument designation would not block existing mining operations or potential operations on valid claims.
🎥 What We’re Watching 🎞️
You gotta check out this video that reader Robert Dundas alerted us to (and that was posted to Vimeo by Rig to Flip). It’s footage from southwest river-running pioneer Otis “Doc” Marston’s May 1948 run down the lower Dolores River with his wife Margaret, friends Becky and Preston Walker, and Ditty the dog. It’s fascinating, even though it lacks audio or narration (it helps to put on your own background music).
Ottis Marston – Dolores Footage. No Audio. Huntington Library, Marston Collection. Filmed in 1948.
It’s a bit long, too, but do watch it all the way through, because a lot of the best stuff is near the end, when they deal with some very big water — i.e. about 11,000 cubic feet per second. If the footage is too slow moving, just put the video on double-speed, which puts it almost on pace with our frenetic modern society. The scenery is, of course, fantastic. And the river-running gear and attire is really something to behold, as is Preston Walker’s method of guiding “Doc” through the rapids by standing on the bow, shirtless and life-preserver-less, pointing the way with a lit cigarette as if it were a conductor’s baton.
Most of the places in the video haven’t changed that much, aside from Marston’s launch point, which is now under McPhee Reservoir. Oh, and the Dewey Bridge, near where they take out, hadn’t burned (it looks shiny and new). There’s some cool shots of the hanging flume, in a more-intact-than-now state.
I was a bit baffled when, about four minutes into the video, I spied a Spanish colonial style church in or near what appears to be the Castle Valley east of Moab. I mean, it ain’t no LDS stake house, that’s for sure. But a closer examination revealed it was part of a movie set. It took a bit of searching and old-Western trailer viewing, but I’m pretty sure that the church was from John Ford’s Rio Grande, starring a youthful John Wayne and Maureen O’Hara. The church shows up at about 1:15 in this trailer:
Rio Grande (B&W). In this John Ford classic, John Wayne and Maureen O’Hara are embroiled in an epic battle with the Apaches and each other. Lt. Col. Yorke (John Wayne) leads his cavalry troops to the Rio Grande to fight a warring tribe. Yorke’s toughest battle lies ahead when his unorthodox plan to outwit the elusive Apaches leads to possible court-martial. Locked in a bloody war, he must fight not only to save his family, but also to redeem his honor.
🥵 Aridification Watch 🐫
I was looking forward to today, the first day of meteorological spring, because I could finally deliver the good news about the big improvements to the snowpack during February. And things are looking up! Albeit maybe not as much as we’d expect, given the huge dumps some places have received in the last month.
To sum things up, the snowpack across much of the West is right around average. Not great, not anything like 2023, but also far better in most places than this time of year in 2021. Let’s just jump into the graphs:
The snowpack for the San Juan Mountains of southwestern Colorado is at about 91% of the median. Winter started slow, there were some huge dumps in early February, and then things slowed down a bit. Big San Juaners are possible and even likely in March and April, so there’s still plenty of time for snow levels to jump above normal. Source: National Water and Climate Center.
Zooming out to the Upper Colorado Basin as a whole and you get a slightly brighter picture — and a better outlook for Lake Powell’s levels this summer. The early February storms brought levels up to normal and they’ve continued to come.
This one’s a bit bizarre to me, because California (this is in the Sierra Nevada near Lake Tahoe) has had a few pretty good storms this year. But they haven’t delivered the goods to the mountains. At least not yet. As I write this an atmospheric river is bearing down on California and is expected to bring up to 12 feet of snow to the mountains.
This is more like it! This station is up near Mt. Charleston west of Las Vegas. It appears to be a bit of a sweet spot as far as this year’s snowfall goes.
February was warmer and much wetter than normal across the majority of the region. Snowpack conditions improved and are above normal in Utah (119%), near-normal in Colorado (97%), and slightly-below normal in Wyoming (88%). Seasonal streamflow volume forecasts are below normal to near-normal for the majority of the region, except for northern Utah in the Great Salt Lake region where forecasts are above normal. Regional drought coverage slightly improved and now covers 13% of the region. There is a 70% chance of ENSO-neutral conditions starting in April-June. The NOAA precipitation outlook for the region in March suggests an increased probability of above normal precipitation.
February precipitation was above to much-above normal for the majority of the region, with pockets of below normal conditions on the West Slope of Colorado, southern Utah, and northeastern Wyoming. Areas of 200% or more of normal precipitation occurred throughout the majority of the Front Range, eastern and northwestern Colorado, western Wyoming, and northern Utah in the Great Salt Lake region with pockets scattered throughout the state. Areas of 400% or more of normal precipitation occurred in El Paso and Pueblo Counties in Colorado, Box Elder and Tooele Counties in Utah, and Sweetwater County in Wyoming. Record-wet conditions occurred in each state, with particularly large record-wet areas in Larimer, Weld, and Pueblo Counties in Colorado, and Box Elder County in Utah.
Regional temperatures were slightly-above to above normal in February. The majority of the region experienced 0-3°F or 3-6°F above normal temperatures with large areas of 6-9°F above normal temperatures in northeastern Colorado and northeastern Wyoming. Pockets of 6-9°F above normal temperatures occurred in southeastern and northwestern Colorado, northeastern and northwestern Utah, and southeastern and western Wyoming. Temperature percentile rankings for February were above normal (top 33%) to much-above normal (top 10%) throughout almost the entirety of the region.
Regional snowpack ranged from below normal conditions in northern Wyoming to above normal conditions in Utah with near-normal conditions prevalent in southern Wyoming, southern Utah, and most of Colorado. As of March 1st, statewide percent median snow-water equivalent (SWE) was 97% in Colorado, 119% in Utah, and 88% in Wyoming. The Belle Fourche Basin in Wyoming had the lowest percent median SWE (57%) and the Lower San Juan Basin in Utah and Colorado had the highest percent median SWE (128%) by the end of the day on February 29th.
Regional April-July streamflow volume forecasts are mostly below normal (70-90%) to near-normal (90-110%), with much-below normal (<50-70%) forecasts for the Escalante Desert-Sevier Lake River Basin in Utah and the Cheyenne River Basin in Wyoming. However, there are above normal (110-130%) streamflow forecasts for basins surrounding the Great Salt Lake, including the Great Salt Lake, Lower Bear, Jordan, and Weber River Basins. In most locations, forecasted streamflow volume increased compared to the February 1st forecast. The forecast for the inflow to Lake Powell is 78% of average, up 4% from the February 1st forecast and up 12% from the January 1st forecast.
Regional drought conditions improved in February and now cover 13% of the region, a 5% decrease in drought coverage since the end of January. Severe (D2) drought developed in north-central and northeastern Wyoming while extreme (D3) drought improved in south-central Colorado and moderate (D1) drought improved in southwestern Colorado and southeastern Utah.
El Niño conditions continued during February and there is an 80% chance of these conditions continuing during March. However, there is a 70% chance of El Niño conditions transitioning to ENSO-neutral conditions during April-June. The NOAA precipitation outlook for March suggests an increased probability of above normal precipitation for the entire region with likely above normal precipitation (50-60% chance) throughout most of Colorado, Utah, and southern Wyoming. The NOAA temperature outlook for March suggests an increased probability of above normal temperatures in northeastern Wyoming and below normal temperatures throughout the majority of Utah, particularly in the southwest. The NOAA seasonal temperature outlook for March-May suggests an increased probability of above normal temperatures throughout the northern, central, and western regions of Wyoming and the northern and western regions of Utah.
February significant weather event: Record-wet snowstorm in the Front Range. From February 2-3, the Front Range experienced an intense 18-hour precipitation deluge, with some areas receiving over 2 inches of liquid equivalent (rain and melted snow water), surpassing the total precipitation of the previous two months. A southern-track low-pressure system originating in southeastern Colorado was responsible for this substantial moisture. The storm brought heavy upslope precipitation—rain and heavy snow—to northern Colorado. Boulder received a record-breaking 1.74 inches of precipitation, making it the all-time wettest February storm since recordkeeping began in 1897 and surpassing the previous record of 1.41 inches from February 3-4, 2012. Boulder received 9.1 inches of snow, Denver received 5.5 inches, and the lower foothills received a maximum of 20.3 inches. The storm’s unique characteristics, including the lack of a cold air mass and the presence of a large-scale low-pressure system that pulled in moisture and warmth from a Pacific Ocean atmospheric river and from the Gulf of Mexico, made the storm one of rain instead of snow to start. The warmer air caused snowflakes falling from a sub-freezing cloud layer to melt and turn to rain before they hit the ground, which eventually cooled the air to the point of freezing, finally allowing for snowfall and accumulation. These factors and many more created significant forecasting uncertainty as to how much snow, or precipitation in general, would fall across northern Colorado. Weather models were highly volatile days in advance to hours before the storm due to the many different atmospheric variables in this storm’s setup. This weather event highlights the evolving nature of warmer winter storms in a warming climate.
The Rifle City Council listened to a funding request from a Colorado River District representative during their Wednesday regular session.
“We are asking that the City of Rifle consider a funding request for $100,000,” Amy Moyer said, Director of Strategic Partnerships for the Colorado River District…
The City Council authorized staff to sign a letter committing $100,000 to the purchase of the Shoshone Water Rights. This would be in the budget for 2025.
“I just want everyone to realize how historic this Shoshone Water Rights Purchase is and how it can totally save the western slope in case something ever happened to Xcel or that power plant. So I’m glad they came in and I’m glad we’re partnering with them,” Councilor Clint Hostettler said in their closing comments for the meeting.
“New plot using the nClimGrid data, which is a better source than PRISM for long-term trends. Of course, the combined reservoir contents increase from last year, but the increase is less than 2011 and looks puny compared to the ‘hole’ in the reservoirs. The blue Loess lines subtly change. Last year those lines ended pointing downwards. This year they end flat-ish. 2023 temps were still above the 20th century average, although close. Another interesting aspect is that the 20C Mean and 21C Mean lines on the individual plots really don’t change much. Finally, the 2023 Natural Flows are almost exactly equal to 2019. (17.678 maf vs 17.672 maf). For all the hoopla about how this was record-setting year, the fact is that this year was significantly less than 2011 (20.159 maf) and no different than 2019” — Brad Udall
Click the link to read the article on the Colorado Politics website (Marianne Goodland). Here’s an excerpt:
The U.S. Bureau of Reclamation set a deadline of Monday for the seven states to come up with plans, but a hoped-for joint plan was not in the cards. By the end of 2024, the Bureau of Reclamation anticipates having what’s called a draft “environmental impact statement” that will present alternatives for how the Colorado River will operate in the decades to come. Those new guidelines will also determine the management and facilities of the two reservoirs, as well the Hoover and Glen Canyon dams…
Upper Basin plan
The plan submitted by the Upper Basin states calls for the following:
• A commitment from the Upper Basin states to help preserve the ability to make releases from Lake Powell, the nation’s second-largest reservoir that provides power through the Glen Canyon dam
• For Lake Powell: Modeled releases from Lake Powell that are based on hydrologic conditions and designed to rebuild storage to protect Lake Powell’s ability to make releases consistent with the Law of the River, as dictated by the 1922 Colorado River compact
• Lake Mead: Modeled Lower Basin operations adapted from a concept first provided by the Lower Basin States based on the combined storage of Lake Powell and Lake Mead…
The Lower Basin plan
Tom Buschatzke, the director of the Arizona Department of Water Resources and the state’s principal negotiator on matters relating to the Colorado River, said while he has not yet fully examined the upper division states’ alternative plan, he told Colorado Politics he is disappointed by what he’s seen so far.
• Addresses the structural deficit in the Lower Basin
• Operates the reservoirs based on system contents, rather than elevations at Lake Powell and Lake Mead
• Shared water use reductions broadly
• Creates provisions for the storage and delivery of stored water
• Releases from Lake Powell that are adaptable to a broad range of hydrology and “hydrologic shortages”
The alternative dictates cuts calculated by state — every state, not just those in the Lower Basin — depending on how much the levels drop at Lake Mead.
The Crystal River flows past a stream gauge at the fish hatchery just south of Carbondale. This location has nearly dried up in late summer in recent years due to drought, climate change and senior water users’ upstream diversions. CREDIT: HEATHER SACKETT/ASPEN JOURNALISM
In 2012, one of the driest years in Colorado in recent memory, the Crystal River practically dried up.
Ken Neubecker, a now-retired Colorado projects director at environmental group American Rivers and former member of the Pitkin County Healthy Rivers board, recalls the stream conditions.
“I took a photo on the Thompson Road bridge, and it was running about 1 cubic foot per second, if that,” he said. “It was mostly dry rocks with some puddles in between.” (One cfs, which is equivalent to the amount of water to fill one basketball, is a common way to measure the flow of water.)
These extremely low-water conditions returned in the drought years of 2018, 2020 and 2021, with river flows near the fish hatchery just south of Carbondale hovering around 8 to 10 cfs — not enough to support aquatic life and nowhere near the 100 cfs that the state of Colorado says is the minimum needed to maintain a healthy stream.
Beginning high in the Elk Mountains, the Crystal River flows 40 miles through a canyon under the flanks of Mount Sopris and winds past the towns of Marble, Redstone and Carbondale before joining with the Roaring Fork River, a major tributary to the Colorado River. Along the way, its waters turn mesa hayfields, acres of alfalfa, and town parks and lawns a verdant green.
A historic drought driven by climate change and temperatures that creep ever higher are partly to blame. But the factors that lead to a dry river bed are many and include unique geology, ill-defined legal concepts, misunderstandings about the value of water, inefficient irrigation systems and vague state guidelines regarding waste that seem to be enforced only under specific circumstances.
These barriers to conservation are widespread across western Colorado. The Crystal River is one place where these complex issues converge, resulting in a chronic dry-up of stream sections in late summer most years. To Neubecker, the cause is water users taking more than they need and not leaving enough for downstream users — especially when the “user” is the river ecosystem itself.
“It just dries up a stretch of river and disconnects the upper part of the river from the lower part,” he said. “You have to be a good neighbor, and that concept has been totally thrown by the wayside.”
The Crystal is not unique. Rivers throughout the West face increasing pressure from chronic overuse, warming temperatures and prolonged dry spells. Persistent dry-ups that span weeks or months are a familiar feature of many so-called “working rivers” that supply water to the West’s sprawling farmlands and growing cities.
As scarcity has gripped the states that make up the headwaters of the Colorado River, a new level of scrutiny has fallen on water uses once considered insignificant, even small hayfields or grassy front yards. Communities throughout the West are now under pressure to justify their use of any amount, and make a case for continuing to do things the way they’ve always been done.
To better understand these issues plaguing the Crystal, Aspen Journalism examined the river’s biggest users to create the most complete picture possible of how water is used, why dry conditions persist and what can be done about it. We created a detailed analysis using publicly available information; state-of-the-art, satellite-based measurements; interviews with experts; and, where possible, site visits and ditch tours.
Understanding exactly how the West’s water is used — and perhaps where opportunities for efficiency improvements exist — will only become more crucial in a hotter, drier future with increasing scarcity across the Colorado River basin.
Crystal River Ditches. Credit: Laurine Lassalle/Aspen Journalism
Low ditch efficiencies
According to Aspen Journalism’s analysis, some of the Crystal’s biggest diverters have very low ditch efficiencies, meaning that the crops they grow are using just a small fraction of what they take from the river.
The low efficiencies pose the question: Does the small amount of water that is actually used by the crops justify the large amounts diverted from the Crystal, to the detriment of its ecosystem?
Of the 42 active ditches on the Crystal according to the Colorado Division of Water Resources (DWR) database, Aspen Journalism examined the top eight: those with the biggest and oldest water rights, the majority of which date to the 1880s. The analysis compared how much they were taking out of the stream based on diversion records maintained by DWR and how much water was absorbed by crops. Known as evapotranspiration, this is tracked by satellites through a publicly available platform called OpenET. Evapotranspiration is a measure of the amount of water used by crops, also called consumptive use.
Aspen Journalism’s analysis shows that Crystal River ditches that irrigate primarily agricultural land — the East Mesa, Lowline and Ella — have an average efficiency of between about 12% and 14%. That means the crops that are irrigated by these ditches use 12% to 14% of the water the ditch diverts. An outlier is the Sweet Jessup Canal, which irrigates Crystal River Ranch and whose crops use nearly 30% of the water it diverts, according to our analysis. Much of this ditch is lined or piped, making it more efficient.
For ditches that are used primarily for outdoor watering of residential lawns, gardens, ballfields and parks — ditches such as the Carbondale Ditch, the Weaver & Leonhardy, Bowles & Holland, and the Rockford, the latter of which also irrigates some agricultural land — our analysis showed lower efficiencies, ranging from less than 1% to about 9%. However, that analysis likely represents an undercount of the amount of water consumed on smaller parcels.
OpenET is becoming a widely used tool by water managers, including by the Upper Colorado River Commission, to calculate the water savings on individual fields that participate in its 2023 and 2024 System Conservation Program. Still, this technology has limitations. For example, the satellites work best on parcels that are at least .22 acres, so consumptive use tied to many residential lawns and gardens that are irrigated with water from these ditches is probably not included in these calculations. There is also no way to account for the amount of water a crop uses that comes from precipitation. Including that figure would result in lower ditch-efficiency percentages. For a complete explanation of how Aspen Journalism got these numbers, including all the caveats and limitations of the data, see our methodology breakdown.
The two ditches owned and operated by the town of Carbondale — the Carbondale Ditch and the Weaver Ditch — appear to be using a particularly small percentage of the overall water they take from the river. These ditches weave through the front yards, parks and alleyways of Carbondale, contributing to the charming, small-town feel and adding a riparian ribbon of green to an arid landscape. In general, these ditches that are used by residents to water their lawns and gardens have less-consumptive use than ditches that are all or nearly all agricultural use. However, since the OpenET does not pick up small lawns and gardens, it’s hard to know exactly how much water is being consumed from these ditches.
Kevin Schorzman, public works director for the town of Carbondale, said the town does not track ditch efficiencies, consumptive use or the number of homes that use ditch water for their lawns. He said the town has undertaken several projects over the past few years that should lead to improved efficiency in the ditch system, including lining portions of the Carbondale and Weaver ditches with concrete as well as piping sections of both ditches.
Officials have pointed to a river restoration project, which includes headgate modernization and automation on the Weaver Ditch as having benefits for the environment. But Schorzman said the project may or may not impact diversions from the river.
Colorado Division of Water Resources Division 5 and District 38. Credit: Laurine Lassalle/Aspen Journalism
Inefficiencies widespread
James Heath, DWR engineer for Division 5, agreed that Aspen Journalism’s ditch-efficiency numbers, while low, looked pretty reasonable. Additionally, a 2015 consumptive-use analysis of the Colorado River basin by Wilson Water Group put the overall system efficiency for the area that includes the Crystal’s watershed at 10%, which is in line with Aspen Journalism’s findings.
Very low ditch efficiencies seem to be common throughout Division 5, which contains the headwaters of the Colorado River. The 2015 Wilson Water Group study showed efficiencies in sub-basins ranged from 10% to 31%. Two other mountainous headwaters — the Blue River and Eagle River basins — had efficiencies of 14% and 16%, respectively.
Eric Kuhn, a Colorado River expert, author and former general manager of the Glenwood Springs-based Colorado River Water Conservation District, said the Crystal’s ditch efficiencies are in line with other places in western Colorado. He said irrigators in some basins are diverting 10 to 12 acre-feet for every acre-foot that their crops end up using.
“Those are the numbers we kind of got used to when people looked into them in detail,” Kuhn said.
It is common knowledge that ditches must take more water than only what is needed by crops, as pointed out by Joe White, director of finance at Colorado Rocky Mountain School. The private boarding school is the largest shareholder on the Rockford Ditch, which diverts from the Crystal.
“I don’t think that should surprise anyone,” White said. “Diversions are never going to equal consumptive use. Everyone knows it takes more diversion than consumptive use to deliver water to where it needs to be applied.”
White said Aspen Journalism’s numbers sound too low, but he did not provide his own consumptive-use numbers for the Rockford Ditch. White added that the Rockford needs to be kept full so that the lawn-watering irrigation pumps in the nearby neighborhood of Satank function properly.
“It’s challenging to regulate it as efficiently as we would like to,” he said.
Because the Crystal is not the only overtaxed stream in Colorado dealing with these issues, cities across the state are attempting to deal with water scarcity. That can be through strict conservation measures and, in particular, wringing water from nonfunctional, ornamental grass by banning its planting and incentivizing its removal.
But so far, widespread mandatory conservation measures — cracking down on waste and implementing efficiency standards — have not been aimed at agriculture, which is by far the biggest water-use sector and potentially has some of the lowest-hanging fruit to find water savings through irrigation improvements.
This parcel of land on Prince Creek Road is owned by Bailey Family Investment Company and is watered with Crystal River water via the Ella Ditch. The sprinkler gun system was installed in recent years. CREDIT: HEATHER SACKETT/ASPEN JOURNALISM
Reasons for low efficiencies
There could be several reasons why ditch efficiencies on the Crystal are low. The most basic is that flood irrigation is less efficient than sprinklers. About 58% of agricultural lands on the top eight ditches are flood irrigated, according to data from the state DWR. Many ditches were also built in the late 19th century and are not lined or piped, meaning that some of the diverted water is lost to leakage.
Some of the diverted water is lost to thin, rocky soils that water percolates through quickly. Irrigators often need to divert extra water, known as “push water,” to ensure that there’s enough pressure to get the water all the way to land at the end of the ditch, which is sometimes miles from the point of diversion. These transit losses are not considered part of consumptive use and are not measured by OpenET.
There is some evidence that soils in the area are especially rocky — the Crystal River was originally named Rock Creek — which may be contributing to low efficiency, allowing water to seep through the bottom and sides of ditches before reaching a farm field.
Heath, the division engineer, also found evidence of this from drill logs for water wells in the area.
“They are running into some pretty coarse materials at shallow depths that would cause a lot more ditch loss, a lot more deep percolation, which would increase the losses and cause the overall system efficiencies to go down,” Heath said. “So, I think it’s pretty reasonable, the numbers you’re coming up with.”
Much of the diverted water that the crops don’t use eventually seeps back to the river over days, weeks or months, a phenomenon known as “return flows.” If the Crystal River Valley’s geology really is as porous as evidence suggests, return flows probably make it back to the river quickly, without much being stored for late-season returns.
The problem with return flows is that they do not go back into the river at the same spot they are taken out and have a delayed return, contributing to seasonal dry-ups. And after percolating through the soil, return flows can be warm and laden with salt and other contaminants, impacting the river’s overall quality and the fish that depend on cold, clean water.
The Weaver Ditch, maintained by the Town of Carbondale, runs through downtown, turning parks and lawns green. A headgate modernization project may not result in less water diverted from the river, according to town officials. CREDIT: HEATHER SACKETT/ASPEN JOURNALISM
Is water being wasted?
Carbondale’s Schorzman said the town is adhering to state guidelines on waste and operating the ditch systems in a manner that is reasonably efficient. But pinpointing who might be wasting water in Colorado is difficult.
According to state guidelines on waste from 2017, which recently retired Colorado state engineer Kevin Rein said are still in effect, “a person shall not run through his or her ditch any greater quantity of water than is absolutely necessary for irrigation, domestic, and stock purposes to prevent the wasting and useless discharge and running away of water.”
The guidelines define waste as “diverting water when not needed for beneficial use, or running more water than is reasonably needed for application to beneficial use.” Beneficial use is defined as “the use of that amount of water that is reasonable and appropriate under reasonably efficient practices to accomplish without waste the purpose for which the appropriation is lawfully made.”
But “reasonably efficient” is not clearly defined. And how much more water ditches should take than what’s needed by crops is also unclear. Determining whether an irrigation practice is reasonable or wasteful is subjective.
Much like the famous Supreme Court test for obscenity, Rein said water commissioners have a good idea of what waste is when they see it. DWR has not done an efficiency analysis on the Crystal ditches, and Rein said he cannot identify a threshold for “reasonable” because every system is different.
“I don’t know whether it was intentional or not, but it’s important to our administration that it allows for judgment and for evaluation of myriad factors,” Rein said, referring to the subjective nature of the criteria.
The Rockford Ditch has the oldest water rights on the Crystal River. It irrigates some agricultural land as well as the lawns and gardens of the Colorado Rocky Mountain School and the Satank neighborhood of Carbondale. CREDIT: HEATHER SACKETT/ASPEN JOURNALISM
Divert it or lose it?
Another potential explanation for the low use numbers could be that some irrigators are overdiverting based on a misunderstanding of Colorado water law. The true value of a water right is tied to its historical consumptive use, which is how much water the crops use. However, there is an entrenched, incorrect belief that by maximizing the amount of water taken from a stream, one can increase the future value of a water right or protect it from abandonment. Many interpret Colorado’s famous “use it or lose it” doctrine as “divert it or lose it.”
“The reality of that is sometimes it can feel like you have something on paper and giving up something you have on paper feels like you’re losing something,” said Assistant Pitkin County Attorney Laura Makar.
According to a 2016 special report by DWR officials and experts at the Colorado Water Center at Colorado State University, “use it or lose it” is commonly seen as a barrier to implementing water-conservation measures and efficiency improvements.
Users are told to divert their whole amount, “in order to preserve the water right; that is, protect it from abandonment and/or lead to the maximum value of the water right in a water right change proceeding,” the report reads. “This conclusion is based on a misapplication of the law.”
In reality, there are two requirements for abandonment: A water right must sit dormant and unused for 10 years, and the owner must intend to abandon it. For the past 20 years, DWR has had a policy of not placing water rights that date to before the 1922 Colorado River Compact on the abandonment list, which is compiled every 10 years. This means pre-compact water rights (like many of those in the Crystal analysis) have an additional layer of protection from abandonment, even if they meet the two requirements.
Neubecker said taking more water than you can use violates one of the most sacred concepts at the heart of Colorado water law: the duty of water. The duty of water is the amount needed to grow a crop — not the maximum allowed by a decree — and varies depending on crop type and location.
“Technically, it is against the law to take more water than you actually need regardless of what your decree says,” Neubecker said. “It’s just that neither the lawyers nor the state engineer’s office are going to enforce it.”
The Bowles & Holland Ditch, named after two of Carbondale’s earliest white European settlers, used to grow crops like potatoes. Now it mostly irrigates the lawns and golf course of River Valley Ranch. CREDIT: HEATHER SACKETT/ASPEN JOURNALISM
Low efficiencies not a problem for state officials
DWR officials don’t have a problem with inefficient ditches as long as irrigators are not wasting water. Rein said that low efficiency doesn’t mean irrigation is being done improperly.
“I’m not aware that we have evidence of waste occurring on those systems,” Rein said.
There was, however, at least one documented instance of alleged water waste that occurred on the Crystal in recent years. In 2018, former water Commissioner Jake DeWolfe restricted how much water was flowing into the Lowine Ditch for taking more than it could put to beneficial use. Attorneys for one ditch user, Tom Bailey, complained in a letter to DWR, saying that the commissioner’s determination of waste was “ambiguous and erroneous,” and that the guidelines for waste are unlawful, claims that reflect the subjective nature of defining waste. DeWolfe declined to speak with Aspen Journalism for this story.
One of the ways water commissioners determine if waste is occurring is by looking at what is known as the “tail water,” which is where, after irrigating land, the ditch returns the water to the river. In 2018, DeWolfe said the large amount of tail water from the Lowline was an indication of waste.
The situation on the Crystal in 2018 is indicative of how state officials manage the river. The system is complaint-driven, meaning water commissioners will usually focus their efforts on streams where a water user has placed a call or where they have heard complaints of waste from water users. If a river is not on call, if no one is reporting their neighbors for taking too much or if there are no obvious indicators such as flooding, water commissioners probably won’t scrutinize ditches for waste. In most cases, tail water is not measured.
According to Heath, since 2018, no complaints about waste in the Crystal River basin have been received and waste has not been observed by water commissioners. Therefore, curtailment of structures within the Crystal River basin for waste issues has not occurred since 2018.
Heath said that as long as irrigators aren’t taking extra water to expand their historical irrigated acreage, his office doesn’t have an issue with low ditch efficiencies.
“As long as they continue to operate as they have historically operated, I don’t see that there is a problem with the diversions they are making,” he said. “They are operating their ditches and irrigating as they always have, and it just yields a low system efficiency.”
This section of the Lower Crystal River dried up during the late summer of 2012, a drought year. The dry stretches occurred again in 2018, 2020 and 2021, with the river hovering at around just 8 cfs. CREDIT: KEN NEUBECKER
When the river is harmed
In Colorado, inefficient or wasteful practices are only considered such if they deprive another senior user of water.
But what if the other water user being harmed is the river ecosystem itself? There are few ways to ensure that enough water stays in the river for the fish, plants and animals that depend on it.
The stretch of the Crystal River just south of Carbondale near the Colorado Parks and Wildlife fish hatchery has a tendency to dry up during the late irrigation season. The problem is worse in dry years, and the tool meant to address it is limited in what it can accomplish.
The Colorado Water Conservation Board holds instream flow water rights on the Crystal River, which are intended to preserve the natural environment to a reasonable degree. They date to 1975 and are some of the oldest instream flow rights in the state. Although the Crystal River was here long before any humans inhabited the valley, under the cornerstone of Colorado water law known as prior appropriation — where the oldest rights, which almost always belong to agriculture and cities, get first use of the river — the instream flow rights that protect the river itself might as well have been born yesterday.
The instream flow right is 100 cfs on the stretch of river between Avalanche Creek and its confluence with the Roaring Fork, but it is rarely met from August to October. The reason?
“It’s the senior uses in the area,” said Rob Viehl, chief of the Colorado Water Conservation Board’s stream and lake protection section. “There are a lot of large senior irrigation ditches right above the fish hatchery gauge that divert a lot of water. They are in priority, and they are legally senior to the instream flow.”
The dry stretch is immediately downstream from the diversion for the Carbondale Ditch, which can pull 42 cfs from the river.
“Carbondale definitely needs to do some ditch-efficiency work,” Neubecker said. “The town of Carbondale is the single-biggest water rights holder on the Crystal.”
Cold Mountain Rancher Bill Fales turns the headgate of the Lowline Ditch. Fales is participating in a non-diversion agreement with the Colorado Water Trust to keep more water in the Crystal River. CREDIT: HEATHER SACKETT/ASPEN JOURNALISM
Possible solutions
Much of western Colorado’s irrigation infrastructure is stuck in the 19th century. Upgrading ditches and headgates — and, in turn, making them more efficient — can be costly.
Matt Rice, southwest regional director for environmental group American Rivers, said Aspen Journalism’s analysis points to the need to upgrade that infrastructure. And with billions of dollars in federal funding available, now is a good time for these types of projects, he said.
“If you need that much nonconsumptive push water to get your 11 or 7 or 9%, my sense is that there is a lot of opportunity to do things better,” Rice said. “It seems to me that infrastructure modernization on the Crystal could be a key thing to investigate.”
Colorado River environmental groups — including American Rivers, Trout Unlimited, The Nature Conservancy, Pitkin County Healthy Rivers — have funded and worked on agricultural infrastructure improvement projects that claim to have multiple benefits for agriculture, the environment and recreation. The idea is that if a project makes an irrigation system more efficient, less water will need to be diverted from a river.
But although they may improve riparian habitat or create safer passage for boats, there’s no evidence these projects result in more water left in rivers. Of all the experts Aspen Journalism interviewed for this story, none could point to a ditch infrastructure improvement project that resulted in a measurable decrease in diversions, as reflected in diversion records maintained by DWR. Simply quantifying flow needs specifically for recreation and the environment through stream-management plans has been thwartedin recent years by agricultural interests.
The town of Carbondale and other groups have recently completed a headgate modernization project on the Weaver Ditch, which supporters say will benefit the environment. But Schorzman, Carbondale’s public works director, said in an email that the project “may or may not impact diversion amounts.”
Environmental groups say they must work with — and not against — agriculture since they are the biggest water-user sector and that building relationships is important. In that spirit, Pitkin County Healthy Rivers has earmarked tens of thousands of dollars (the exact amount the project will cost is still unclear) to fund a piping project for the East Mesa Ditch, which had a blowout from sinkholes in September. Healthy Rivers has not secured a commitment from ditch owners that there will be any benefit to river flows from the piping project, even though part of its mission is to maintain and improve the quantity of water in local streams.
“The question is: How can we stay true to our charter of maintaining streamflow while helping somebody divert water from the river?,” Pitkin County Attorney John Ely said at a September Healthy Rivers meeting. “You simply can’t preserve water in the river at all without someone you can work with and someone who holds a relatively senior water right. … You can’t solve the riddle of how to protect streamflow without working with agriculture.”
An often-heard refrain from water users is that if they leave the water in the river, it will just get picked up by the next downstream user, so they may as well divert it. That is true to a degree. But if all the water users on a system were to become more efficient, they might be able to each take less.
And a new state law allows water users to get paid to temporarily lease water to the state’s instream flow program for five out of 10 years. The loaned water is tracked by DWR officials so that it stays in the river through the stretch where it’s needed. So far, the program is little-used — just nine projects so far statewide — and no water users on the Crystal are currently doing this type of instream flow loan.
Crystal River rancher Bill Fales stands at the headgate for the Helms Ditch, with Mount Sopris in the background. As part of an agreement with the Colorado Water Trust, Fales could be paid to reduce his diversions from the ditch when the river is low. CREDIT: HEATHER SACKETT/ASPEN JOURNALISM
Carbondale ranchers Bill Fales and Marj Perry are participating in a slightly different program, a non-diversion agreement with the Colorado Water Trust designed to leave more water in the river. When river flows dwindle to less than 40 cfs, Fales will get paid to reduce his diversions from the Helms Ditch, which could result in an additional 6 cfs in the Crystal.
“Obviously we are like everybody else — we hate to see the river dry,” Fales told Aspen Journalism in 2022.
Colorado’s entrenched water law system protects those European American settlers who first put the water to beneficial use, growing crops and building cities. One hundred and forty years later, that system still reflects the values of the time that the concept of prior appropriation was invented and largely excludes water for the environment, recreation or tribal communities. But as water supplies continue to be squeezed across the Colorado River basin, that may one day change.
“Change is hard,” Makar said. “If we have a system that has been in place and working one way for a long time, it requires new education, new materials. … I think it’s worth it, and I think that the system is eventually going to require it. But that doesn’t mean it’s easy.”
This story was produced in partnership with The Water Desk, an independent initiative of the University of Colorado Boulder’s Center for Environmental Journalism.
Click the link to read the article on the NOAA website:
March 8, 2024
A very mild February wrapped up a record-warm winter for the U.S., according to experts from NOAA’s National Centers for Environmental Information (NCEI).
Below are highlights from NOAA’s U.S. climate report for February 2024:
Climate by the numbers
February 2024
The average temperature across the contiguous U.S. last month was 41.1 degrees F, 7.2 degrees F above the 20th-century average and ranking as the third-warmest February in NOAA’s 130-year climate record. Iowa, Minnesota, Missouri and Wisconsin each had their warmest February on record. An additional 20 states saw their top-10 warmest February on record.
Persistent winter warmth resulted in a steady decrease in ice coverage across the Great Lakes, which reached a historic low of 2.7% on February 11 — the lowest amount of ice coverage on record during mid-February.
February precipitation for the contiguous U.S. was 1.86 inches, 0.27 of an inch below average, ranking in the driest third of the climate record. Illinois, Maine, New Hampshire, New York and Vermont each saw their second-driest February on record.
Meteorological winter (December 2023 – February 2024) | Year-to-date
Meteorological winter was the warmest winter on record for the contiguous U.S., with an average temperature of 37.6 degrees F — 5.4 degrees above average. Iowa, Michigan, Minnesota, New Hampshire, New York, North Dakota, Vermont and Wisconsin each had their warmest winter on record. Twenty-six additional states saw their top-10 warmest winters on record.
Total winter precipitation was 7.71 inches, 0.92 of an inch above average, ranking in the wettest third of the December–February record. Connecticut and Delaware both had their third-wettest winter season on record.
The year-to-date (January – February 2024, YTD) average temperature for the contiguous U.S. was 36.5 degrees F — 4.5 degrees F above average —ranking as the ninth warmest such YTD on record. The YTD precipitation was 5.12 inches — 0.67 of an inch above average — ranking in the wettest third of the historical record.
Billion-dollar disasters
During the first two months of 2024, NCEI confirmed one weather disaster in the nation with a loss exceeding $1 billion. From January 8-10, a southern tornado outbreak and East Coast storm impacted more than a dozen states, damaging many homes, businesses, vehicles and other infrastructure.
Since 1980, the U.S. has sustained 377 separate weather and climate disasters where overall damages/costs reached or exceeded $1 billion (including Consumer Price Index adjustment to 2024). The total cost of these 377 events exceeds $2.670 trillion.
A map of the U.S. plotted with significant climate events that occurred during February 2024. Please see the story below as well as more details in the report summary from NOAA NCEI at http://bit.ly/USClimate202402 offsite link. (Image credit: NOAA/NCEI)
Other notable climate events
Atmospheric rivers drench the West: A series of atmospheric rivers brought heavy rain and snow to the Western U.S. during February, causing significant flooding, powerful winds, landslides and power outages in parts of California. The city of Los Angeles received more than 12 inches of rain during February, approximately three times the February average, resulting in the wettest February in decades for the city.
A record February tornado: Unseasonably warm temperatures mixed with a vigorous cold front fueled powerful thunderstorms that spawned tornadoes in portions of the Upper Midwest. Wisconsin had its first February tornado on record — an EF-2 near Evansville, Wisconsin.
A wildfire scorched Texas and Oklahoma: The Smokehouse Creek wildfire burned more than a million acres in the Texas Panhandle and western Oklahoma in February 2024. The wildfire, which began on February 26, became the largest wildfire in Texas history.
Click the link to read the article on the NOAA website:
March 8, 2024
Key Points:
The 2023–24 winter season ranked warmest on record for the contiguous U.S. with eight states across the Upper Midwest, Great Lakes and Northeast each observing their warmest winter on record.
The Smokehouse Creek wildfire burned more than a million acres in the Texas Panhandle and western Oklahoma. The wildfire began on February 26 and has become the largest wildfire in Texas history.
February 2024 was the third-warmest February on record for the nation and precipitation ranked in the driest third of the historical record for the month.
Other Highlights:
Temperature
The average temperature of the contiguous U.S. in February was 41.1°F, 7.2°F above average, ranking third warmest in the 130-year record. February temperatures were above average across most of the contiguous U.S., while record-warm temperatures were observed across much of the Mississippi Valley and in parts of the Great Lakes and southern Plains. Minnesota, Wisconsin, Iowa and Missouri each had their warmest February on record.
The Alaska statewide February temperature was 10.3°F, 5.5°F above the long-term average, ranking in the warmest third of the 100-year period of record for the state. Above-normal temperatures were observed across much of the state with near-normal temperatures observed in parts of southeast Alaska and Panhandle.
The meteorological winter (December–February) average temperature for the Lower 48 was 37.6°F, 5.4°F above average, ranking as the warmest winter on record. Temperatures were above average across a vast majority of the contiguous U.S. and near average along parts of the Gulf of Mexico. North Dakota, Minnesota, Iowa, Wisconsin, Michigan, New York, Vermont and New Hampshire each had their warmest winter on record.
The Alaska winter temperature was 6.4°F, 2.8°F above the long-term average, ranking in the middle third of the historical record for the state. Temperatures were above average across parts of the North Slope, West Coast, Southwest and Panhandle, while much of the Interior and south-central Alaska were near average for the season.
Precipitation
February precipitation for the contiguous U.S. was 1.86 inches, 0.27 inch below average, ranking in the driest third of the historical record. Precipitation was above average across much of the western U.S. and in parts of the central Appalachians, Southeast, and western High Plains. Conversely, precipitation was below normal across much of the eastern half of the U.S. and in parts of the Northwest, northern Plains and Southwest. Maine, New Hampshire, Vermont, New York and Illinois each had their second-driest February on record.
Alaska’s average monthly precipitation ranked in the middle third of the historical record. Precipitation was above average in parts of the North Slope, West Coast and in parts of the south-central Gulf of Alaska coast, while below-normal precipitation was observed in parts of the northeast Interior and Panhandle during the month.
The U.S. winter precipitation total was 7.71 inches, 0.92 inch above average, ranking in the wettest third of the December–February record. Precipitation was above average across much of the contiguous U.S., while below-normal precipitation was observed along the Northern Tier and in parts of the Great Lakes and Southwest, and in small pockets of the Mississippi Valley and Maine. Connecticut and Delaware both had their third-wettest winter season on record.
For the winter season, precipitation ranked in the wettest third of the historical record for Alaska. Wetter-than-average conditions were observed across much of the state, while near-normal precipitation was observed in portions of the central Interior, south-central Interior and in parts of the Aleutians. Parts of the northeast Interior observed below-normal precipitation during this period.
Billion-Dollar Disasters
One new billion-dollar weather and climate disaster was confirmed in February 2024, as a January 8–10 southern tornado outbreak and east coast storm impacted more than a dozen states.
The U.S. has sustained 377 separate weather and climate disasters since 1980 where overall damages/costs reached or exceeded $1 billion (including CPI adjustment to 2024). The total cost of these 377 events exceeds $2.67 trillion.
Other Notable Events
A series of atmospheric river events brought heavy rain and snow to parts of the West during February, causing significant flooding, powerful winds, landslides and power outages in parts of California. The city of Los Angeles received more than 12 inches of rain during February, approximately three times the February average, becoming the wettest February in decades for the city.
Persistent warmth, with monthly temperature nearly 20°F above normal for the month, resulted in a steady decrease in ice coverage across the Great Lakes, which reached a historical low of 2.7% on February 11—the lowest ice coverage on record during mid February.
Unseasonably warm temperatures mixed with a vigorous cold front to fuel powerful storms in portions of the Upper Midwest that spawned tornadoes in Iowa and Illinois. Wisconsin had its first February tornado on record—an EF-2 near Evansville, Wisconsin.
US Drought Monitor map March 5, 2024.
Drought
According to the February 27 U.S. Drought Monitor report, about 21.6% of the contiguous U.S. was in drought, down about 2% from the end of January. Drought conditions expanded or intensified along portions of the Northern Tier, and in parts of the central and northern Mississippi Valley, southern Plains, the Carolinas and Hawaii this month. Drought contracted or was reduced in intensity across much of the Southwest and Lower Mississippi Valley, and parts of the central Plains, northern Rockies and Puerto Rico.
Monthly Outlook
Above-average temperatures are favored to impact much of the eastern U.S. in March while precipitation is likely from the central Plains to the West Coast and from the Gulf of Mexico to southern portions of New England. Drought is likely to persist along portions of the Northern Tier, Southwest, Hawaii and Puerto Rico. Visit the Climate Prediction Center’s Official 30-Day Forecasts and U.S. Monthly Drought Outlook website for more details.
Significant wildland fire potential for March is above normal across much of the Upper Midwest and in parts of the central and southern Plains. For additional information on wildland fire potential, visit the National Interagency Fire Center’s One-Month Wildland Fire Outlook.
Click the link to read the report on the USGS website (Rebecca J. Frus, Cameron L. Aldridge, Michael L. Casazza, Collin A. Eagles-Smith, Garth Herring, Scott A. Hynek, Daniel K. Jones, Susan K Kemp, Thomas M. Marston, Christopher M. Morris, Ramon C. Naranjo, Cee S. Nell, David R. O’Leary, Cory T. Overton, Bryce A. Pulver, Brian E. Reichert, Christine A. Rumsey, Rudy Schuster, and Cassandra D. Smith). Here’s the executive summary:
In 2022, the U.S. Geological Survey (USGS) established the Saline Lake Ecosystems Integrated Water Availability Assessment (IWAAs) to monitor and assess the hydrology of terminal lakes in the Great Basin and the migratory birds and other wildlife dependent on those habitats. Scientists from across the USGS (with specialties in water quantity, water quality, limnology, avian biology, data science, landscape ecology, and science communication) formed the Saline Lake Ecosystems IWAAs Team. The team has developed this regional strategic science plan to guide data collection and assessment activities at terminal lakes in the Great Basin.
The U.S. Congress requested the USGS to establish the Saline Lake Ecosystems IWAAs in response to historically low water levels at terminal lakes and associated wetlands across the Great Basin. Not all Great Basin terminal lakes have high salinity; however, all terminal lakes occur in endorheic, closed, basins with no surface-water outflow. Low lake levels across the Great Basin are the result of increased water use for agriculture and municipalities, drought conditions, and a warming climate. Great Basin terminal lake water extents have decreased by as much as 90 percent over the last 150 years, and terminal lake wetlands have decreased in area by as much as 47 percent since 1984. Lake elevations and wetland areas are primarily supported by freshwater inputs from snowmelt feeding upgradient rivers, streams, and springs. These freshwater inputs have been severely reduced because of continued and increased surface-water diversions and surface-water capture through groundwater pumping for agriculture, mining, and public supply as well as unprecedented drought conditions and warming temperatures related to climate change.
Water quality, specifically salinity, is highly variable for terminal lakes of the Great Basin, and this variability is a result of the balance between freshwater inflow and evaporation. Variability of salinity at each of the terminal lakes can be affected by lake morphology, hydrogeologic features of the basin, annual variability in weather patterns, and changes in upgradient water use. Hypersaline terminal lakes provide abundant food resources such as brine shrimp and brine flies that support nesting and migrating birds. The density and composition of invertebrates are closely tied to lake salinity. Increased salinity can exceed the tolerance of invertebrates, severely limiting their biomass. In contrast, decreased salinity can lead to altered invertebrate community composition, reducing the abundance of optimal avian prey resources.
Great Basin terminal lake ecosystems, including open-water and adjacent aquatic and terrestrial environments, provide resources necessary to sustain many animal populations throughout the year. Although a variety of taxa use terminal lakes, these ecosystems are of acute importance for the millions of migratory waterbirds (for example, shorebirds, wading birds, and waterfowl) dependent on the network of terminal lakes and their associated wetlands. Migratory birds transiting the Pacific and Central Flyways use Great Basin terminal lake ecosystems throughout the year to feed, nest, and transit between wintering and breeding ranges. As such, successful conservation of birds and their habitats requires coordinated management of water and habitats across the Great Basin network of terminal lakes and wetlands.
The linkages between water availability and ecosystem vulnerability of terminal lakes in the Great Basin are not well understood. The vulnerability of terminal lakes is related to the factors driving change and adaptive capacity of the lake ecosystem. Saline lake ecosystems are vulnerable when changes in water quantity affect ecosystem function. Water quantity affects salinity, which affects food webs and habitat; these linkages can be investigated with water-quality and food web monitoring. Water quantity also affects inundated habitat, which can be quantified through remote sensing. It is necessary to quantify hydroclimatic and water use controls on water availability to terminal lakes to assess the response of the ecosystems. Remotely sensed data can provide a broad-scale and long-term synoptic view of terminal lake hydrologic characteristics, but ground observations are required to interpret changes in water quality and ecological functions. Some terminal lake basins have ongoing monitoring and modeling efforts within the Great Basin (for example, Great Salt Lake, Carson River Basin), yet most monitoring locations are hydrologically upgradient and too far away from lake inflows to provide an accurate assessment of hydrological trends for the lake ecosystems. Other terminal lakes have no long-term hydrological monitoring in their respective watersheds (for example, Lake Abert).
Ecological data collection in the Great Basin is also insufficient to understand how many birds exist on the landscape, how birds use the mosaic of terminal-lake habitats as an interconnected system, and how Great Basin terminal lakes are linked to the larger continental system of the Pacific and Central Flyways. Across agencies and organizations, tracking bird movement, abundance, and diversity is inconsistent, with some lakes having once- or twice-a-year bird survey efforts and a few locations having more intensive ecological data-gathering efforts (for example, Great Salt Lake, Lake Abert). Bridging hydrological and ecological information gaps will improve understanding of the trends in water supply and water quality, habitat availability and usage, and impacts on vulnerable waterbird species, all of which would be used by managers in coordinated conservation of this unique network of terminal-lake habitats.
The terminal lakes of the Great Basin are part of the Basin and Range physiographic province that extends from the Colorado Plateau on the east to the Sierra Nevada on the west, and from the Snake River Plain on the north to the Garlock fault and the Mojave block on the south. The Great Basin is larger than 650,000 square kilometers and encompasses most of the State of Nevada but also extends to western Utah, eastern California, southeastern Idaho, southwestern Wyoming, and southeastern Oregon. The climate is arid to semiarid with a hydrologic regime that is snowmelt dominated, providing as much as 75 percent of total annual runoff for the region. Terminal lakes of the Great Basin occupy the lowest areas of closed (endorheic) drainage basins, such that lake levels and water quality respond rapidly to surface-water inflow. Terminal lakes provide local and regional economic value to the States in the Great Basin, including mineral extraction, aquaculture, public works, and recreational uses. As an example, assessments of Great Salt Lake’s ecological health and economic impact find hemispheric importance for the former and regional importance for the latter. Great Salt Lake creates about 7,000 jobs and $2 billion of economic output per year, most of which would be lost with further declines in lake level.
The objectives of this Science Strategy are threefold: (1) to identify how changing water availability affects the quality, diversity, and abundance of habitats supporting continental waterbird populations; (2) to highlight the scientific monitoring and assessment needs of Great Basin terminal lakes; and (3) to support coordinated management and conservation actions to benefit those ecosystems, migratory birds, and other wildlife. There are long-term hydrological, ecological, and societal challenges associated with terminal lakes ecosystems in the Great Basin. This Science Strategy benefits partners by providing a conceptual model, nested at different spatial extents, that identifies key scientific information needs to inform coordinated implementation of management and conservation plans within and among hydrologic basins to address these complex challenges.
Becky Mitchell, Colorado’s interstate representative on the river, has said the subject of Upper Basin cuts is “untenable and also impossible.” Mitchell has said that the Lower Basin is responsible for declining water levels in the reservoirs.
“The Upper Basin states have used about 3 to 4 million acre-feet less than their apportionment when at times the Lower Basin has used 3 to 4 million more than their apportionment,” Mitchell said during a Feb. 15 information session. “I think one of the first steps before discussing shared shortages is for all in the basin to use only what they’re legally entitled to.”
Mitchell said that while Lower Basin states can rely on Powell and Mead for their water supplies, Upper Basin states can only rely on natural precipitation, meaning less certainty and more frequent times of shortage. The Lower Basin’s proposal includes reduced releases from Lake Powell based on Upper Basin hydrological shortages, meaning in theory that the Lower Basin could see shortages from precipitation just as the Upper Basin does.
Upper Basin water cuts have never occurred before, and the legality and structure of such cuts is unclear. During the 2023 Colorado Water Congress in Steamboat Springs, Denver attorney David Robbins, who is one of Colorado’s alternate representatives on interstate river matters, argued that it would take “a tremendous amount of litigation” for the federal government to exercise authority over Colorado’s water use as it does in the Lower Basin.
Click the link to read the article on the Carbon Brief website (Zeke Hausfather):
Electric vehicles (EVs) are an important part of meeting global goals on climate change. They feature prominently in mitigation pathways that limit warming to well-below 2C or 1.5C, which would be inline with the Paris Agreement’s targets.
However, while no greenhouse gas emissions directly come from EVs, they run on electricity that is, in large part, still produced from fossil fuels in many parts of the world. Energy is also used to manufacture the vehicle – and, in particular, the battery.
Here, in response to recent misleading media reports on the topic, Carbon Brief provides a detailed look at the climate impacts of EVs. In this analysis, Carbon Brief finds:
EVs are responsible for considerably lower emissions over their lifetime than conventional (internal combustion engine) vehicles across Europe as a whole.
In countries with coal-intensive electricity generation, the benefits of EVs are smaller and they can have similar lifetime emissions to the most efficient conventional vehicles – such as hybrid-electric models.
However, as countries decarbonise electricity generation to meet their climate targets, driving emissions will fall for existing EVs and manufacturing emissions will fall for new EVs.
In the UK in 2019, the lifetime emissions per kilometre of driving a Nissan Leaf EV were about three times lower than for the average conventional car, even before accounting for the falling carbon intensity of electricity generation during the car’s lifetime.
Comparisons between electric vehicles and conventional vehicles are complex. They depend on the size of the vehicles, the accuracy of the fuel-economy estimates used, how electricity emissions are calculated, what driving patterns are assumed, and even the weather in regions where the vehicles are used. There is no single estimate that applies everywhere.
There are also large uncertainties around the emissions associated with electric vehicle battery production, with different studies producing widely differing numbers. As battery prices fall and vehicle manufacturers start including larger batteries with longer driving ranges, battery production emissions can have a larger impact on the climate benefits of electric vehicles.
Around half of the emissions from battery production come from the electricity used in manufacturing and assembling the batteries. Producing batteries in regions with relatively low-carbon electricity or in factories powered by renewable energy, as will be the case for the batteries used in the best-selling Tesla Model 3, can substantially reduce battery emissions.
Different studies find different results
A recent working paper from a group of German researchers at the thinktank Institute for Economic Research (ifo) found that “electric vehicles will barely help cut CO2 emissions in Germany over the coming years”. It suggests that, in Germany, “the CO2 emissions of battery-electric vehicles are, in the best case, slightly higher than those of a diesel engine”.
This study was pickedup in the international media, with the Wall Street Journal running an editorial titled, “Germany’s dirty green cars”. It also engendered pushback from electric vehicle advocates, with articles in Jalopnik and Autoblog, as well as individual researchers rebutting the claim.
There are also large uncertainties around the emissions associated with electric vehicle battery production, with different studies producing widely differing numbers. As battery prices fall and vehicle manufacturers start including larger batteries with longer driving ranges, battery production emissions can have a larger impact on the climate benefits of electric vehicles.
Around half of the emissions from battery production come from the electricity used in manufacturing and assembling the batteries. Producing batteries in regions with relatively low-carbon electricity or in factories powered by renewable energy, as will be the case for the batteries used in the best-selling Tesla Model 3, can substantially reduce battery emissions.
I often go into great detail about these adventures around the state but I just want to say that charging is not a worry any longer for non-Tesla EV travelers in Colorado. The Colorado Welcome Center in Alamosa is a great location to bump your charge. They have DC fast chargers, restrooms, Wi-Fi, and space where you can set up and doomscoll through the Internet. If you get a chance stop for food at Mojo’s Eatery in Salida and charge while you dine.
Over on Twitter Karl Kistner asked if the precipitation in the San Luis Valley was doing well this season after viewing the video above. Snowpack is below average in the Upper Rio Grande Basin and the snow in the video above was from a beautiful snow storm the night before that dropped 0.41″ of precipitation on the valley floor.
After years of dealing with contaminated groundwater and an unreliable water supply, officials in Fort Lupton say a single solar project could solve both issues for the foreseeable future.
The city has an aging diesel-powered generator that has a habit of going offline at times of high demand and power outages. Officials have also been working to reduce algae blooms in their 300-acre-foot reservoir that the water treatment plant turns into drinking water.
To address both these issues, the city partnered with Brighton-based power provider United Power and contractor Schneider Electric to replace the old generator with an 850-kilowatt solar array and a 1,147-kilowatt battery storage system that floats in the city’s water treatment plant.
The project could receive up to $6.1 million in federal funds from the U.S. Department of Energy as part of its $1 billion Energy Improvements in Rural or Remote Areas Program, which was created under the Bipartisan Infrastructure Law in 2021. However, the funding is not yet guaranteed, according to U.S. Rep. Yadira Caraveo (D-CO), who represents Fort Lupton and is pushing the project.
Fort Lupton City Administrator Chris Cross said he expects the project to increase power redundancy for the city, meaning it will have more than one power source to draw from. Cross also expects Fort Lupton residents to see roughly 9% savings on their average power bill.
Residents of Fort Lupton pay an average of $0.12 per kilowatt hour for residential power, which is about 5% greater than the statewide average, according to data from Electricity Local.
“Coupled with the floating panel benefits to the water storage, we are excited to see how high our overall savings will be from the project,” Cross said.
Fort Lupton, like many rural communities in Colorado, has faced challenges providing clean drinking water for decades. Data from the Colorado Department of Public Health and Environment shows the city has recorded 268 water quality incidents since 1995. That total is comparable to much larger cities that are fed by waters from Carter Lake like Superior, Louisville, and Broomfield even though Fort Lupton has the smallest population at just 8,500 residents.
One of the most memorable water quality incidents in Fort Lupton happened in March 2009 when residents reported that their tap water had become flammable. An investigation found that nearby natural gas wells were leaking into the city’s groundwater supply, the Greeley Tribune reported.
In November 2023, a water main break at the intersection of 9th St. and Lancaster Ave. in Fort Lupton caused a high concentration of chlorine to enter the water supply for the nearby neighborhoods. Officials with CDPHE’s water quality division told Fort Lupton staff that “there will be water quality complaints” resulting from the break and that residents should flush their ice makers and sinks, although “a mandatory advisory would not be necessary at this time,” according to emails contained in a November 2023 CDPHE water quality incident report.
The city’s most recent water quality report also shows that the city’s water treatment plant reported one health-based violation in 2023 for having an inadequate backflow prevention and cross-connection control program. This program, “Uncontrolled cross connections can lead to inadvertent contamination of the drinking water,” the report says. Fort Lupton has hired a contracting firm called Aqua Backflow to help improve its backflow issues, according to the city’s website.
Schneider Electric North America Microgrid President Jana Gerber said these are just a few of the issues that the project team wanted to address when they pitched the microgrid idea to Fort Lupton officials. Gerber added that the project could serve as a model for other microgrid partnerships in rural communities.
As part of the agreement, Schneider Electric is responsible for designing and building the microgrid. United Power would then become the owner and operator of the grid while Fort Lupton pays for maintenance. United Power also plans to partner with Aims Community College and the BUENO Center for Multicultural Education to provide contracting outreach, according to United Power CEO Mark Gabriel.
John Tracy, director of the Colorado Water Center at Colorado State University in Fort Collins, said the issues with Fort Lupton’s drinking water system are indicative of the city’s age. Fort Lupton was incorporated in 1889, and Tracy said the city’s existing water system likely dates back to the 1970s when the Clean Water Act provided billions in federal subsidies for water improvement projects.
But maintaining that infrastructure is a delicate dance that is difficult for rural communities to perform, Tracy added. Many rural towns like Fort Lupton collect enough water fees to operate their system, not improve it, Tracy said. Fort Lupton’s 2024 budget projects a 10.7% decrease in water sales tax collections and a more than 5% increase in expenditures from its water sales tax fund. The city also plans to spend more than $18 million on capital improvements for its water system over the next six years.
With all of the planned expenditures, Fort Lupton needs to find a place to cut its operating costs. That’s where the floating solar array comes in. Tracy said Other cities like San Antonio, Texas have come to the same conclusion that green technology can reduce their operating costs by reducing their dependence on fossil fuels, which are more expensive to acquire than electricity.
“Fossil fuel energy prices have been too variable and it’s difficult to blend that into a municipal budget and project what those costs are going to be two years from now,” Tracy said. “If you’re doing something like either wind or solar, you have much more predictability in the cost.”
Glen Canyon Dam impounds the Colorado River to create Lake Powell. In a proposal to the U.S. Bureau of Reclamation about reservoir operations, upper basin water managers say releases from Lake Powell should be based on how full the reservoir is on Oct. 1 each year. CREDIT: ALEXANDER HEILNER/THE WATER DESK, WITH AERIAL SUPPORT BY LIGHTHAWK
Click the link to read the article on the Aspen Journalism website (Heather Sackett):
March 6, 2024
In two separate proposals for how the nation’s two largest reservoirs should be managed, the upper and lower Colorado River basin states agree on a couple things, but can’t find common ground on whether the upper basin should take cuts when reservoir levels fall.
Proposals submitted to the U.S. Bureau of Reclamation by the upper basin states (Colorado, Utah, Wyoming and New Mexico) and the lower basin states (California, Arizona and Nevada) each say that the current guidelines’ method of basing operations on 24-month forecasts and setting shortages based on critical elevations of Lake Powell and Lake Mead should be tossed out in favor of using real-time water storage levels to determine releases and who takes how much in cuts. Both proposals say that the lower basin must cut its use by 1.5 million acre-feet in most years.
But the similarities stop there. Lower basin water managers say all seven states that use the Colorado River must share cuts broadly under the most critical system conditions, while upper basin officials maintain they do not have to cut their water use because they have never used the entire 7.5 million acre-foot apportionment given to them under the Colorado River Compact.
The separate proposals came after the seven basin state representatives could not reach a consensus after months of negotiations on how to operate the reservoirs after 2026. In recent months, water managers have focused on figuring out a new plan for reservoir management because the current guidelines from 2007 were only intended to last 20 years. In the context of a historic drought and climate change, the 2007 guidelines, along with the emergency Band-Aid that was 2019’s Drought Contingency Plan, have not been enough to keep reservoir levels from plummeting and bringing the system to the brink of collapse.
Total losses (evaporation and riparian ET) from Reach 1 through Reach 5. Credit: USBR
In its proposal, the lower basin has committed to doing something that the upper basin has long called for: owning the amount of water lost to evaporation and transit. A recent Reclamation study put evaporation and transit losses in the lower basin — which are currently unaccounted for on any balance sheets of supply and demand — at about 1.3 million acre-feet per year.
The lower basin’s proposal says it will cut its use by 1.5 million acre-feet when total system storage is between 38% and 69%. But if reservoir levels dip lower than 38% full, the lower basin wants additional cuts to be split evenly between the upper and lower basins, up to 3.9 million acre-feet. As of Tuesday, Lake Powell was nearly 34% full and Lake Mead was about 37% full.
“The Lower Basin Alternative creates resiliency and proposes climate change is a shared responsibility of all those that depend on the Colorado River,” JB Hamby, the Colorado River commissioner representing California, said in a prepared statement. “Each basin, state and sector must contribute to solving the challenges ahead. No one who benefits from the river can opt out of saving it.”
Upper basin water managers disagree, saying their water users are already being squeezed by climate change and are forced to take shortages in dry years because the water simply isn’t there. Upper basin officials have long maintained that most of the blame for the system crashing should be placed on lower basin overuse.
“I want to be very clear that the upper division states have always been in full compliance with the 1922 Colorado River Compact and, again, are currently using 3 [million] to 4 million acre-feet less than our compact apportionment,” Amy Ostdiek, Colorado Water Conservation Board section chief for interstate, federal and water information, said at a press conference explaining the upper division alternative. “There’s no mechanism to make mandatory water cuts in the upper basin beyond those that already occur each year.” [ed. emphasis mine]
From left, Colorado River negotiator for California JB Hamby, Arizona’s Tom Buschatzke and Colorado’s Becky Mitchell. A proposal from the lower basin states about reservoir operations says the upper basin should also take cuts to its water use if reservoir levels fall below 38% full. CREDIT: TOM YULSMAN/THE WATER DESK
Conservation promises
The upper basin’s proposal, however, says the four states will pursue “parallel activities”that include voluntary, temporary and compensated reductions in use, although the upper basin states do not offer a specific amount of water that they will conserve. This would be separate from the post-2026 guidelines process.
The upper basin has dabbled in recent years with two such conservation programs: demand management and system conservation. In 2019, the state of Colorado embarked on a multiyear feasibility study of a voluntary and temporary program — known as demand management — that would pay water users to cut back and bank the conserved water in Lake Powell. That program is currently shelved without having been implemented.
In 2023, the Upper Colorado River Commission restarted the System Conservation Program, which pays water users — nearly all of them in agriculture — to cut back. With this program, there is no guarantee the conserved water makes it to Lake Powell. The program saved about 38,000 acre-feet in 2023, at a cost of nearly $16 million. System Conservation will take place again this year.
The upper basin proposal, which officials say mitigates the risk of either reservoir reaching dead pool, bases both cuts to lower basin use and releases from Lake Powell on how full the reservoirs are on Oct. 1 of each year.
“We’re also looking to operate Lake Powell and Lake Mead based on observed conditions instead of unreliable forecasts,” Ostdiek said.
Under the upper basin’s proposal, if the two reservoirs combined are more than 90% full, no lower basin reductions will occur; if they are 70% to 90% full, lower basin cuts increase up to 1.5 million acre-feet; at 20% to 70% full, lower basin cuts remain static; and if the reservoirs are less than 20% full, lower basin cuts increase up to 2.4 million acre-feet a year, on top of the initial 1.5 million-acre-foot cuts. Under the upper basin proposal, those four states do not take any cuts, even as reservoir levels fall.
That is in contrast with the lower basin’s proposal which would require cuts beyond 1.5 million acre-feet to be split evenly between the upper and lower basins.
If Lake Powell is 81% to 100% full on Oct. 1, then releases would be between 8.1 million and 9 million acre-feet; at 20% to 80% full, releases would be between 6 million and 8.1 million acre-feet; and if the reservoir is less than 20% full, just 6 million acre-feet would be released.
The lower basin proposal for releases from Lake Powell is based on the total amount of water in the upper basin Colorado River Storage Project Act reservoirs: Flaming Gorge, Blue Mesa, Navajo and Lake Powell. If these upper basin reservoirs are more than 80% full, releases from Lake Powell would be between 8.5 and 11 million acre-feet; if reservoirs are between 30% and 80% full, releases would be between 7 and 8.5 million acre-feet; if reservoirs are between 20% and 30% full, releases would be between 6 and 7 million acre-feet and if storage is less than 20% full, 6 million acre-feet would be released.
Current reservoir operations are based on Reclamation’s “24-month Study,” a monthly forecast that predicts a range of probabilities for reservoir storage levels and “balancing tiers,” which lay out who takes what shortages if reservoirs fall below certain elevations.
The two proposals will be reviewed by Reclamation, the federal agency that manages many of the West’s dams and reservoirs, as part of the National Environmental Policy Act process for creating the new post-2026 guidelines for reservoir operations.
Although the upper and lower basins did not reach consensus before the March 11 deadline and instead submitted two different proposals, both sides say they are still open to continuing negotiations.
“Although our proposal can stand on its own, it was also designed to promote the development of a seven-state consensus alternative, which is a goal we all still seek to achieve,” Wyoming Commissioner Brandon Gebhart said in a prepared statement.
Heavy precipitation fell across parts of the southern and eastern U.S., and in parts of the West, especially in the Sierra Nevada, where a major blizzard significantly increased snowpack in that range. The Great Plains were mostly dry this week, as were parts of the Midwest, except for rain in parts of Illinois, southeast Wisconsin and Michigan. Recent rainfall improved conditions across much of Puerto Rico. Hawaii has been in a trade wind pattern recently, leading to wet weather on the windward sides of the islands but drier conditions on the leeward sides. Thus, a mix of improvements and degradations occurred there. Temperatures were near or below normal in much of the western U.S. west of the Continental Divide. In most of the central and eastern U.S., temperatures were near or above normal, especially in the Upper Midwest and Great Lakes, where temperatures from 10 to 15 degrees warmer than normal were common. A few spots in the Great Lakes area checked in even warmer than that, with readings 15-20 degrees above normal…
Mostly dry weather occurred in the Great Plains portion of the High Plains region this week. Temperatures in the region ranged from mostly 5-10 degrees warmer than normal for far eastern Wyoming and Colorado and most of Kansas, Nebraska and South Dakota, to near or below normal temperatures in North Dakota, western Colorado and western Wyoming. Some of the mountainous parts of the region received significant snowfall, especially in west-central and northwest Wyoming and in the Medicine Bow Mountains in northern Colorado and south-central Wyoming. Improving snowpack levels led to reductions in coverage of moderate and severe drought and abnormal dryness in these areas, though improvements were more limited in southern Wyoming, where grass fires were reported west of Cheyenne recently and only light snow amounts were reported in the high plains west of Laramie. Given short-term dryness and high recent evaporative demand, abnormal dryness and moderate drought were expanded in northwest South Dakota, southwest North Dakota, and adjacent southeast Montana…
Colorado Drought Monitor one week change map ending March 5, 2024.
Heavy precipitation fell this week across much of the central and northern Pacific Coast, and heavy snow also fell in a major storm in the Sierra Nevada. Significant snow amounts also fell across parts of Idaho and northwest and southwest Montana. Improving snowpack in these areas and lessening precipitation deficits led to improvements in drought or abnormal dryness in numerous locations. Recent precipitation in western and central Oregon continued to chip away at long-term precipitation deficits, leading to the removal of one long-term moderate drought area and coverage reductions of another. Meacher and Park counties in Montana have missed out on recent snowfall, leaving current snowpack numbers very low, and moderate drought worsened to severe drought. Heavy precipitation in northwest Washington (with some locations likely seeing over 9 inches of liquid precipitation) led to a reduction in moderate drought and abnormal dryness coverage. Along the Arizona-New Mexico border, severe drought coverage was locally reduced in a reassessment of short- and long-term drought conditions…
Moderate to heavy rain amounts fell across portions of Louisiana and Mississippi this week. Elsewhere, mostly dry weather occurred in the region, aside from isolated heavy rain from a thunderstorm in north-central Arkansas. Temperatures across the region were mostly either near normal or 5-10 degrees above normal, with a few spots in Texas coming in 5-10 degrees below normal. Recent rainfall continued to alleviate precipitation deficits in eastern Louisiana and in Mississippi, leading to some improvements in areas of moderate drought and abnormal dryness. In southwest Louisiana, short-term dryness and warmth and lowering streamflow levels led to a small expansion of moderate drought conditions. Abnormal dryness spread across parts of northern and western Arkansas, and a few isolated spots in Texas and Oklahoma, given short-term precipitation deficits, warm and windy weather, and low soil moisture…
Looking Ahead
Through the evening of Monday, March 11, the National Weather Service Weather Prediction Center is forecasting widespread precipitation amounts of at least a half inch across much of the central and eastern U.S. (roughly from the Interstate 35 corridor eastward), excluding northern Wisconsin, Minnesota, the Michigan Upper Peninsula, the Florida Peninsula, and central and south Texas. Within this area of precipitation, swaths of at least 1.5 inches of liquid precipitation are forecast from southwest Missouri to southeast Michigan, from southwest Mississippi to central North Carolina, and across most of New England. In the West, mostly drier weather is expected, though some higher precipitation amounts can be expected in the western mountains of northern California, western Oregon and western Washington.
Looking ahead to March 12-16, the National Weather Service Climate Prediction Center forecast favors warmer-than-normal temperatures across the central and eastern U.S., with the highest confidence for warmer-than-normal weather centered around the Upper Midwest and Great Lakes. The forecast favors near- or below-normal temperatures in the Intermountain West, and above-normal temperatures along the West Coast. Above-normal precipitation is favored across large portions of the central and southern U.S., especially in Colorado and New Mexico and the adjacent western Great Plains and in the Deep South and along the Central Gulf Coast. The forecast favors below-normal precipitation along the West Coast. In Alaska, above-normal precipitation is favored in the central and eastern parts of the state, while drier-than-normal weather is favored in the northwest. Colder-than-normal weather is forecast in the central and western portion of Alaska, while southeast Alaska is likely to be warmer than normal. Cooler-than-normal weather is favored in Hawaii along with near-normal precipitation.
US Drought Monitor one week change map ending March 5, 2024.
Just for grins, here’s gallery of early March Drought Monitor maps for the past few years.
US Drought Monitor map March 5, 2024.
US Drought Monitor March 7, 2023.US Drought Monitor map March 1, 2022.US Drought Monitor March 2, 2021.US Drought Monitor March 3, 2020.US Drought Monitor March 5, 2019.US Drought Monitor March 13, 2018.US Drought Monitor March 7 2017.US Drought Monitor March 1, 2016.US Drought Monitor March 3, 2015US Drought Monitor March 11, 2014US Drought Monitor March 12, 2013US Drought Monitor March 25, 2014US Drought Monitor March 13, 2012
This week, the Upper Division States of Colorado, New Mexico, Utah, and Wyoming submitted to the Bureau of Reclamation an Alternative for Post-2026 Operations of Lake Powell and Lake Mead. The UDS Alternative proposes operations for Lake Powel and Lake Mead designed to help provide water supply certainty and sustainability in the face of a drying and uncertain future.
The purpose of the Upper Division States Alternative is to provide a set of modeling assumptions and operating parameters to the Bureau of Reclamation for Post-2026 Operations of Lake Powell and Lake Mead as part of the review process required under the National Environmental Policy Act (NEPA).
Separate from this NEPA process, the Upper Division States (UDS) will also pursue Parallel Activities. Parallel Activities are other activities the Upper Division States might take under certain conditions. Examples include potential releases and recovery at the Colorado River Storage Project Act (CRSPA) Initial Units and voluntary water conservation programs that would help to protect the ability of Lake Powell to make releases.
The Upper Division States Alternative provides:
Management of the reservoirs to address the existing imbalance between water supply and demands in the Lower Basin;
● Operations based on actual conditions—instead of unreliable forecasts—to ensure that Lake Powell and Lake Mead are operated sustainably;
● Efforts to rebuild storage at Lake Powell to protect the reservoir’s ability to provide water to Lake Mead;
● Reliance on the best available science and information, including impacts caused by climate change;
● Consistency with the Law of the River;
● Accounting of Upper Basin’s hydrologic shortages, which average an estimated 1.2 million acre-feet each year; and
● Acknowledgement of the settled but undeveloped Tribal water rights in the Upper Basin.
“We can no longer accept the status quo of Colorado River operations,” said Becky Mitchell, Colorado’s Commissioner to the Upper Colorado River Commission. “If we want to protect the system and ensure certainty for the 40 million people who rely on this water source, then we need to address the existing imbalance between supply and demand. That means using the best available science to work within reality and the actual conditions of Lake Powell and Lake Mead. We must plan for the river we have – not the river we dream for.”
Estevan Lopez, New Mexico’s Commissioner, said, “The Colorado River Basin is at a critical juncture. The UDS Alternative seeks to acknowledge the Upper Basin’s realities, including hydrologic shortages, protect Upper Basin interests, and contribute towards future sustainability of the entire basin. We look forward to working with our sister Lower Basin States to resolve differences in approach and create a 7-state consensus alternative.”
“This is a pivotal moment for Utah and the entire Upper Basin,” said Gene Shawcroft, Utah’s Upper Colorado River Commissioner. “Our proposal represents a balanced approach, combining immediate action with long-term planning to ensure the sustainability of both Lake Powell and Lake Mead. It’s about adapting to the realities we face today and securing a water-resilient future for our region.”
The Shoshone hydro plant in Glenwood Canyon, captured here in June 2018, uses water diverted from the Colorado River to make power, and it controls a key water right on the Western Slope and that right is in the process of being acquired by the Colorado River Water Conservation District. Photo credit: Brent Gardner-Smith/Aspen Journalism
In their board meetings this month, the Clifton Water District and Grand Valley Water Users Association kicked in $250,000 and $100,000, respectively, toward the Colorado River District’s proposed purchase of the rights. The Orchard Mesa Irrigation District and Grand Valley Irrigation Co. have also informally agreed to financially support the effort and are awaiting final action in upcoming board meetings, according to a new release from the river district…
Clifton Water serves nearly 13,000 domestic taps. On the Western Slope De Beque, Silt, Parachute, Battlement Mesa and Rifle also rely on the river as their primary supply of drinking water. Grand Valley Water Users Association delivers irrigation water to more than 22,000 acres within its boundaries and more than 42,000 acres in the Grand Valley…
The river district also hopes to secure about half of the money for the purchase from the U.S. Bureau of Reclamation in the form of Inflation Reduction Act funds. Sealing the deal also is contingent on negotiating an instream flow agreement between the Xcel, the river district and the Colorado Water Conservation Board, and Xcel receiving approval from the state Public Utilities Commission for the dispersal of profits from the sale.
The Blanca massif, located just south of Great Sand Dunes, has been been a landmark for people for thousands of years. The #SnowMoon rising behind it is the full moon that occurs each February.
Arkansas Valley Conduit map via the Southeastern Colorado Water Conservancy District (Chris Woodka) June 2021.
Click the link to read the release on the Reclamation website (Anna Perea and Darryl Asher):
Feb 29, 2024
LOVELAND, Colo. — The Bureau of Reclamation has awarded a contract for the construction of water treatment and connection facilities for the Arkansas Valley Conduit Project to Thalle Construction for $28,710,676. This contract, partially funded by President Biden’s Bipartisan Infrastructure Law, funds construction of a backflow preventor connecting the main trunkline to Pueblo Water’s system, and a treatment facility to address specific water treatment needs for the Project.
The backflow preventer will be constructed at 36th Lane and U.S. Highway 50, east of Pueblo. The treatment facility will be located along the AVC pipeline route about 4 miles east of 36th Lane. The treatment process will prepare the water for conveyance through the trunkline to Project communities and ensure compatibility of the water with the AVC participants’ water systems.
“We’re extremely pleased to be able to move forward with multiple features of the Arkansas Valley Conduit,” said Jeff Rieker, Eastern Colorado Area Office Manager. “The momentum of making this connection to the eastern end of Pueblo’s water system while downstream pipes are being placed and additional designs are being developed really speaks to the collaborative efforts of all those involved.”
A 2022 three-party contract between Reclamation, Southeastern Colorado Water Conservancy District Board and the Pueblo Board of Water Works (Pueblo Water), eliminates the need for over 24 miles of pipeline by utilizing Pueblo Water’s existing infrastructure. The water will be either Fryingpan-Arkansas Project water or from participants’ water portfolios, not from Pueblo Water’s resources.
“This is another important step forward for the Arkansas Valley Conduit, and vital to begin providing high-quality drinking water to the people of the Lower Arkansas Valley. The Southeastern District has tremendous appreciation for the work that Reclamation and our congressional delegation have done to keep this project moving forward,” said Bill Long, President, Southeastern Colorado Water Conservancy District.
In addition to the contract for these facilities, in January, Reclamation awarded a $4.6 million contract to Central Geotechnical Services, LLC to locate and complete subsurface utility engineering surveys for underground utilities along a 34-mile stretch of the Arkansas Valley Conduit. Colorado legislation, SB 18-167, enacted in 2018, set new standards for entities conducting underground excavation.
Arkansas River Basin via The Encyclopedia of Earth
Oak Flat, Arizona features groves of Emory oak trees, canyons, and springs. This is sacred land for the San Carlos Apache tribe. Resolution Copper (Rio Tinto subsidiary) lobbied politicians to deliver this National Forest land to the company with the intent to build a destructive copper mine. By SinaguaWiki – Own work, CC BY-SA 4.0, https://commons.wikimedia.org/w/index.php?curid=98967960
“This is our land,” said [Verlon] Jose, whose tribe [Tohono O’odham Nation] includesroughly 38,000 members across southern Arizona and northern Mexico. “It should all be protected.”
[…]
Jose is one of several tribal leaders nationwide who are growing frustrated with the Biden administration and its ambitious plans for clean-energy projects that could affect their ancestral lands. While the White House has worked to repair the federal government’s relationships with Indigenous peoples, that effort is conflicting with another Biden priority: expediting projects essential for the energy transition…The SunZia transmission line is one of those projects. Once complete, the power line would carry clean electricity from massive wind farms in New Mexico to more-populated areas as far away as California. The Biden administration has championed SunZia as a key pillar of its plans for fighting climate change and boosting green energy, and has defended its engagement with area tribes…
“We do not disagree with renewable energy,” Jose said. “We are for renewable energy. You know what the fix to this issue is? They could have rerouted it. But they didn’t listen.”
[…]
About 70 miles east of Phoenix, one of the tribes fighting SunZia — the San Carlos Apache — is also working to stop a proposed copper mine on land that it considers sacred. In Nevada, some tribal activists are opposing one of the world’s largest mines for lithium, a mineral crucial to the development of batteries for electric vehicles.And in Oklahoma, a federal judge recently took the rare step of ordering the removal of a wind farm on Osage Nation land.
There’s a flaw in the plan. It’s not a small one: it is an Earth-sized hole in our calculations. To keep pace with the global demand for food, crop production needs to grow by at least 50% by 2050. In principle, if nothing else changes, this is feasible, thanks mostly to improvements in crop breeding and farming techniques. But everything else is going to change.
Even if we set aside all other issues – heat impacts, soil degradation, epidemic plant diseases accelerated by the loss of genetic diversity – there is one which, without help from any other cause, could prevent the world’s people from being fed. Water.
A paper published in 2017 estimated that to match crop production to expected demand, water use for irrigation would have to increase by 146% by the middle of this century. One minor problem. Water is already maxed out.
In general, the dry parts of the world are becoming drier, partly through reduced rainfall; partly through declining river flow as mountain ice and snow retreats; and partly through rising temperatures causing increased evaporation and increased transpiration by plants. Many of the world’s major growing regions are now threatened by “flash droughts”, in which hot and dry weather sucks moisture from the soil at frightening speed. Some places, such as the southwest of the US, now in its 24th year of drought, may have switched permanently to a drier state. Rivers fail to reach the sea, lakes and aquifers are shrinking, species living in freshwater are becoming extinct at roughly five times the rate of species that live on land and major cities are threatened by extreme water stress.
Already, agriculture accounts for 90% of the world’s freshwater use. We have pumped so much out of the ground that we’ve changed the Earth’s spin. The water required to meet growing food demand simply does not exist.
That 2017 paper should have sent everyone scrambling. But as usual, it was ignored by policymakers and the media. Only when the problem arrives in Europe do we acknowledge that there’s a crisis. But while there is understandable panic about the drought in Catalonia and Andalusia, there’s an almost total failure among powerful interests to acknowledge that this is just one instance of a global problem, a problem that should feature at the top of the political agenda.
Though drought measures have triggered protests in Spain, this is far from the most dangerous flashpoint. The catchment of the Indus river is shared by three nuclear powers – India, Pakistan and China – and several highly unstable and divided regions already afflicted by hunger and extreme poverty. Today, 95% of the river’s dry season flow is extracted, mostly for irrigation. But water demand in both Pakistan and India is growing rapidly. Supply – temporarily boosted by the melting of glaciers in the Himalayas and the Hindu Kush – will, before long, peak and then go into decline.
Uprooted almond trees, destroyed for lack of water, lie in a field in Huron, California, in July 2021. Credit: Phys.org
Even under the most optimistic climate scenario, runoff from Asian glaciers is expected to peak before mid-century, and glacier mass will shrink by about 46% by 2100. Some analysts see water competition between India and Pakistan as a major cause of the repeated conflicts in Kashmir. But unless a new Indus waters treaty is struck, taking falling supplies into account, this fighting could be a mere prelude for something much worse.
There’s a widespread belief that these problems can be solved simply by enhancing the efficiency of irrigation: huge amounts of water are wasted in agriculture. So let me introduce you to the irrigation efficiency paradox. As better techniques ensure that less water is required to grow a given volume of crops, irrigation becomes cheaper. As a result, it attracts more investment, encourages farmers to grow thirstier, more profitable plants, and expands across a wider area. This is what happened, for instance, in the Guadiana river basin in Spain, where a €600m investment to reduce water use by improving the efficiency of irrigation has instead increased it.
A center pivot irrigates a field in the San Luis Valley, where the state is warming farmers that a well shut-down could come much sooner than expected. Credit: Jerd Smith via Water Education Colorado
You can overcome the paradox through regulation: laws to limit both total and individual water consumption. But governments prefer to rely on technology alone. Without political and economic measures, it doesn’t work.
Kansas Aqueduct route via Circle of Blue
Nor are other technofixes likely to solve the problem. Governments are planning massive engineering schemes to pipe water from one place to another. But climate breakdown and rising demand ensure that many of the donor regions are also likely to run dry. Water from desalination plants typically costs five or 10 times as much as water from the ground or the sky, while the process requires masses of energy and generates great volumes of toxic brine.
Much of the agricultural production in the Republican River Basin supports livestock sectors, including this dairy near Holyoke. Photo/Allen Best
Above all, we need to change our diets. Those of us with dietary choice (in other words, the richer half of the world’s population) should seek to minimise the water footprint of our food. With apologies for harping on about it, this is yet another reason to switch to an animal-free diet, which reduces both total crop demand and, in most cases, water use. The water demand of certain plant products, especially almonds and pistachios in California, has become a major theme in the culture wars, as rightwing influencers attack plant-based diets. But, excessive as the watering of these crops is, more than twice as much irrigation water is used in California to grow forage plants to feed livestock, especially dairy cows. Dairy milk has much higher water demand even than the worst alternative (almond milk), and is astronomically higher than the best alternatives, such as oat or soya milk.
This is not to give all plant products a free pass: horticulture can make massive demands on water supplies. Even within a plant-based diet, we should be switching from some grains, vegetables and fruit to others. Governments and retailers should help us through a combination of stronger rules and informative labelling.
Instead, they do the opposite. Last month, at the behest of the EU’s agricultural commissioner, Janusz Wojciechowski, the European Commission deleted from its new climate plan the call to incentivise “diversified” (animal-free) protein sources. Regulatory capture is never stronger than in the food and farming sector.
I hate to pile yet more on to you, but some of us have to try to counter the endless bias against relevance in politics and most of the media. This is yet another of those massive neglected issues, any one of which could be fatal to peace and prosperity on a habitable planet. Somehow, we need to recover our focus.
George Monbiot is a Guardian columnist
Join George Monbiot for a Guardian Live online event on Wednesday 8 May 2024 at 8pm BST. He will be talking about his new book, The Invisible Doctrine: The Secret History of Neoliberalism. Book tickets here
The 2023-24 El Niño has peaked as one of the five strongest on record. It is now gradually weakening but it will continue to impact the global climate in the coming months, fuelling the heat trapped by greenhouse gases from human activities. Above normal temperatures are predicted over almost all land areas between March and May.
Key messages
El Niño peaked in December as one of five strongest on record
El Niño and climate change fuel record temperatures and extreme events
Global ocean temperatures are record high
Early warnings and climate services save lives and livelihoods
Photo credit: World Meteorological Organization
A new Update from the World Meteorological Organization (WMO) says there is about a 60% chance of El Niño persisting during March-May and a 80% chance of neutral conditions (neither El Niño or La Niña) in April to June. There is a chance of La Niña developing later in the year, but the odds are currently uncertain.
El Niño occurs on average every two to seven years, and typically last nine to 12 months. It is a naturally occurring climate pattern associated with warming of the ocean surface in the central and eastern tropical Pacific Ocean. It influences weather and storm patterns in different parts of the world. But it takes place in the context of a climate being changed by human activities.
“Every month since June 2023 has set a new monthly temperature record – and 2023 was by far the warmest year on record. El Niño has contributed to these record temperatures, but heat-trapping greenhouse gases are unequivocally the main culprit,” says WMO Secretary-General Celeste Saulo.
“Ocean surface temperatures in the equatorial Pacific clearly reflect El Niño. But sea surface temperatures in other parts of the globe have been persistently and unusually high for the past 10 months. The January 2024 sea-surface temperature was by far the highest on record for January. This is worrying and can not be explained by El Niño alone,” says Celeste Saulo.
El Niño typically has the greatest impact on the global climate in the second year of its development – in this instance 2024.
The continuing, albeit weaker, El Niño and predicted above-normal sea-surface temperatures over much of the global oceans are expected to lead to above-normal temperatures over almost all land areas in the next three months, and influence regional rainfall patterns, according to a Global Seasonal Climate Update issued by WMO to accompany its El Niño/La Niña Update.
Early warnings save lives
The current El Niño event, which developed in June 2023, was at its strongest between November and January. It displayed a peak value of about 2.0 °C above the 1991 to 2020 average sea surface temperature for the eastern and central tropical Pacific Ocean. This made it one of the five strongest El Nino events ever, though it was weaker than the 1997/98 and 2015/2016 events.
El Niño is mainly a seasonal climate phenomenon with climate impacts on seasonal climate averages but can make extreme weather and climate-events more likely in certain regions. Furthermore, the seasonal forecasts are found to be more accurate during El Niño and La Niña events, particularly in the tropics, and this emphasizes the pivotal role of early warnings to support decision-making and enhance preparedness and anticipatory action.
El Niño is associated with increased rainfall triggering flooding in the Horn of Africa and the southern United States of America, and unusually dry and warm conditions in South East Asia, Australia and southern Africa. It has exacerbated drought in northern South America and has also contributed to drier and warmer conditions in parts of southern Africa.
“El Niño events have a major impact on societies and economies. Accurate seasonal forecasts from the WMO community helped countries prepare in advance to try to limit the damage in climate sensitive sectors like agriculture, water resources and health. Early warnings of weather and climate extremes associated with El Niño have saved countless lives,” said Celeste Saulo.
Credit: World Meteorological Organization
Global Seasonal Climate Update
El Niño and La Niña are major – but not the only – drivers of the Earth’s climate system.
In addition to the long-established ENSO Update, WMO now also issues regular Global Seasonal Climate Updates (GSCU), which incorporate influences of other climate phenomenon such as the North Atlantic Oscillation, the Arctic Oscillation and the Indian Ocean Dipole.
The Global Seasonal Climate Update says that Positive temperature anomalies are expected over almost the entire Northern Hemisphere except in the far south-eastern part of North America, as well as over most of the land areas in the Southern Hemisphere.
Predictions for rainfall in the forthcoming three months (March to May) are similar to some of the canonical rainfall patterns associated with El Niño.
The WMO El Niño/La NIña and Global Seasonal Climate Updates as part of the Early Warnings for All initiative are based on forecasts from WMO Global Producing Centres of Long-Range Forecasts and are available to support governments, the United Nations, humanitarian agencies and decision-makers to mobilize preparations and protect lives and livelihoods.
National Meteorological and Hydrological Services (NMHSs) will closely monitor the situation in the months to come and provide updated outlooks on the dissipation of El Niño and the possible development of La Niña. Uncertainty is typically greater in long-lead forecasts made during the boreal spring and early summer.
How is snow made? – Tenley, age 7, Rockford, Michigan
The thought of snow can conjure up images of powdery slopes, days out of school or hours of shoveling. For millions of people, it’s an inevitable part of life – but you may rarely stop to think about what made the snow.
Clouds form when air near the Earth’s surface rises. This happens when sunlight warms the ground and the air closest to it, just like the Sun can warm your face on a cold winter day.
When temperatures are well below freezing on the ground, the clouds are primarily made of water in the form of ice. Under 32 degrees Fahrenheit – that’s zero degrees Celsius – the frozen water molecules arrange themselves into a hexagonal, or six-sided, crystalline shape. As ice crystals grow and clump together, they become too heavy to stay aloft. With the help of gravity, they begin to fall back down through and eventually out of the cloud.
What these ice crystals look like once they reach land depends on the temperature and humidity of the atmosphere. As the humidity – or the amount of water vapor in the cloud – increases, some of the ice crystals will grow intricate arms at their six corners. That branching process creates what we think of as the characteristic shapes of snowflakes.
No two ice crystals take the same path through a cloud. Instead, every ice crystal experiences different temperatures and humidities as it travels through the cloud, whether going up or down. The ever-changing conditions, combined with the infinite number of paths the crystals could take, result in a unique growth history and crystalline shape for each and every snowflake. This is why you’ve likely heard the saying, “No two snowflakes are exactly alike.”
Many times, these differences are visible to the naked eye; sometimes a microscope is required to tell them apart. Either way, scientists who study clouds and snow can examine a snowflake and ultimately understand the path it took through the cloud to land on your hand.
When snow falls from the sky, you don’t usually see individual ice crystals, but rather clumps of crystals stuck together. One way ice crystals aggregate is through what’s called mechanical interlocking. When ice crystals bump into each other, crystals with intricate branches and arms intertwine and stick to others.
This mechanism is the main sticking process in cooler, drier conditions – what people call a “dry snow.” The result is a snow perfect for skiing, and easily picked up by the wind, but that won’t hold together when formed into a snowball.
The second way to stick ice crystals together is to warm them up a bit. When ice crystals fall through a region of cloud or atmosphere where the temperature is slightly above freezing, the edges of the crystals start to melt. Just a tiny bit of liquid water allows ice crystals that bump into each other to stick together very efficiently, almost like glue.
The result? Large clumps of ice crystals falling from the sky, what we call a “wet snow” – less than ideal for hitting the slopes but perfect for building a snowman.
Snow formed in clouds typically reaches the ground only in winter. But almost all clouds, no matter the time of year or location, contain some ice. This is true even for clouds in warm tropical regions, because the atmosphere above us is much colder and can reach temperatures below freezing even on the warmest of days. In fact, scientists who study weather discovered that clouds containing ice produce more rain than those that don’t contain any ice at all.
Hello, curious kids! Do you have a question you’d like an expert to answer? Ask an adult to send your question to CuriousKidsUS@theconversation.com. Please tell us your name, age and the city where you live.
And since curiosity has no age limit – adults, let us know what you’re wondering, too. We won’t be able to answer every question, but we will do our best.
Click the link to read the article on The Denver Post website (Elise Schmelzer). Here’s an excerpt:
March 3, 2024
For decades, farmers in the Republican River basin have pumped water from the underground Ogallala Aquifer to grow wheat, beans, corn, potatoes, and feed for cattle and hogs. But the water is running out. Flows in the Republican River system are shrinking as the aquifer depletes, making it harder for Colorado to send enough water downstream to the east to fulfill its agreements with Kansas and Nebraska. To meet its obligations, Colorado is legally required to stop irrigating 25,000 acres in the southern part of the basin by the end of 2029 — more than a quarter of all irrigated acreage in that area. If the mandate is not met, state water officials say they will turn off wells for all 540,000 irrigated acres in the broader swath of the state that’s in the river basin, a move that would devastate the region’s economy and way of life…
With wells cut off, farms wouldn’t be able to grow crucial crops that feed Colorado and the wider region. The companies that sell farming supplies, such as seed, tractors and sprinklers, would lose massive amounts of business…Less local income would mean fewer meals at local restaurants in the plains towns and trips to the movie theater or bowling alley. Tax revenue would fall, potentially impacting schools and emergency and social services. Without irrigation, land values would drop — giving farmers less collateral for the loans they depend on to begin each season.
“What’s frightening about it is that it’s really an existential issue for those living in that region,” said Jordan Suter, a Colorado State University professor tasked with examining the economic fallout from that scenario. “With good reason. If irrigated production goes away, the area can’t really support a large population.”
Groundwater from the aquifer makes irrigated farming possible across a large part of Colorado’s Eastern Plains that spans about 7,000 square miles across eight counties — an area the size of New Jersey. In 2022, the counties produced more than $2.6 billion worth of agricultural products, according to the U.S. Department of Agriculture’s farm census. The state has made some progress, but even if it meets the 25,000-acre goal, the aquifer’s water level is still declining.
Kansas Geological Survey at the University of Kansas is embarking on a two-year study of playas that hold water during wet periods in Scott County and elsewhere to better understand their role in recharge of the underground Ogallala aquifer. (Bill Johnson/Kansas Geological Survey)
Aerial view of irrigated and non-irrigated fields in eastern Colorado. Photo by Bill Cotton, Colorado State UniversityOgallala Aquifer. Credit: Big PivotsRepublican River Basin overlaying the Ogallala Aquifer. Graphic credit: Deb Daniel/RRWCDThe Ogallala aquifer, also referred to as the High Plains aquifer. Source: National Oceanic and Atmospheric AdminstrationCenter pivot sprinklers in the Arikaree River basin to irrigate corn. Each sprinkler is supplied by deep wells drilled into the High Plains (Ogallala) aquifer.Kansas Aqueduct route via Circle of BluePlots of land in Finney County, Kansas, utilize irrigation water from the High Plains Aquifer. Credit: NASA via the University of KansasHistoric photo of the High Plains in Haskell County, Kansas, showing a treeless semi-arid grassland and a buffalo wallow or circular depression in the level surface. (Photo by W.D. Johnson, 1897) High Plains in eastern Colorado. Photo credit Bob Berwyn.Republican River in Colorado January 2023 near the Nebraska border. Photo credit: Allen Best/Big PivotsThe Republican River basin. The North Fork, South Fork and Arikaree all flow through Yuma County before crossing state lines. Credit: USBR/DOIKansas River Basin including the Republican River watershed. Map credit: By Kmusser – Self-made, based on USGS data., CC BY-SA 3.0, https://commons.wikimedia.org/w/index.php?curid=4390886The Republican River’s South Fork near Hale, Colorado, with the region’s seemingly endless fields. Credit: Wikimedia Commons/Jeffrey BeallSouth Fork of the Republican RiverNorth Fork Republican River via the National Science Foundation.Republican River Basin by District
A volunteer with the South Yuba River Citizens League tests the water quality and temperature of the river in the Sierra foothills northeast of Sacramento. Source: South Yuba River Citizens League
When residents of the Yuba River watershed northeast of Sacramento saw a stretch of the emerald-green river suddenly turn an alarming reddish-brown on a recent winter day, they knew immediately who to call.
Though water quality concerns are the purview of federal, state and county environmental agencies, they alerted the local South Yuba River Citizens League, confident its volunteers could get to the scene quicker and investigate the discoloration faster than any regulator.
Sure enough, the group found the likely culprit within hours. One of its trained river monitors took samples at the site near the Gold Rush-era town of Nevada City, ran a series of tests, then compared the results with those from samples volunteers had routinely collected for more than 20 years – from the same section of river and the same time of year.
“Our baseline data allows us to look back on how the river has behaved at certain points in time, and lets us quickly identify anomalies,” said Aaron Zettler-Mann, the league’s executive director, who develops stream-sampling tools for volunteers as part of his post-doctorate research in geography. “We worked backward and determined it was probably just a small landslide.”
The league is among dozens of volunteer organizations that monitor the health of their local waterways and native fish populations across California and the West.
As new threats emerge, the community stream stewards bring their data and observations to the attention of environmental enforcement agencies. Colorado takes the relationship a step further by formally partnering with streamkeepers and using their data to inform decision-making.
Often referred to as “streamkeepers,” the grassroots groups are meticulous chroniclers of river conditions – the Yuba league alone records water temperature, pH, dissolved oxygen and turbidity at 37 sites across 40 river miles – and are often the first to detect problematic trends.
Information from streamkeeper groups has influenced California policymakers in setting minimum stream flow requirements for native fish, establishing water quality standards for treated wastewater disposed in streams and designating stretches of rivers “wild and scenic” to keep them free of dams and diversions.
“These groups get the data from the ground level and make it real,” said Felicia Marcus, former chair of California’s State Water Resources Control Board, which polices water quality. “Their stories can be really important and powerful in the public policy arena.”
Versatile Volunteers
Andrew Rypel
Some larger groups like Los Angeles Waterkeeper have fundraising and public relations staff and are linked to larger networks while many of the smaller, more grassroots organizations like the Friends of the Shasta River monitor waterways in more remote areas.
Native American tribes are no less active in protecting their watersheds. Several tribes are the driving force behind the ongoing removal of four hydroelectric dams on the Klamath River. At Clear Lake, just north of Napa Valley’s wineries, the Big Valley Band of Pomo Indians and the Elem Indian Colony are taking the lead on spotting toxic algal blooms that harm fish and taint water supplies.
Streamkeeper groups share similar core goals: reduce pollution, monitor stream conditions and gather data that can help officials make informed water policy decisions.
Mostly comprised of trained volunteers, the groups lead river clean-ups, survey locations for habitat restoration, conduct routine water quality testing and educate the public on the importance of healthy watersheds. Retired biologists, ecologists, conservationists and former employees of natural resource agencies are common in the ranks of volunteers as are riverside property owners.
Andrew Rypel, director of the Center for Watershed Sciences at the University of California, Davis and former member of a streamkeeper group in Alabama, cast these volunteers as the “ultimate transdisciplinary water professional.”
“They tend to know something about science, ecology, agriculture, the people who live along the waterbody and the economics of the situation,” he said. “They’re in the middle of everything.”
Punching Above Their Weight
Some California streamkeepers wield their local knowledge to spur regulatory changes.
One of the preeminent streamkeeper success stories comes from Putah Creek, an 85-mile-long stream that winds through parts of Northern California’s wine country before draining into the Sacramento River.
Having a permanent, paid stream keeper has aided the ecological recovery of Utah Creek below Monticello Dam in Northern California’s wine county. Eight miles down a smaller dam divers much of the water south to Solano County cities, farms and industry. Source: UC Davis
In 1990, the volunteer-led Putah Creek Council sued the Solano Irrigation District and Solano County Water Agency to release more water from a dam to sustain chinook salmon and other native fish species downstream. The city of Davis and UC Davis later joined the council as plaintiffs.
After a protracted legal fight, a state judge ordered a new flow schedule for the creek that requires the water agency to provide more water when certain species are spawning or migrating out to the ocean. As part of a settlement over the lawsuit, the water agency agreed to create a permanent streamkeeper position on staff.
Having a dedicated, long-term funding source for the streamkeeper position has been key to the creek’s recovery, said Max Stevenson, who assumed the full-time job in December 2021. He added that some of his most important work is done off-stream, engaging with interest groups.
“Long-term relationship building is the key,” Stevenson said. “All the users – landowners, regulatory agencies, the public and cities – they have to get along.”
The lower Putah Creek, which commonly ran dry during drought and was a haven for illegal dumping, has seen a resurgence in its salmon and steelhead trout populations thanks to consistent flows and habitat restoration, according to UC Davis researchers.
A similar effort is underway in the San Joaquin Valley, where local streamkeeper groups are among those pressing the city of Bakersfield to keep more water in the lower Kern River for fish. A state judge has ordered the parties to come up with a plan that ensures “public trust flows” to benefit fish while the case is pending.
Los Angeles Waterkeeper has routinely filed lawsuits over the past 30 years, forcing the state and local governments to curb sewage spills and reduce the flow of toxic urban runoff into streams and along the Pacific coast.
“While no one likes to go to court, a lawsuit is often the only way to get polluters and regulators to do the right thing,” said Kelly Shannon McNeill, the Los Angeles group’s associate director.
Streamkeepers are also known for rallying against new dams.
The Yuba league was hatched in the 1980s primarily to fight proposals for more dams on the river. It swayed local politicians to fight against the projects and — after nearly 20 years of lobbying — state lawmakers gave the Yuba wild and scenic status, permanently banning new dams and diversions on nearly 40 river miles. The group now has about 3,500 members.
A chinook salmon prepares to spawn in the Shasta River below Mount Shasta. Petitions files by Friends of the Shasta River and other groups prompted state water officials to temporarily limit diversion ton the stream. Photo courtesy of Carson Jeffres.
Since then, stretches of several other rivers have been added to the state’s wild and scenic list, most recently a portion of the Mokelumne River in 2018.
Near the California-Oregon border, Friends of the Shasta River has had recent success in protecting salmon and other native species on a key Klamath River tributary.
The group formed in 2019 out of frustration over the lack of streamflow protections for a river that historically produced about 50 percent of the chinook salmon in the Klamath River basin. The group, comprised of local scientists, retired natural resource professionals and riverside property owners, documents water conditions and promotes the river’s values in rural Siskiyou County.
“The Shasta River is tiny, more of a creek running through a desert, but arguably for its size it was probably the most productive salmon-bearing stream on the face of the earth,” said David Webb, a Friends of the Shasta River board member.
The Shasta streamkeepers, the Karuk Tribe and other salmon activists filed petitions that prompted the state water board to temporarily limit water diversions during the last three years on the Shasta and nearby Scott River. Regulators are currently gathering scientific data and considering whether to adopt permanent minimum flow requirements to ensure the rivers don’t run dry during critical periods for native fish.
“We’ve waited long enough; we need permanent instream flows so that public trust resources are protected,” Webb said.
A River Turns Orange
For more than three decades, Colorado has relied on a virtual army of volunteers to track the health of the state’s more than 150 rivers.
Before 1989, conditions on most of the state’s 770,000 miles of river weren’t monitored. Important water decisions were made without reliable data. To better inform decision-makers, the state created a program that enlists streamkeepers, teachers and students to gather water quality data.
A reach of the Animas River in Southwestern Colorado turns orange following a wastewater spill from Gold King Mine in 2015. State officials used volunteers’ baseline data to track progress on the river cleanup. Source: Wikimedia Commons
Today, the River Watch program managed by Colorado Parks and Wildlife and the nonprofit River Science has about 100 volunteer groups that monitor hundreds of streams. Revenue from the state lottery helps pay for the program.
Megan McConville, who manages the program for the state, says the thousands of volunteers serve as eyes and ears for Colorado’s streams, spotting trends unseen by environmental regulators.
“These students, these volunteers, they know their rivers better than I ever will,” McConville said. “What I love about this program is that I can call a volunteer and ask them ‘Hey, could you expand your monitoring to include two more locations? We want to figure out whether a culvert is introducing zinc into a waterway.’”
Streamkeepers came in particularly handy in 2015 when 3 million gallons of orange sludge spilled from an abandoned mine and tainted the Animas River, a Colorado River tributary. The state used the volunteers’ baseline data to track its progress on the river cleanup.
‘They Can Have Your Flank’
While streamkeepers have had legal fights with water suppliers and regulators, partnerships between them are becoming more common in California.
Both the South Yuba River Citizens League and the Yuba Water Agency are working with a broader coalition to restore 275,000 acres of forest in the river’s upper Sierra watershed. They are also cooperating on habitat restoration projects and a proposal to create a channel that will allow threatened green sturgeon to get around a dam on the Yuba.
Willie Whittlesey, Yuba Water Agency general manager, credited the 2008 Yuba Accord for fostering ongoing partnerships on the Yuba.
“This is a new way of doing things,” Whittlesey said of the series of agreements among the agency, environmental groups, farmers and hydroelectric producers.
Meanwhile, in California’s capital city, streamkeepers are becoming effective advocates. Marcus, the former head of the state water board, said grassroots groups have figured out creative ways to draw attention to problems in ways that regulators can’t.
Joaquin Esquivel
She credited groups, such as those that brought jars of tainted drinking water to public hearings and press conferences, for winning legislative support for more water board staff and resources to regulate rural drinking water systems.
“They can have your flank,” said Marcus, who in 1985 co-founded the grassroots Heal the Bay group to fight pollution in Santa Monica Bay and elsewhere along Southern California’s coast. “Sometimes they highlight a problem and then the agency can get the resources needed to address it.”
Streamkeepers can also aid regulators by carefully reviewing pending orders and rules. During her stint as state water board chair, Marcus said the California Coastkeeper Alliance was particularly adept at articulating the pros and cons of draft documents and then working with the regulator on useful changes. “It makes it easier for you as a regulator,” she said.
Joaquin Esquivel, the current board chair, said volunteer groups have been submitting critical water quality data to the board’s citizen monitoring program for years. The program helps streamkeepers choose monitoring techniques, perform quality control and find funding sources.
“Their concern is genuine,” Esquivel said. “Collecting and bringing in data helps us see that a watershed or stream is impaired.”
Back on the south Yuba, Zettler-Mann and his group have started monitoring the watershed for signs of emerging threats, including long-lived synthetic compounds known as PFAS and a rubber preservative in tires that federal regulators are examining for potential harm to salmon.
UC Davis’ Rypel, a professor of coldwater fish ecology who advocates “a streamkeeper for every stream,” said having passionate volunteers filling data gaps and looking out for emerging threats to streams like the Yuba and Putah can inspire neighboring watersheds to do the same.
“Of all the different management things I’ve seen tried,” he said, ”the streamkeeper thing might be the one that’s worked best.”
Know someone who wants to stay connected to water in the West? Encourage them to sign up for Western Water and follow us on Twitter, LinkedIn, Facebook and Instagram.
Hello, and welcome to meteorological spring (March-May). The month of February just ended, and frankly, this winter felt different. The northern Front Range of Colorado has just been through a bizarre meteorological winter. For Fort Collins, this was the second warmest and second least snowy meteorological winter since the beginning of the 21st century, and certainly warmer and less snowy than the historical past. At the same time, precipitation (the combined accumulation of rain and melted liquid from snow/ice) has been well above average this winter. The official Fort Collins Weather Station winter precipitation total of 2.42” is the 8th wettest winter on record, and ranks only behind 2007 and 2016 in the last 30 years. Boulder also recorded its 8th wettest winter in over 100 years while remaining only 0.6” above the 1991-2020 average snowfall mark. Our neighbors at the University of Northern Colorado in Greeley recorded their 3rd warmest winter, but with 151% of normal precipitation. On top of this, winter 2024 has also been speckled with rain only events, freezing drizzle, and a very heavy, spring-like rain snow mix. Is this a sign of things to come? Will rainy, drizzly, sloppy winters replace the fine, snowy powder of our past? Let’s dig into the numbers and the literature to find out.
Winter Rain Only Events
Rainfall events during the winter months on the northern Front Range of Colorado are perhaps more common than some realize. Since 1951 there have been 80 rainfall events with no measurable snow for Fort Collins, and 95 for Boulder. That is an average of 1.0-1.5 rain only events/meteorological winter. Fort Collins and Greeley had three such events this year (Boulder only one). There is no statistically significant trend in winter rain events over this time. If somebody says “it never rains in northern Colorado during winter” be skeptical.
One reason we may be inclined to believe winter rain is rare in Colorado is these events generally aren’t memorable. Precipitation accumulations are almost always small. 80-90% of rain-only winter events tally less than one tenth of an inch of precipitation. Fort Collins, Greeley, and Boulder have never seen a rain event greater than half an inch during winter. The largest rain only value occurred in Boulder on January 18th, 1974 (0.43”).
Freezing Rain/Drizzle
We also experienced a freezing drizzle event this winter on February 16th, 2024. This is not the only winter freezing drizzle events in recent years: Northern Colorado also saw freezing drizzle on January 24th, 2017, January 19th, 2022, and March 7th, 2014 (though this last date falls just outside the scope of “meteorological winter”). Anecdotally, it feels as though these events are becoming more frequent. A couple notes on freezing rain and freezing drizzle: 1. While freezing drizzle is obviously possible for northern Colorado, true freezing rain is nearly impossible. 2. Freezing drizzle is not well archived historically. One possible source of freezing drizzle records is the Automated Surface Observing System (ASOS), a network of weather stations designed to aid aviation endeavors. Some ASOS stations do mark the occurrence of freezing drizzle, but not all, and existing records are spotty. All this to say, it is unclear whether or not freezing drizzle is becoming more likely for northern Colorado.
February 3rd, 2024 (A Spring Storm in the Middle of Winter)
February 3rd was a special day on the northern Front Range of Colorado. The official Fort Collins weather station received 1.66” of precipitation between 7:00 PM on the 2nd, and 7:00 PM on the 3rd (7:00 is the official weather station daily observation time). Boulder and Greeley received 1.74” and 0.74” of precipitation respectively. This was a top ten wettest storm for Greeley and a record setter for Boulder. In Fort Collins, 1.66” of precipitation is not only a record amount of moisture for any day in February (135 years of record), it single-handedly made February 2024 the wettest February Fort Collins has ever experienced. Furthermore, Greeley’s all-time wettest February storm also occurred in 2024 just one week later, but as heavy snowfall.
Northern Colorado locals have seen these types of rain/snow events before, but they are more of a calling card of spring. Typically, in February, the air is too cold and dry to support such accumulations. The weather pattern on this day was unique in a couple key ways allowing this event to happen. For one, the storm tapped into a corridor of tropical moisture extending all the way from the central tropical Pacific Ocean to the western United States, greatly increasing the potential for high moisture totals. These events are often called “atmospheric river events,” and are more common in coastal settings like California, Oregon, and Washington. Secondly, we experienced a split polar jet stream pattern with Colorado lying in the middle of the two currents. The southern flank of the split polar jet brought the atmospheric river to our doorstep while a high pressure airmass in the middle of the two flanks deflected the moist air back against the eastern side of the Rocky Mountains, and blocked cold arctic air from sweeping this storm out over the plains (figure 1). Both factors were important for producing such spring-like storm conditions.
Figure 1: Upper air map of Contiguous United States from the morning of February 3rd, 2024 (250 hectopascal pressure level). Wind speeds measured in knots (kts) from National Weather Service Soundings. Wind speeds contoured in 25kt intervals. 1 flag = 50 kts. Long bars = 10 kts. Short bars = 5kts. Green arrow shows position of jet stream. The “H” and “L” mark locations of high and low pressure.
Winter Precipitation and Climate Change
Our office teamed up with Jeff Lukas of Lukas Consulting to synthesize what the academic literature says about how Colorado’s climate may change over the remainder of the 21st century. This resource can be accessed here. If you have not had a chance to scan this document, I highly recommend it. We can use this document to get a glimpse into the future of winter precipitation, snowfall, and winter storms for Colorado.
Colorado has warmed, and continues to warm, significantly in all seasons due to increasing greenhouse gas concentrations in the atmosphere. Atmospheric physics tell us that warmer air can hold more water vapor, meaning there is potential for higher precipitation measurements from each individual storm under a warmer climate. We do see evidence that meteorological winters are getting wetter. Since 1950 we have seen a 3% increase in statewide wintertime precipitation. This trend is actually higher for the northern Front Range +14%, but somewhat offset by marginal decreases in western Colorado. Most climate models do suggest further increases in wintertime precipitation are likely. One experiment from our report shows an average of 6% more winter precipitation across Colorado by mid-Century with nearly 90% of the 36 global climate models used agreeing on the sign of the trend. Further increases are possible by the end of this century, and under high carbon emissions scenarios.
Accurately assessing trends in snowfall is more complicated. Snow measurement protocols have changed over time, muddying the waters of snowfall trend analysis. We do know average high elevation snowpack has decreased over time in Colorado, but 3”+ snowstorms on the Front Range have not. Annual maximum snowfall event totals have not fallen yet either (Figure 2). We also know that extreme cold outbreaks, which often follow winter snowstorms, are likely to continue decreasing in frequency and intensity, but will not disappear.
Figure 2: Maximum 2-day snow event per year in inches (blue bar) and total number of 2-day snow accumulations greater than 3 inches per year (black line) for Fort Collins (top), Denver Central-Park (middle), and Burlington (bottom), 1951-2020. Source: climatechange.colostate.edu
Winter storms are complex, and can be measured in a number of ways. For instance, just in recent years, we have seen the northern Front Range covered with 20-30” of snow (March 2021), a new lowest central pressure record from a winter storm (March 2019), and one of the most intense cold fronts in decades (December 2022). We have high confidence that winter will continue to get warmer on average across Colorado over the coming years and decades, but snow, extreme cold, and wildly varying conditions will not be out of the offing anytime soon.
Based on the evidence we have about climate change in Colorado, it is reasonable to hypothesize that our warming trend made this event more likely. Even so, climate models do not suggest that events like February 3rd, 2024 will become commonplace by the end of the century, even under high emissions scenarios.


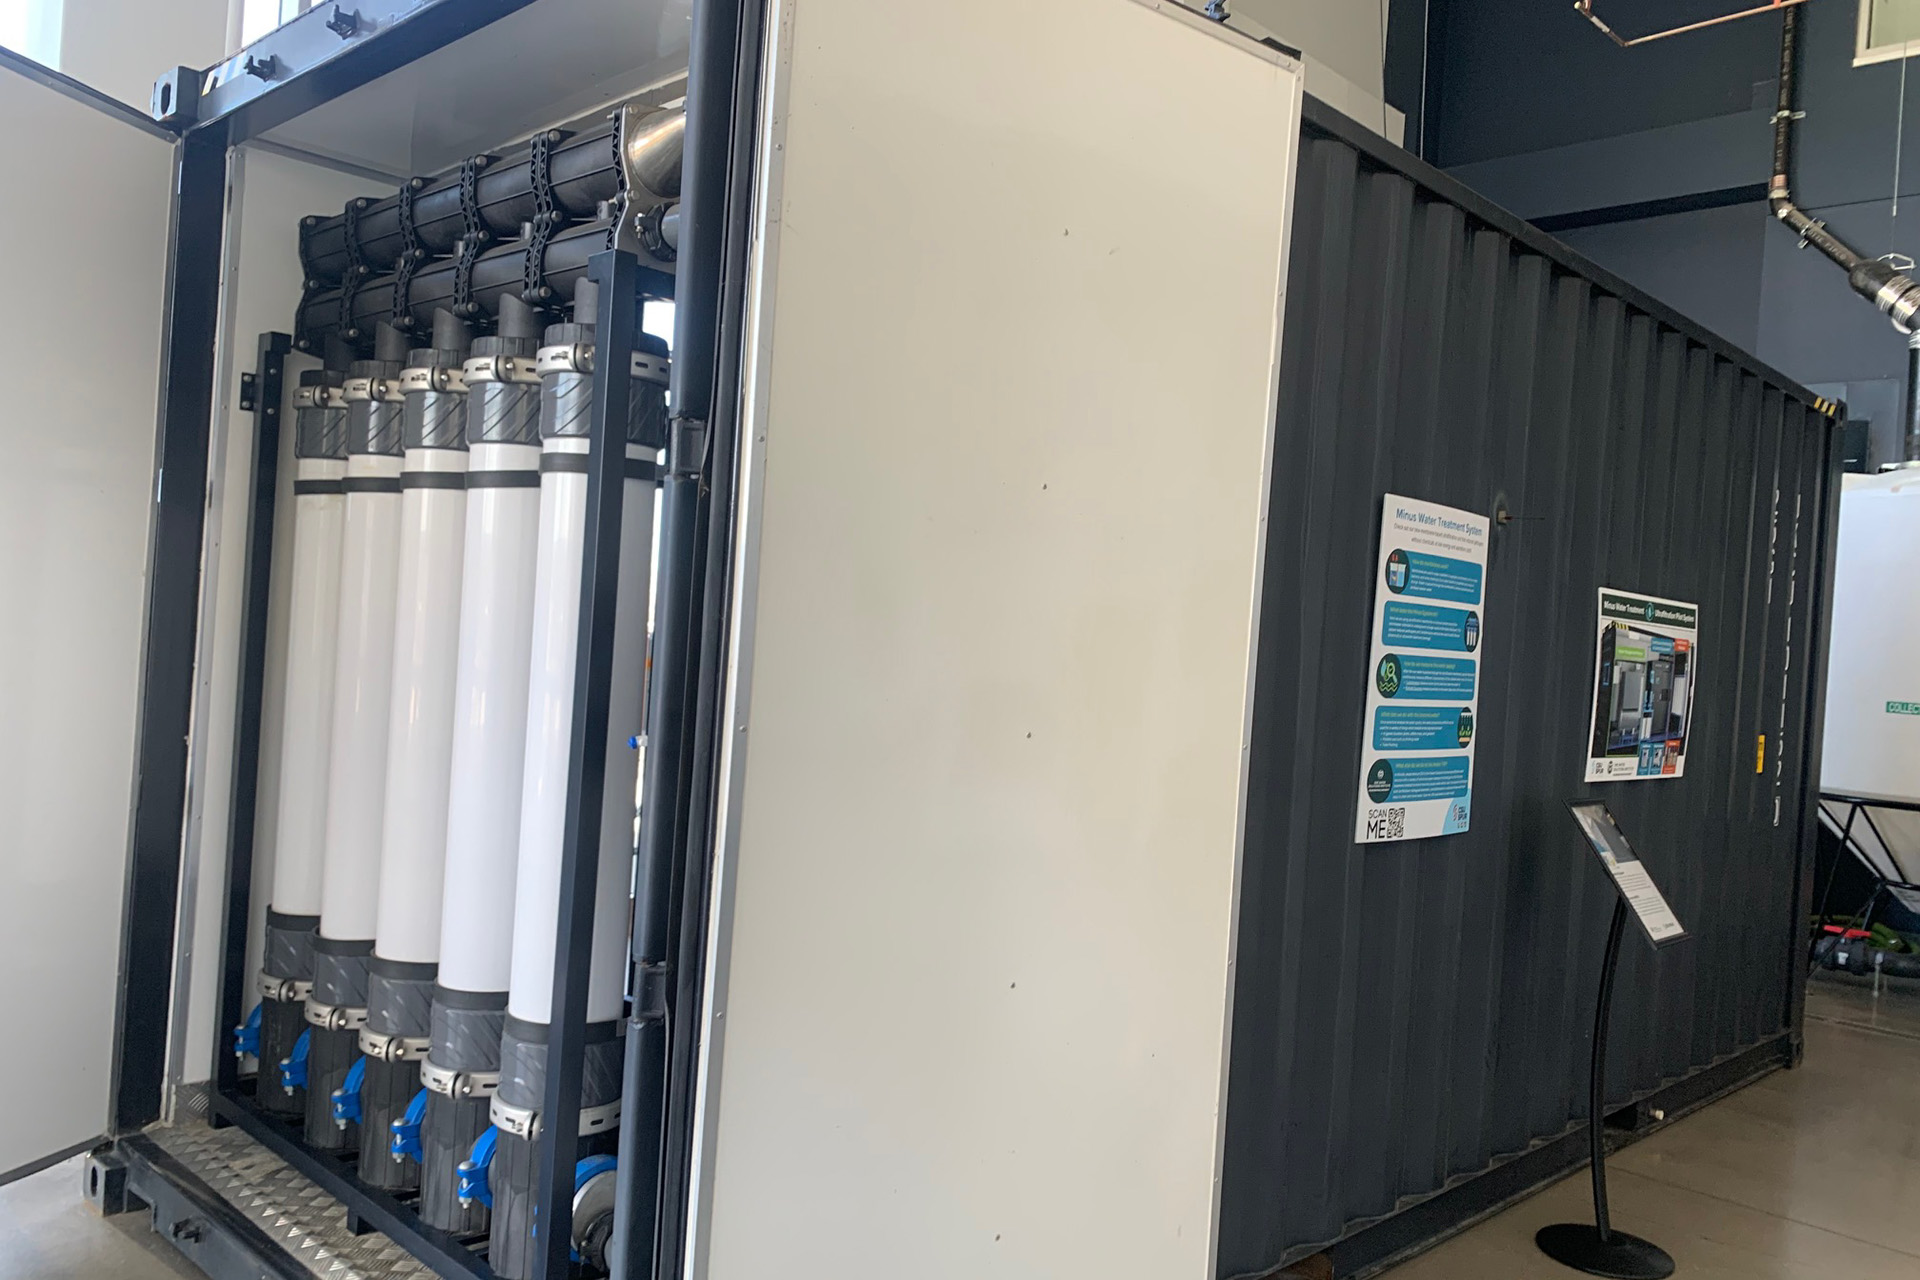
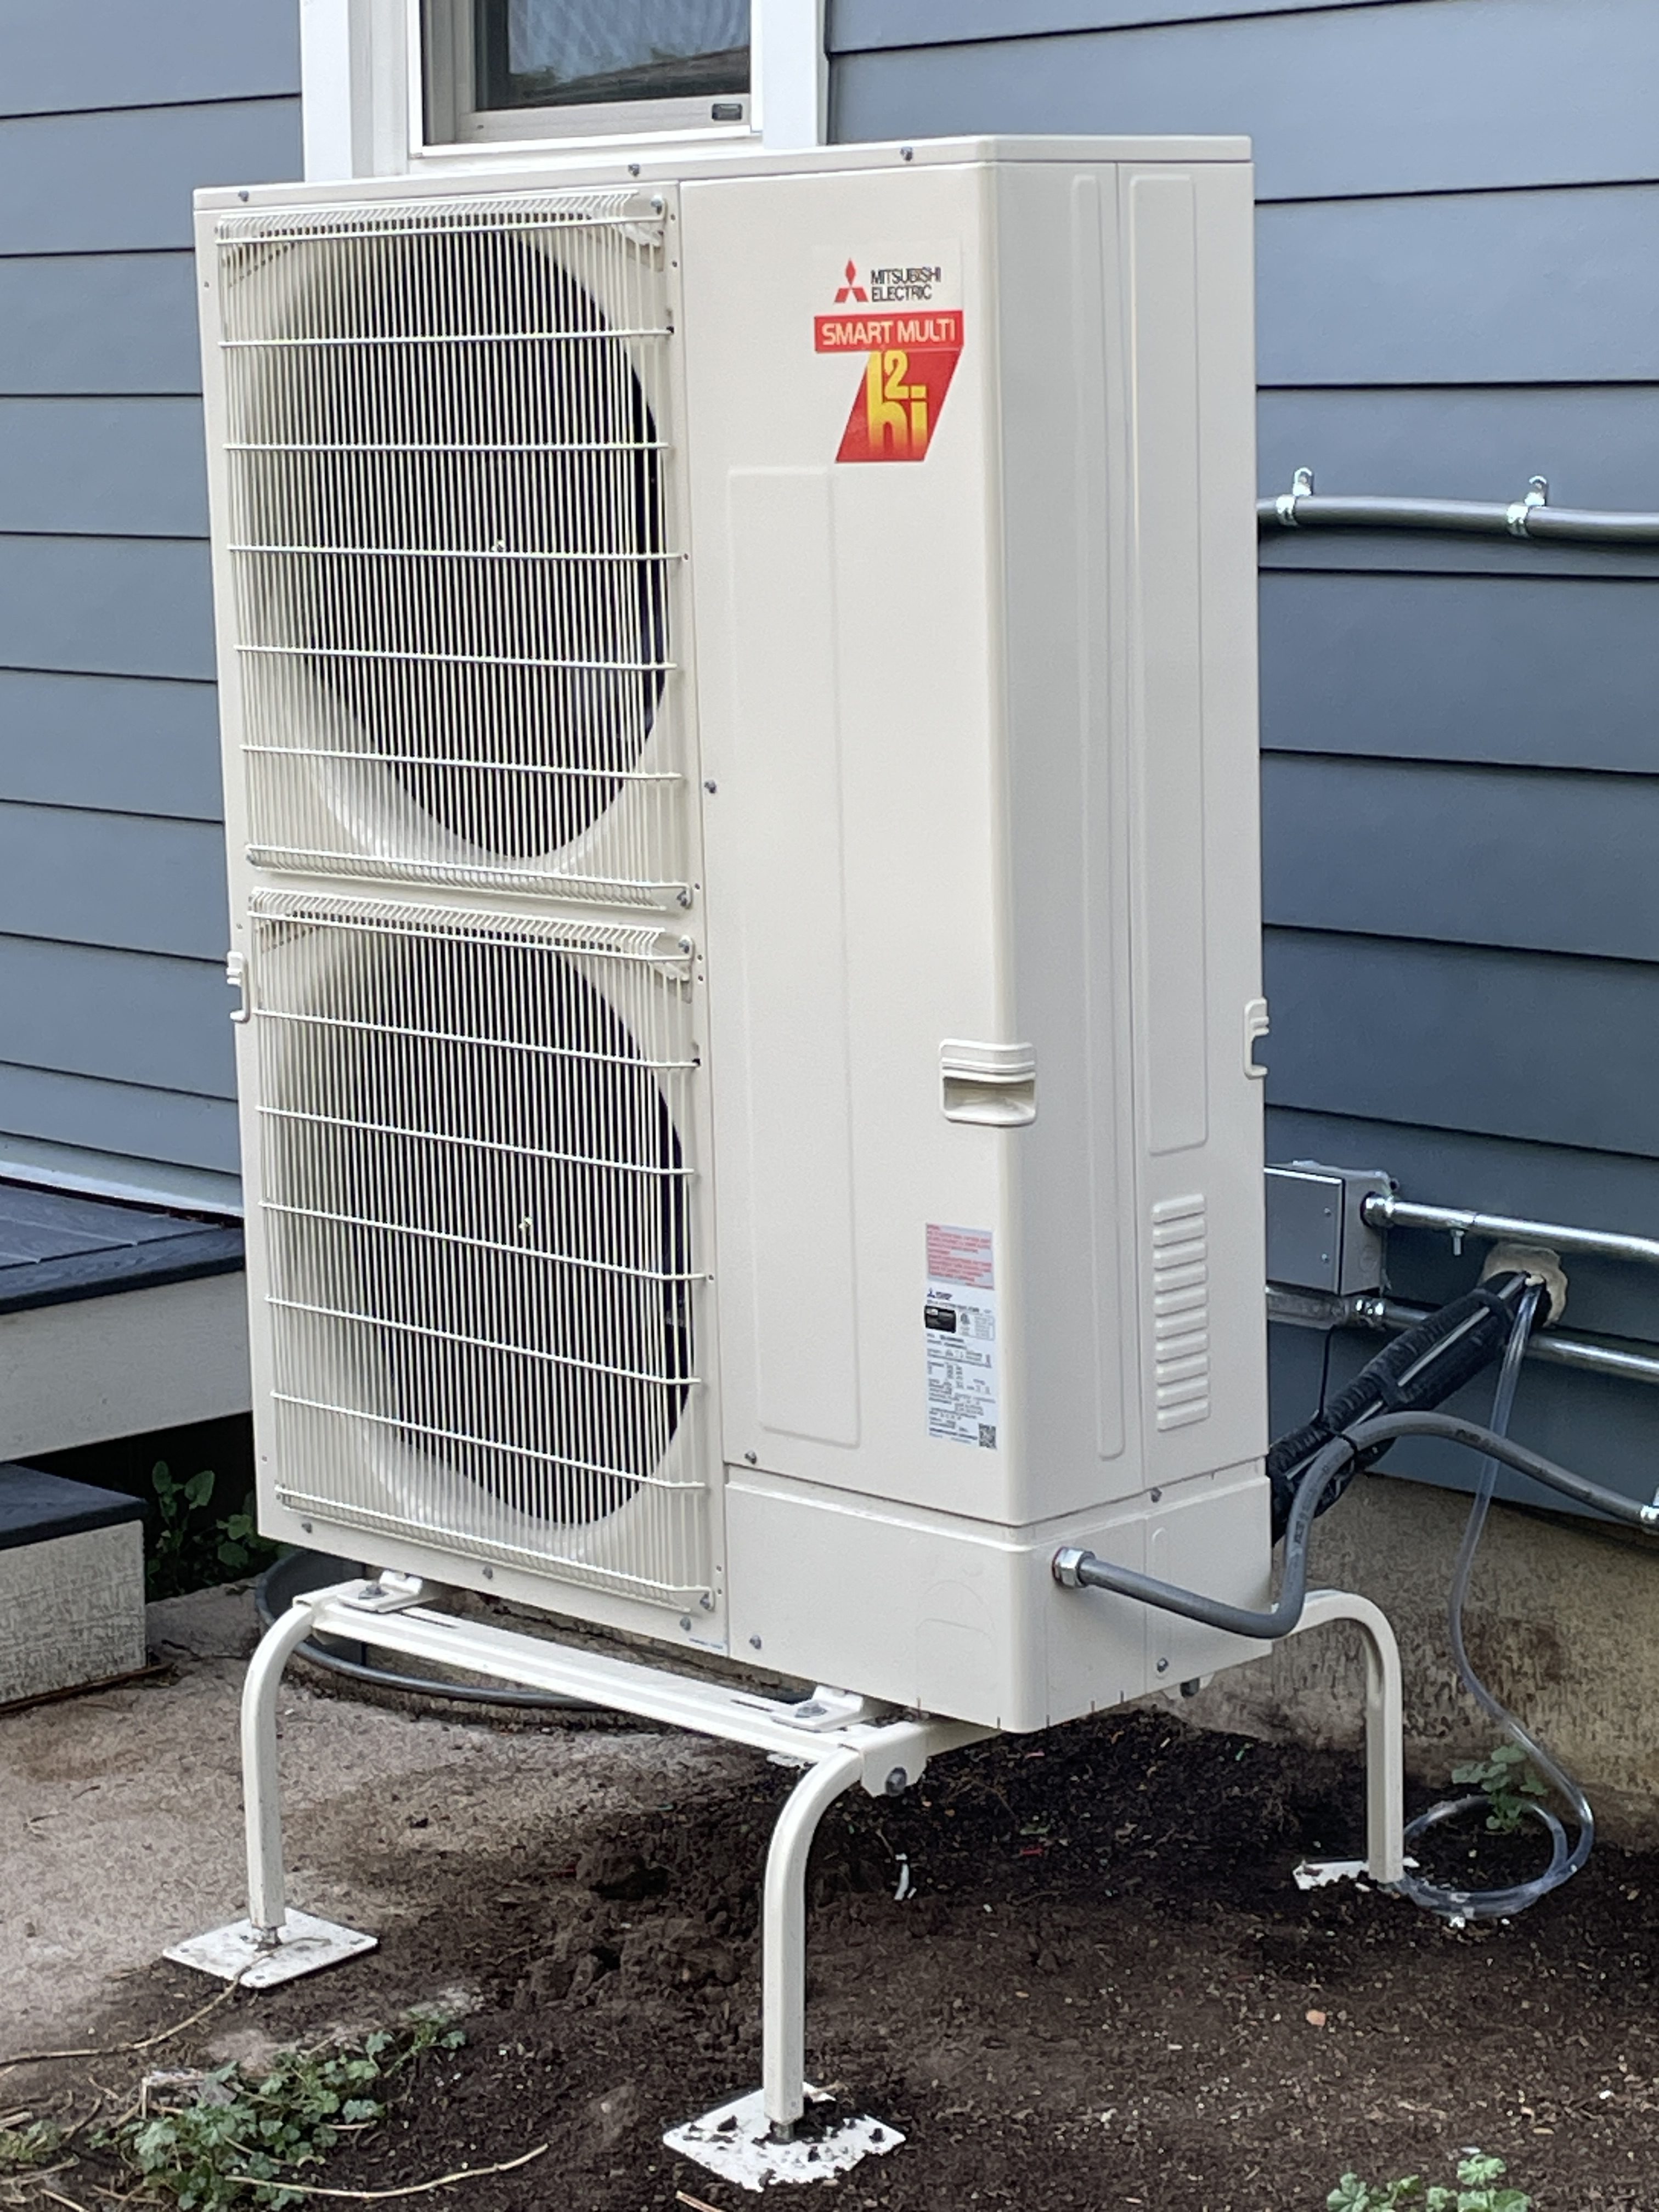

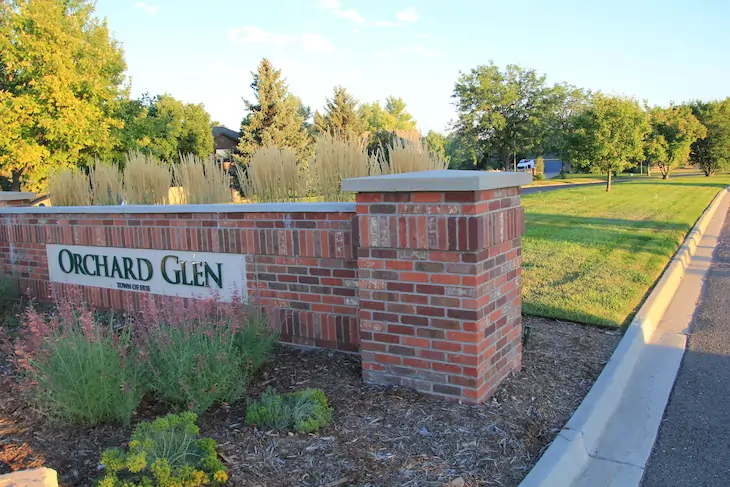

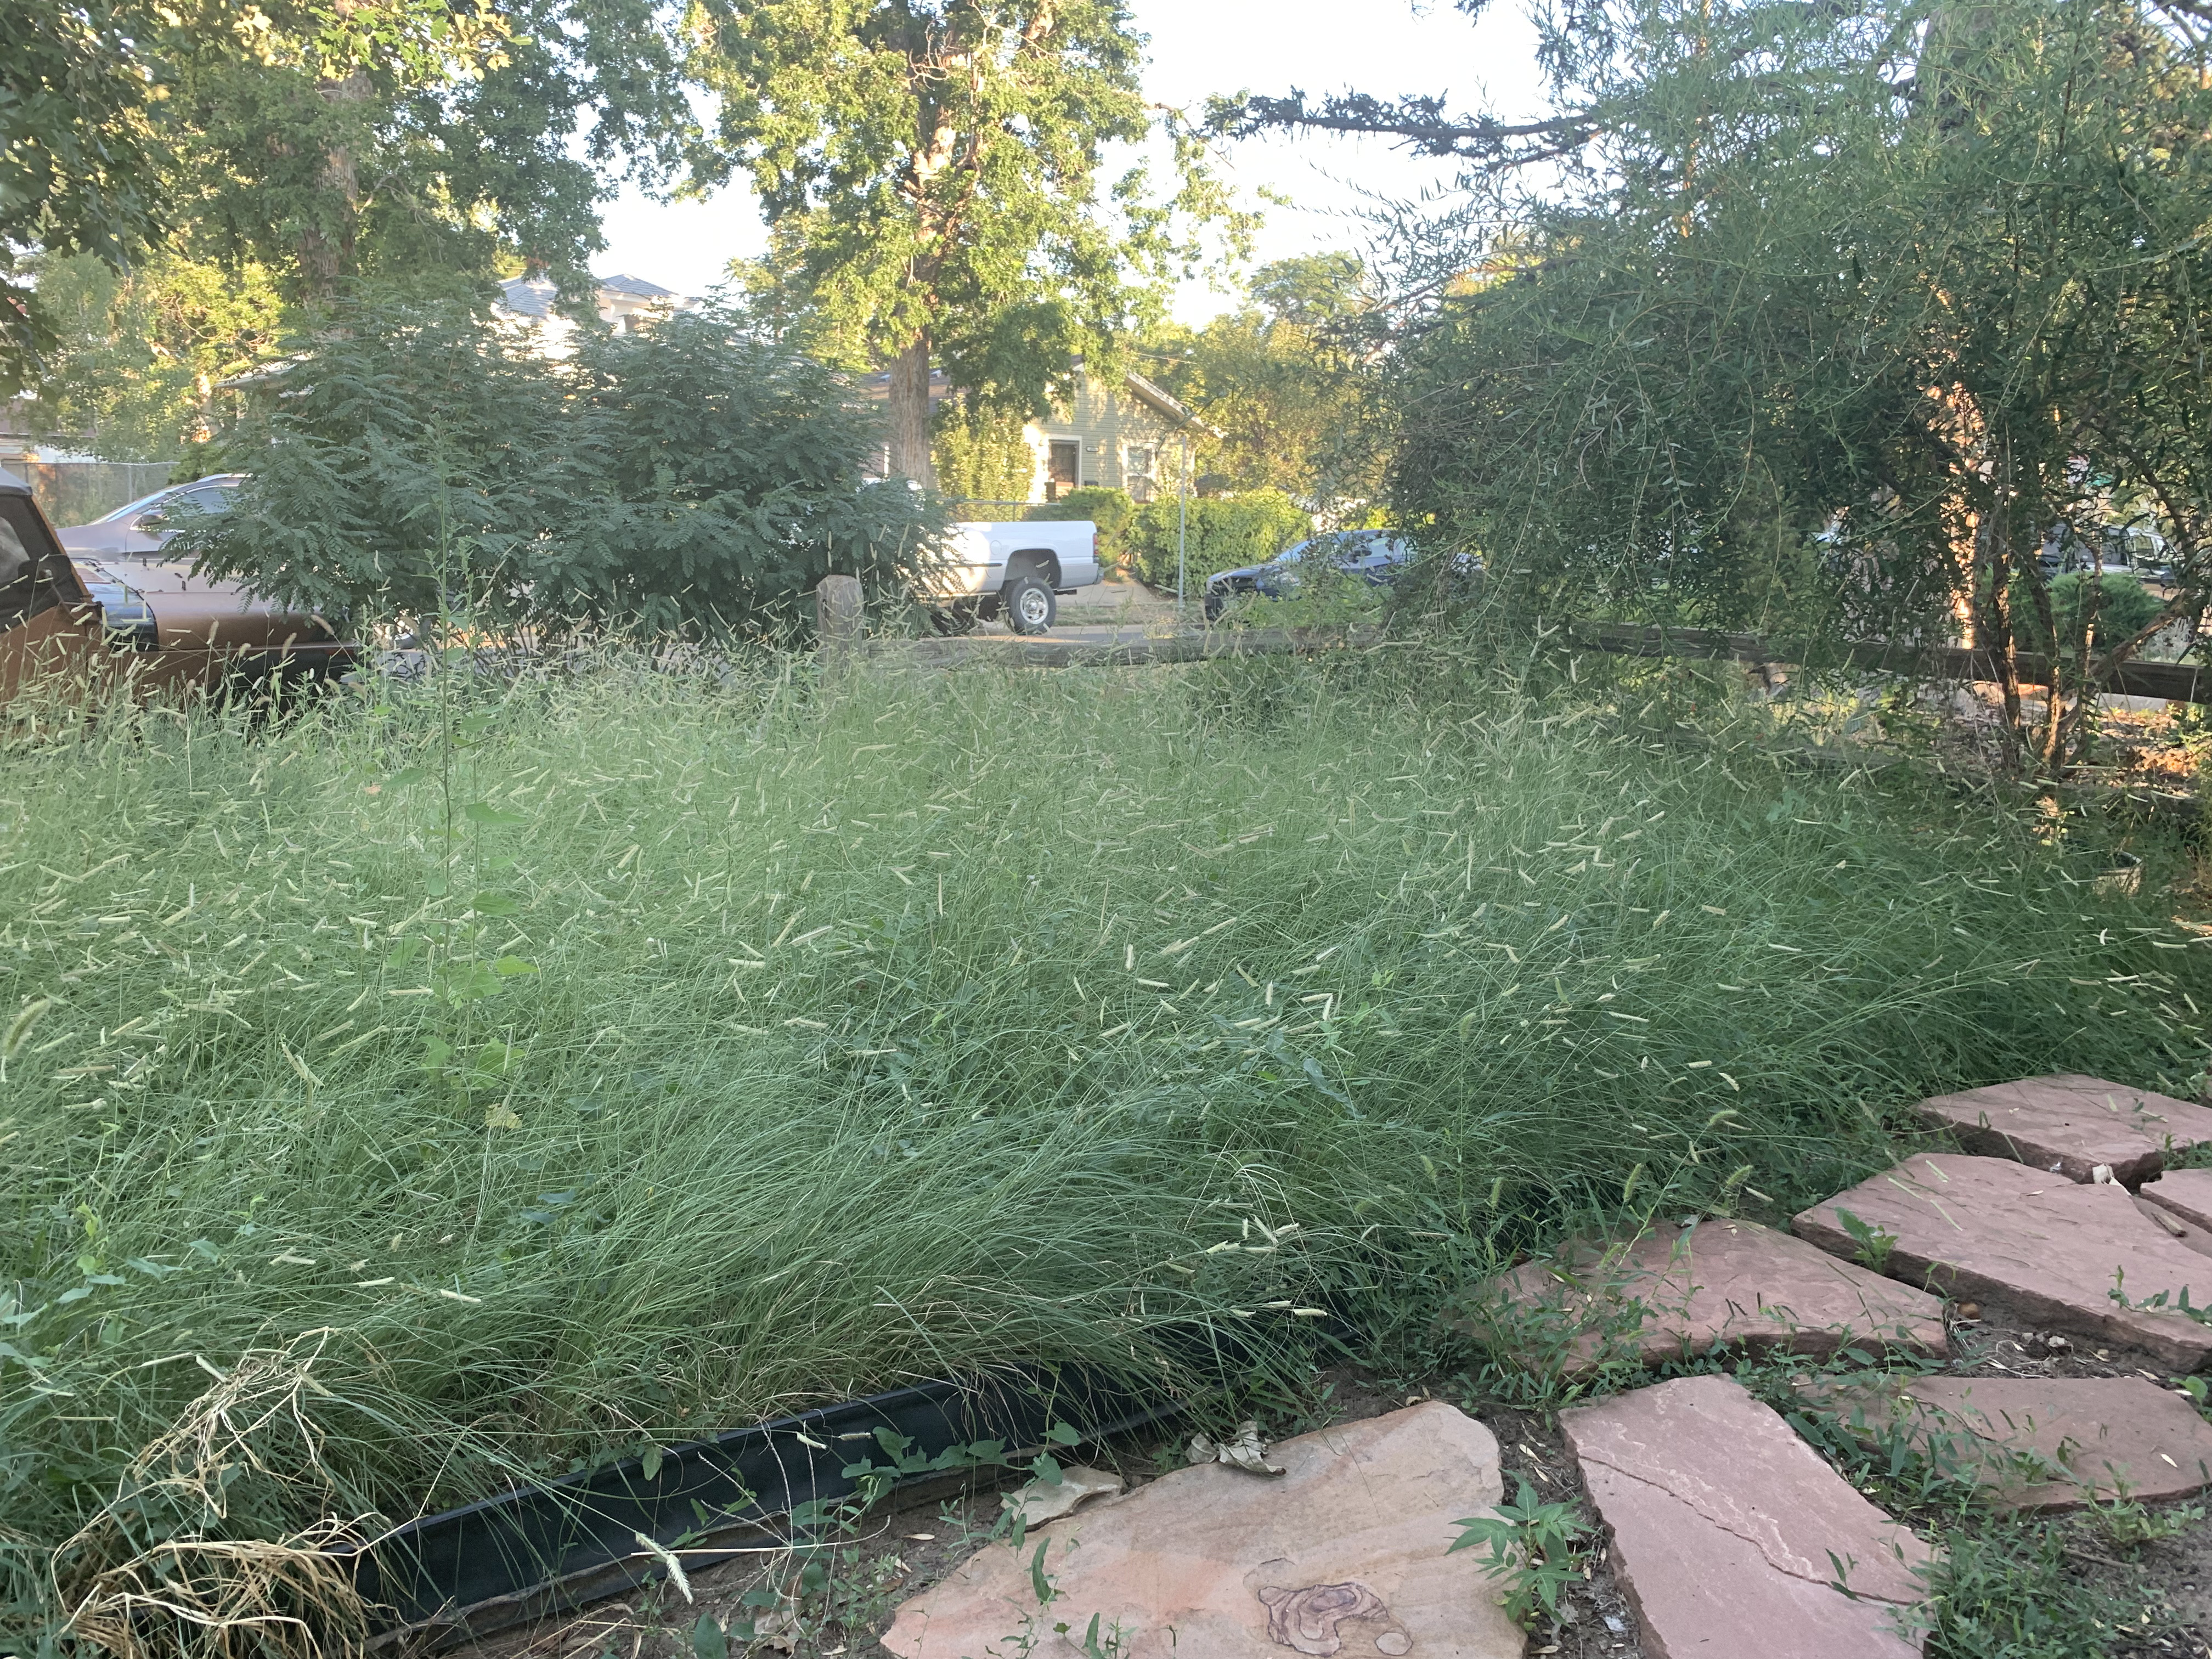


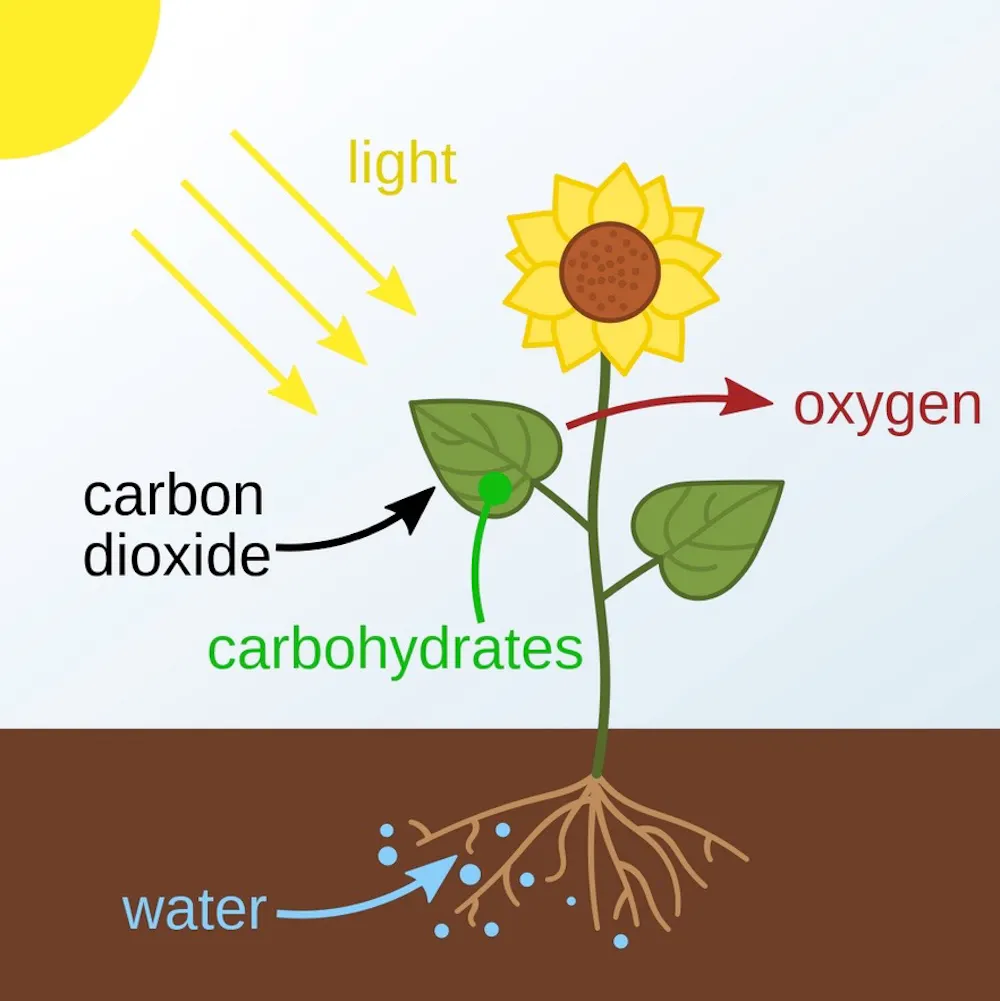
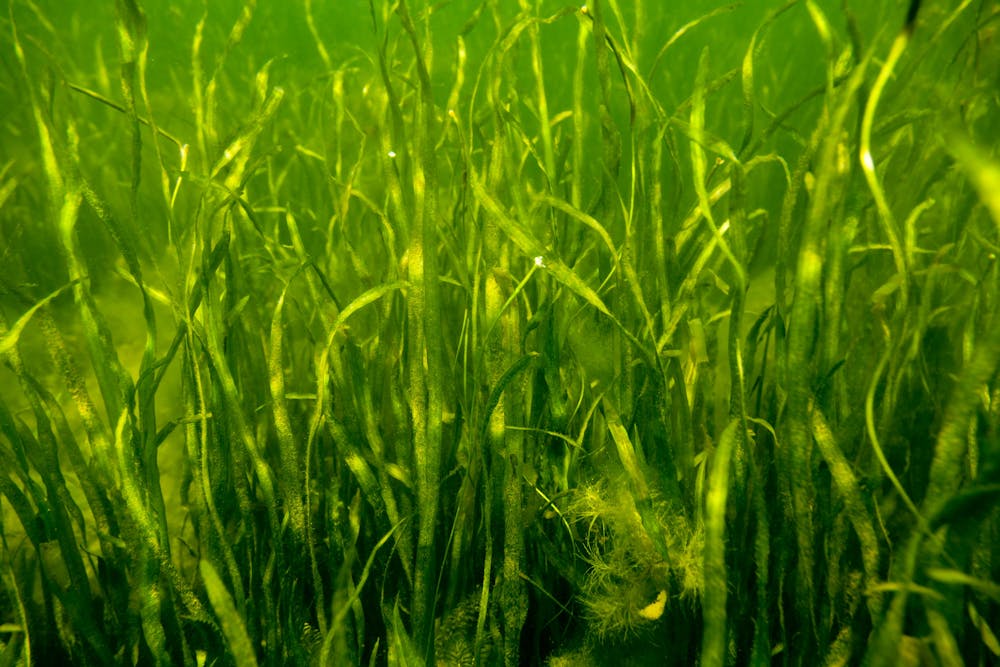
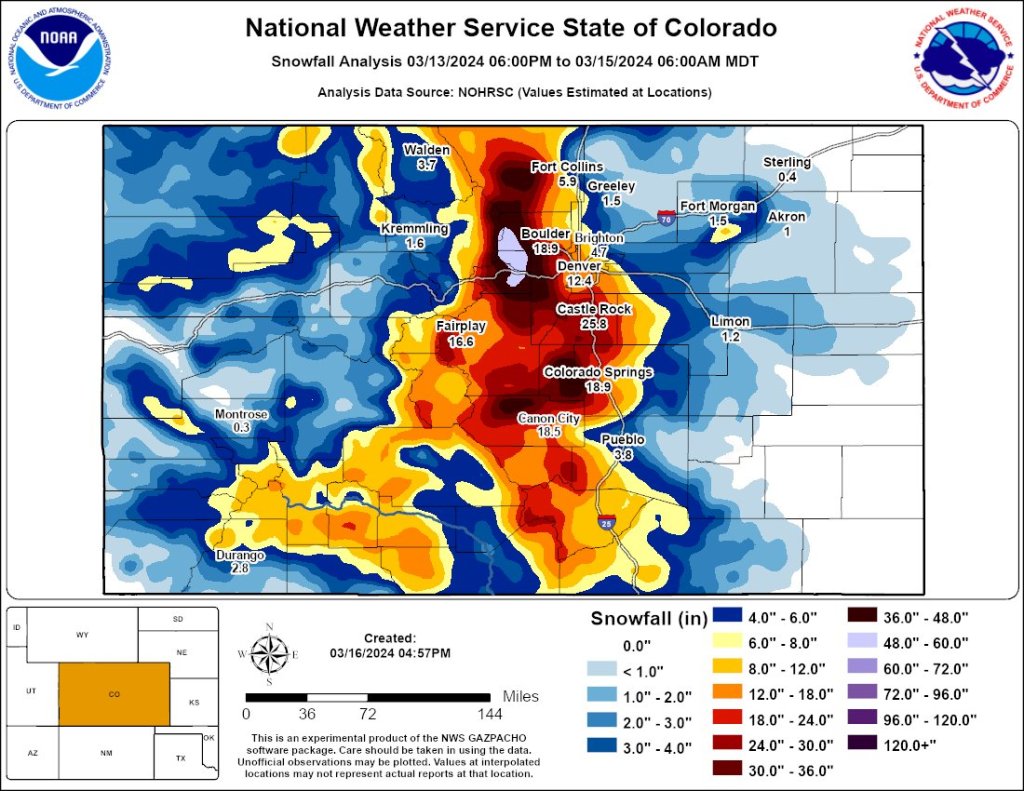


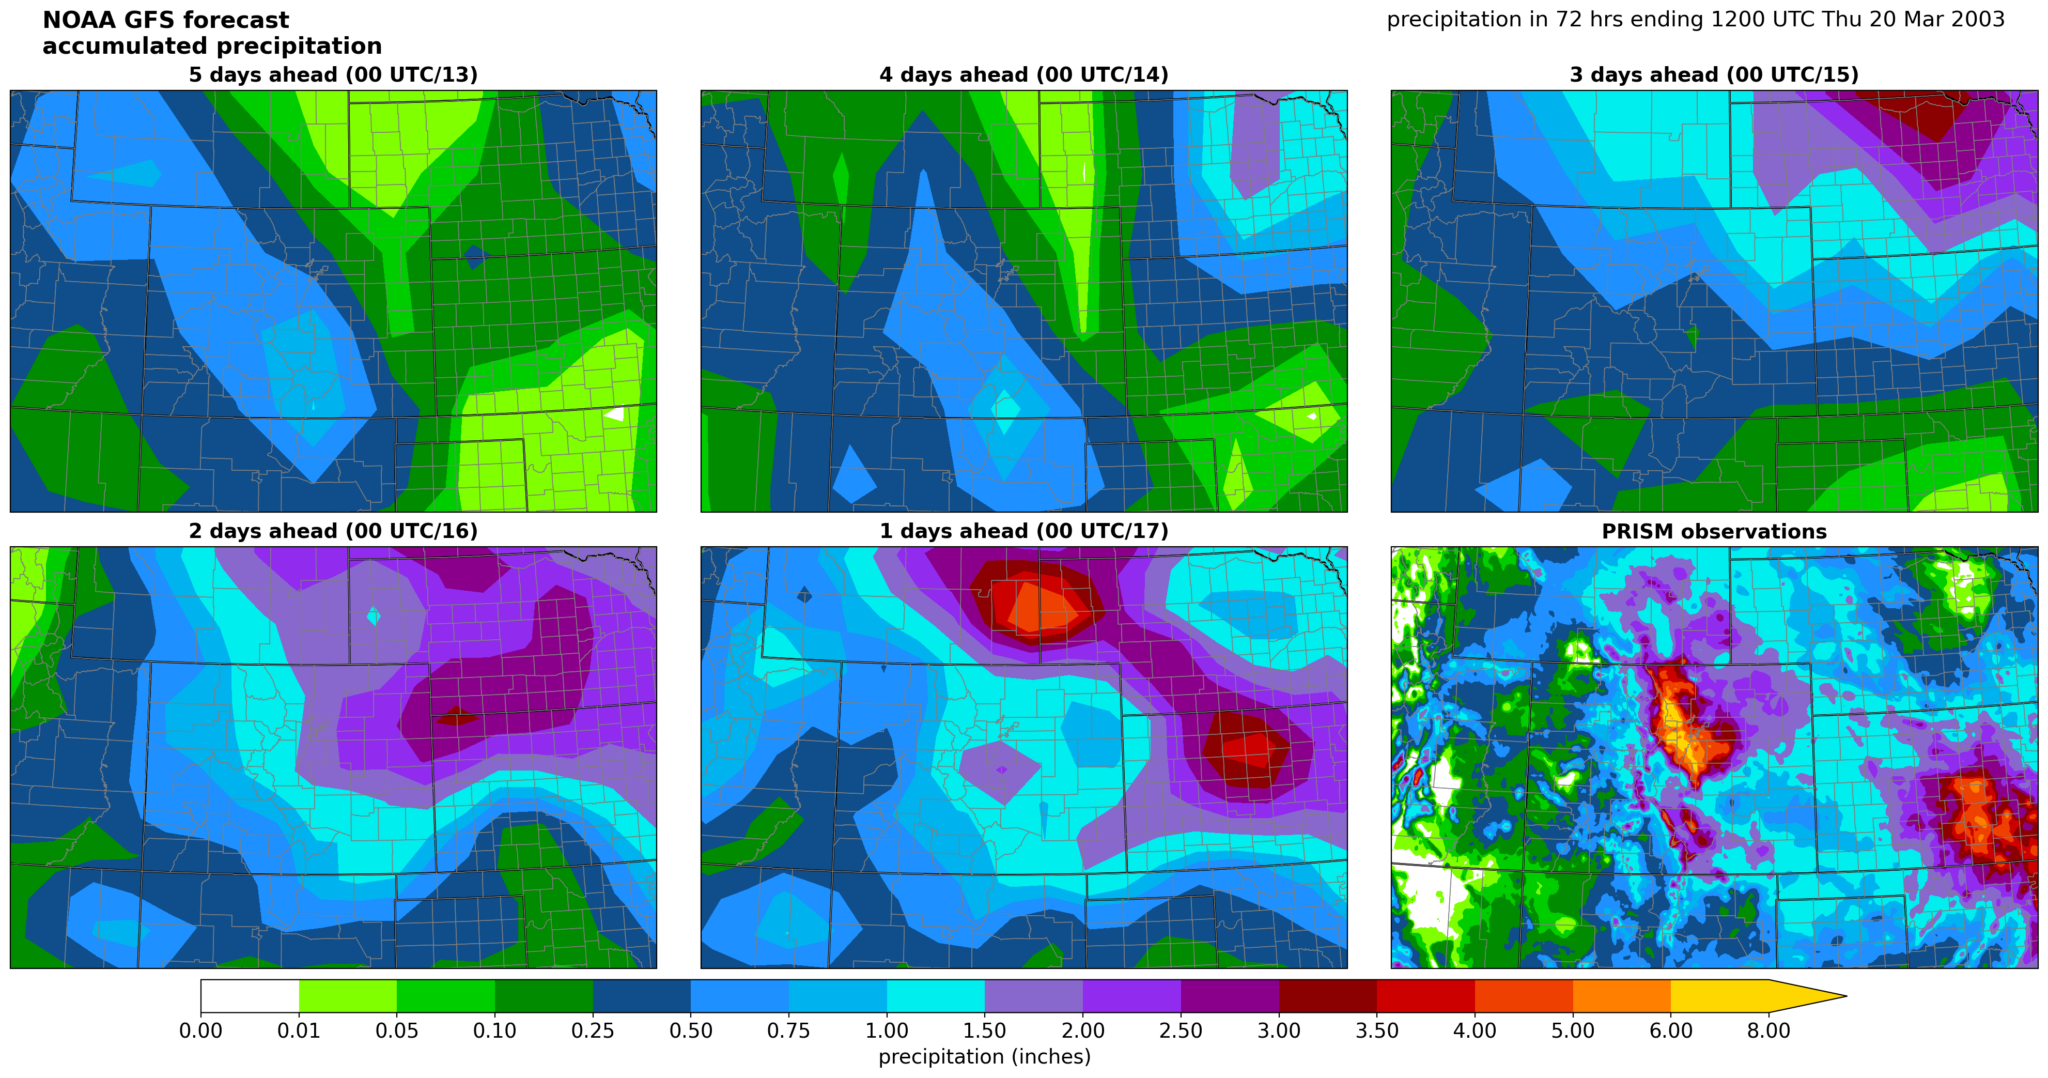
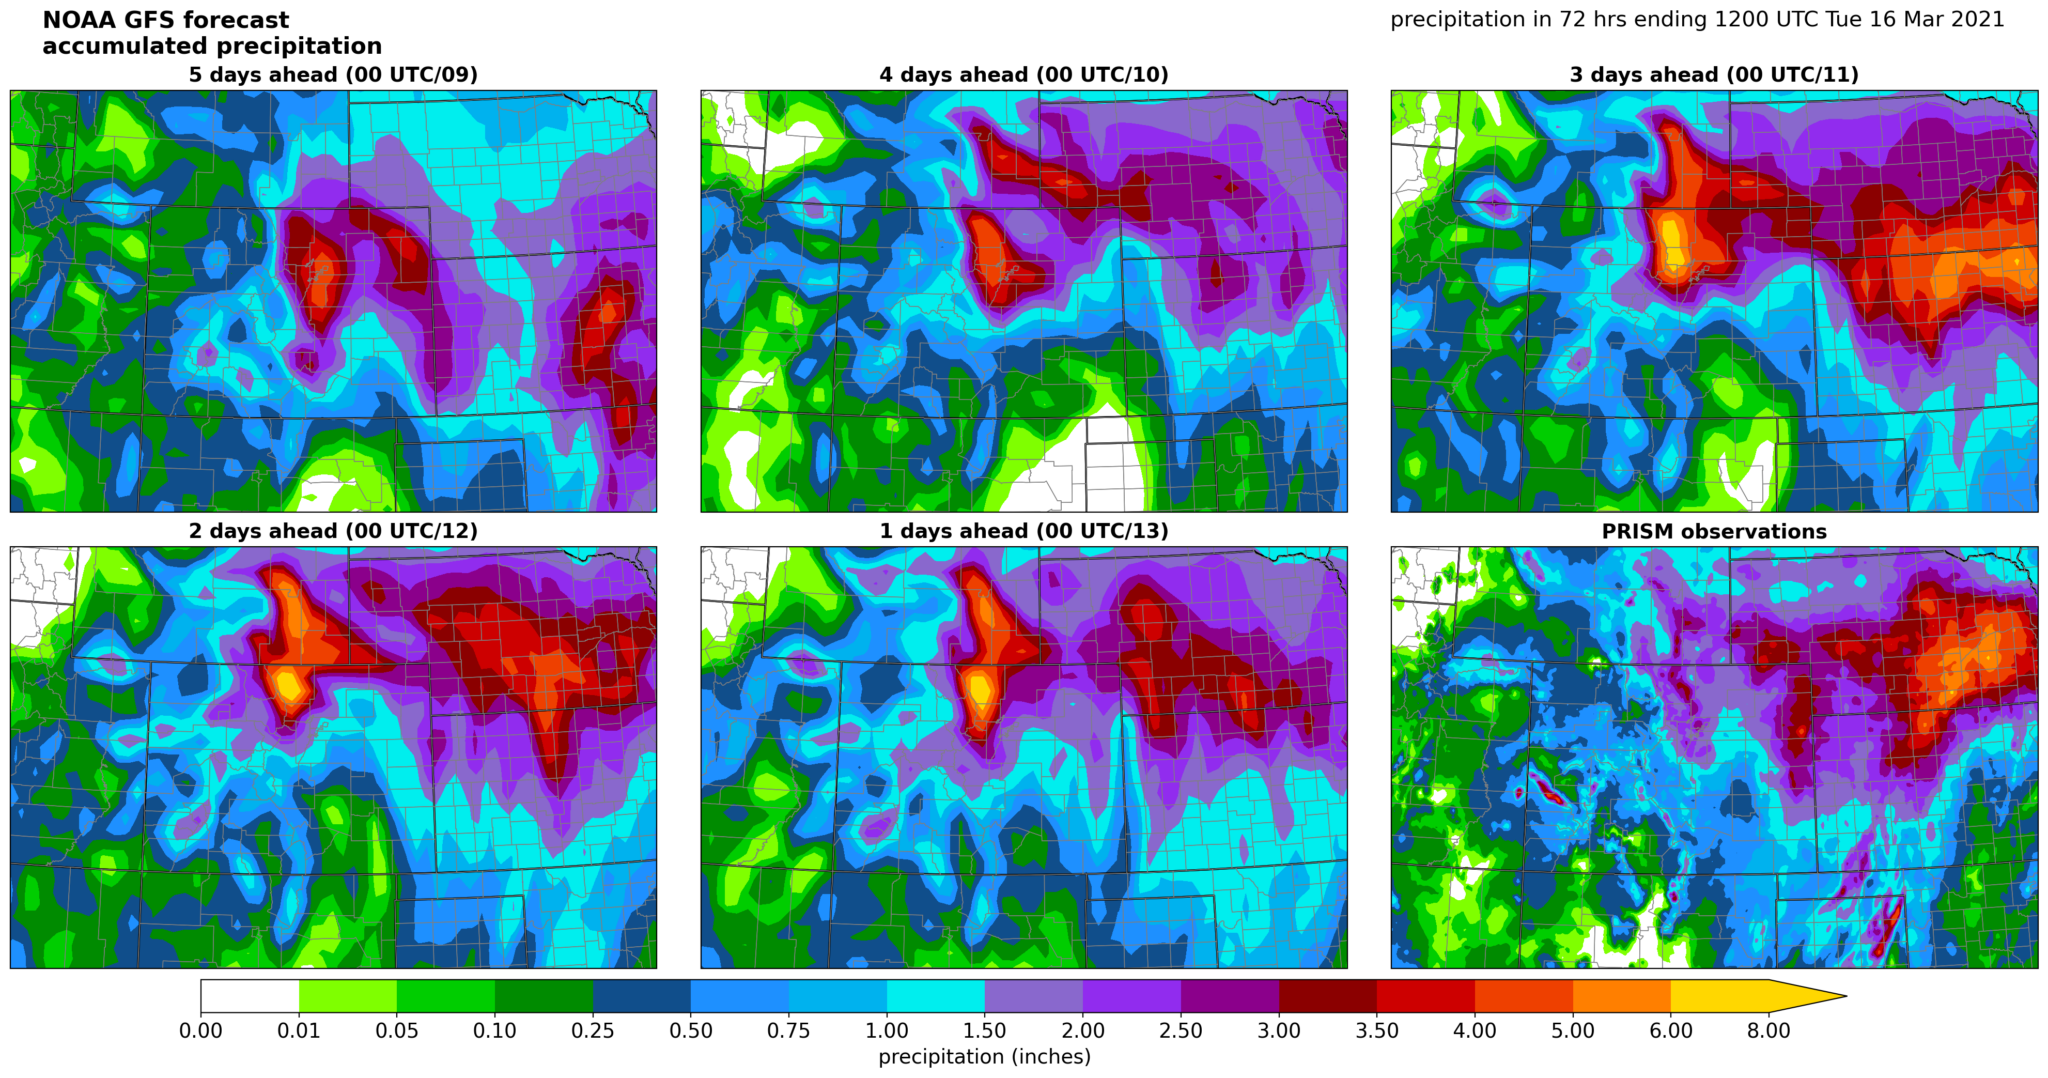
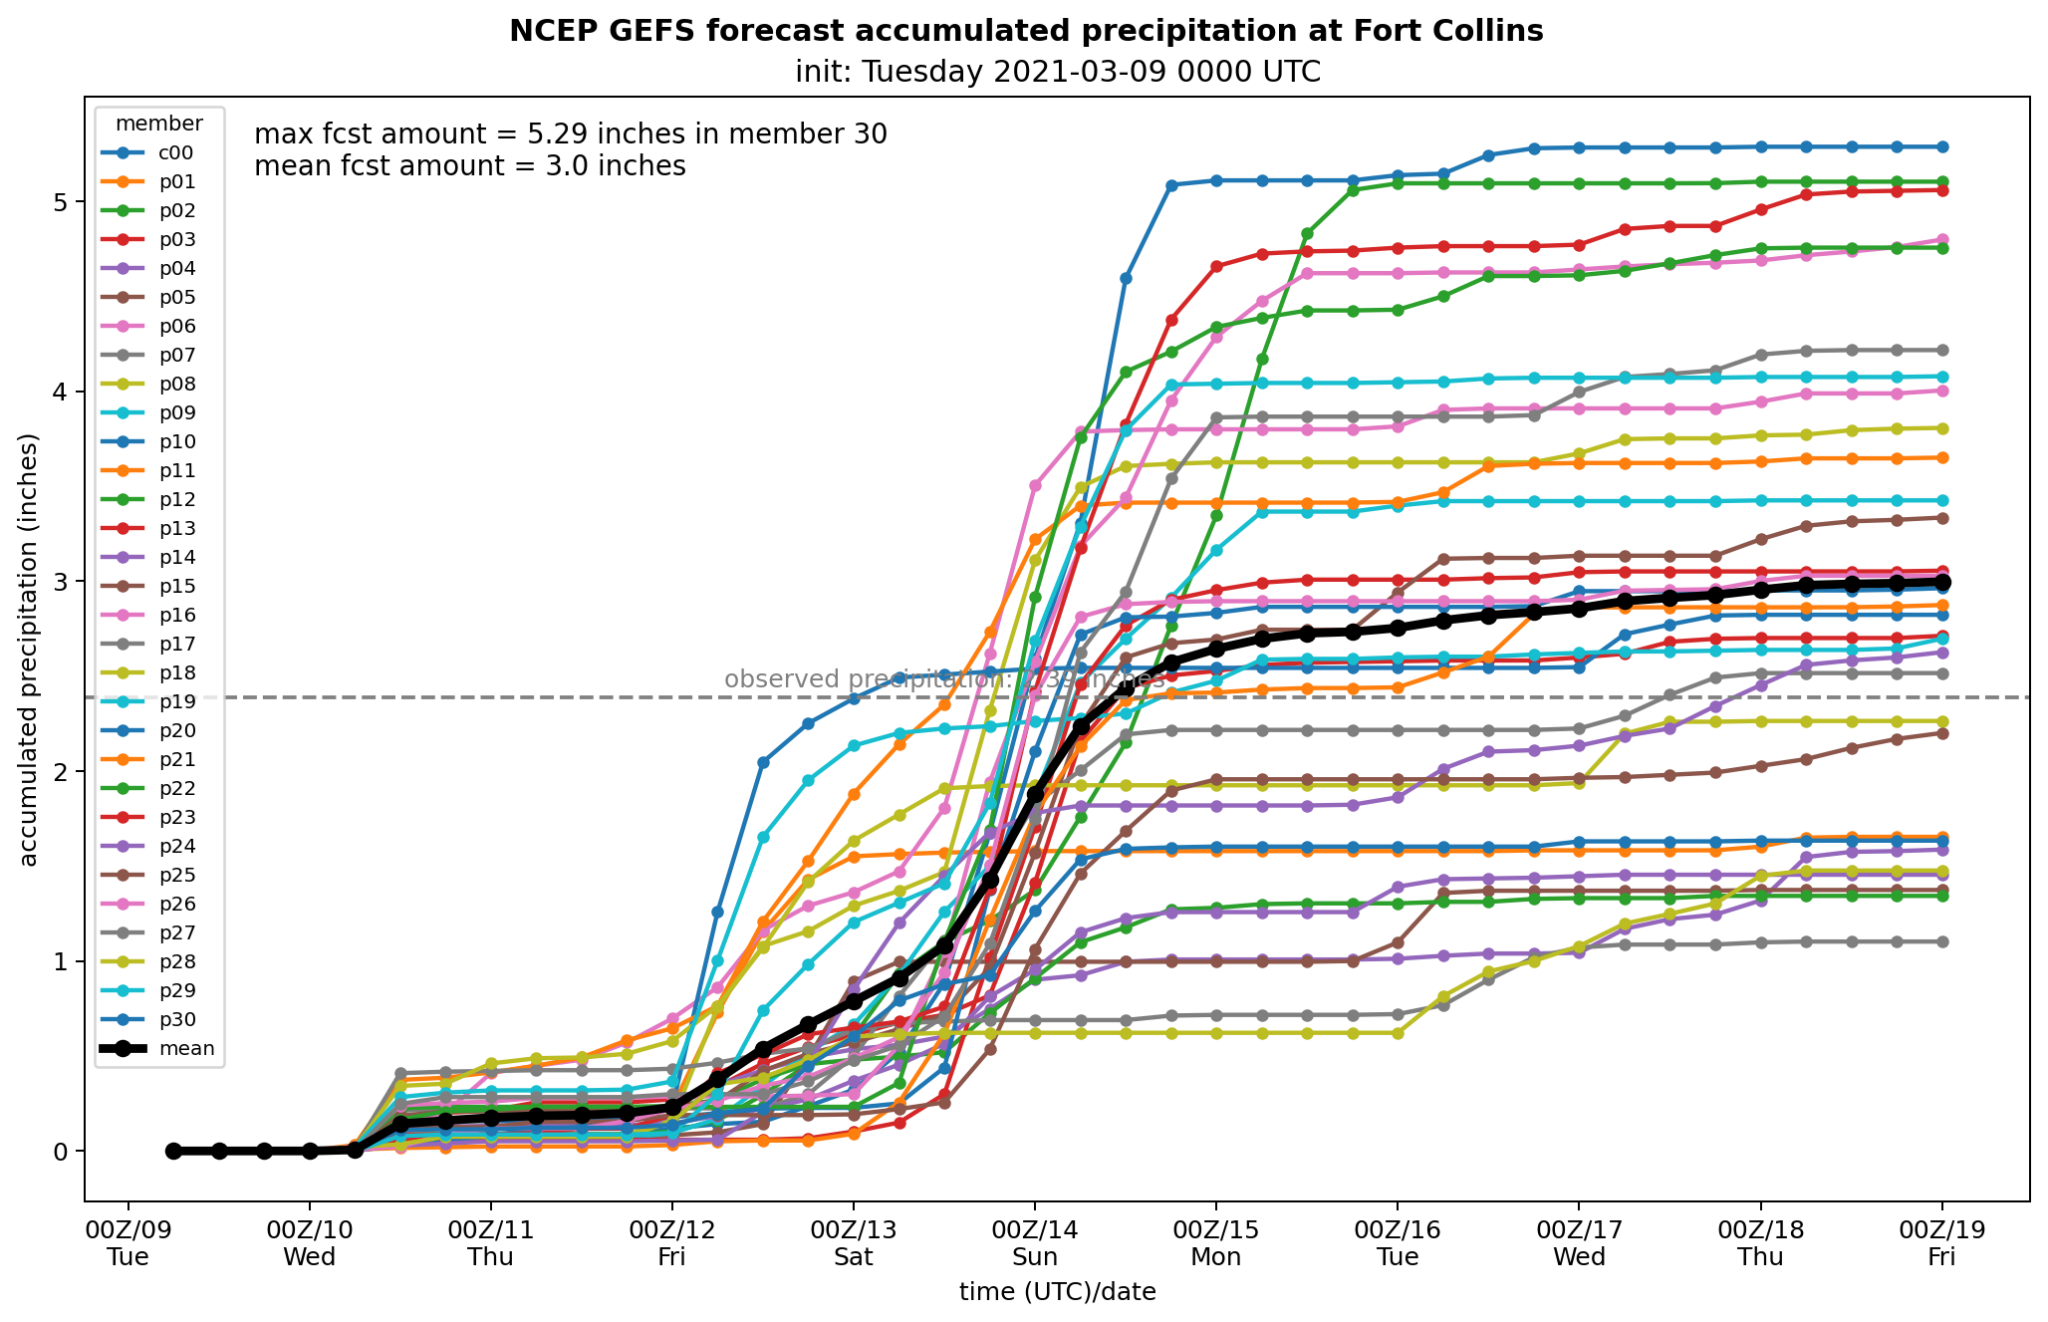


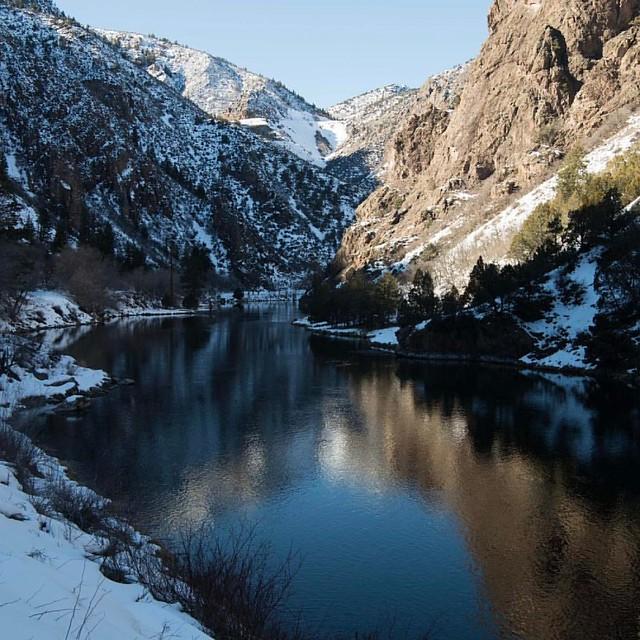

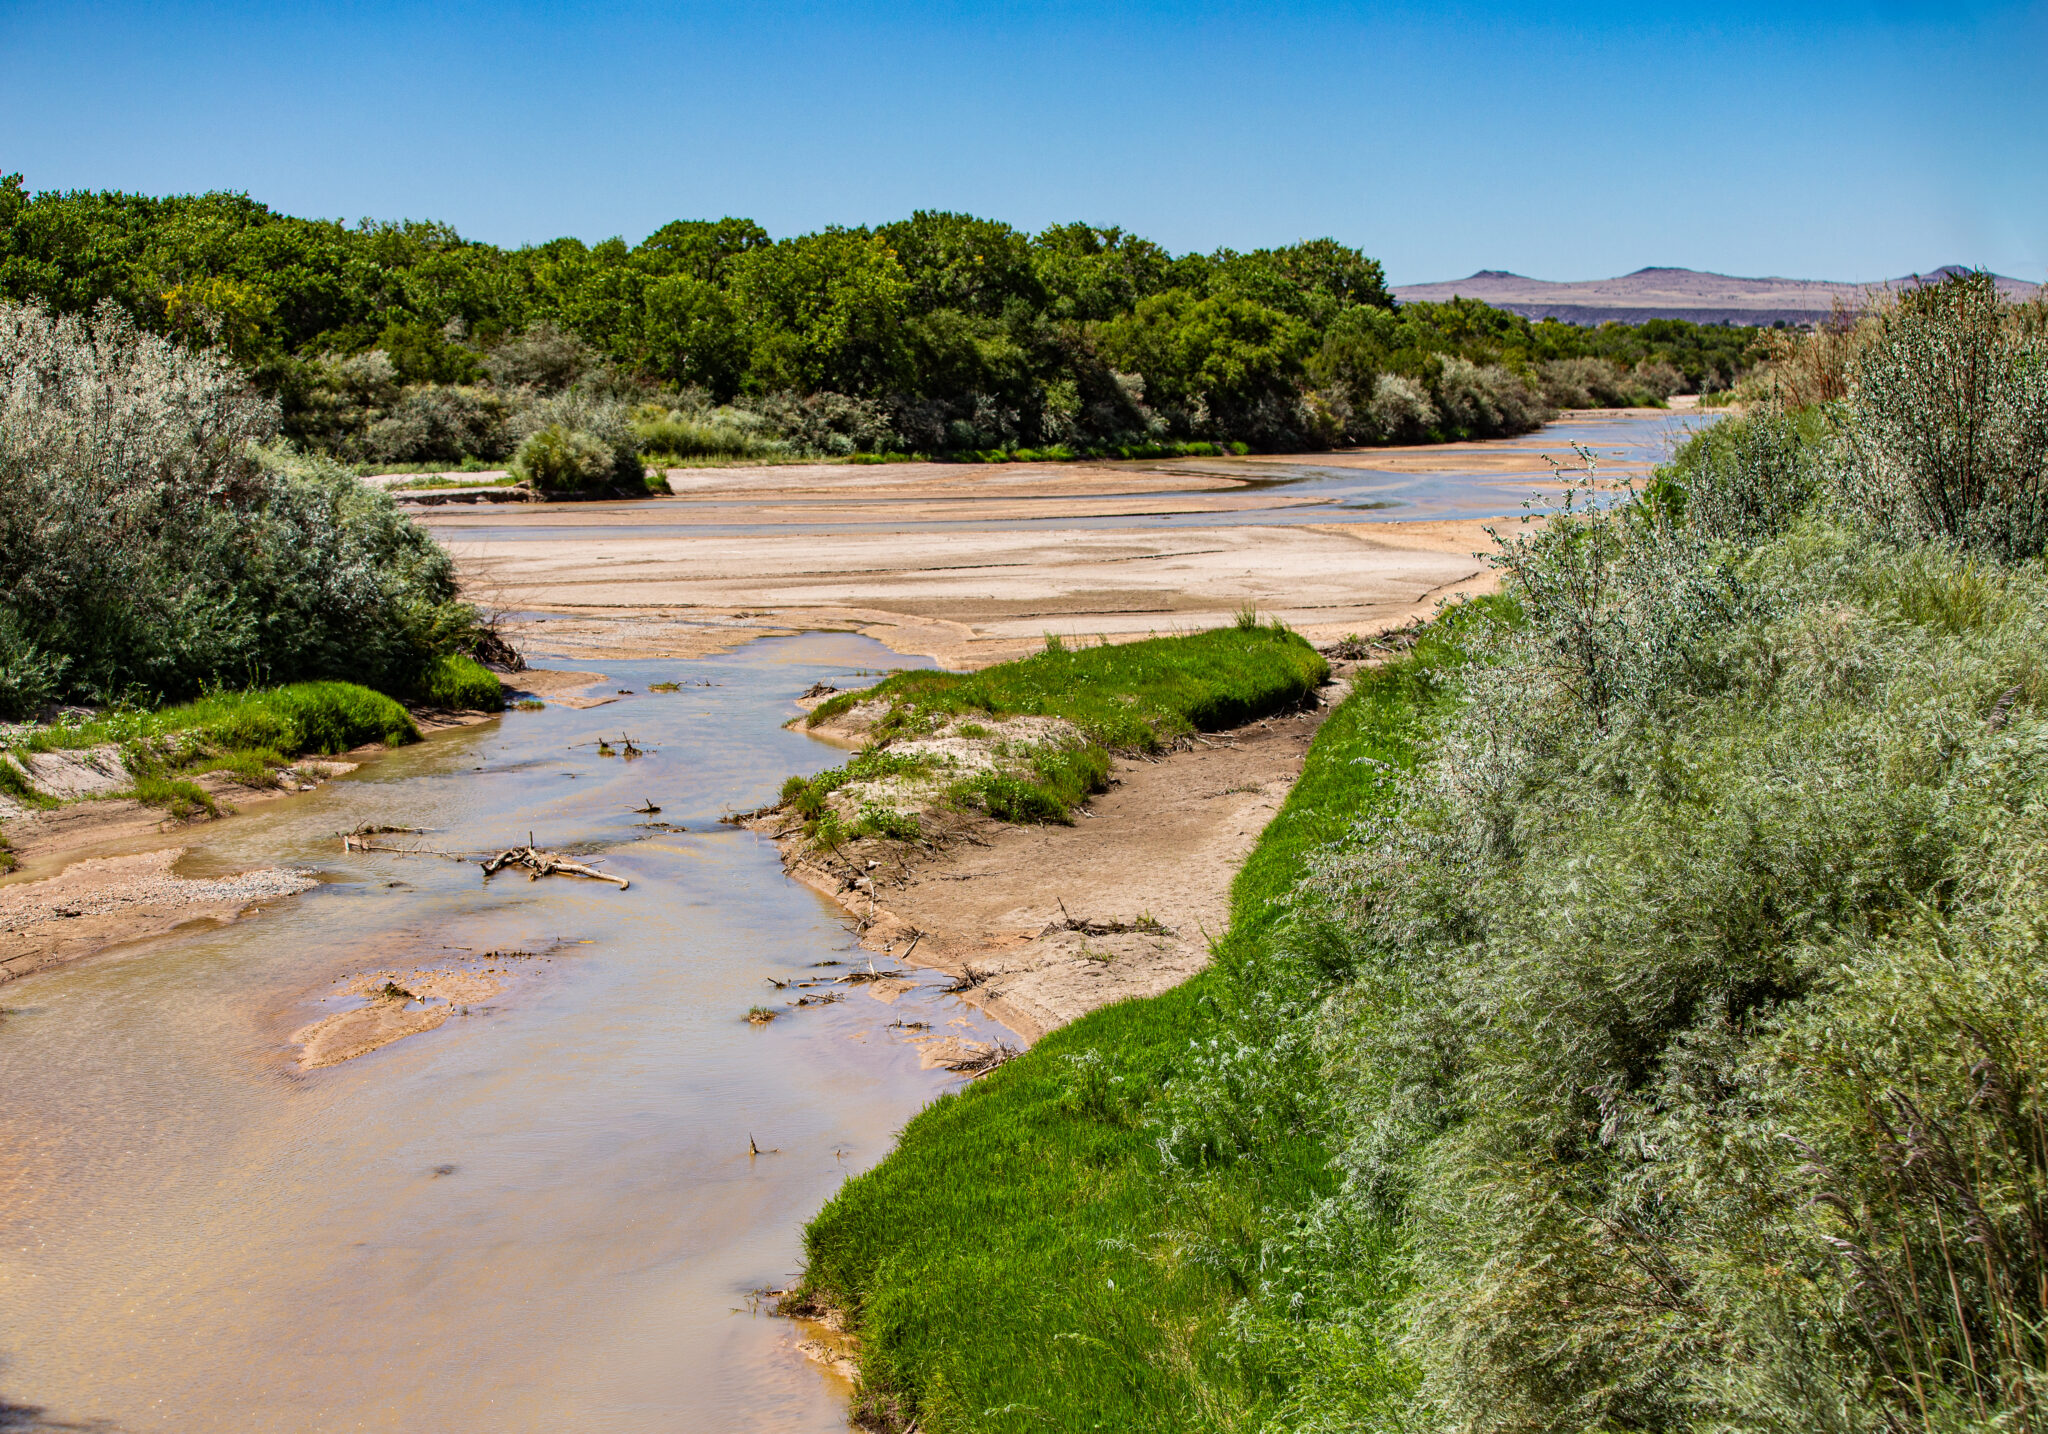


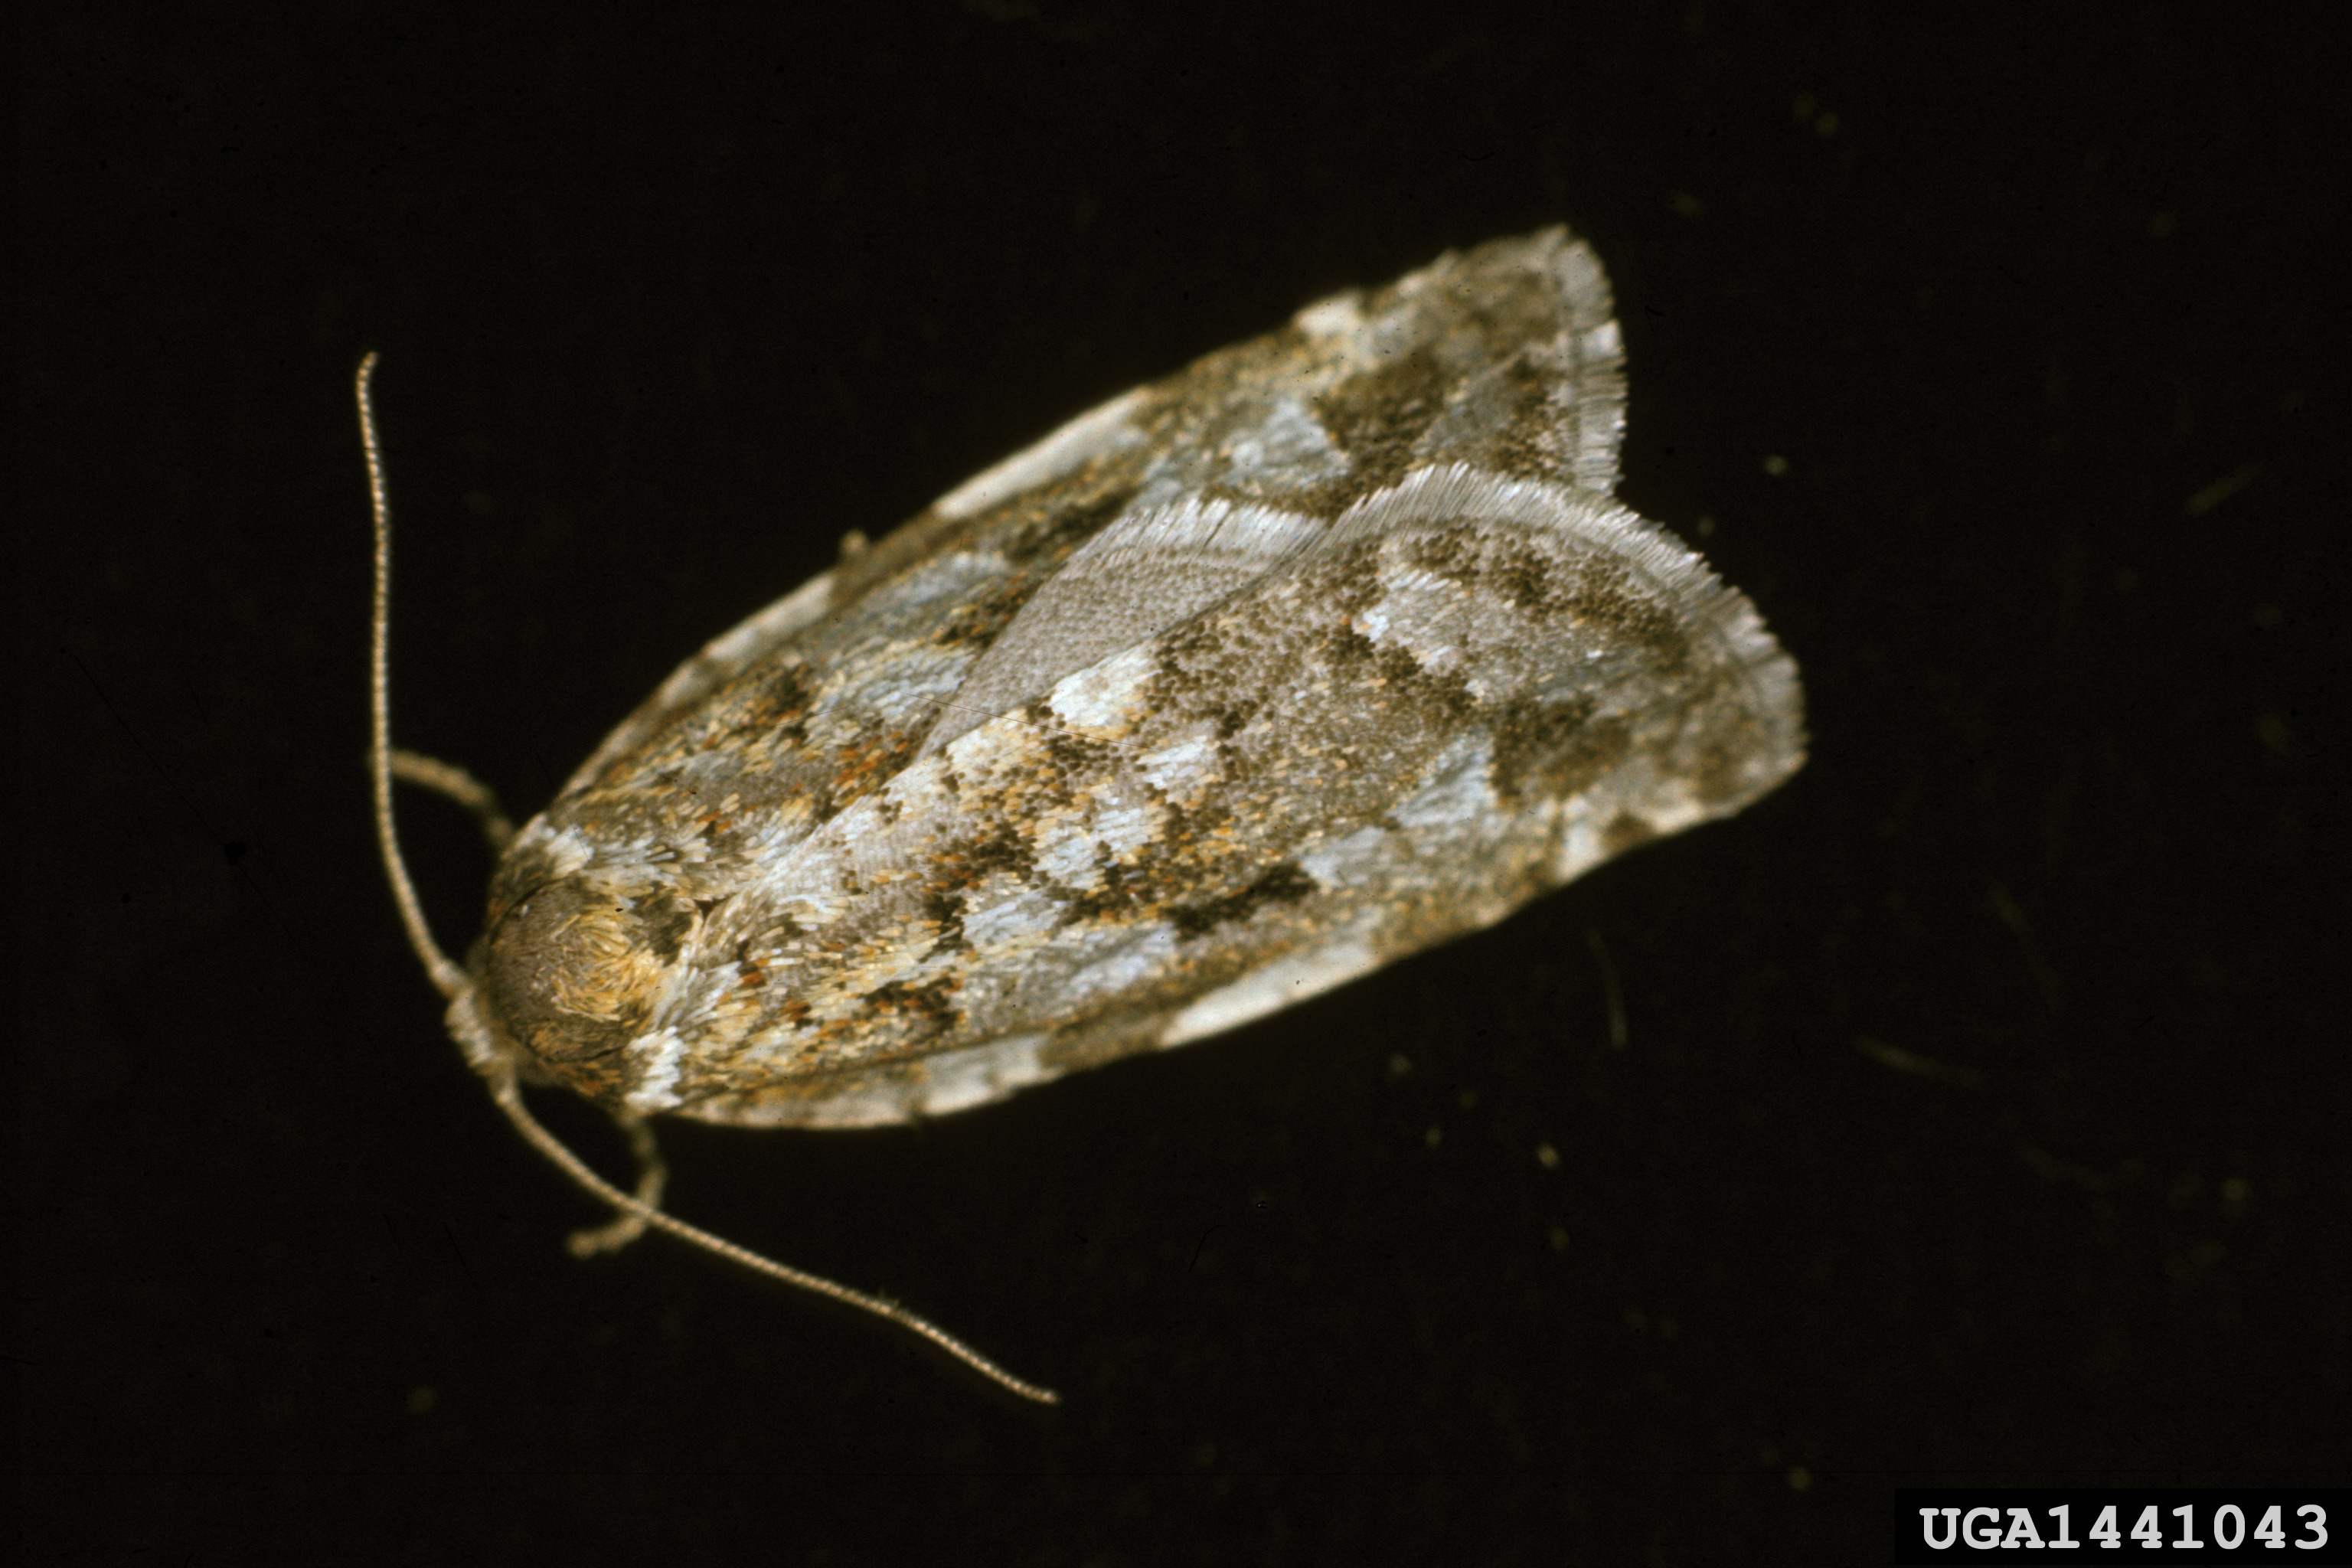


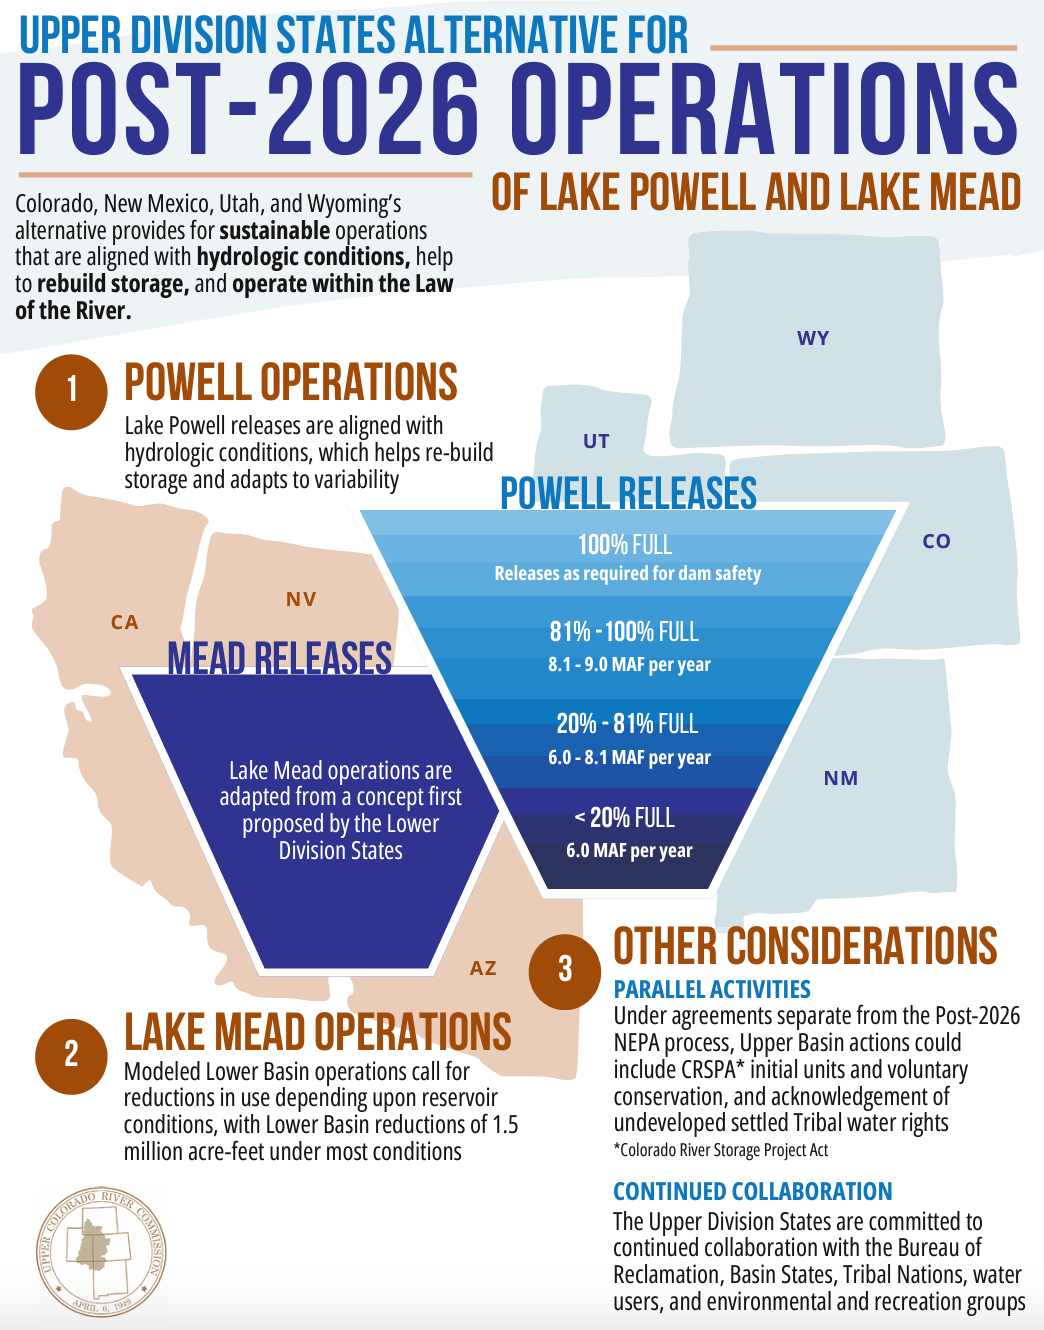
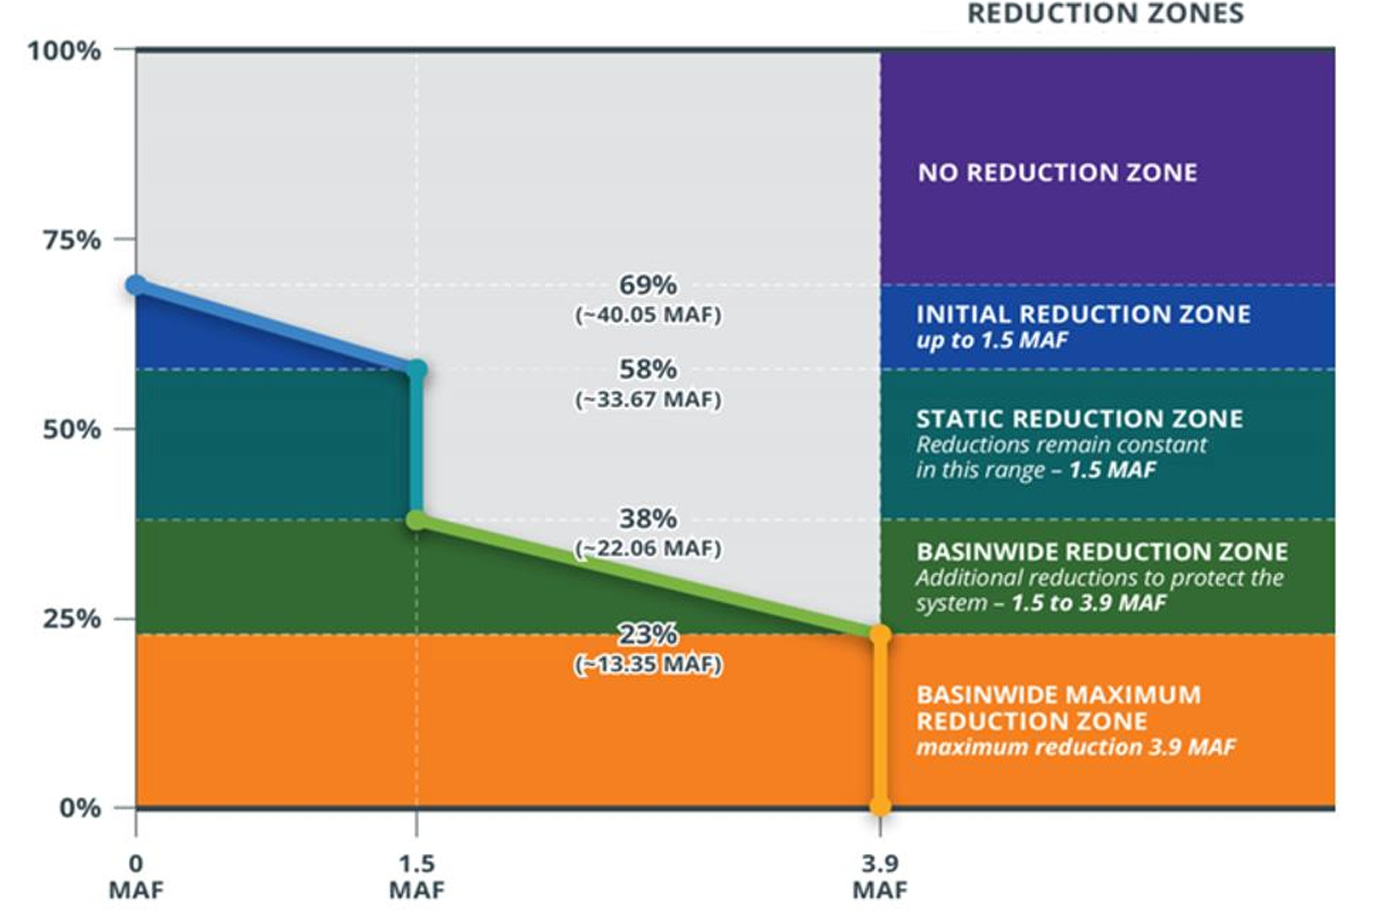
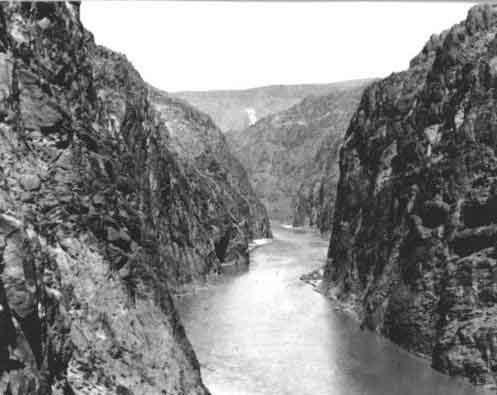
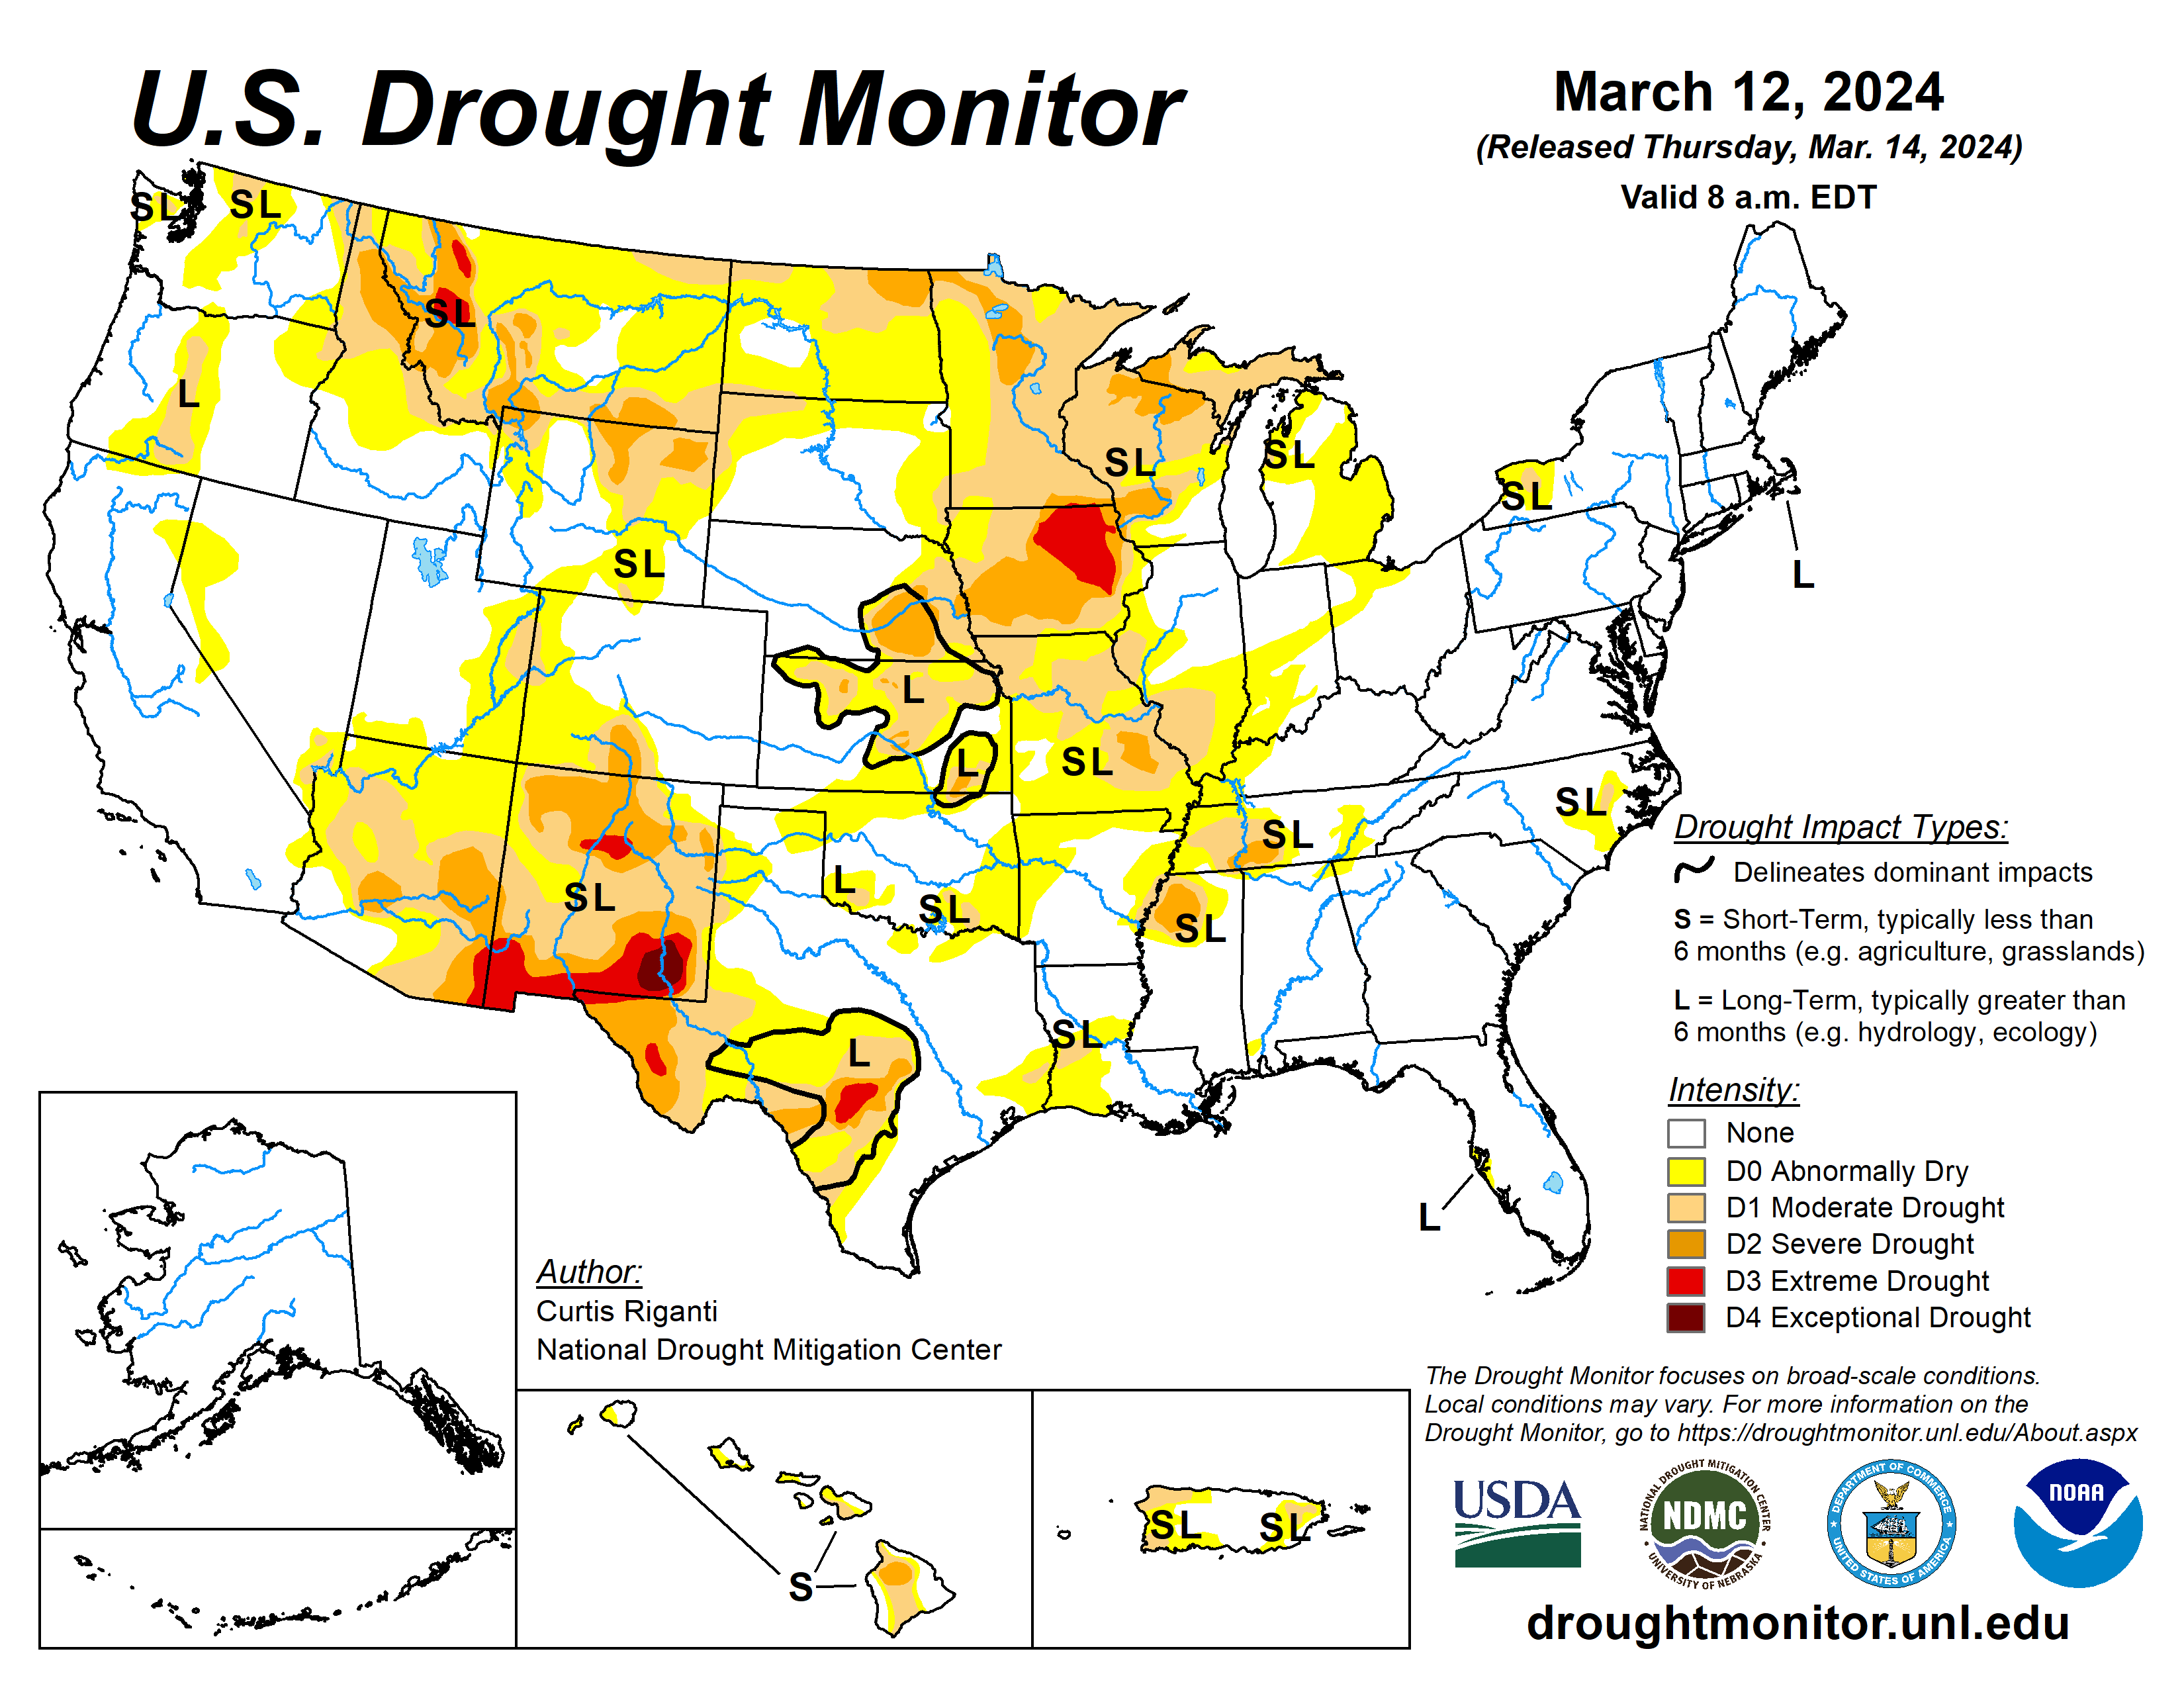
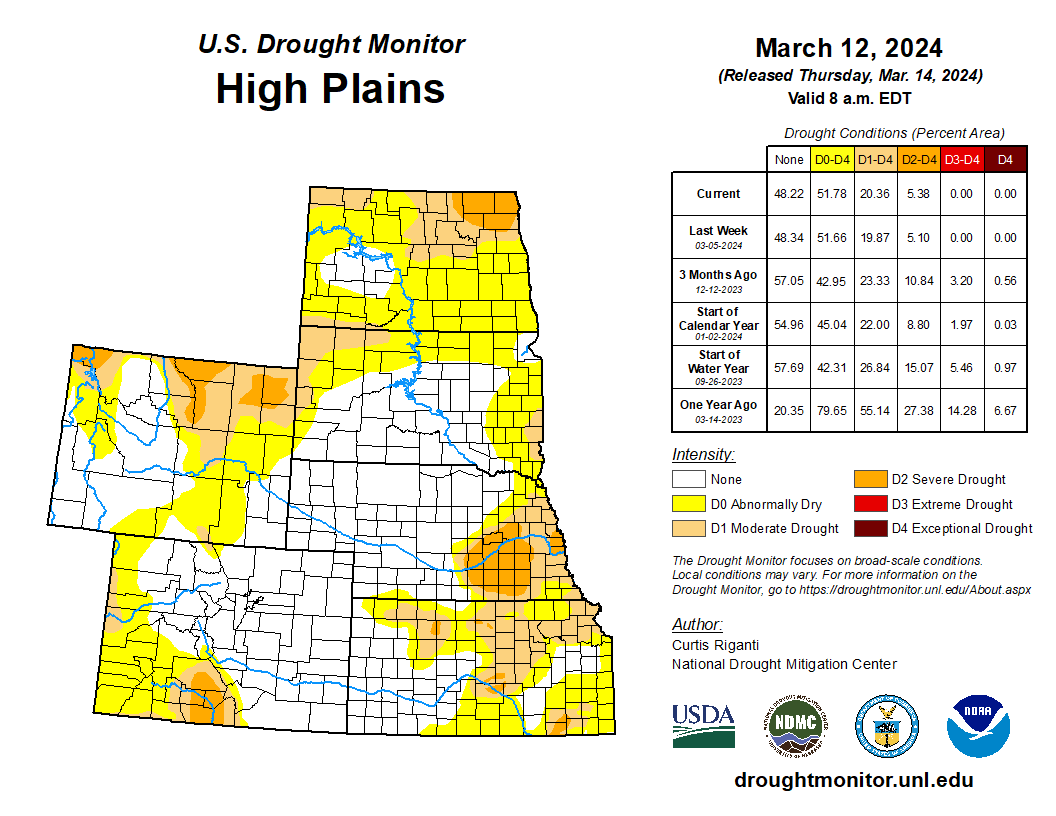

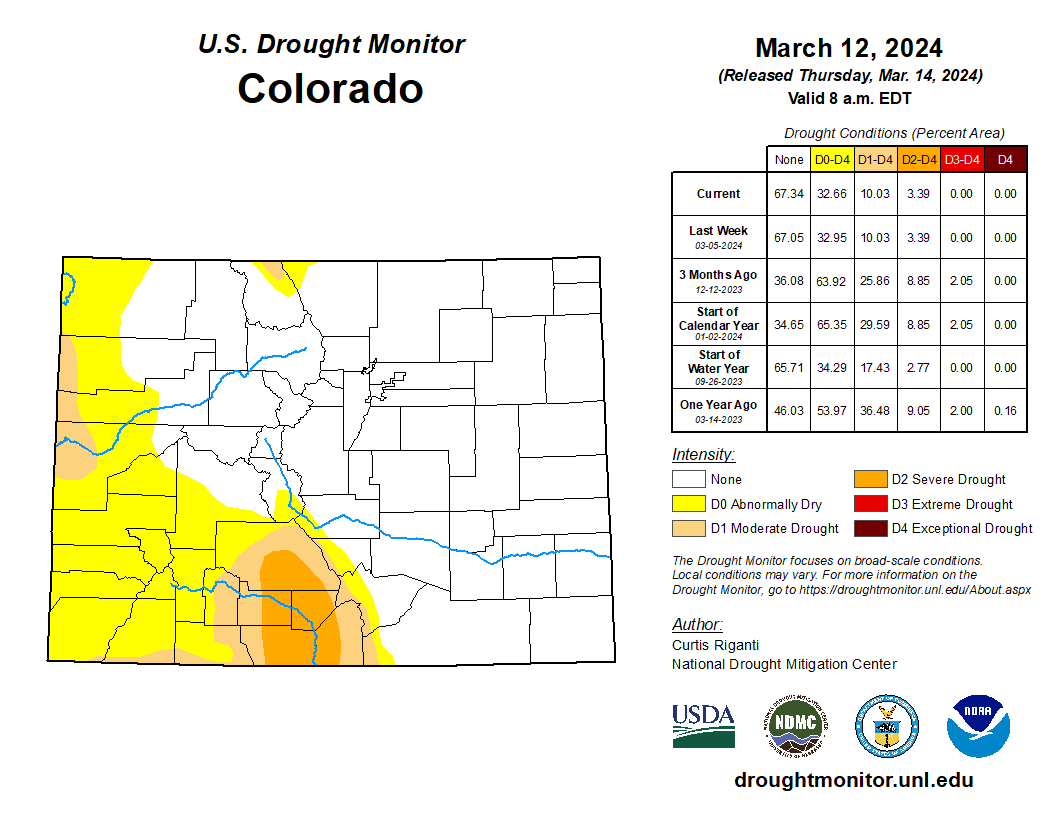
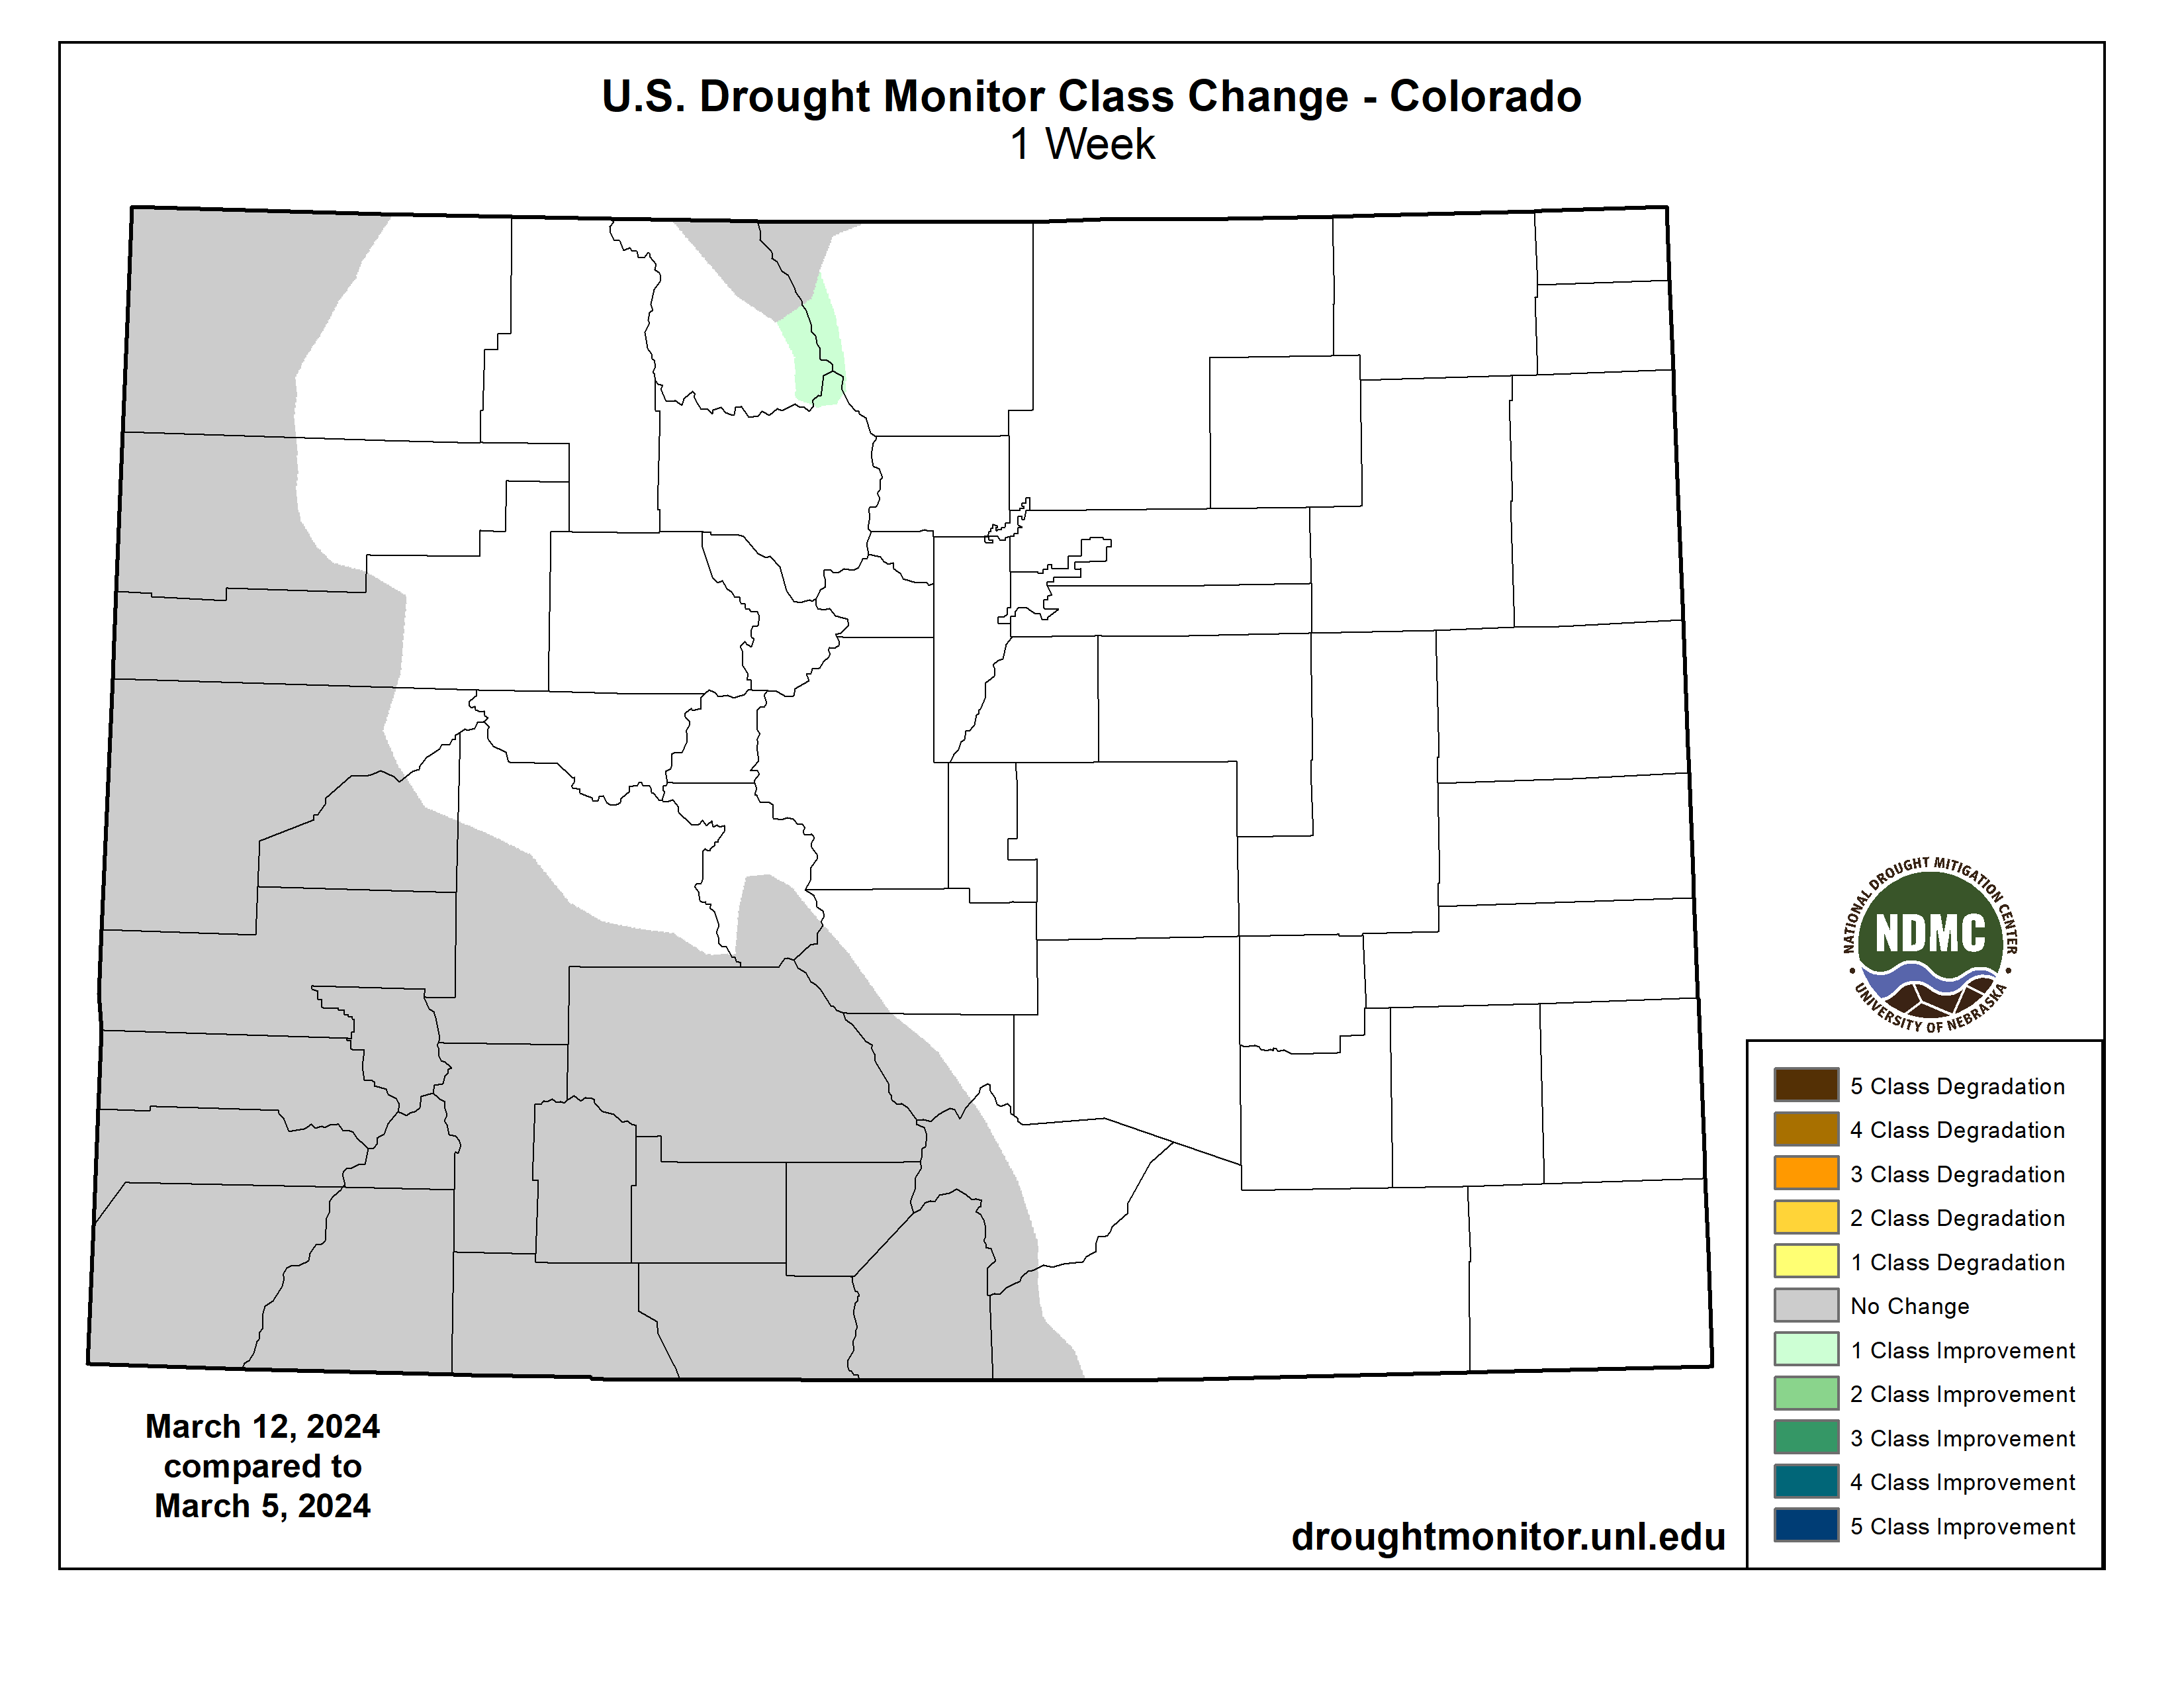
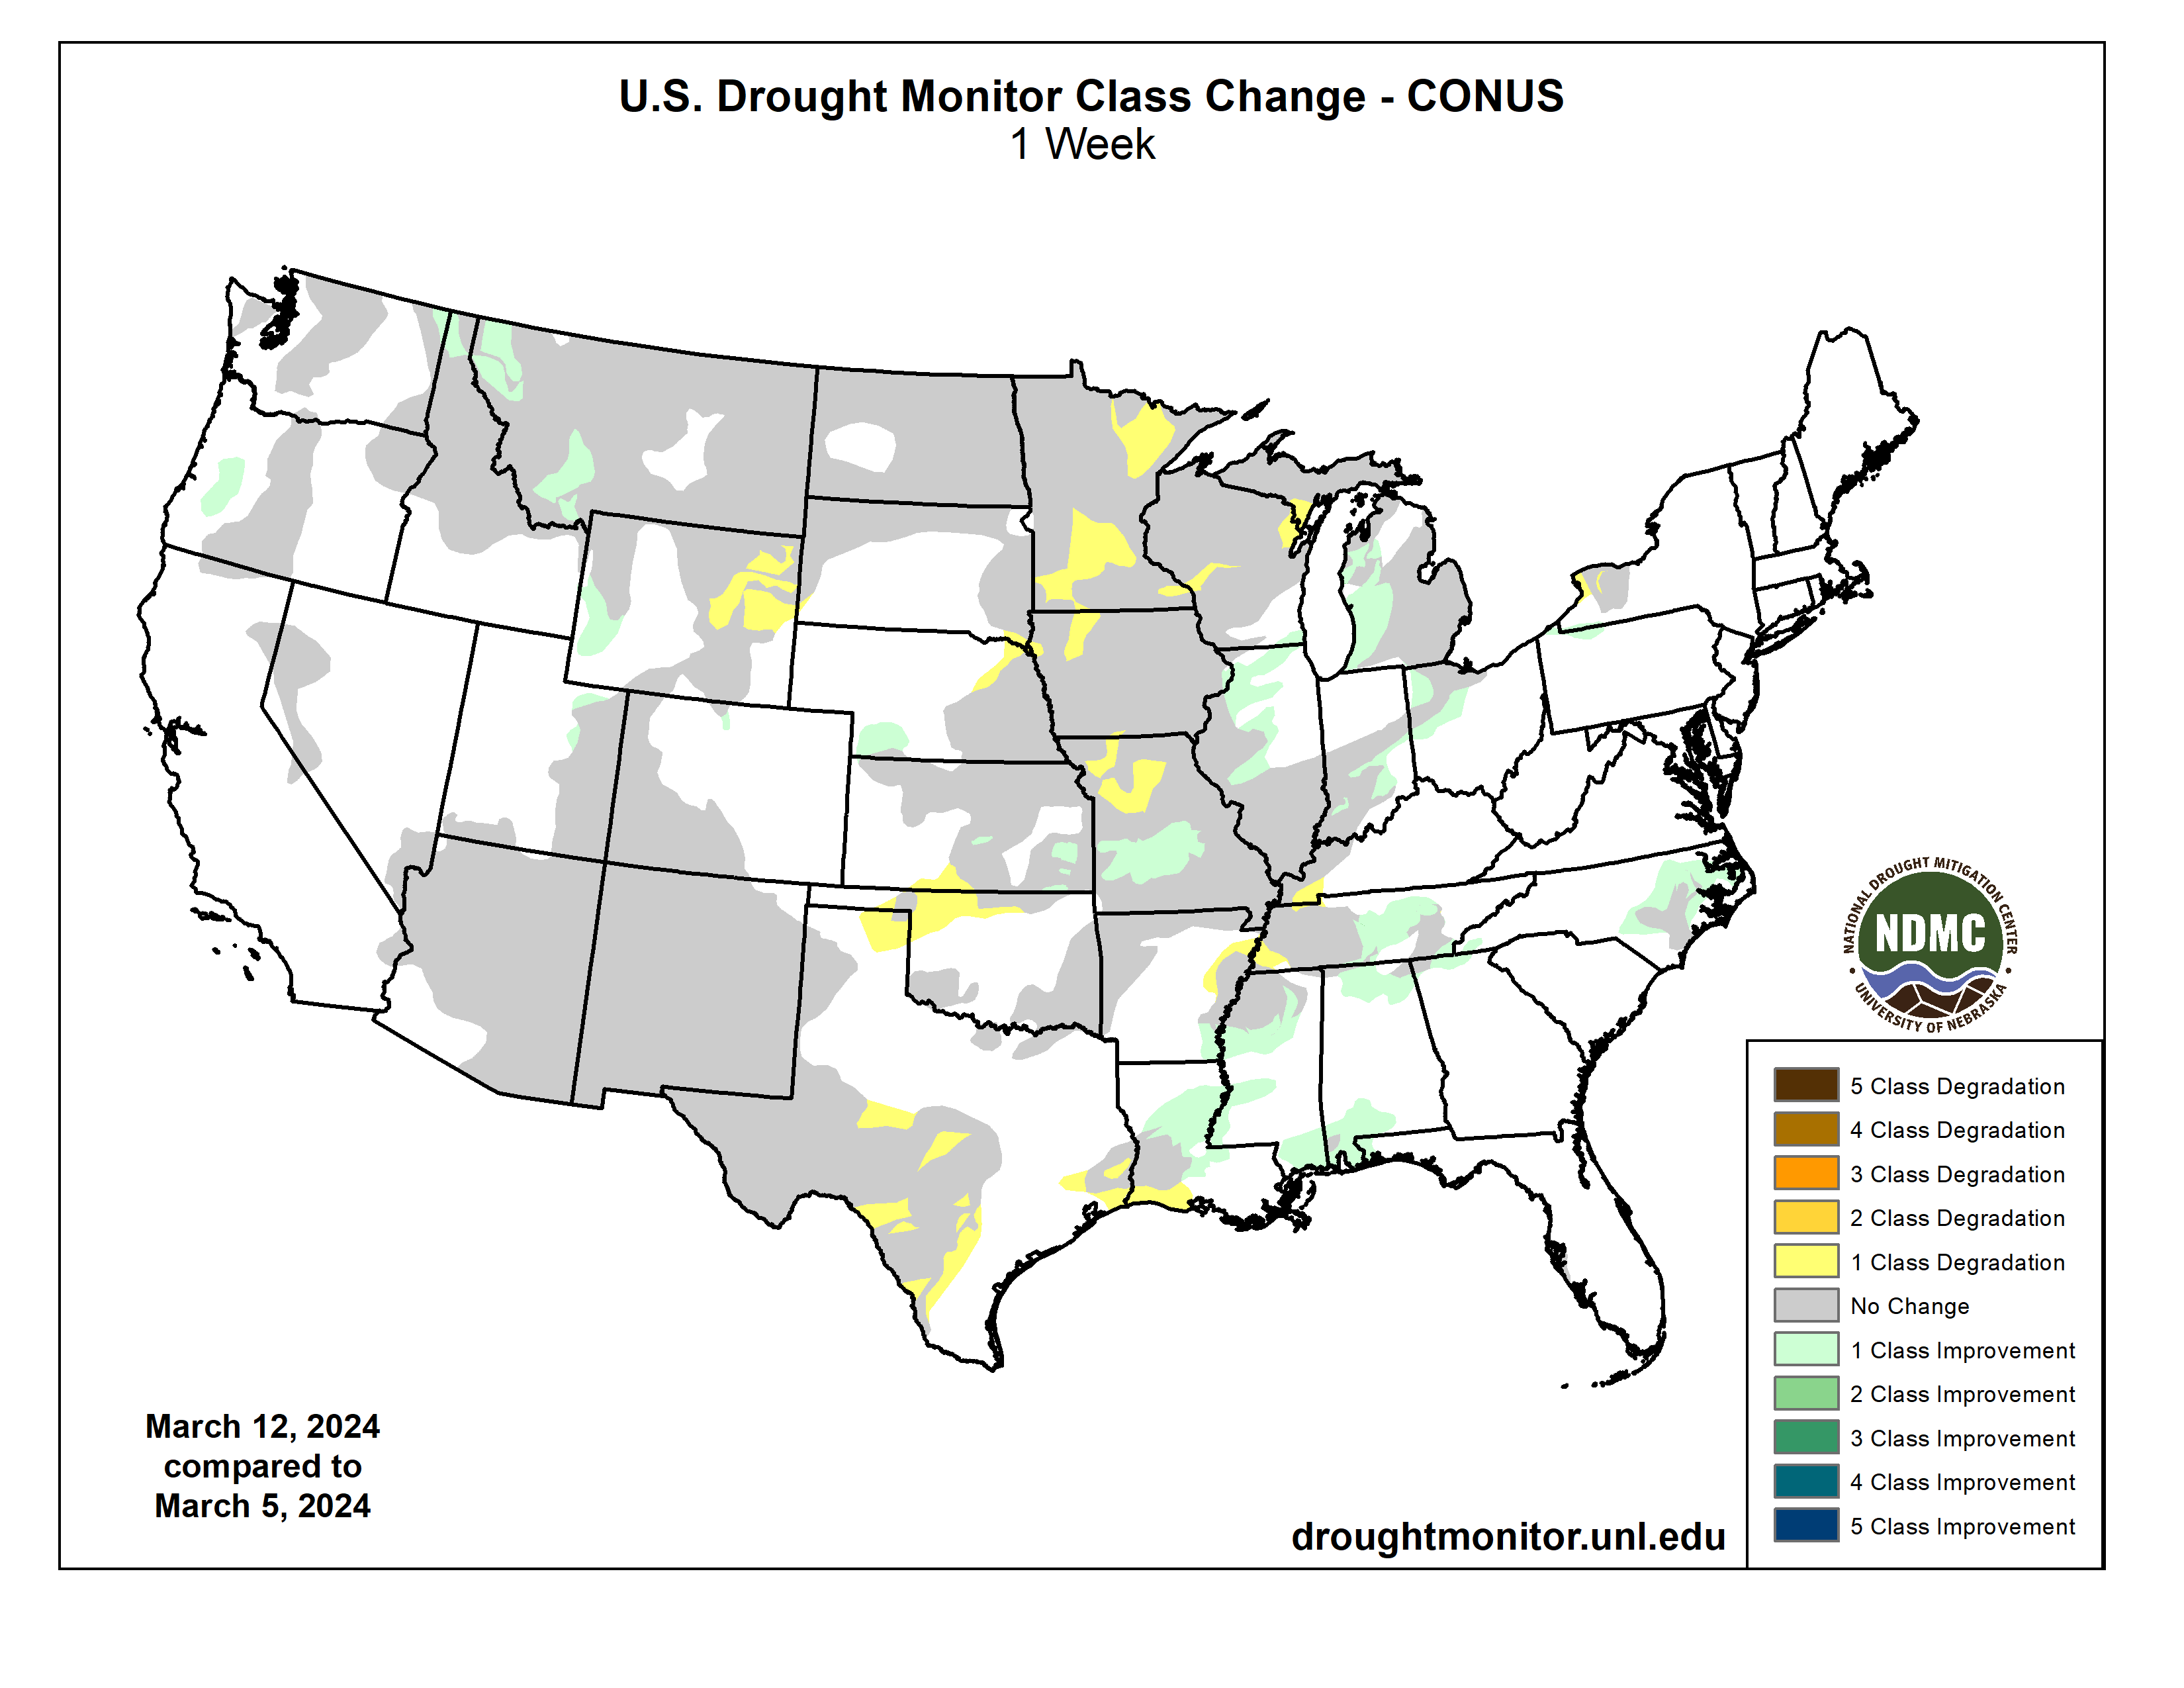

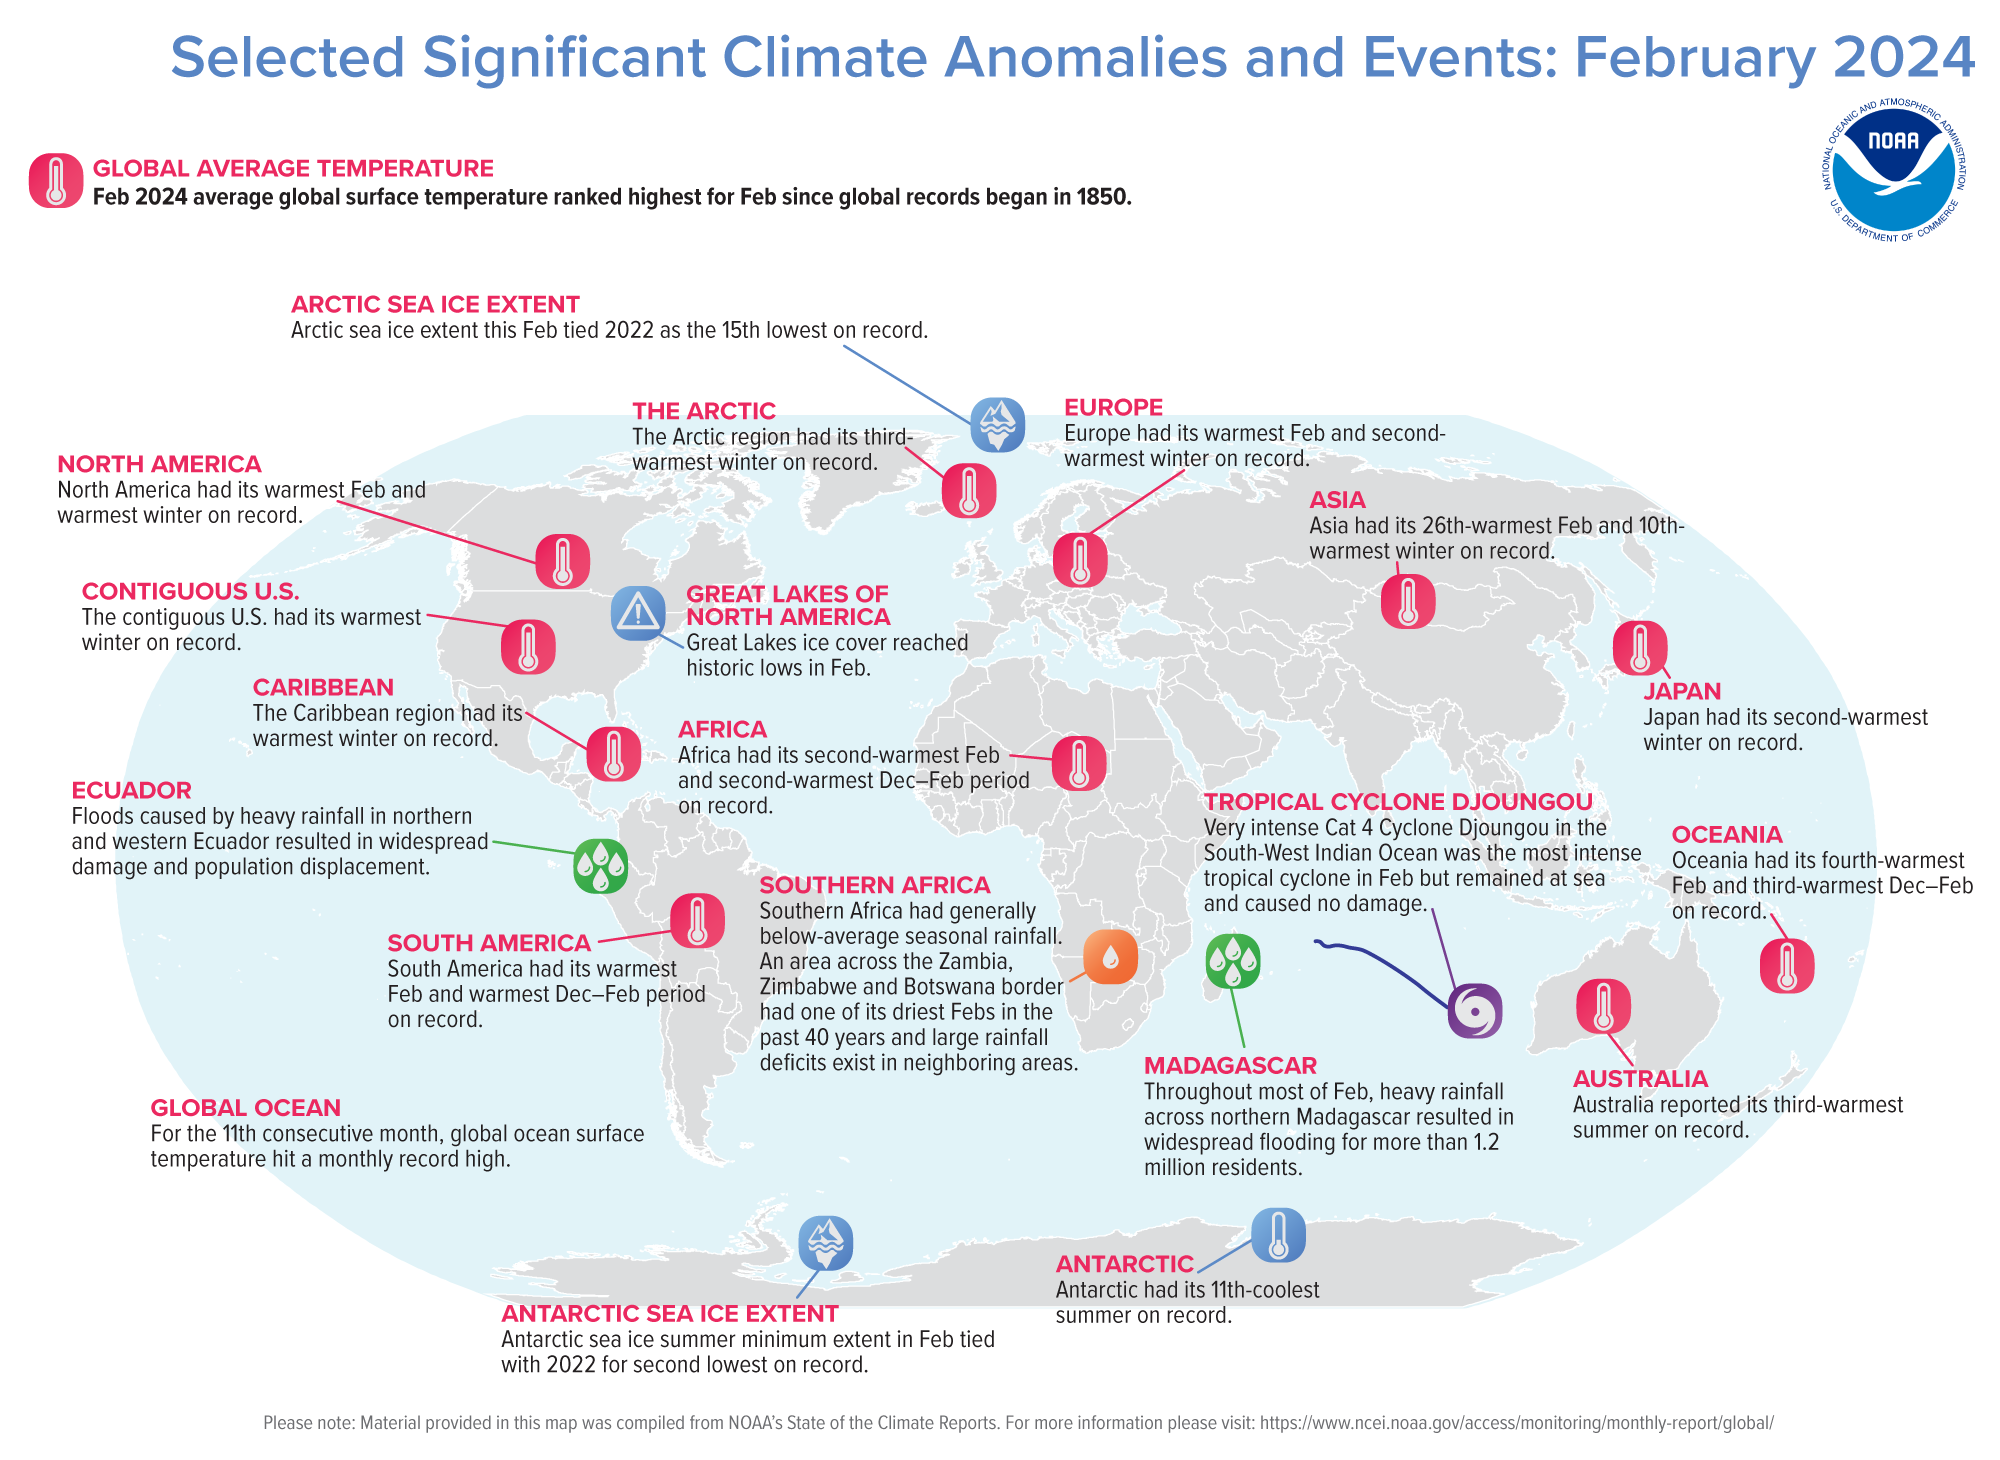
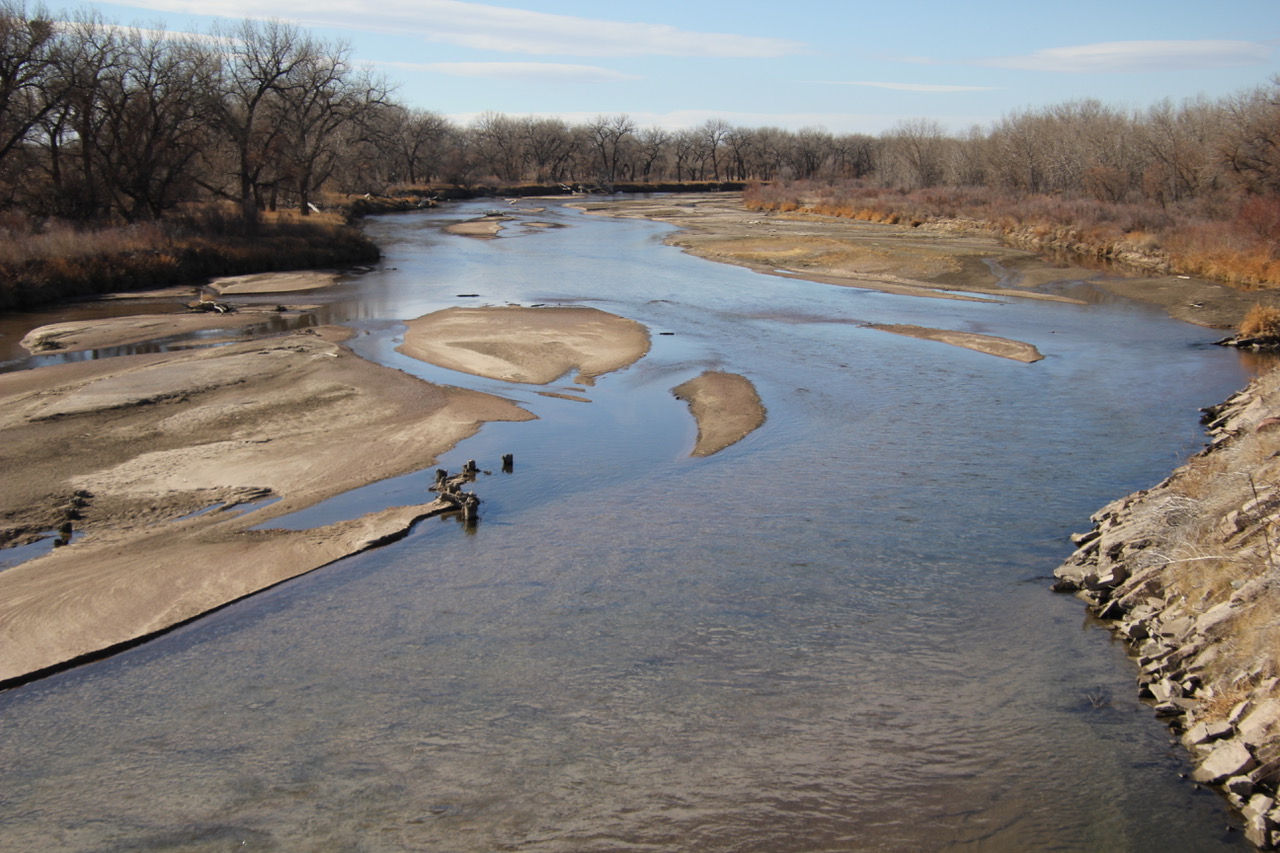
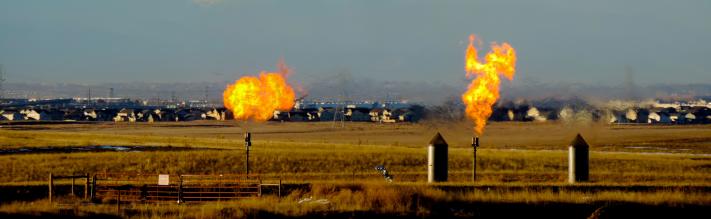
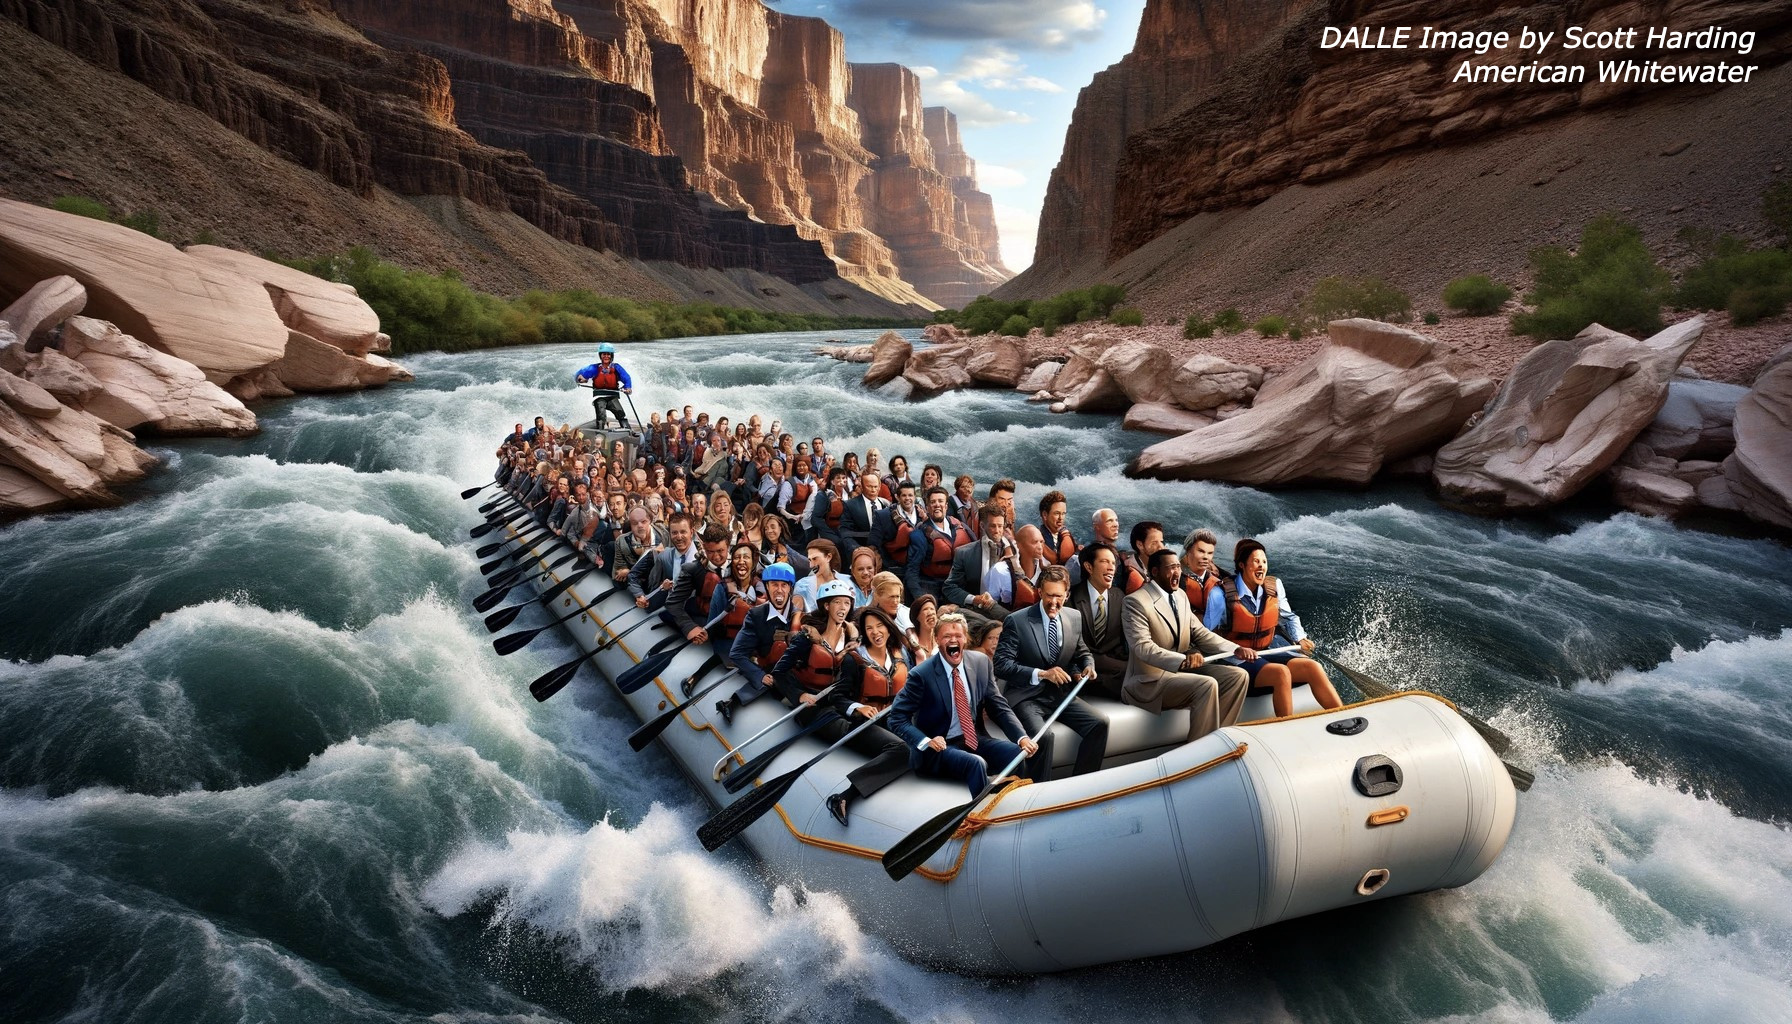

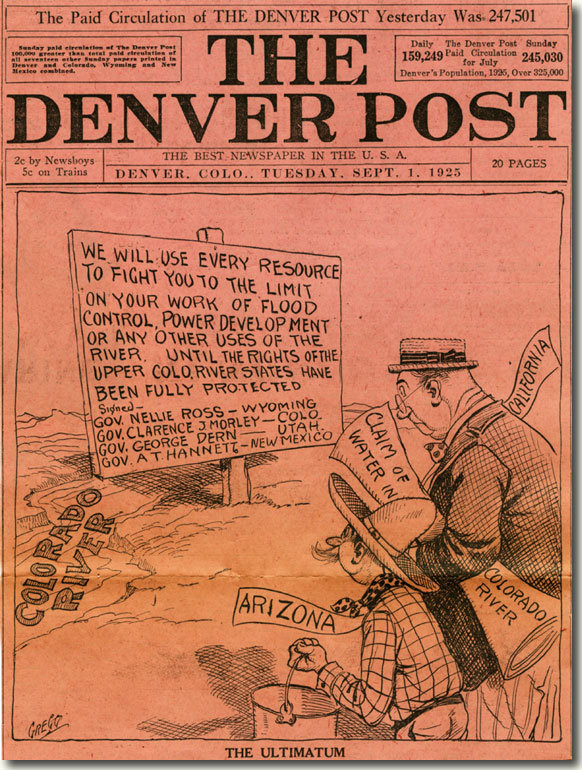


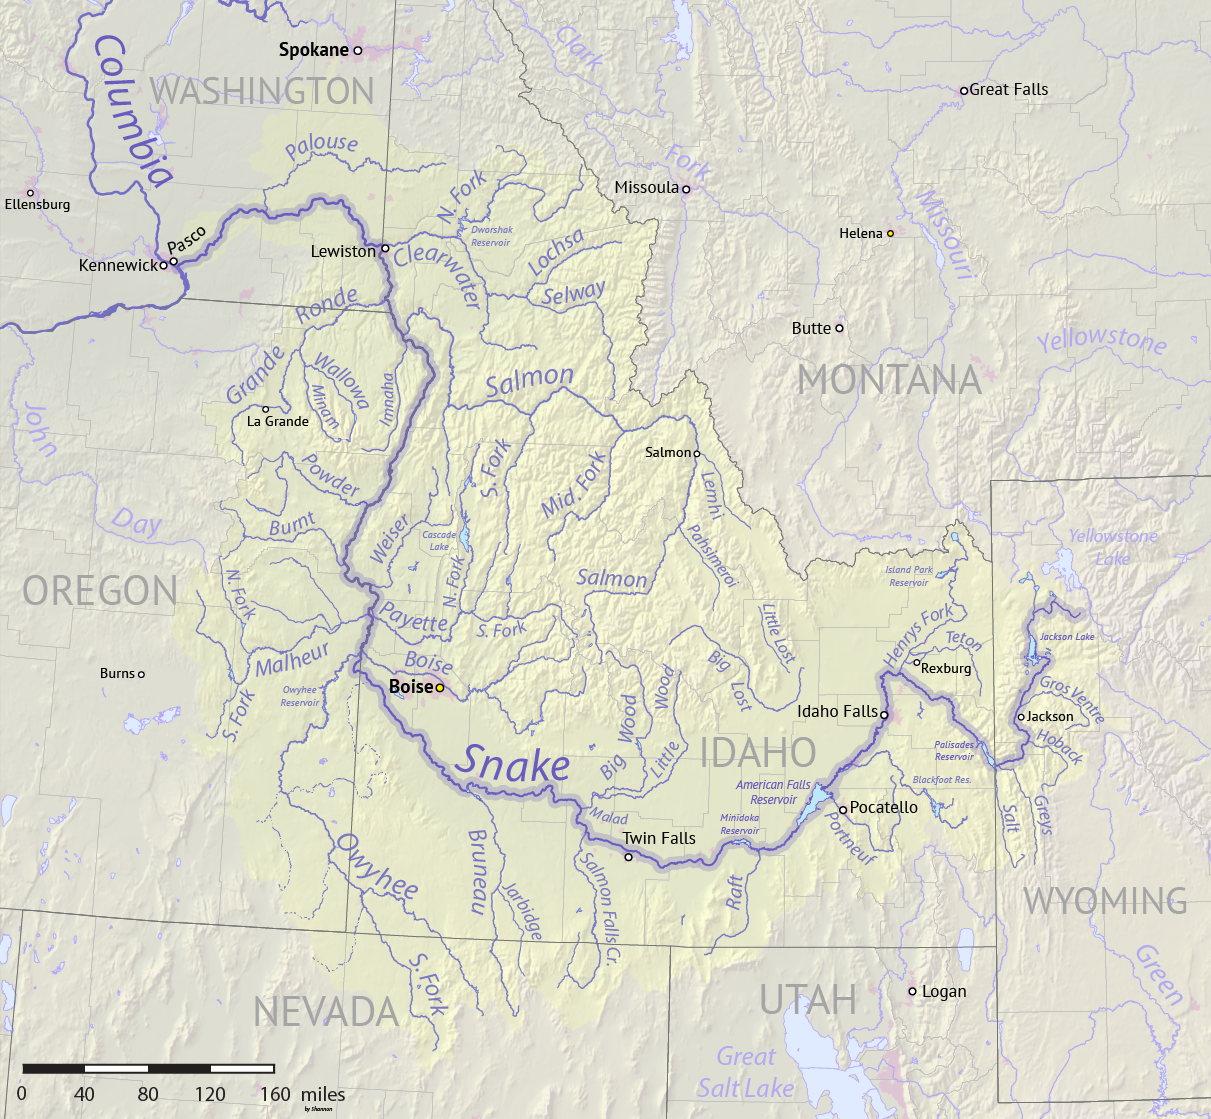
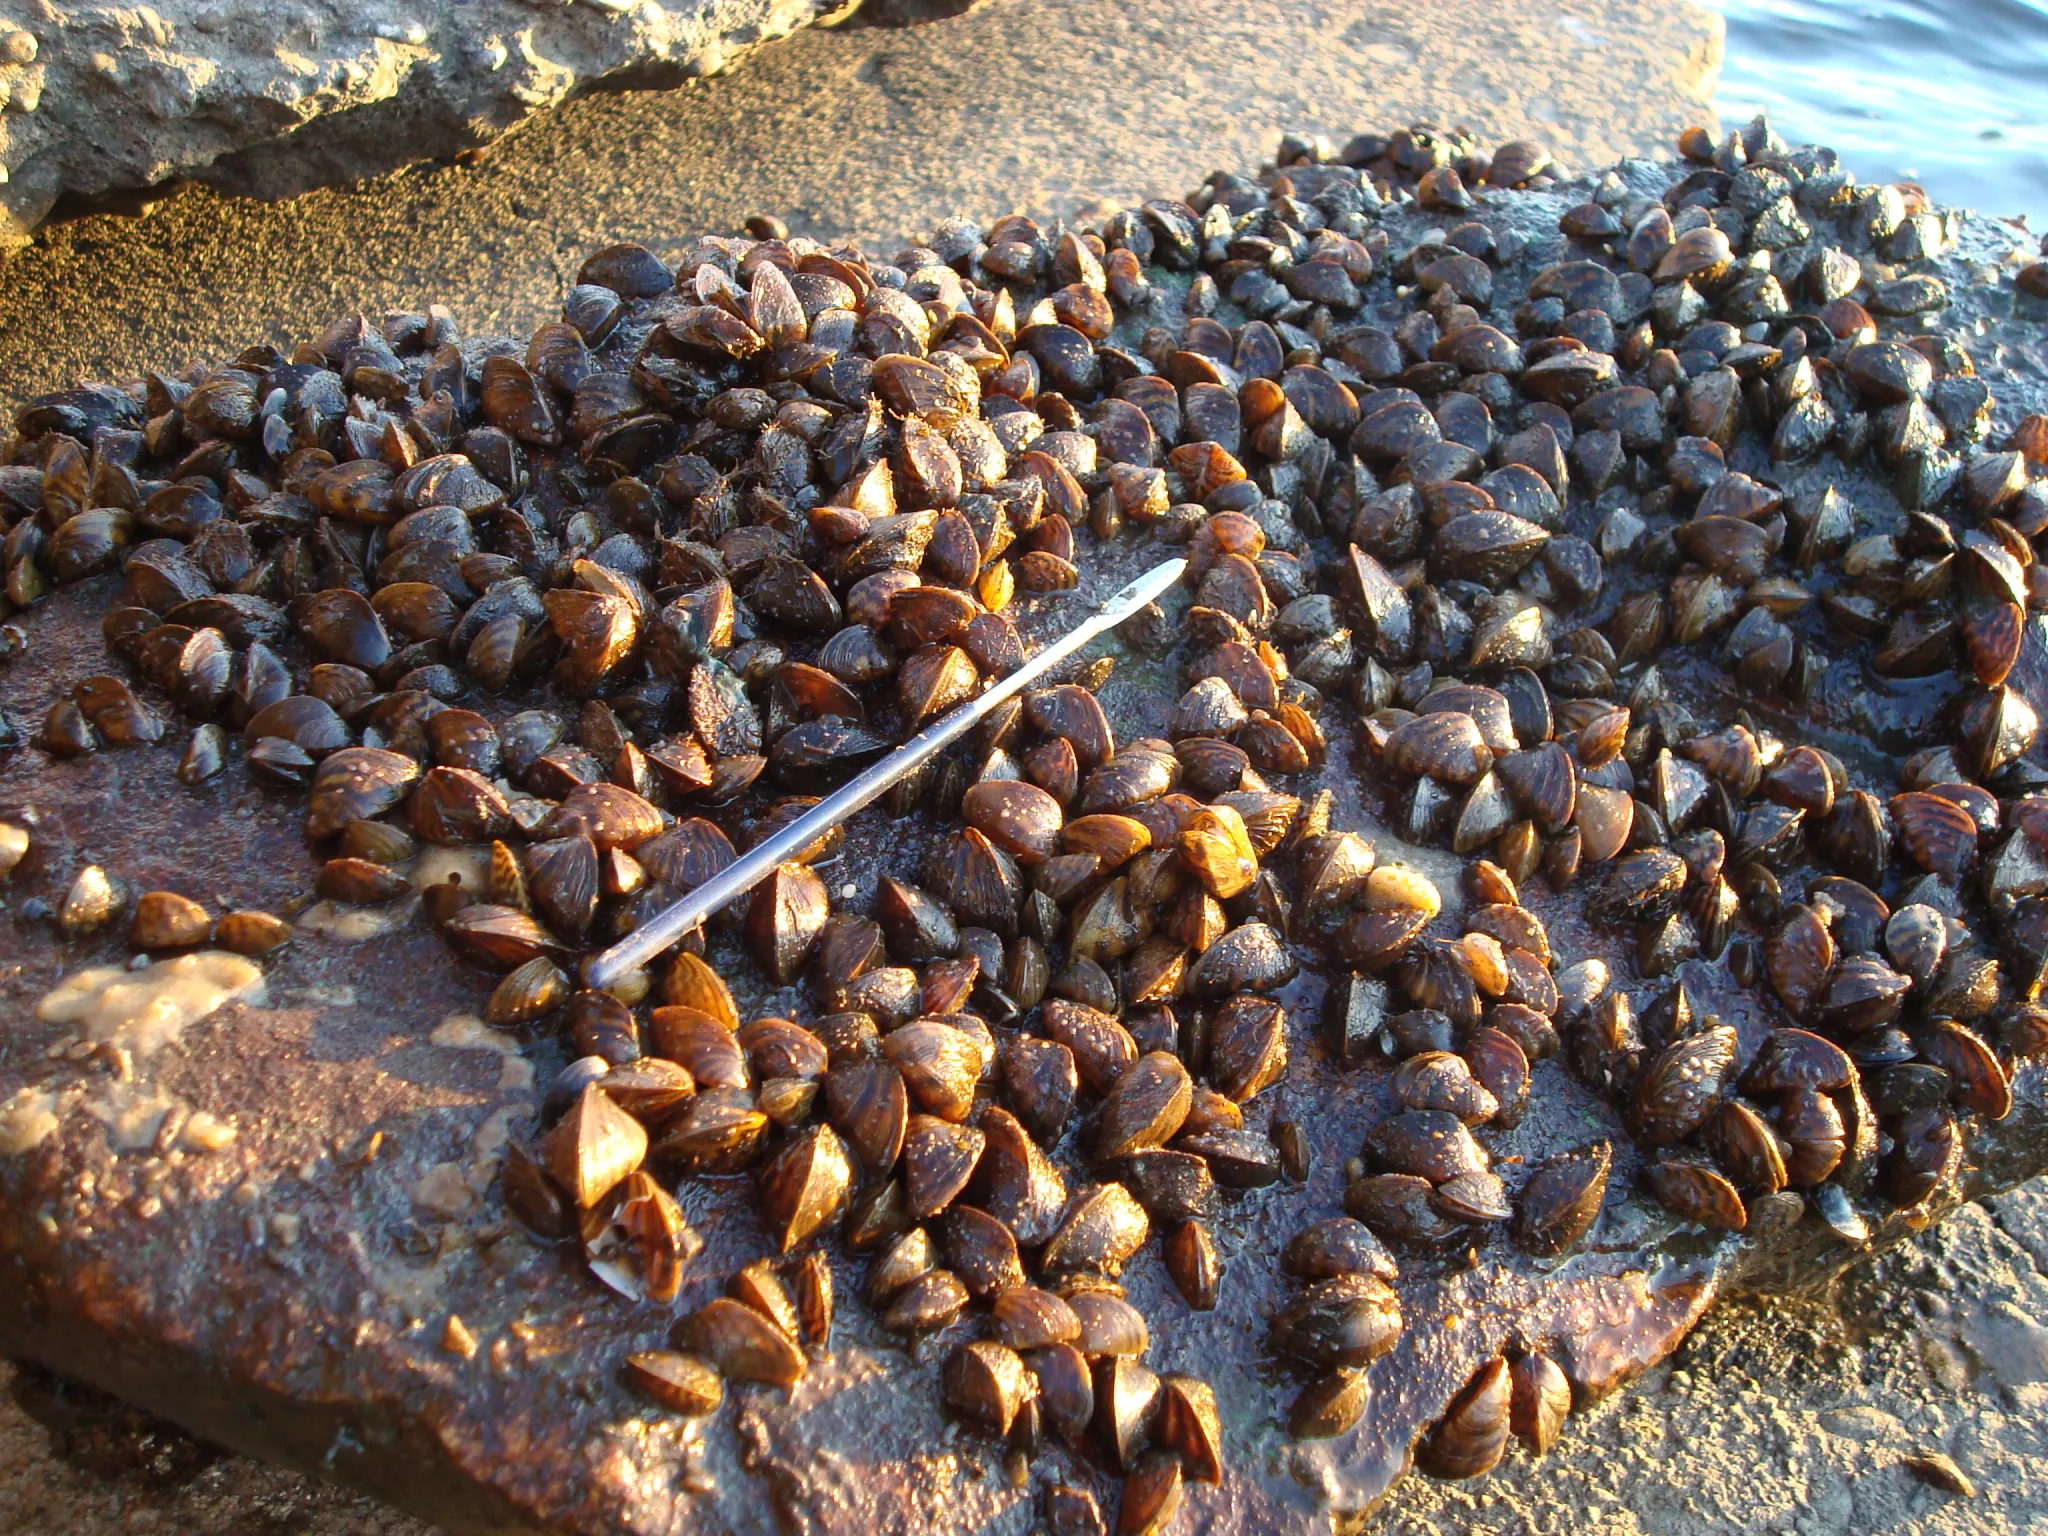
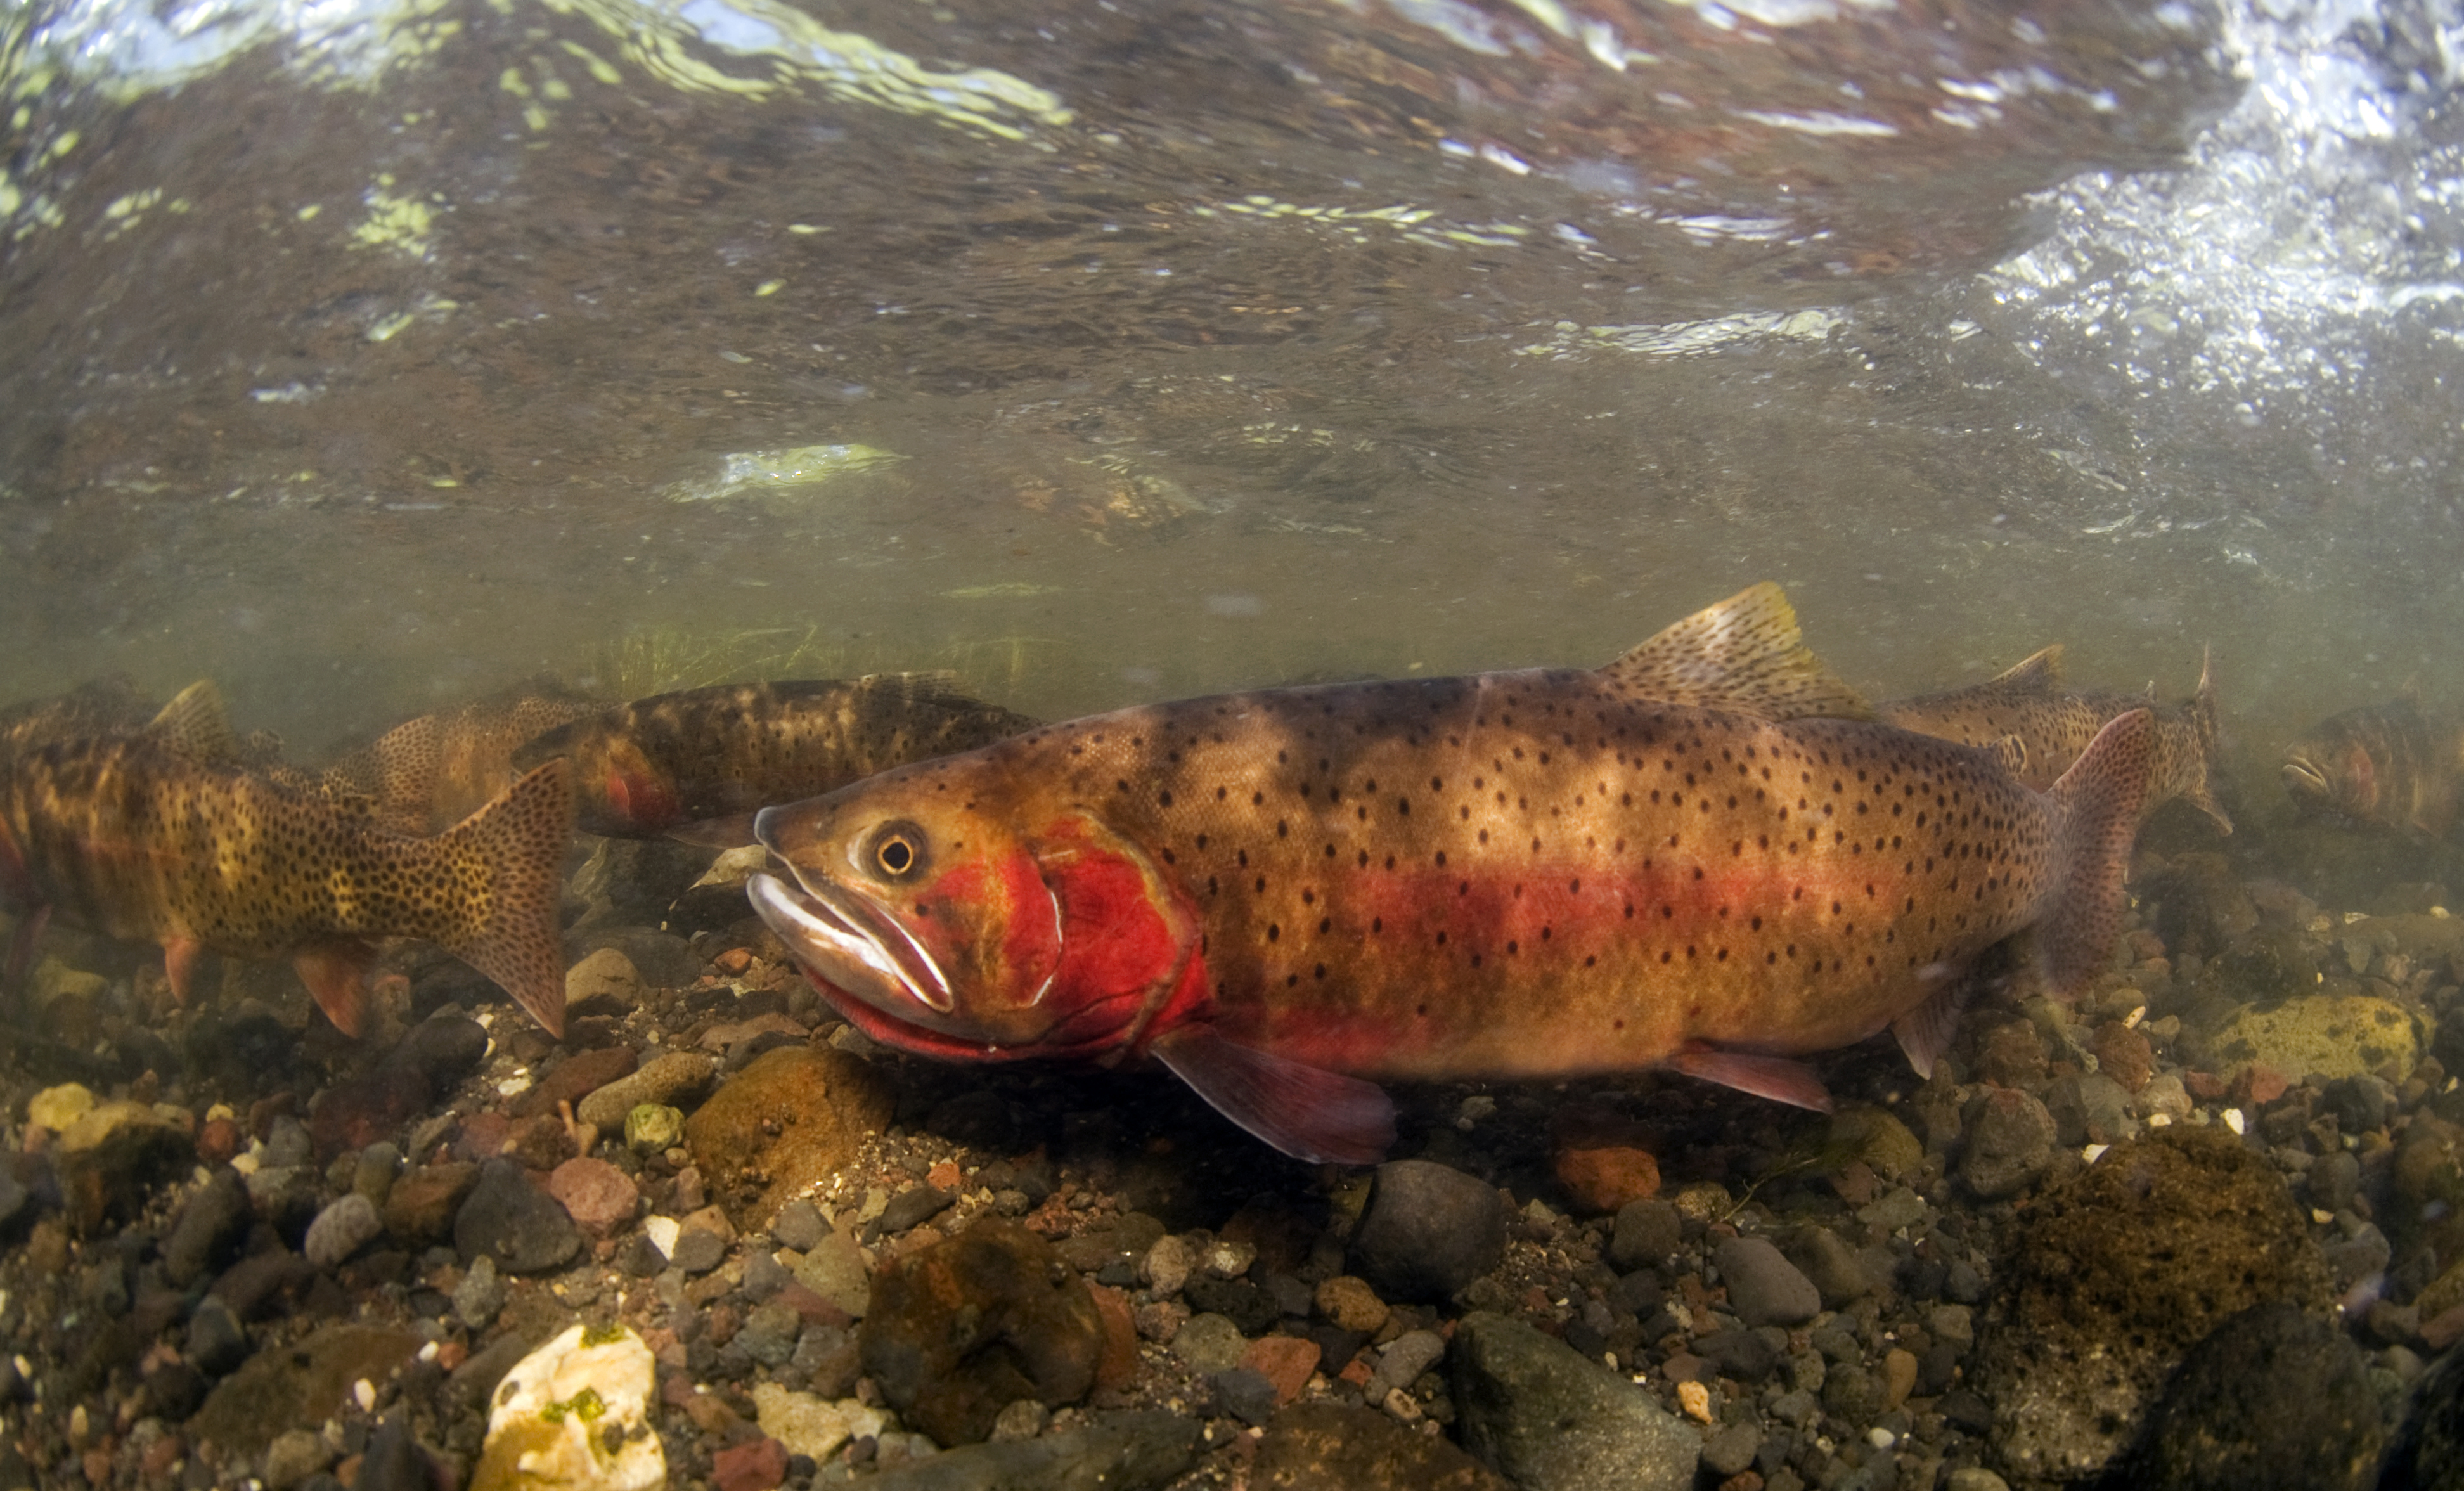
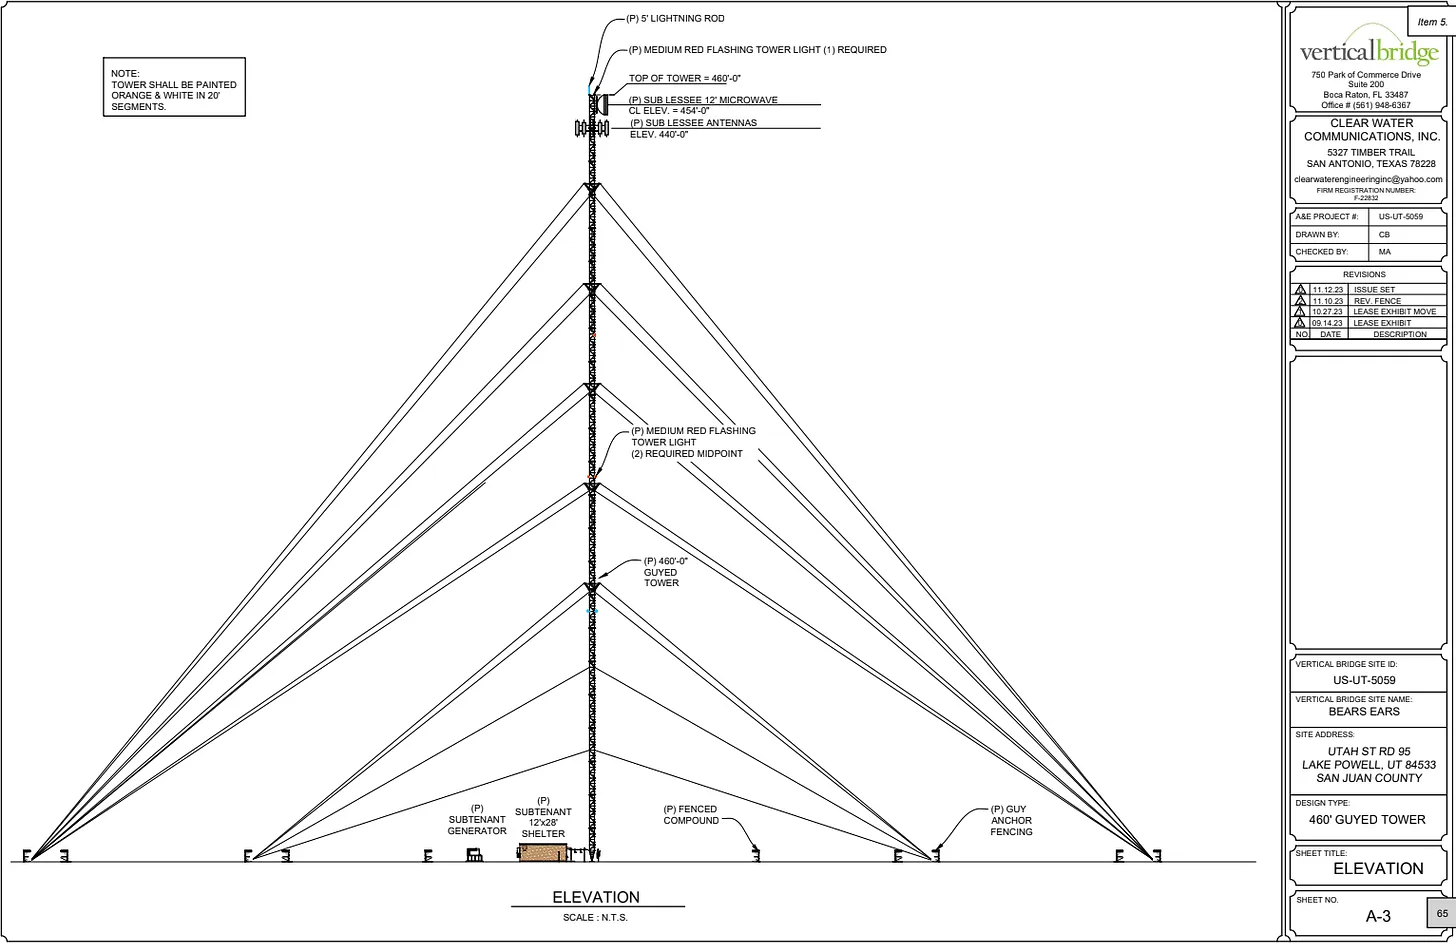
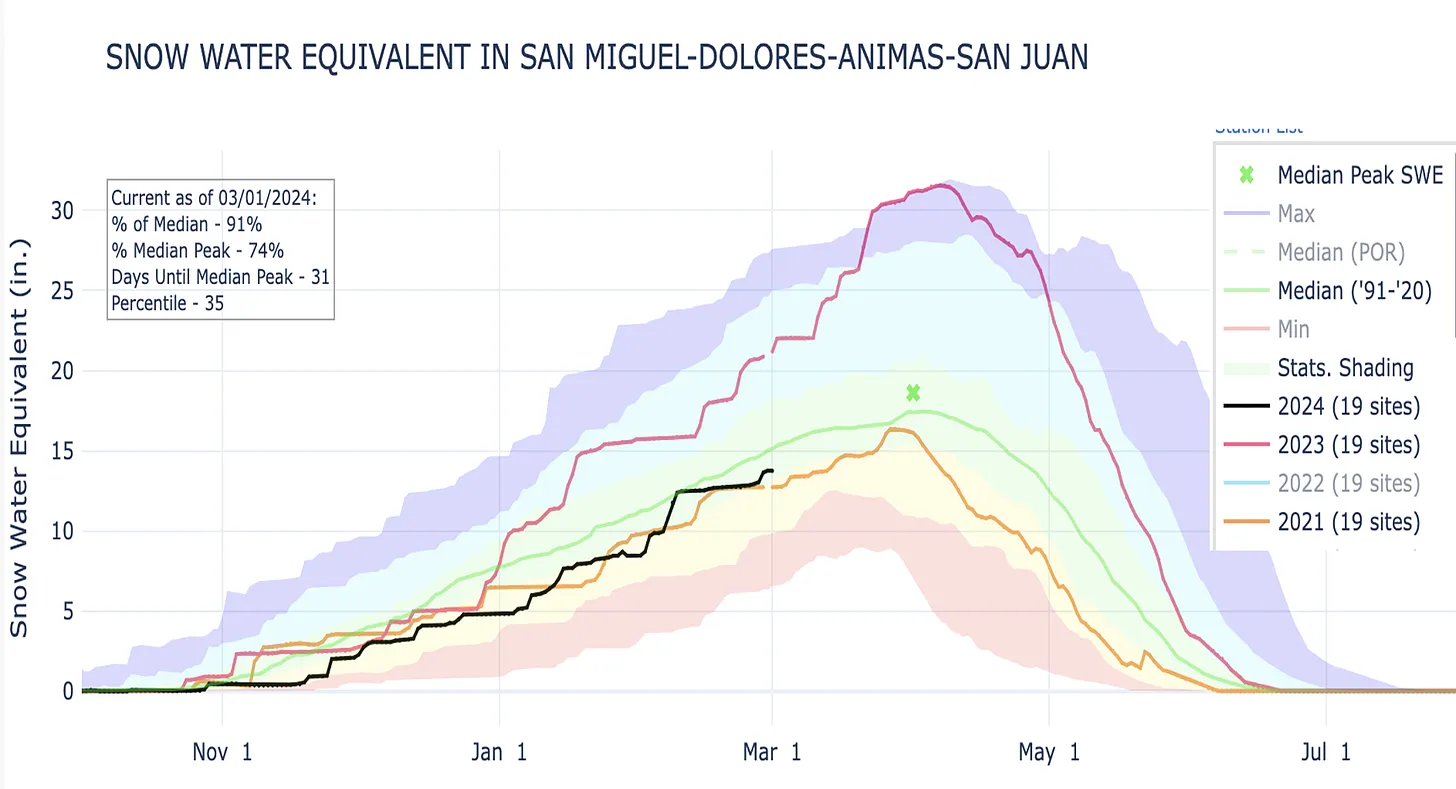
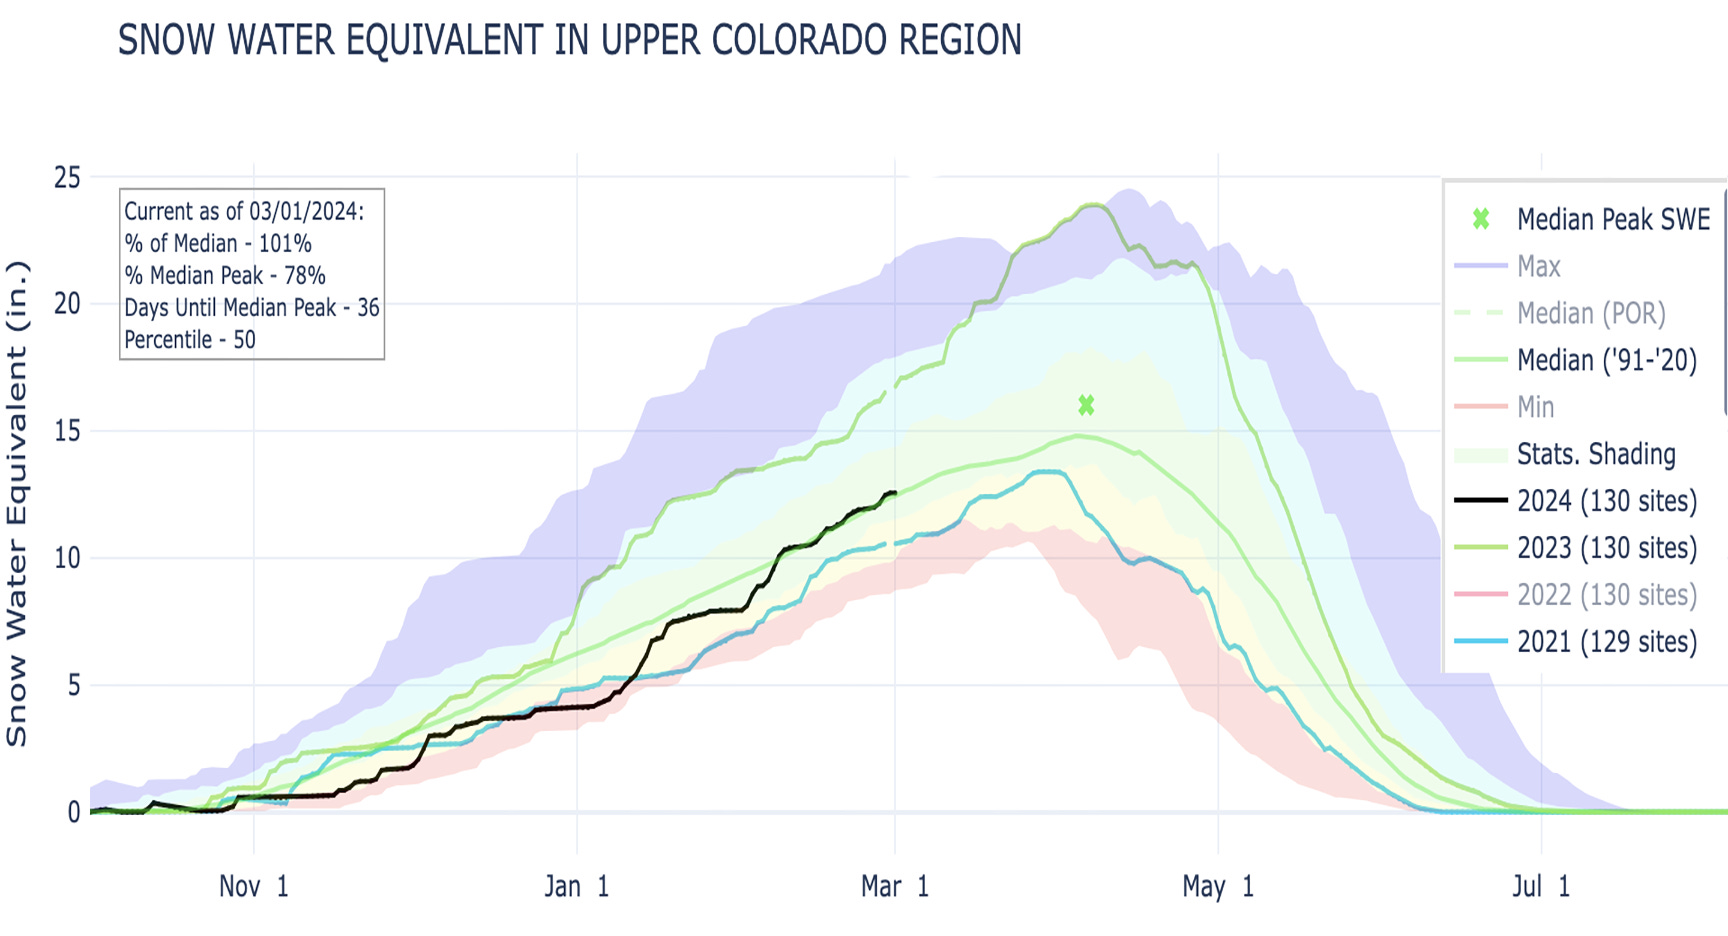
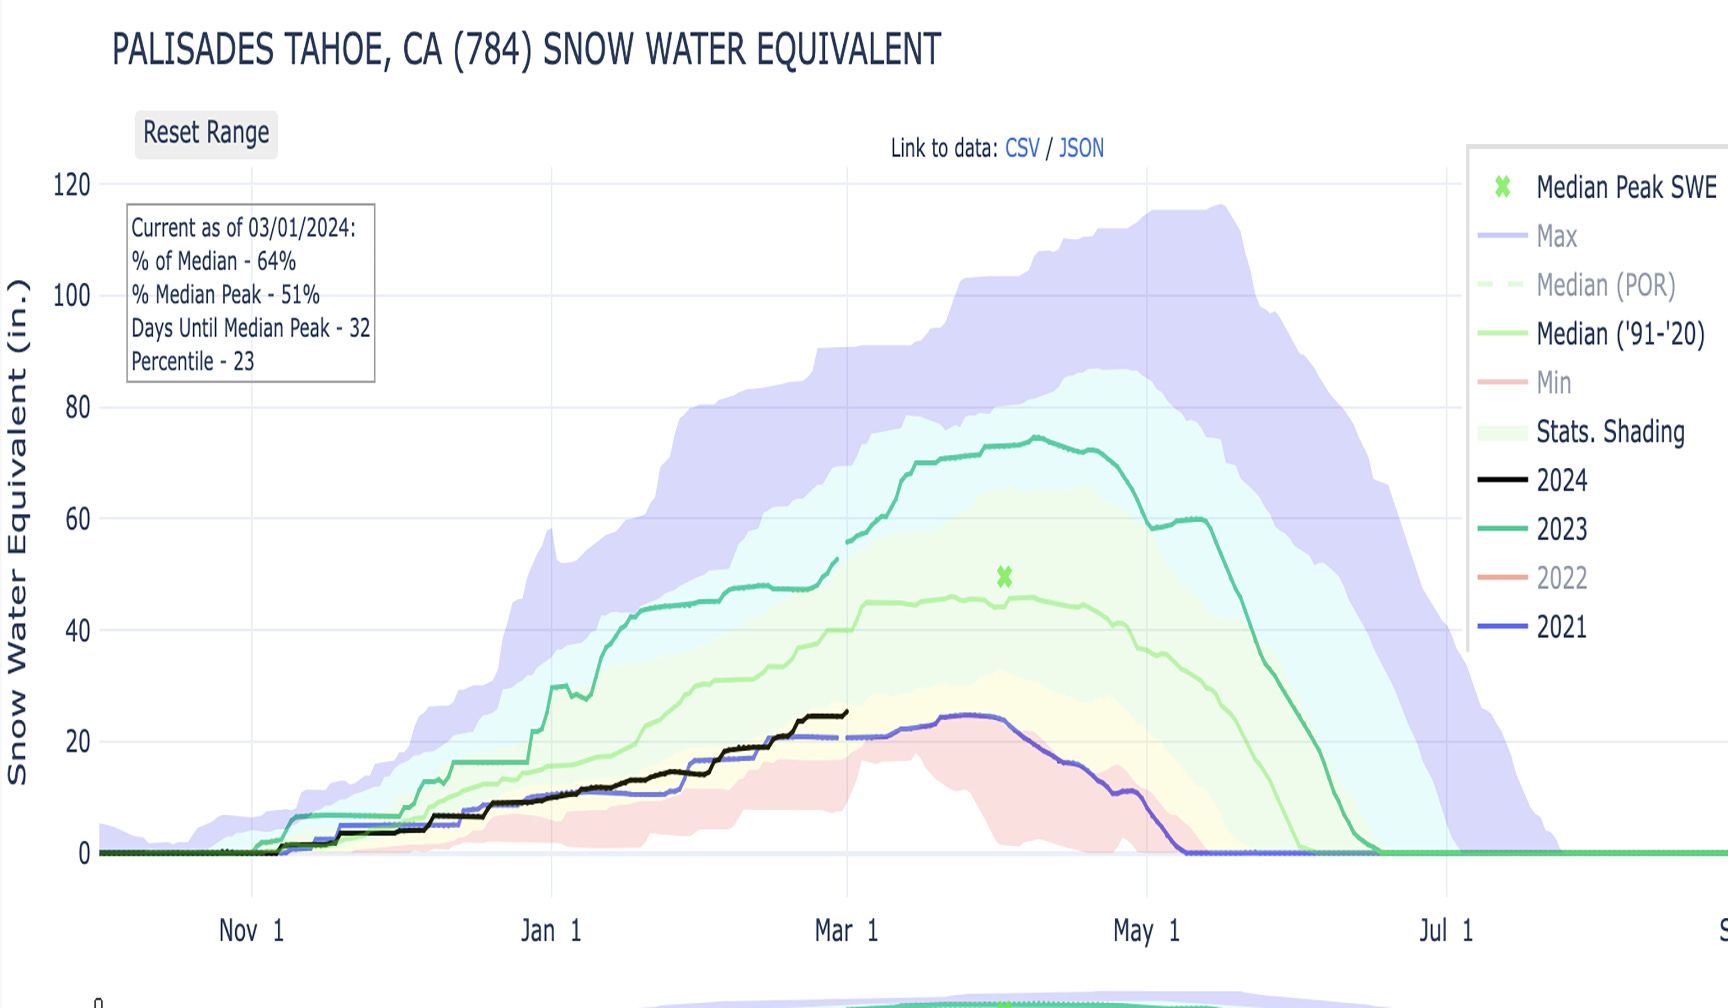
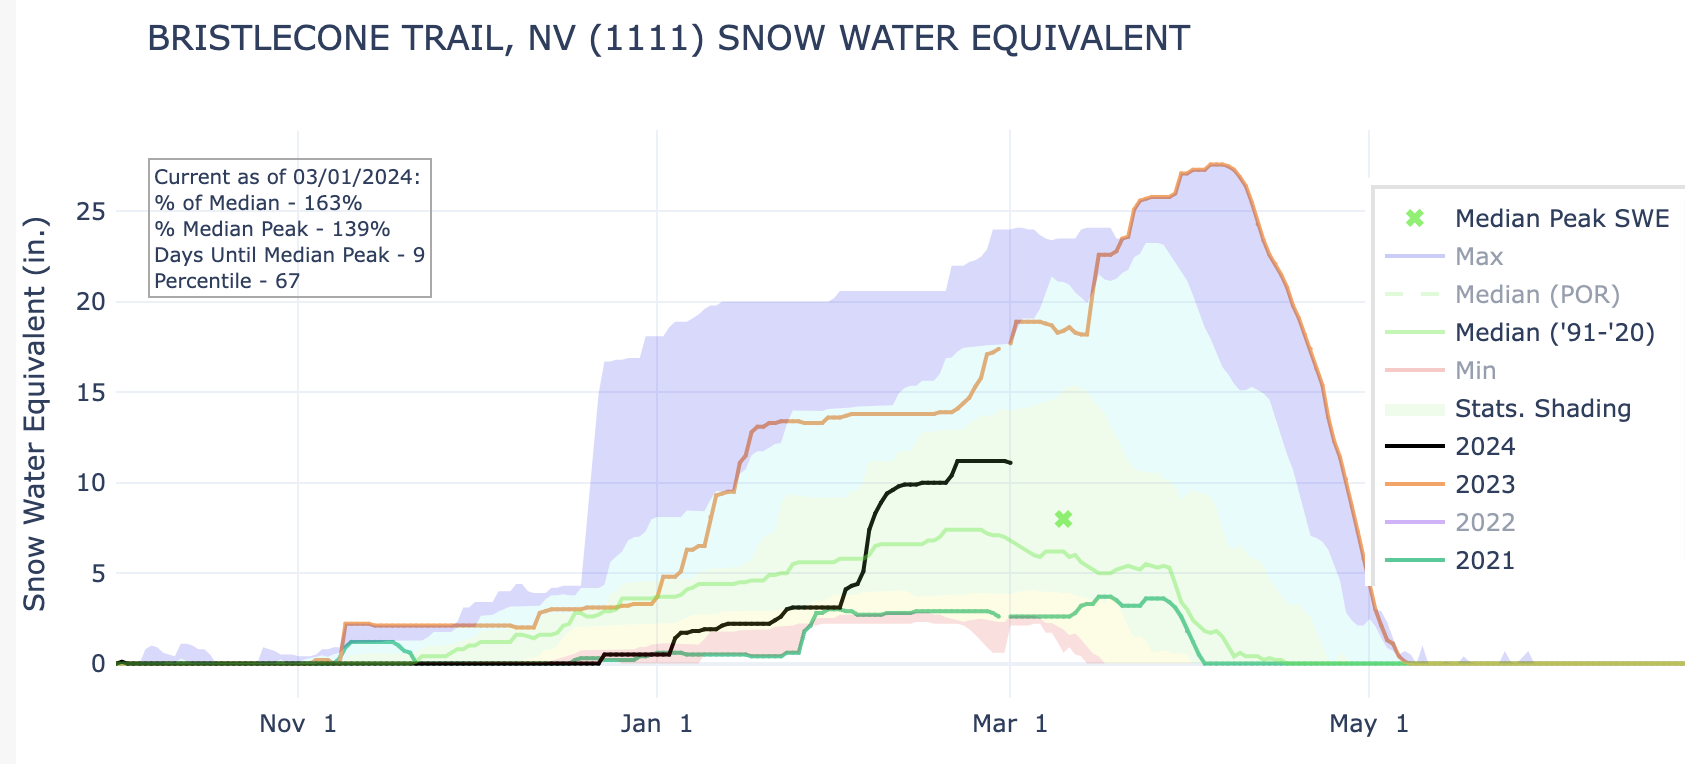
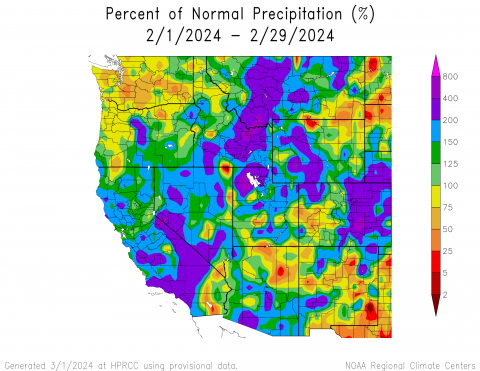
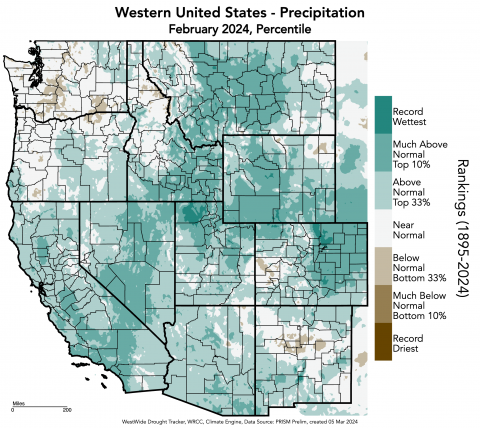
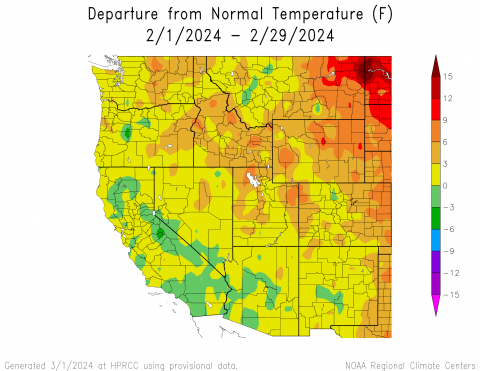

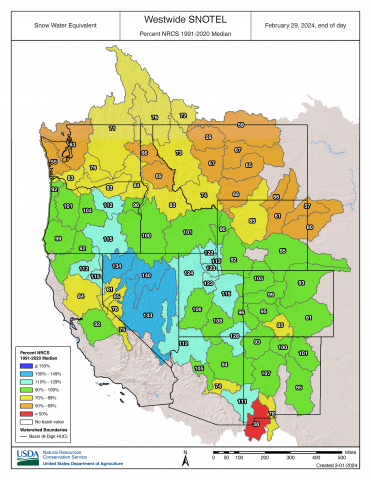

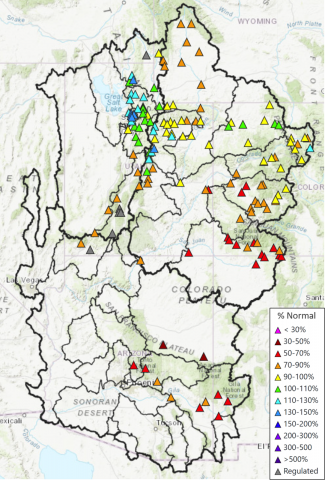
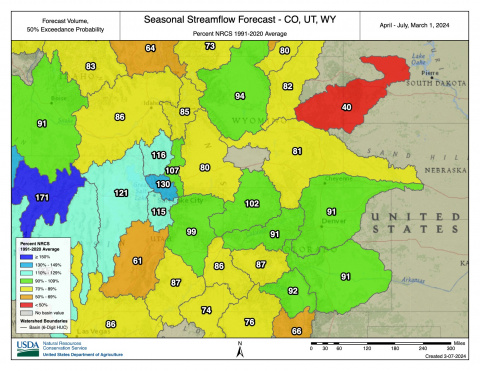
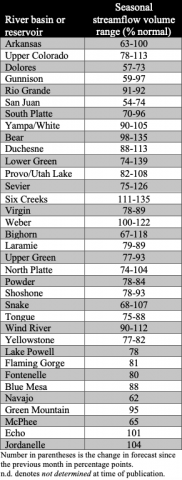
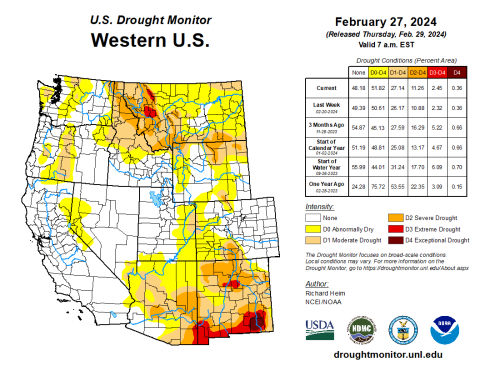
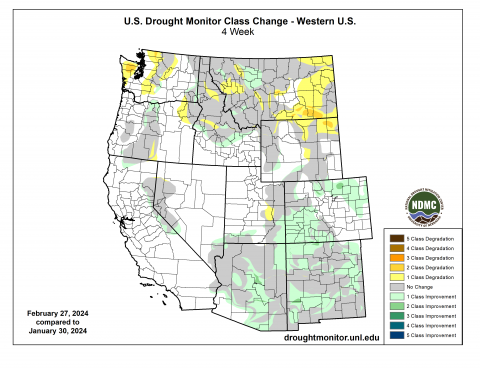
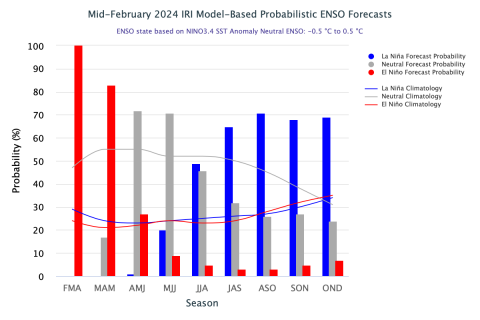

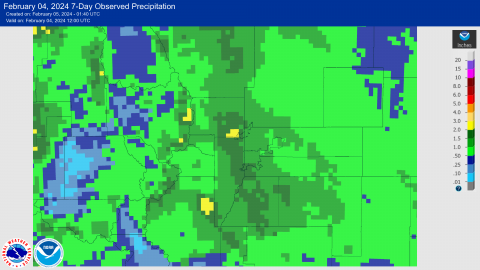

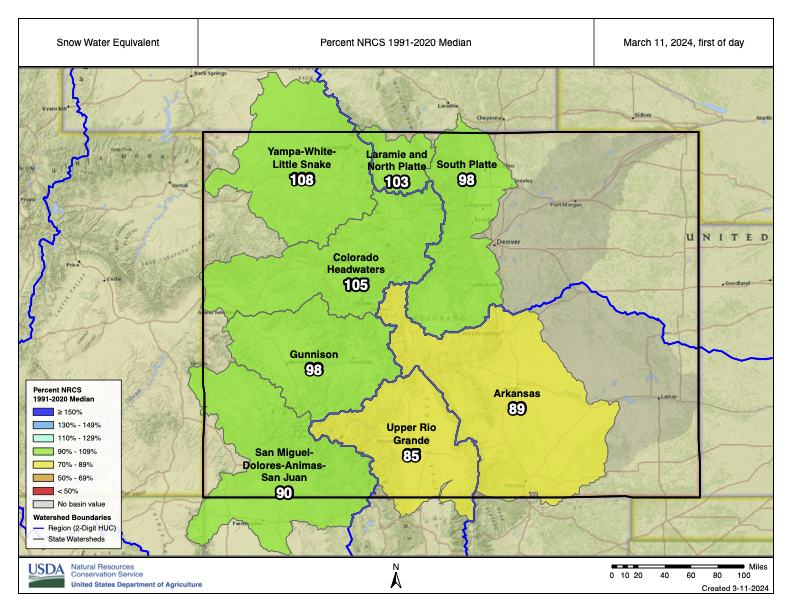
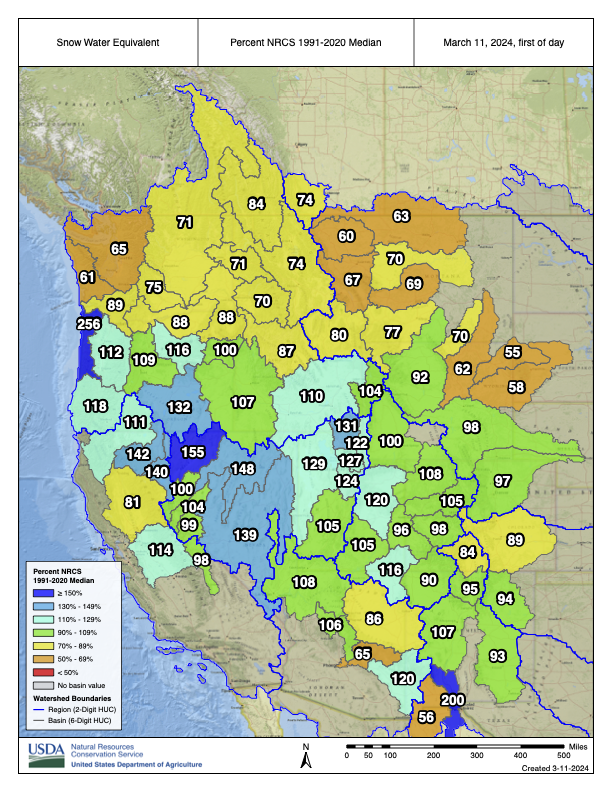


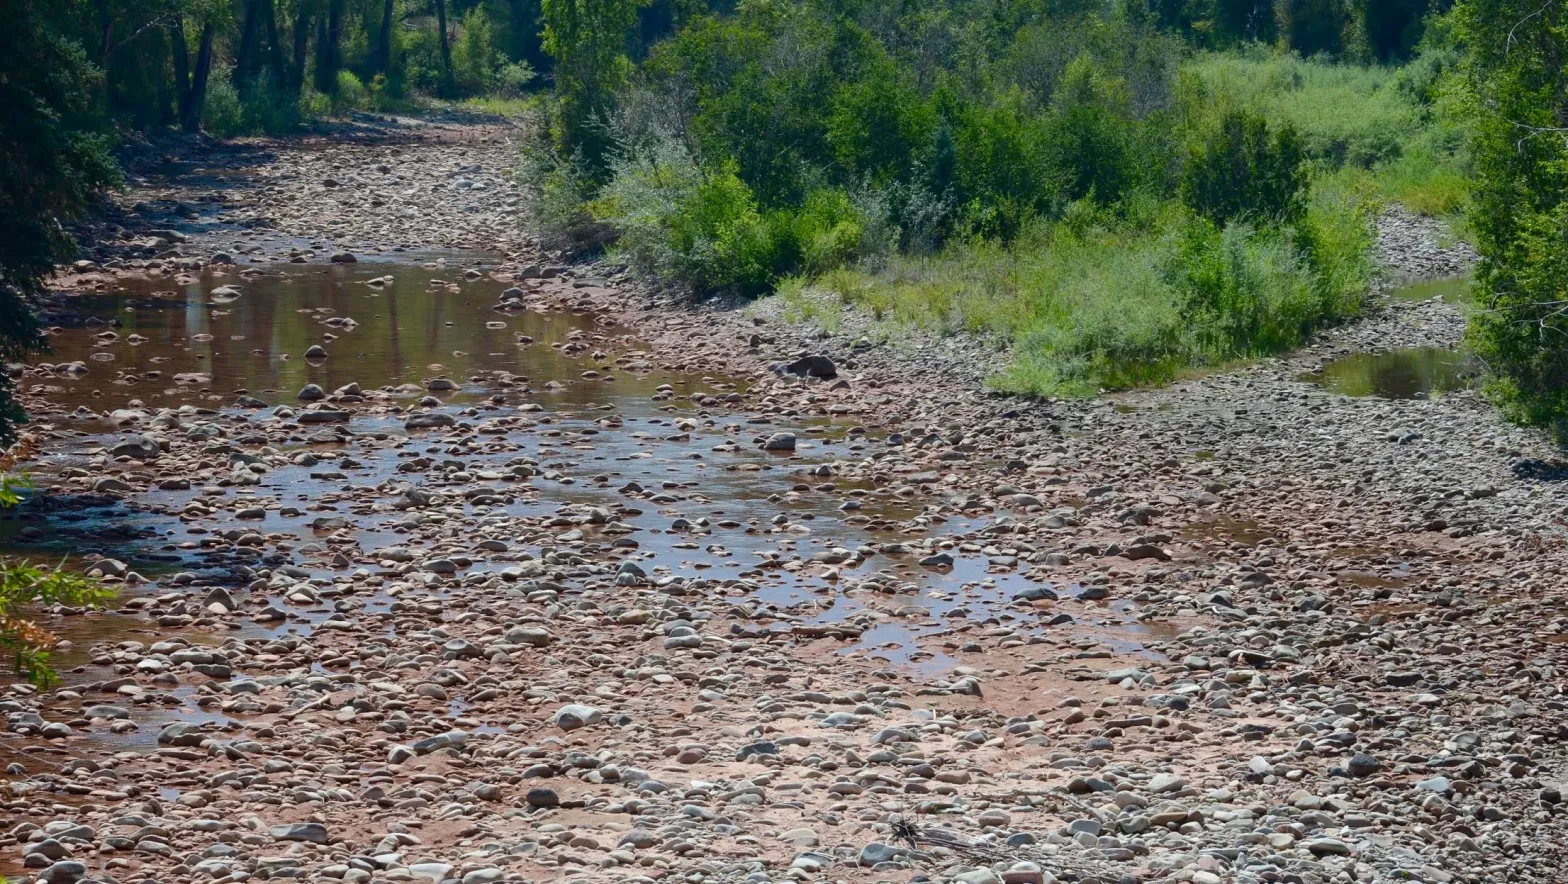


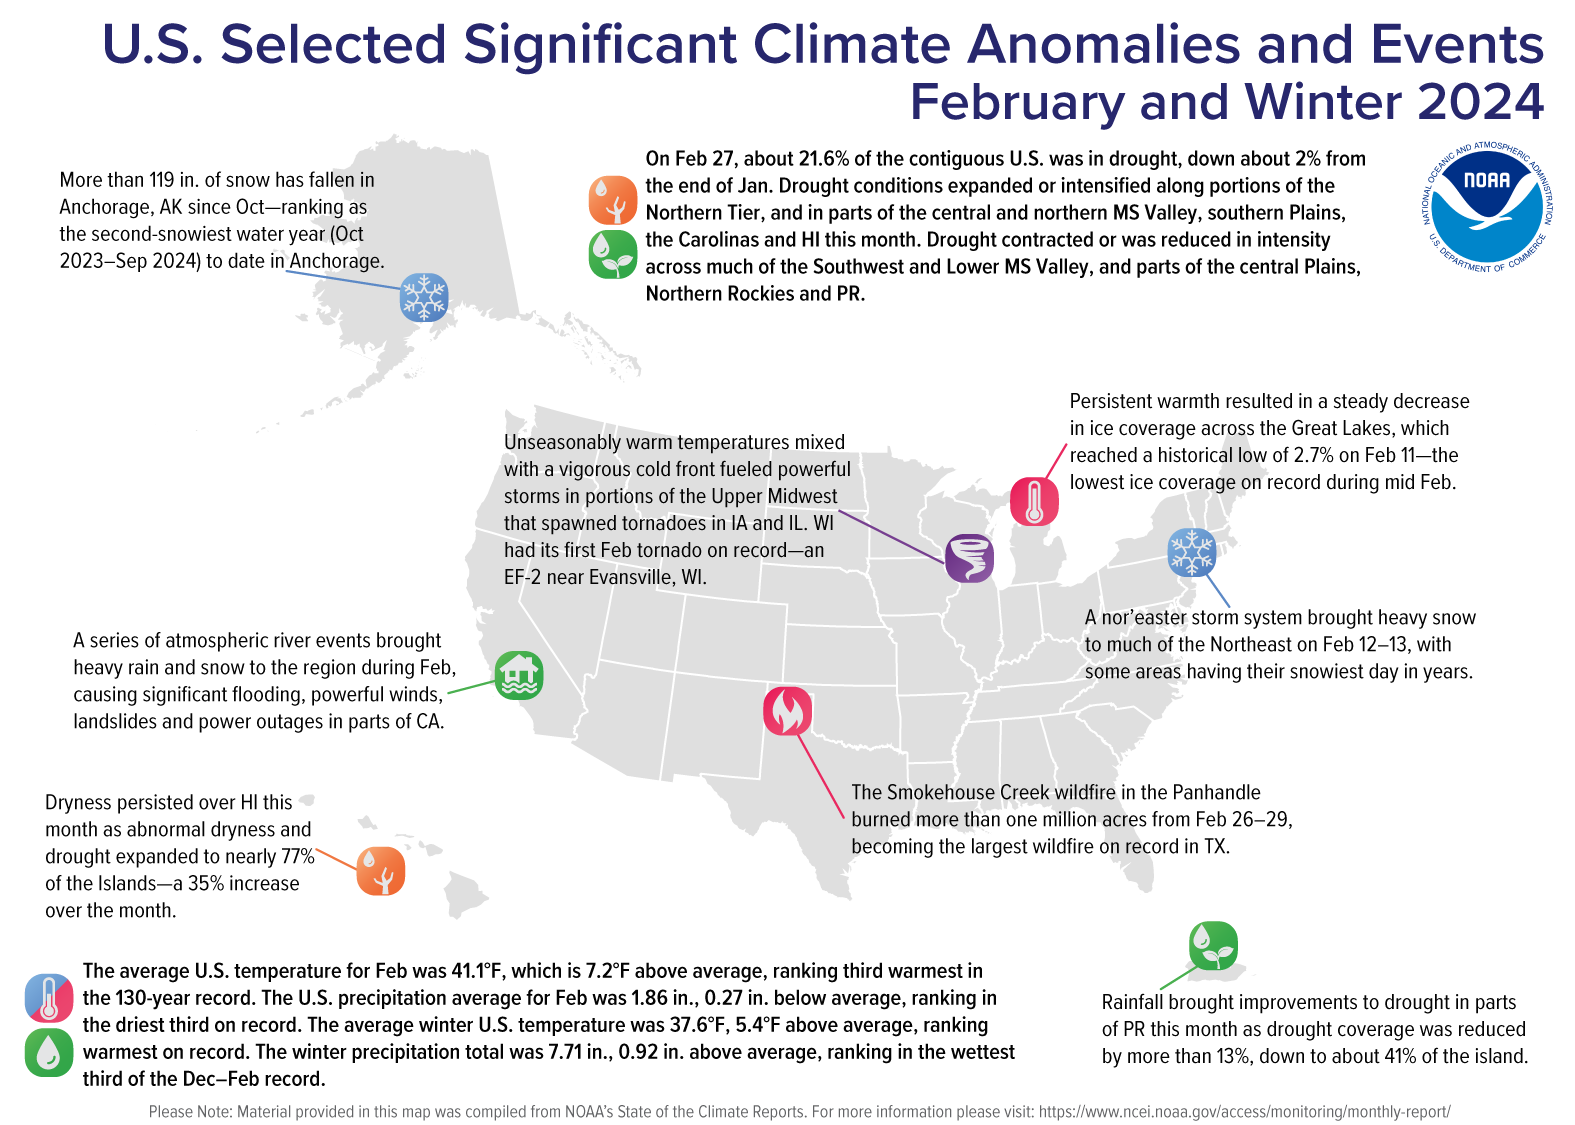

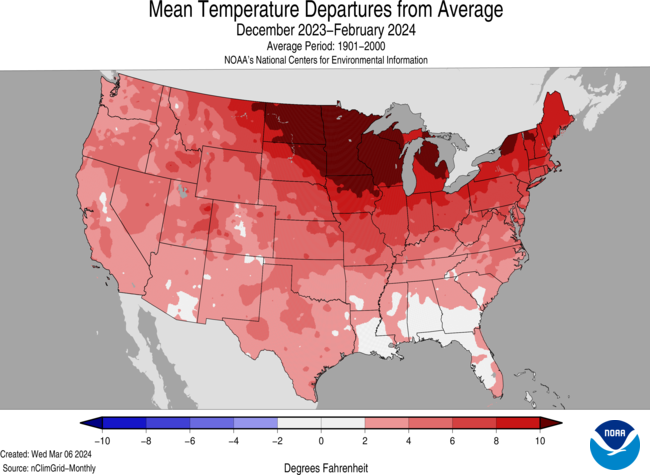
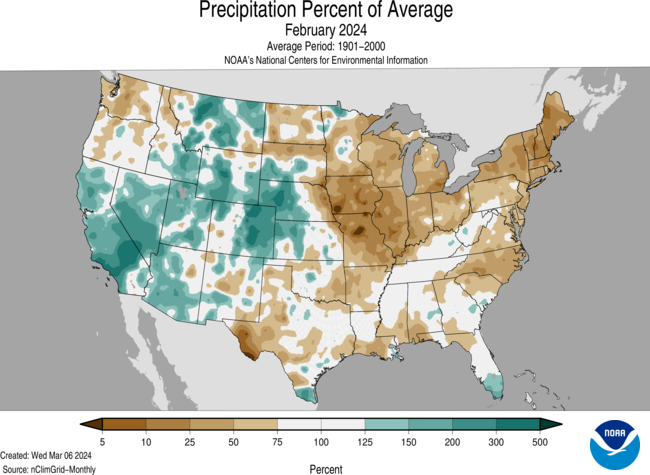
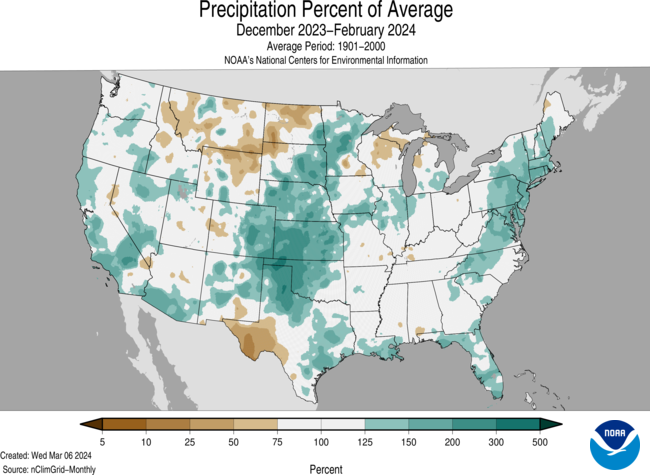
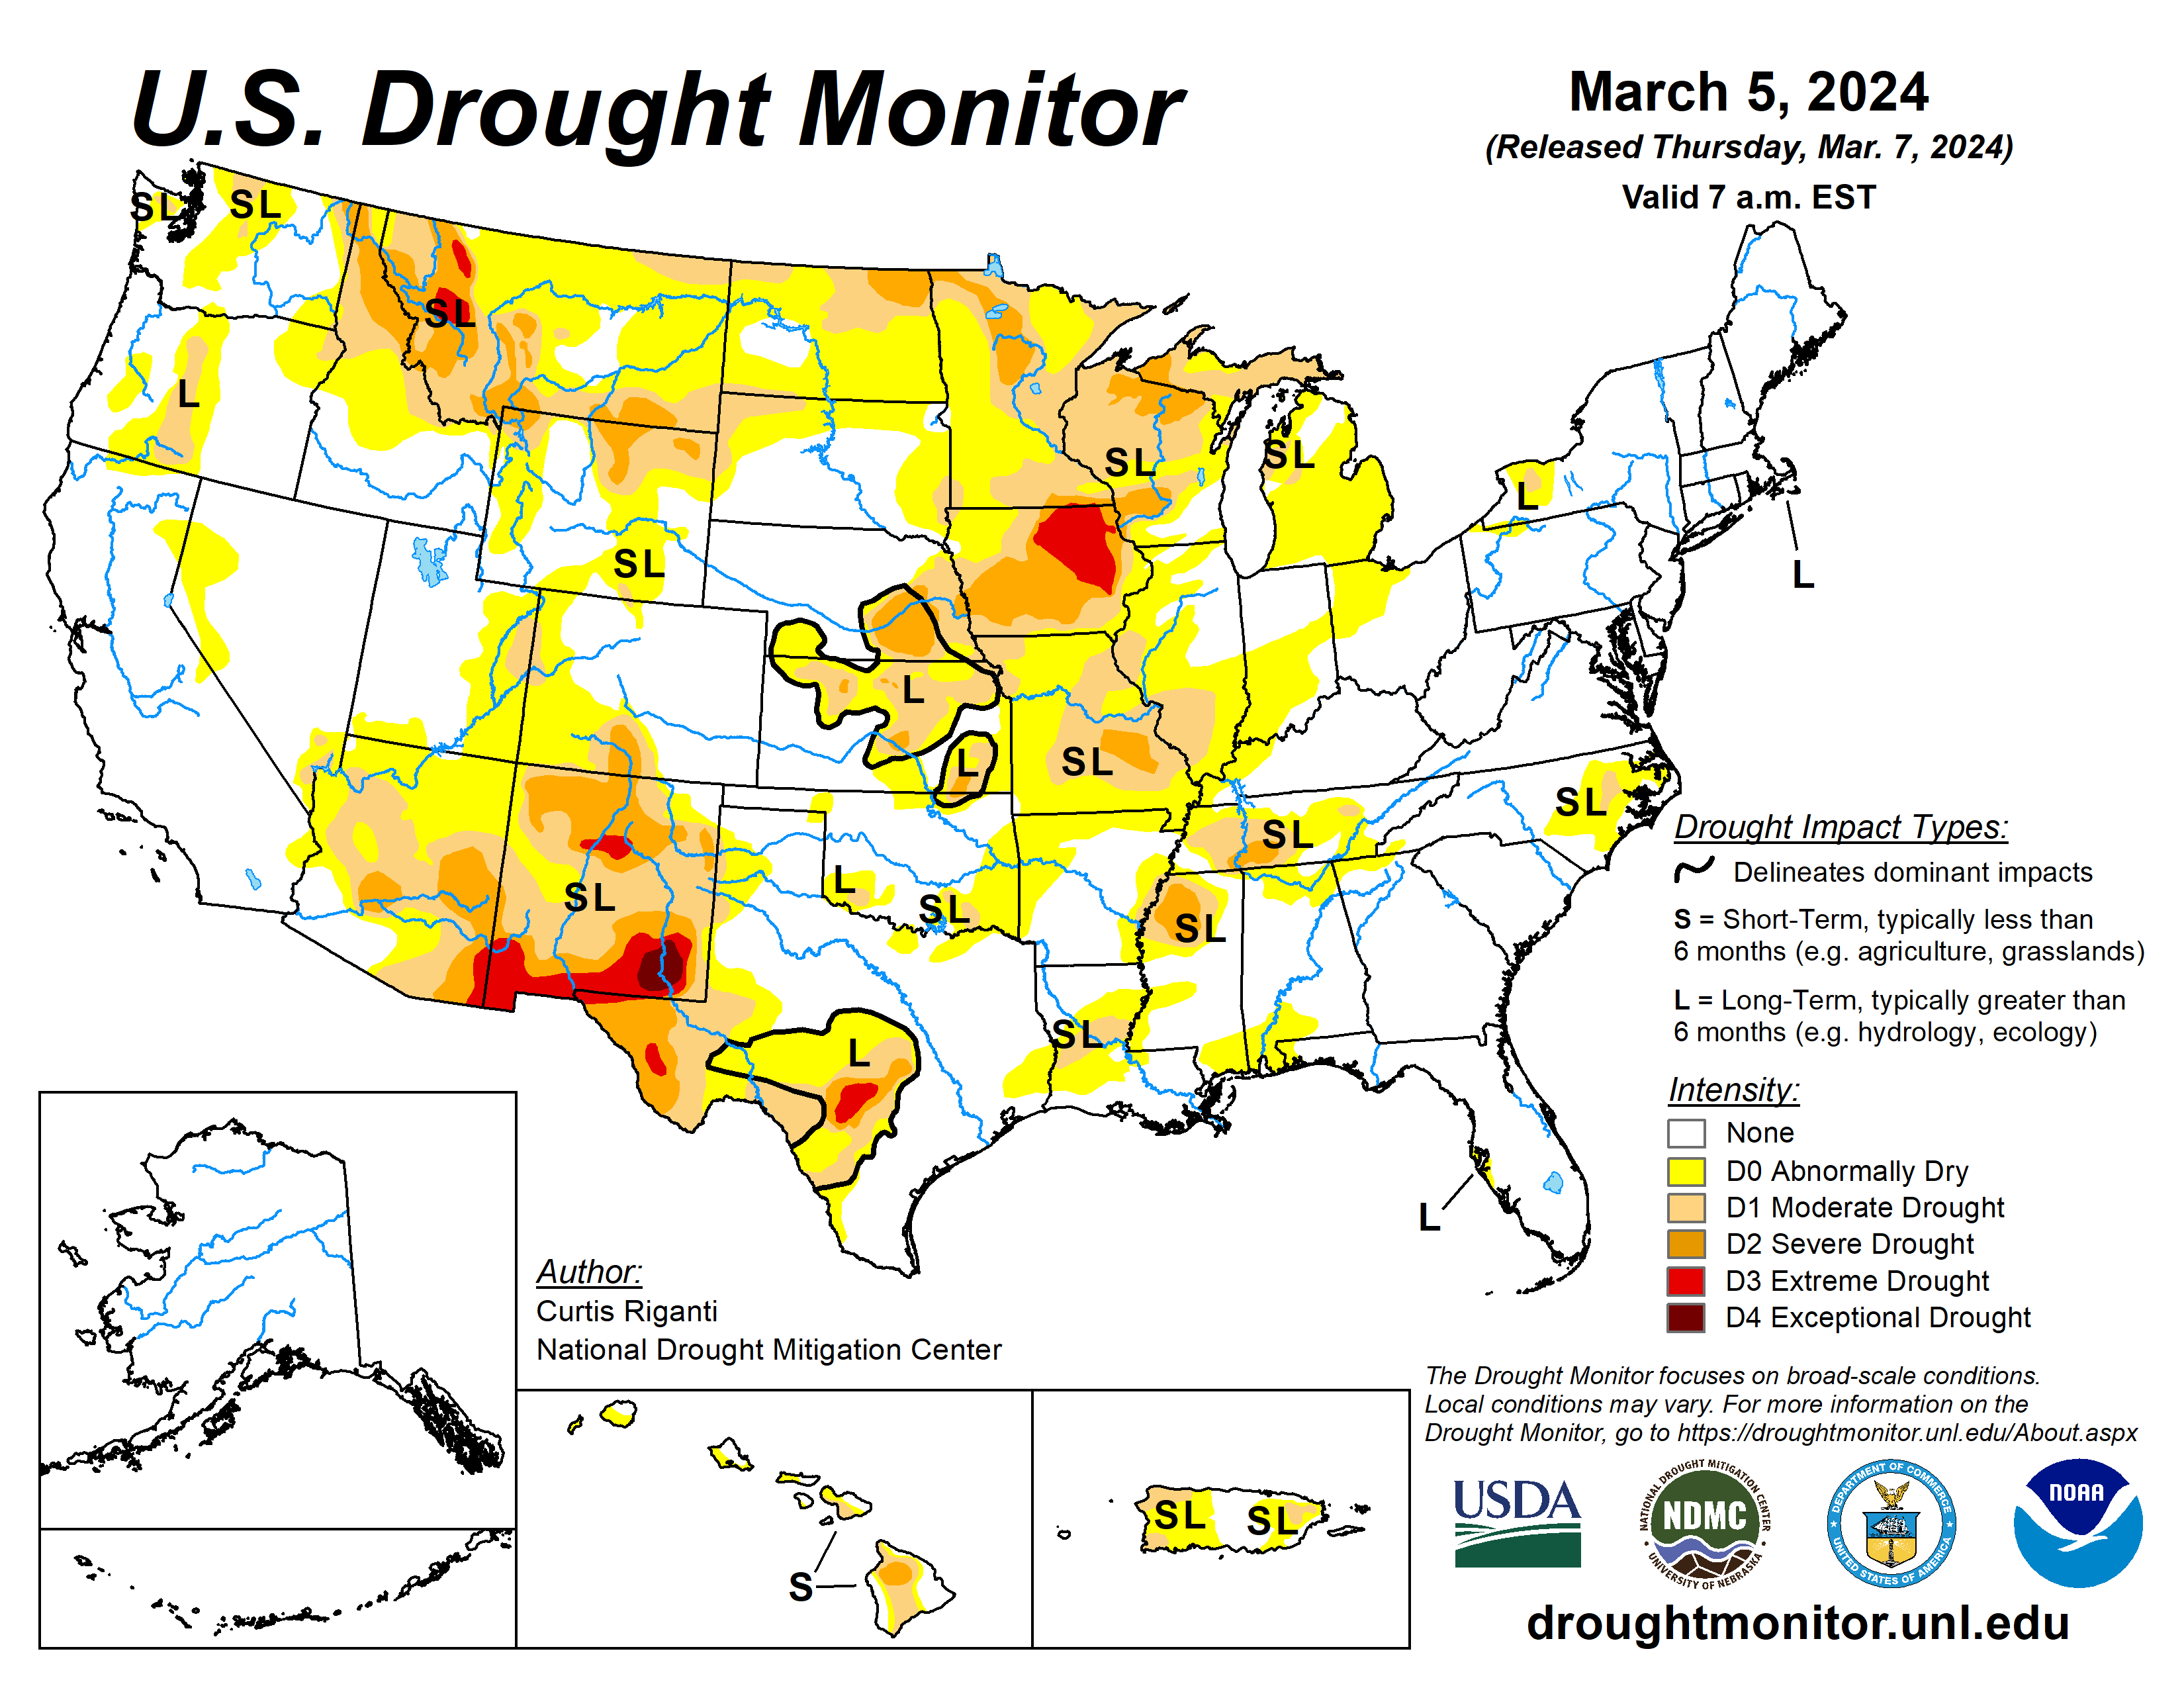

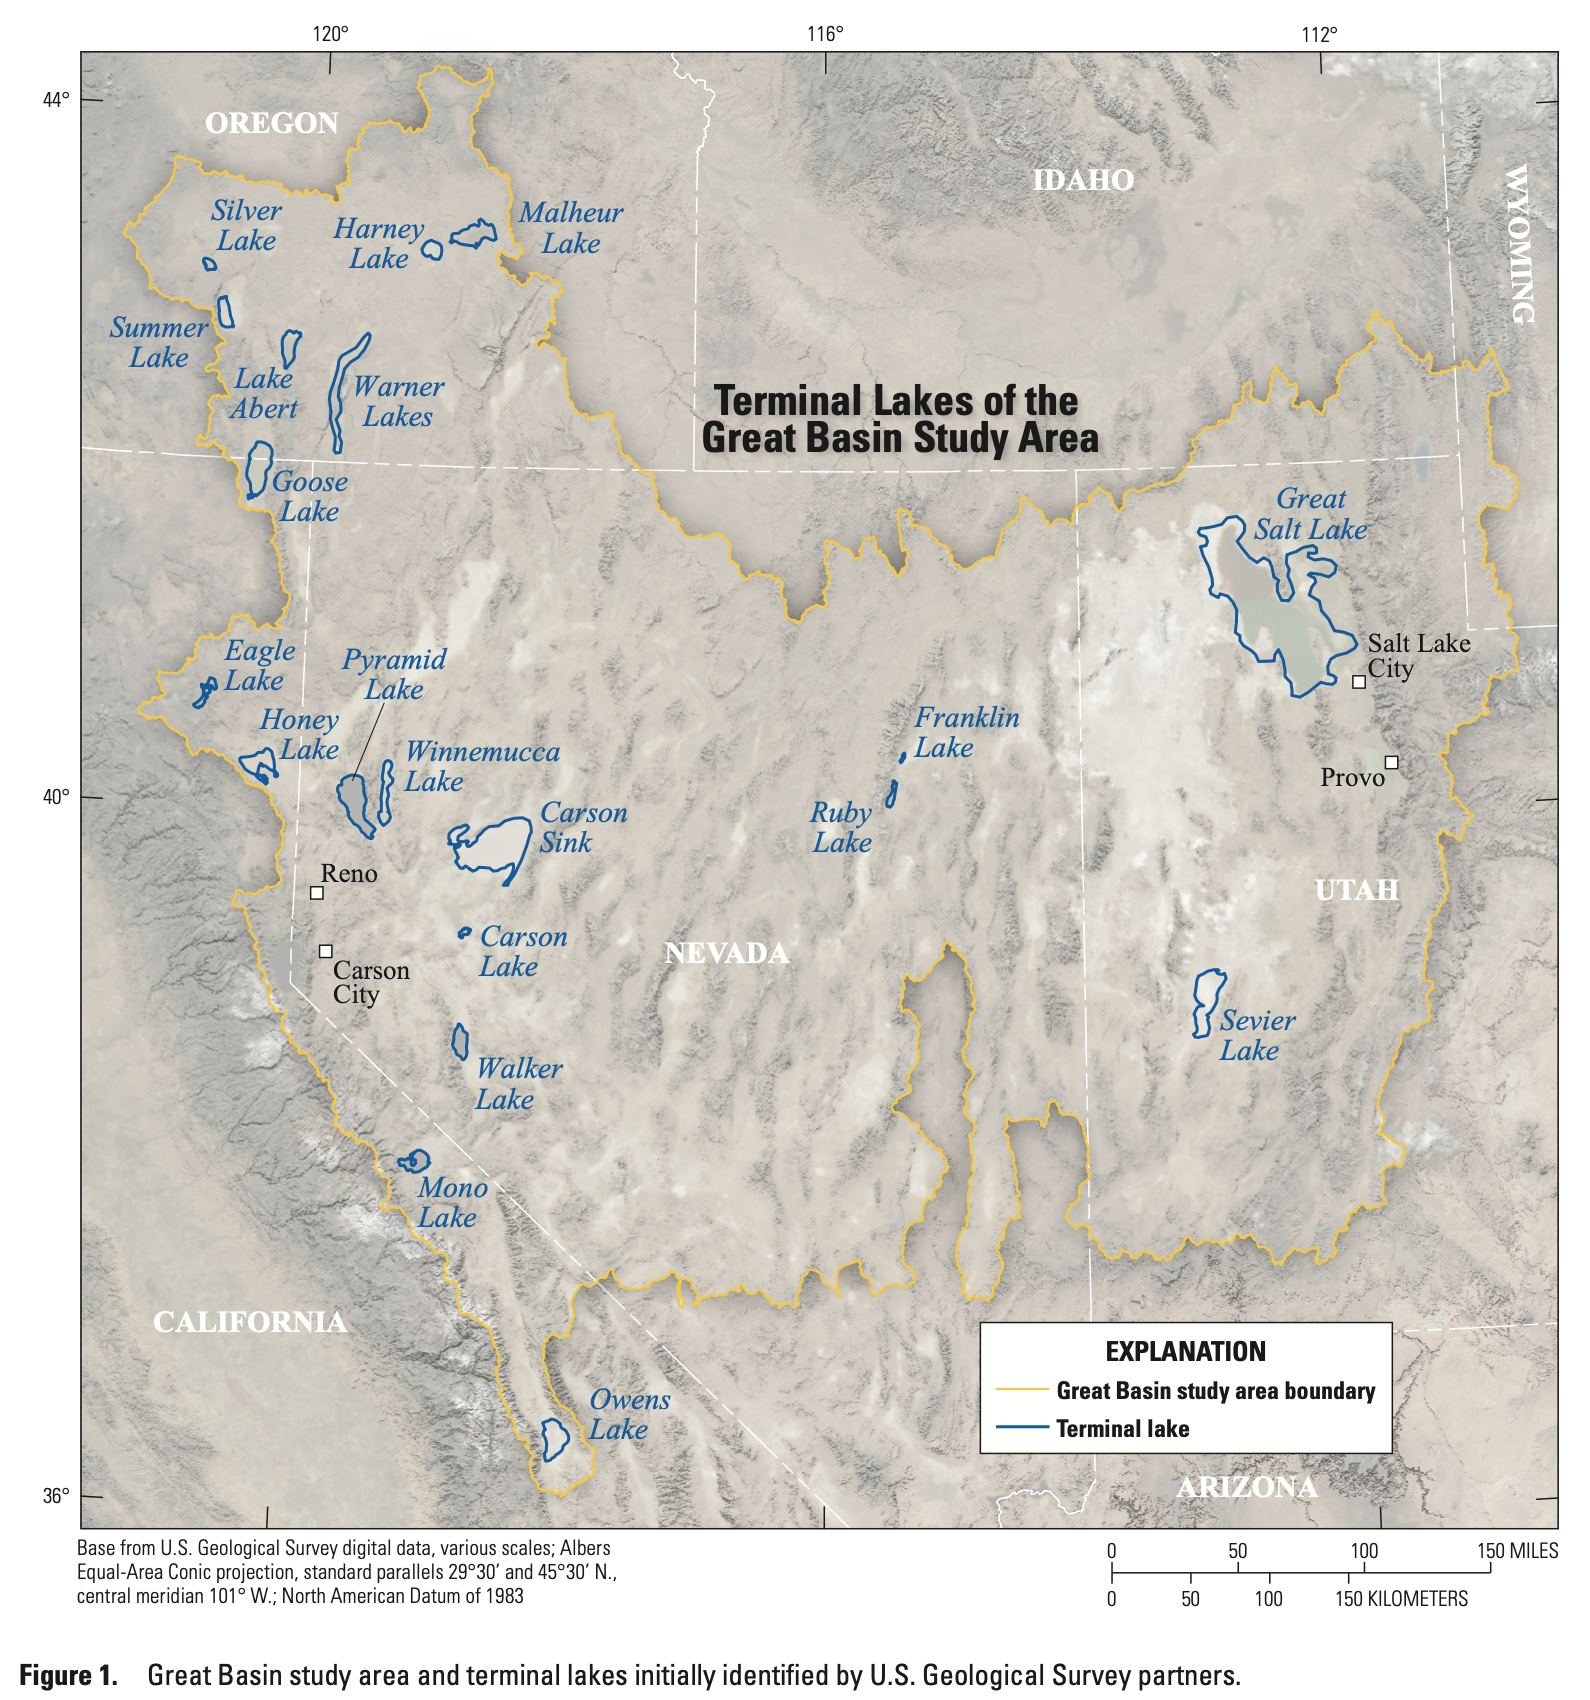
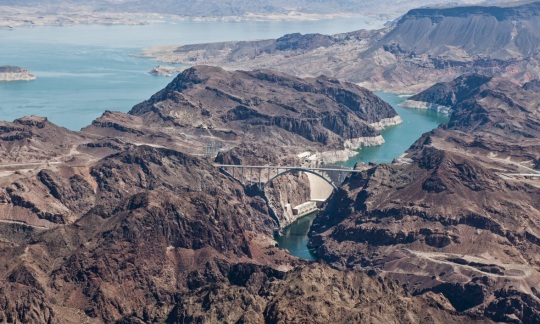


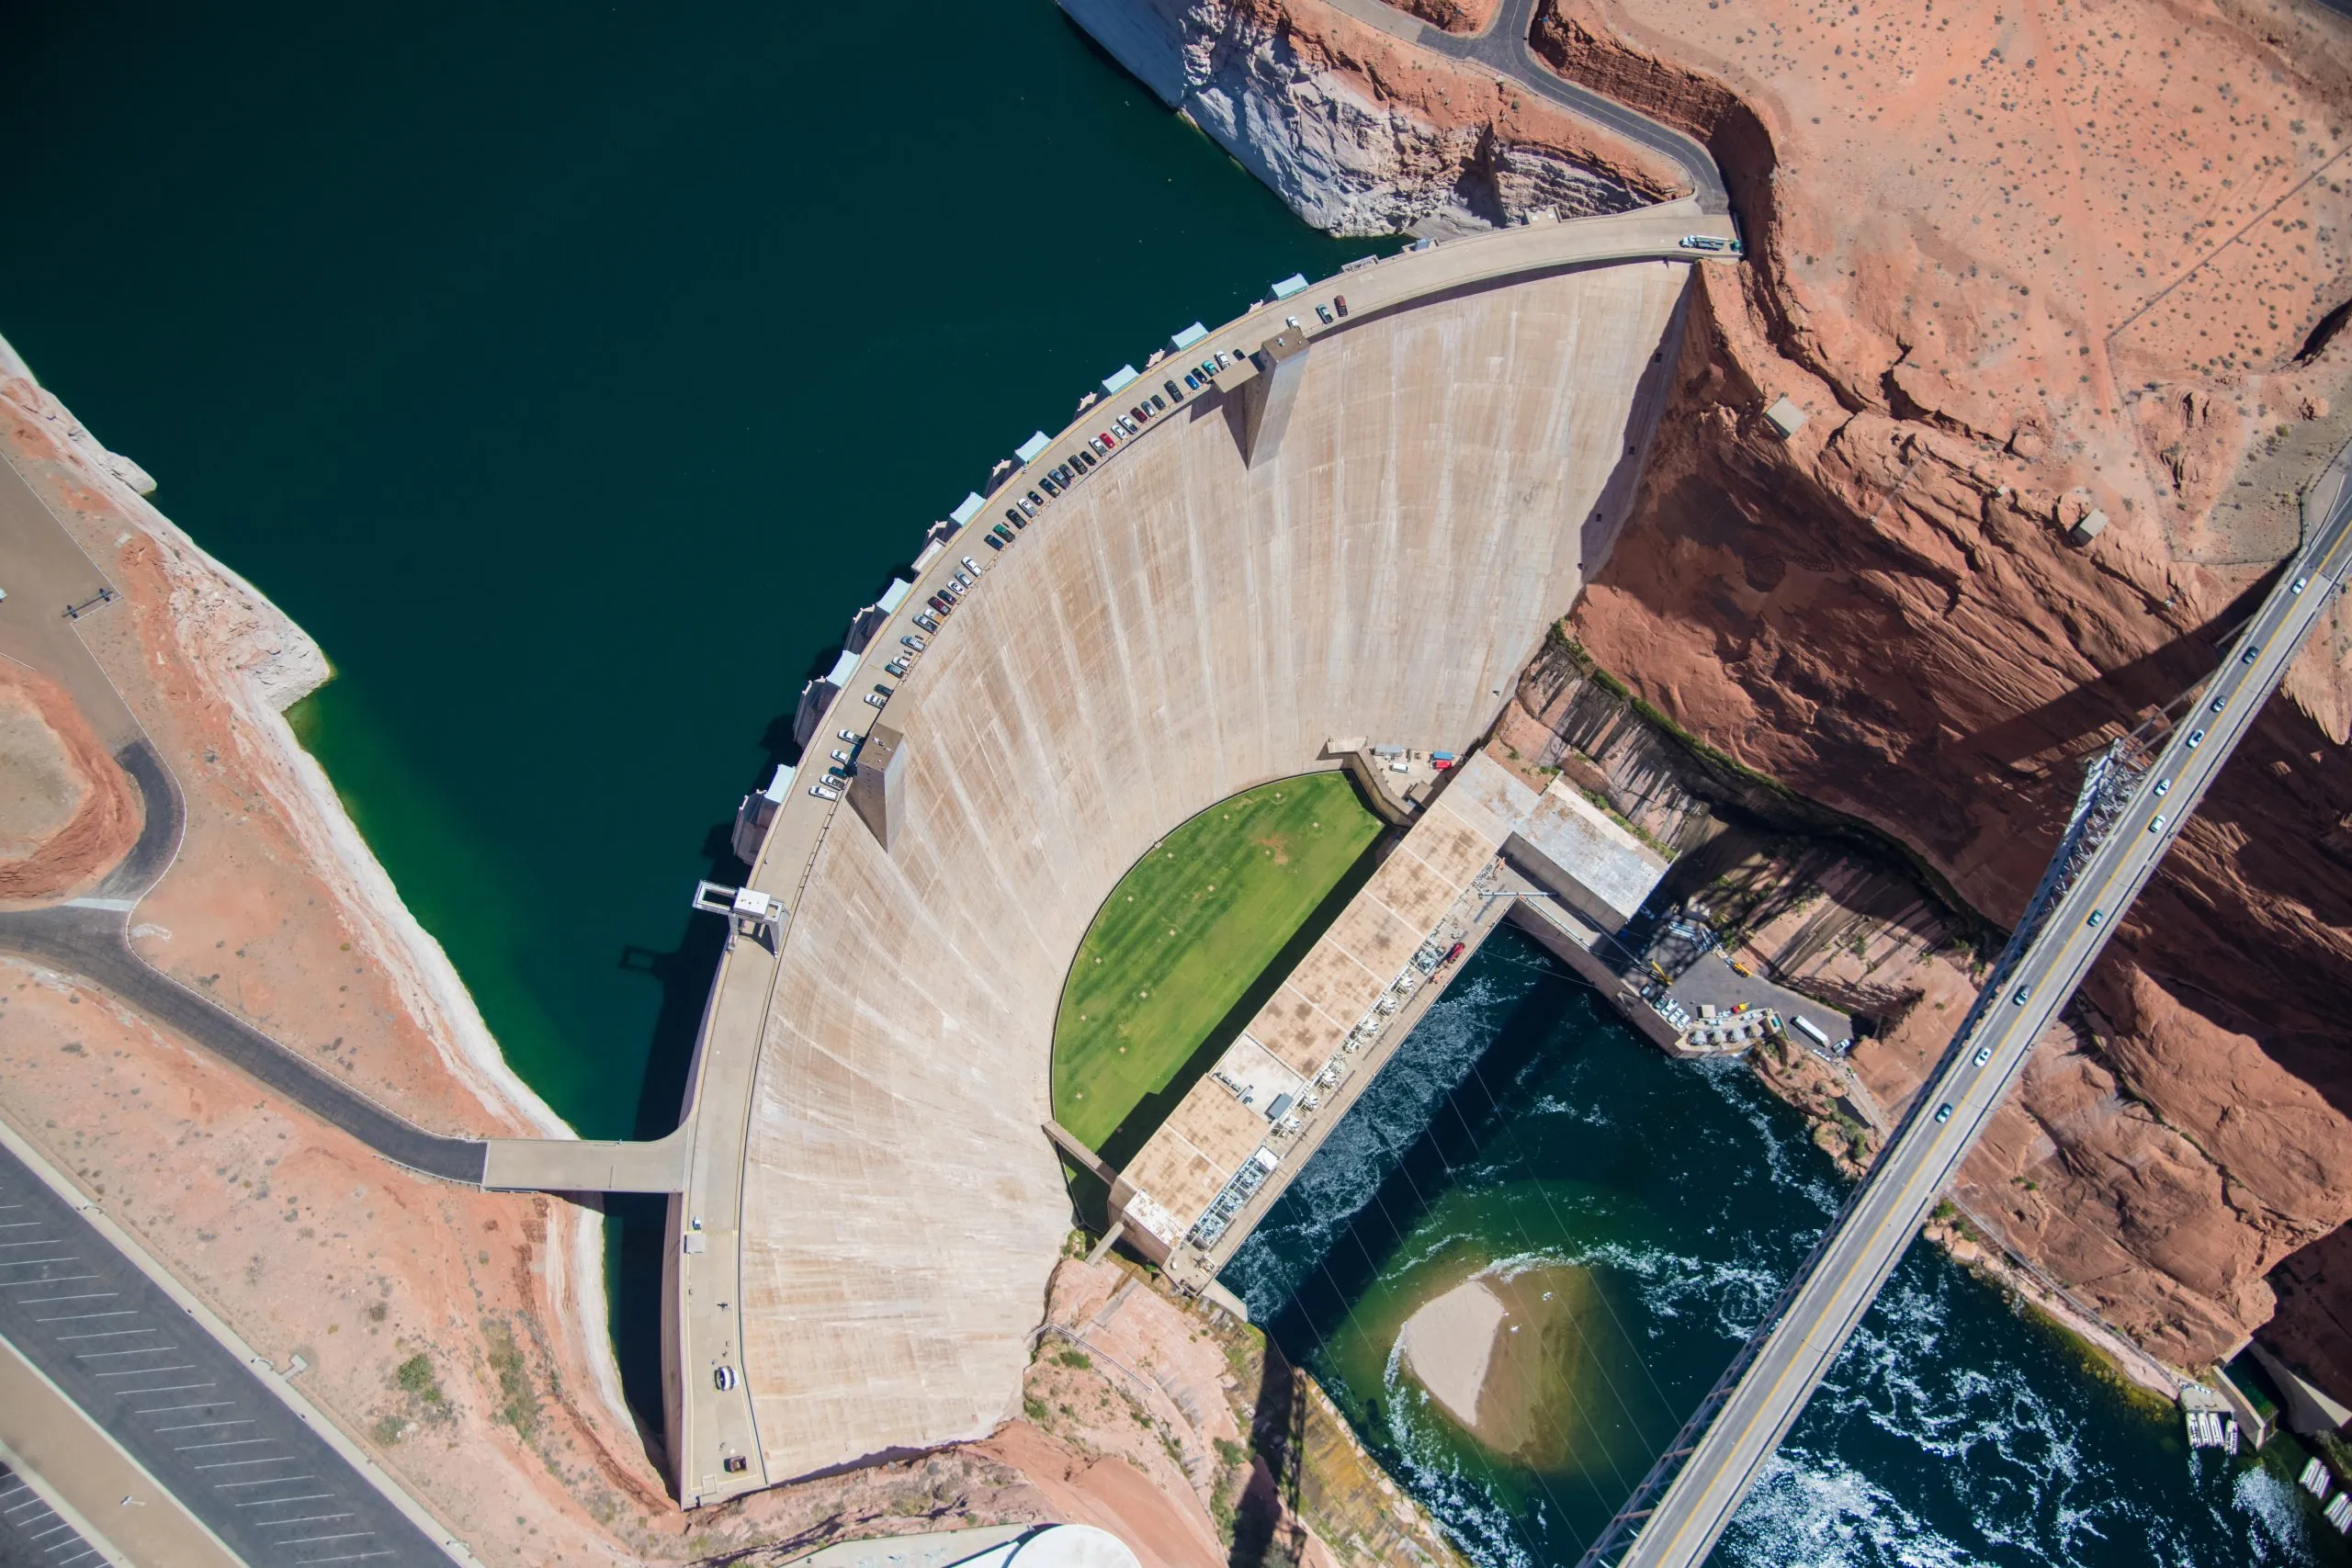
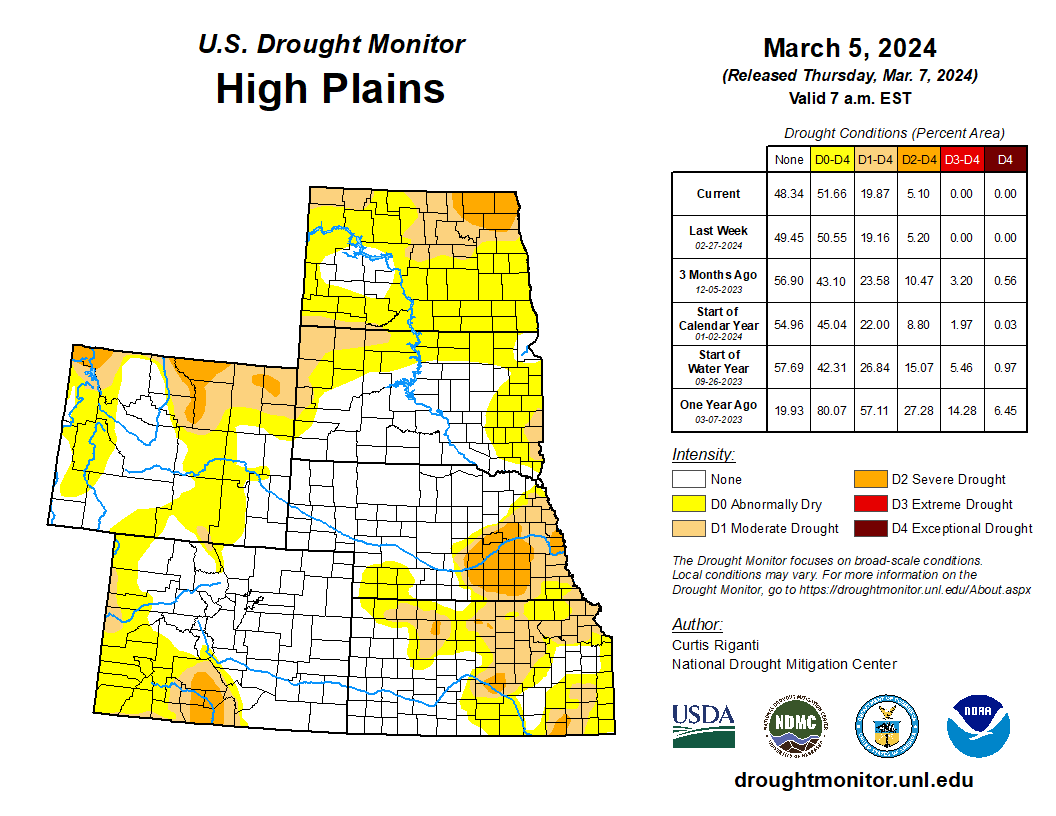
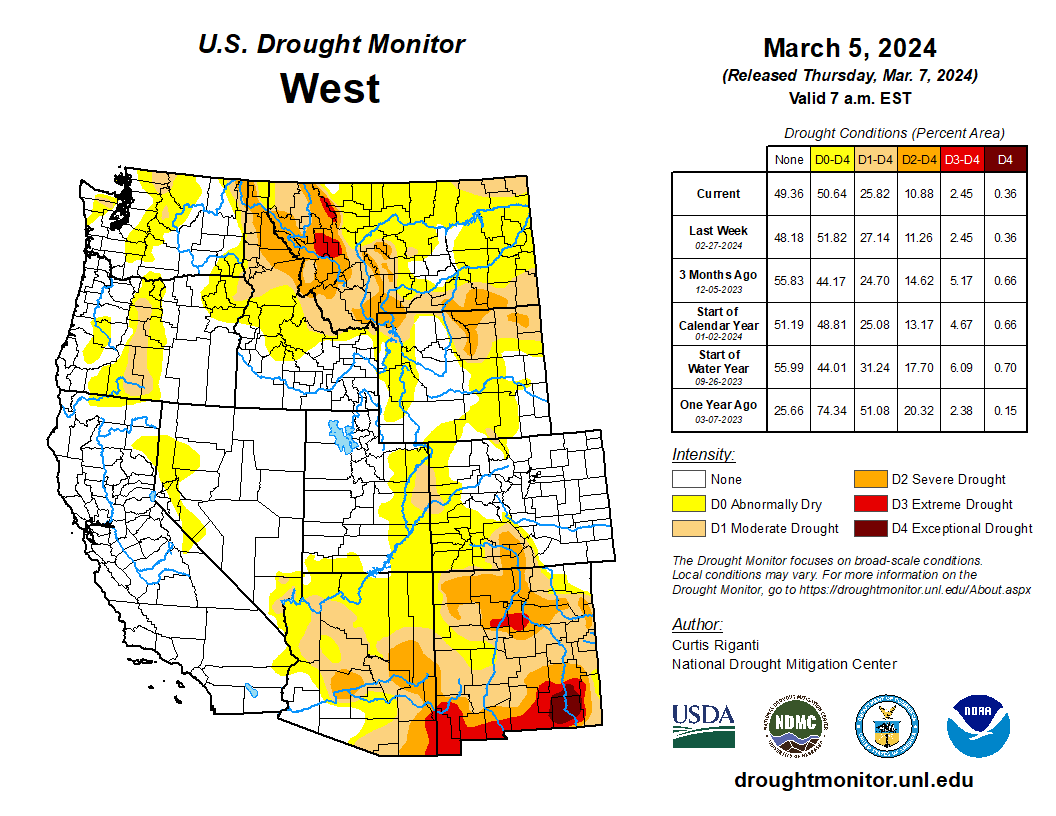


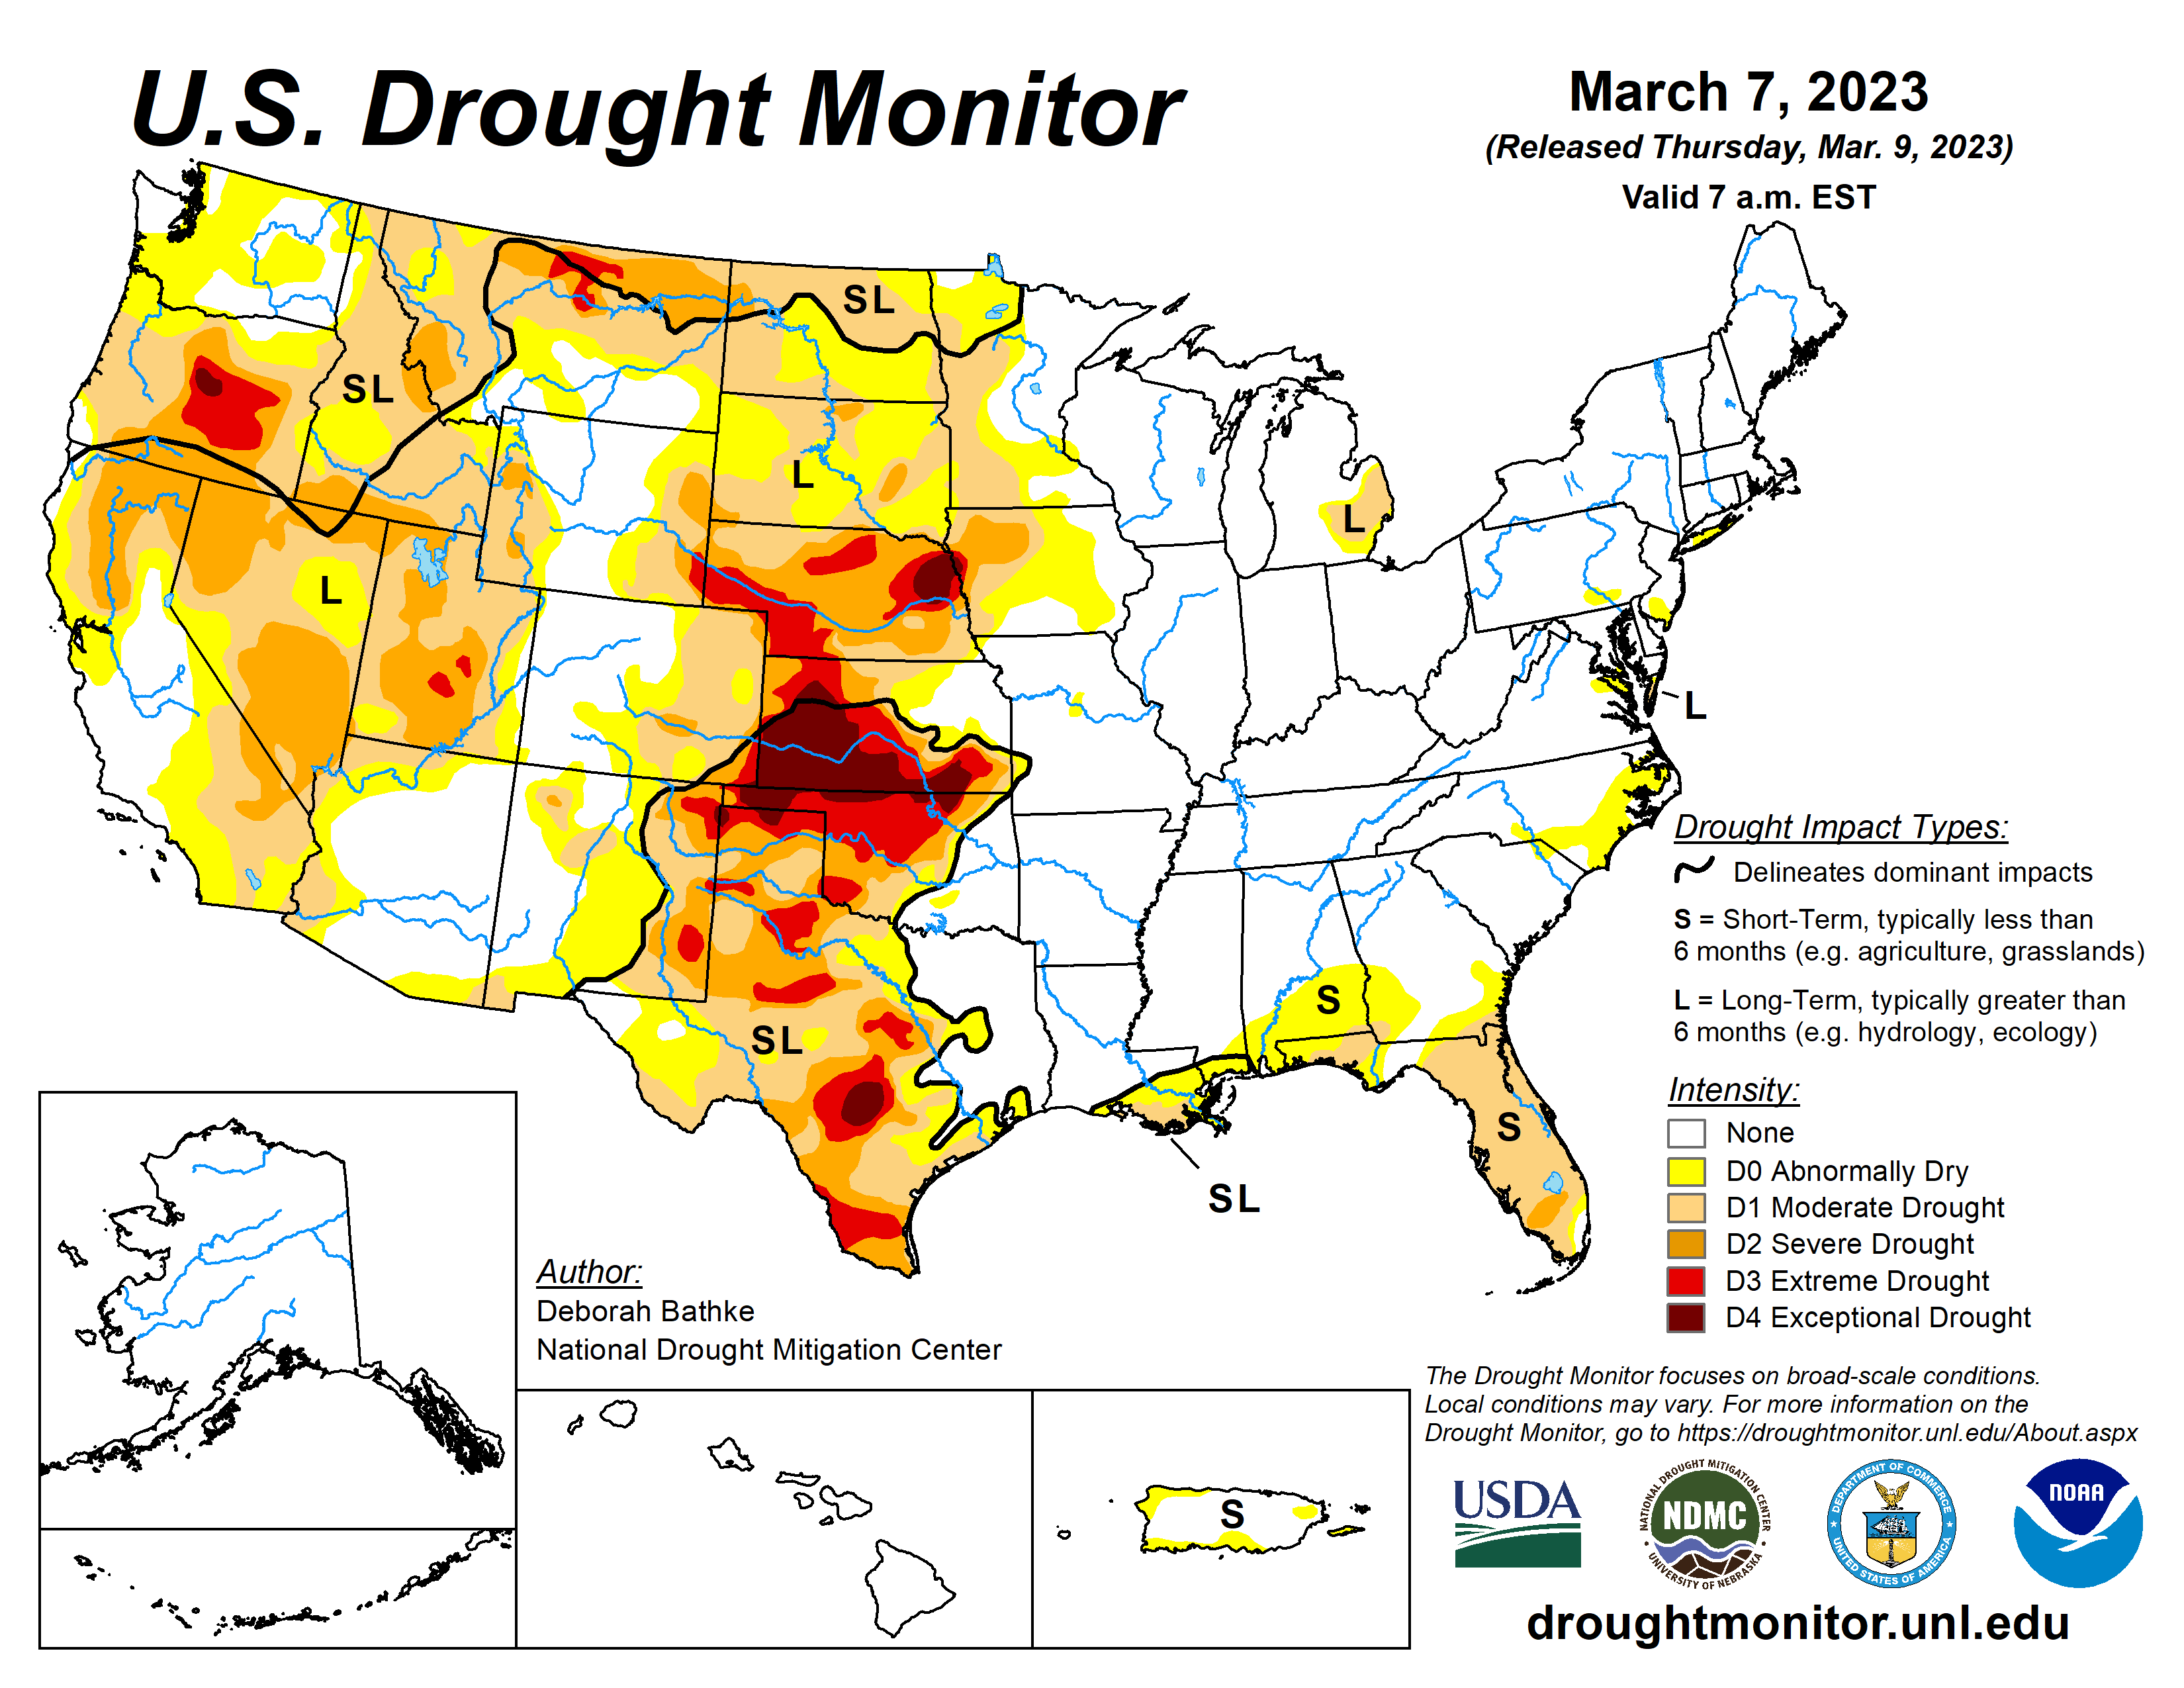
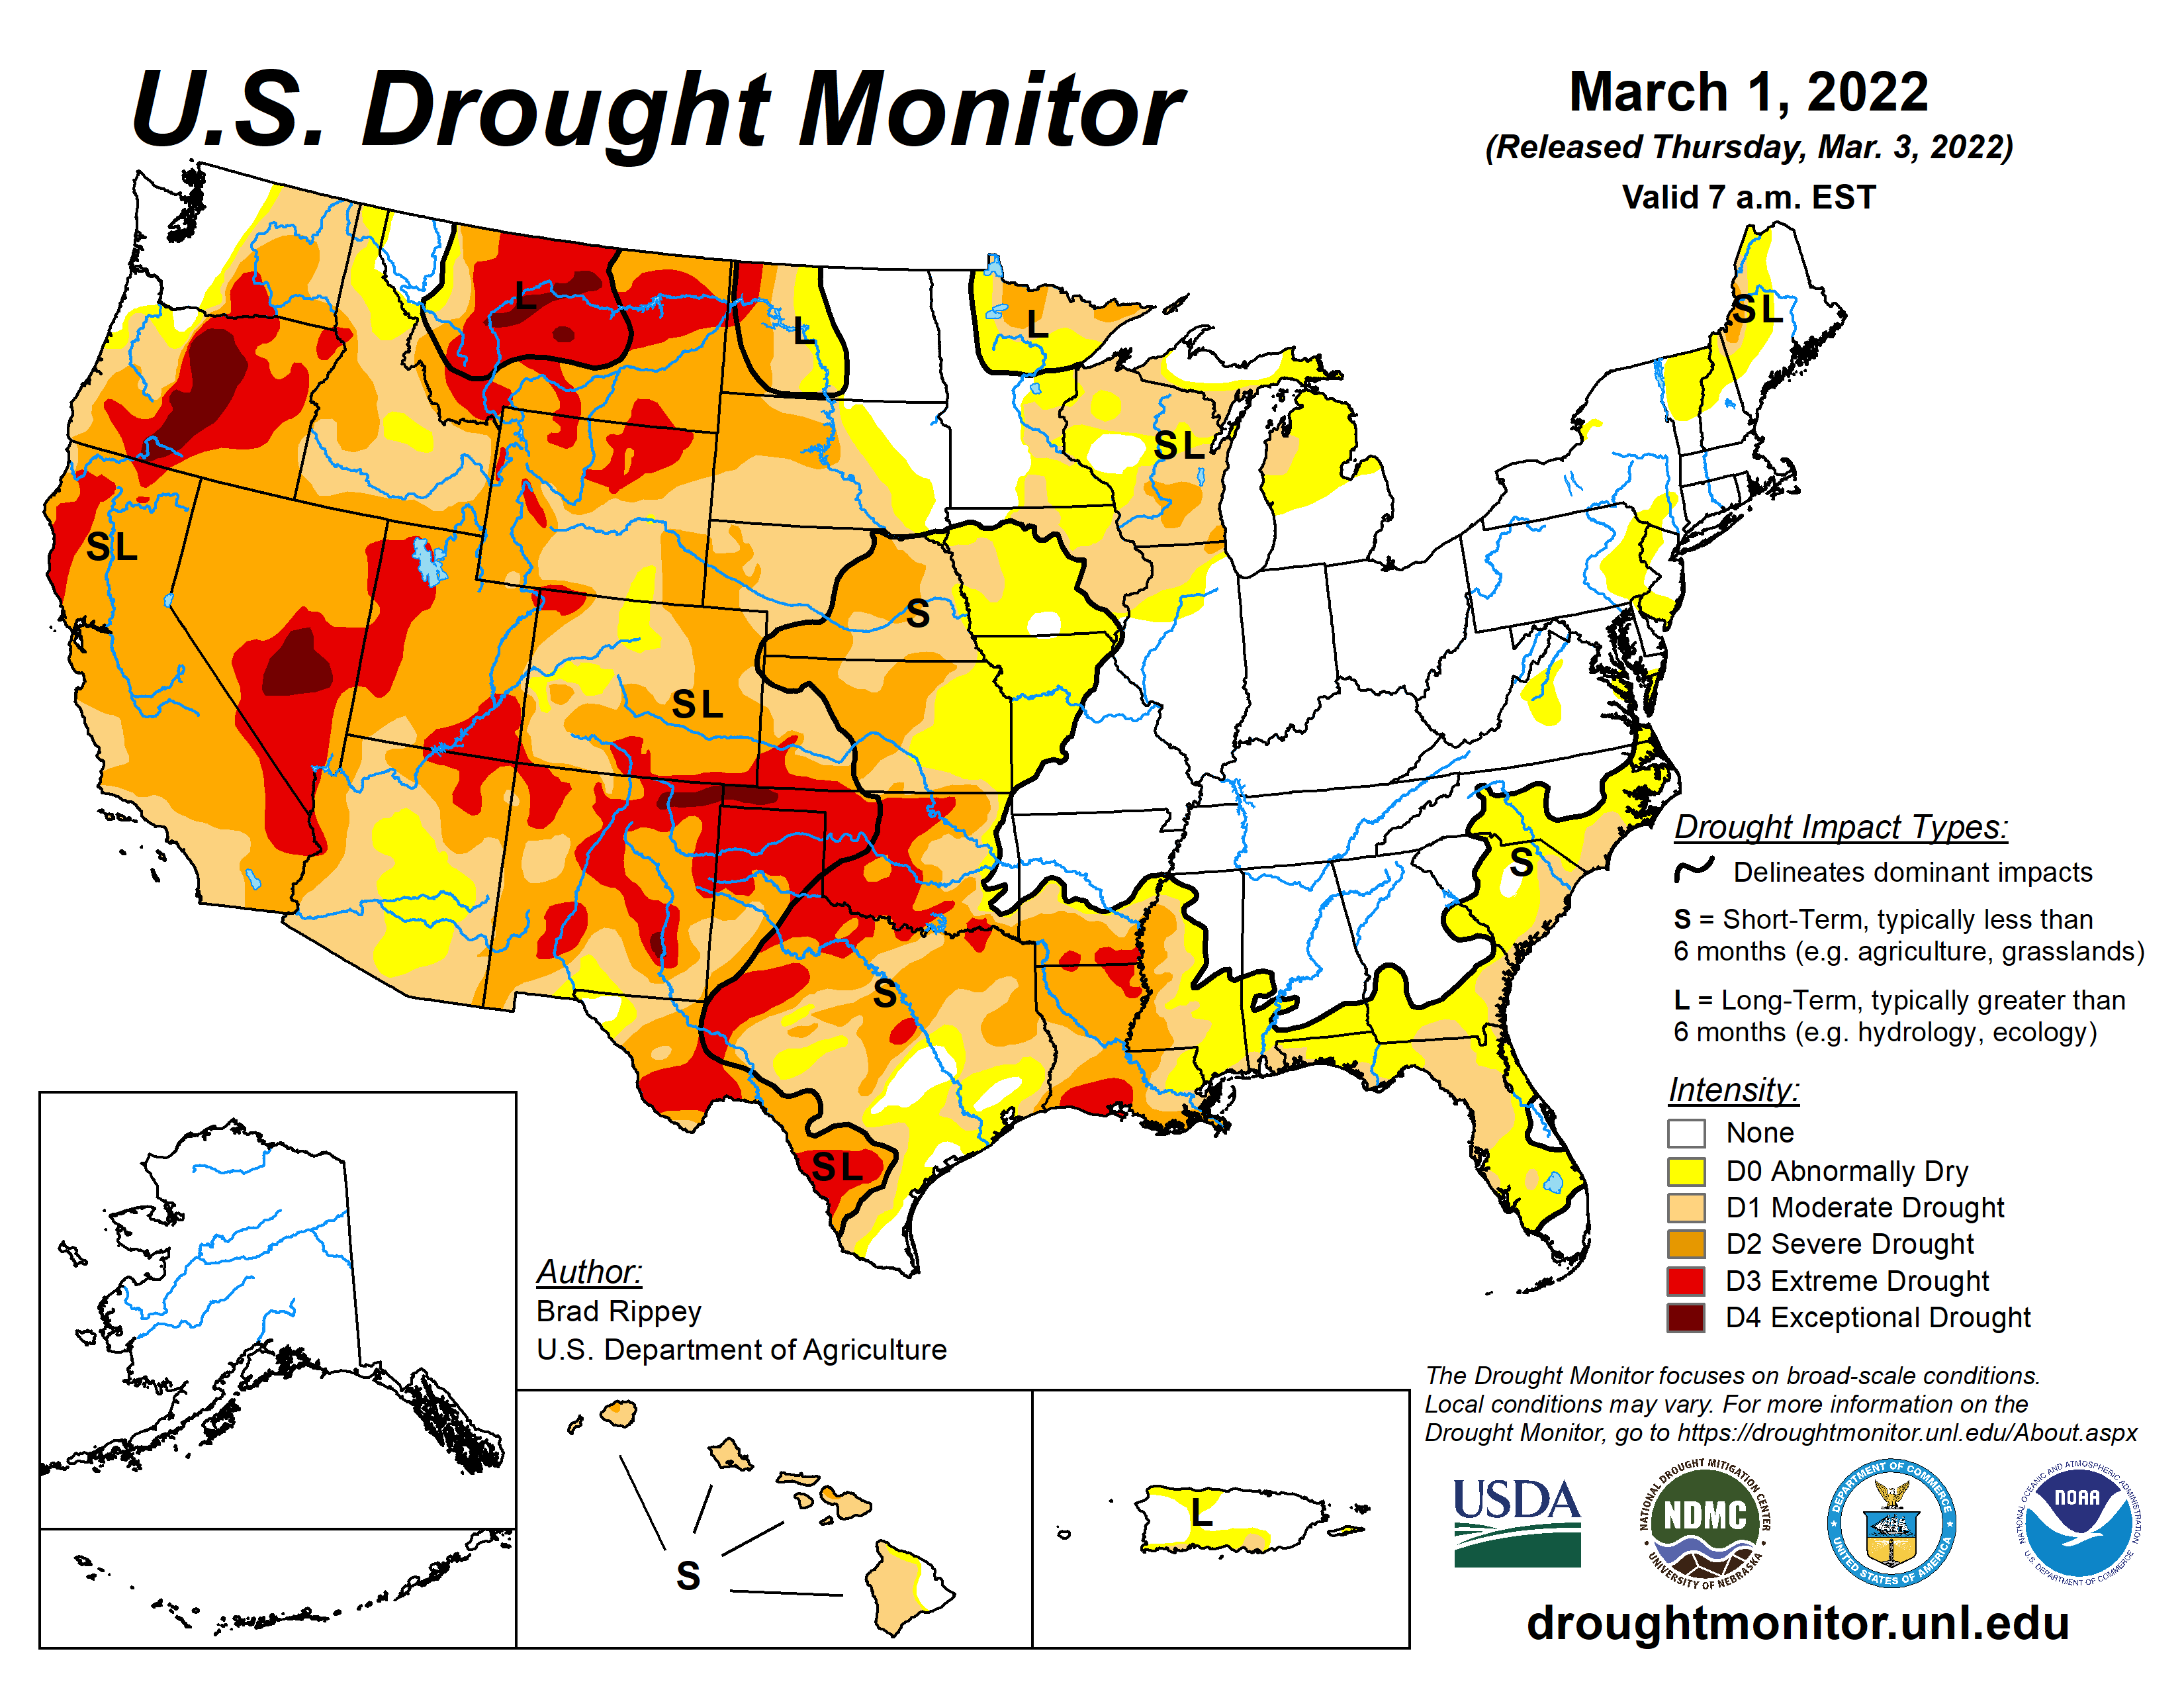
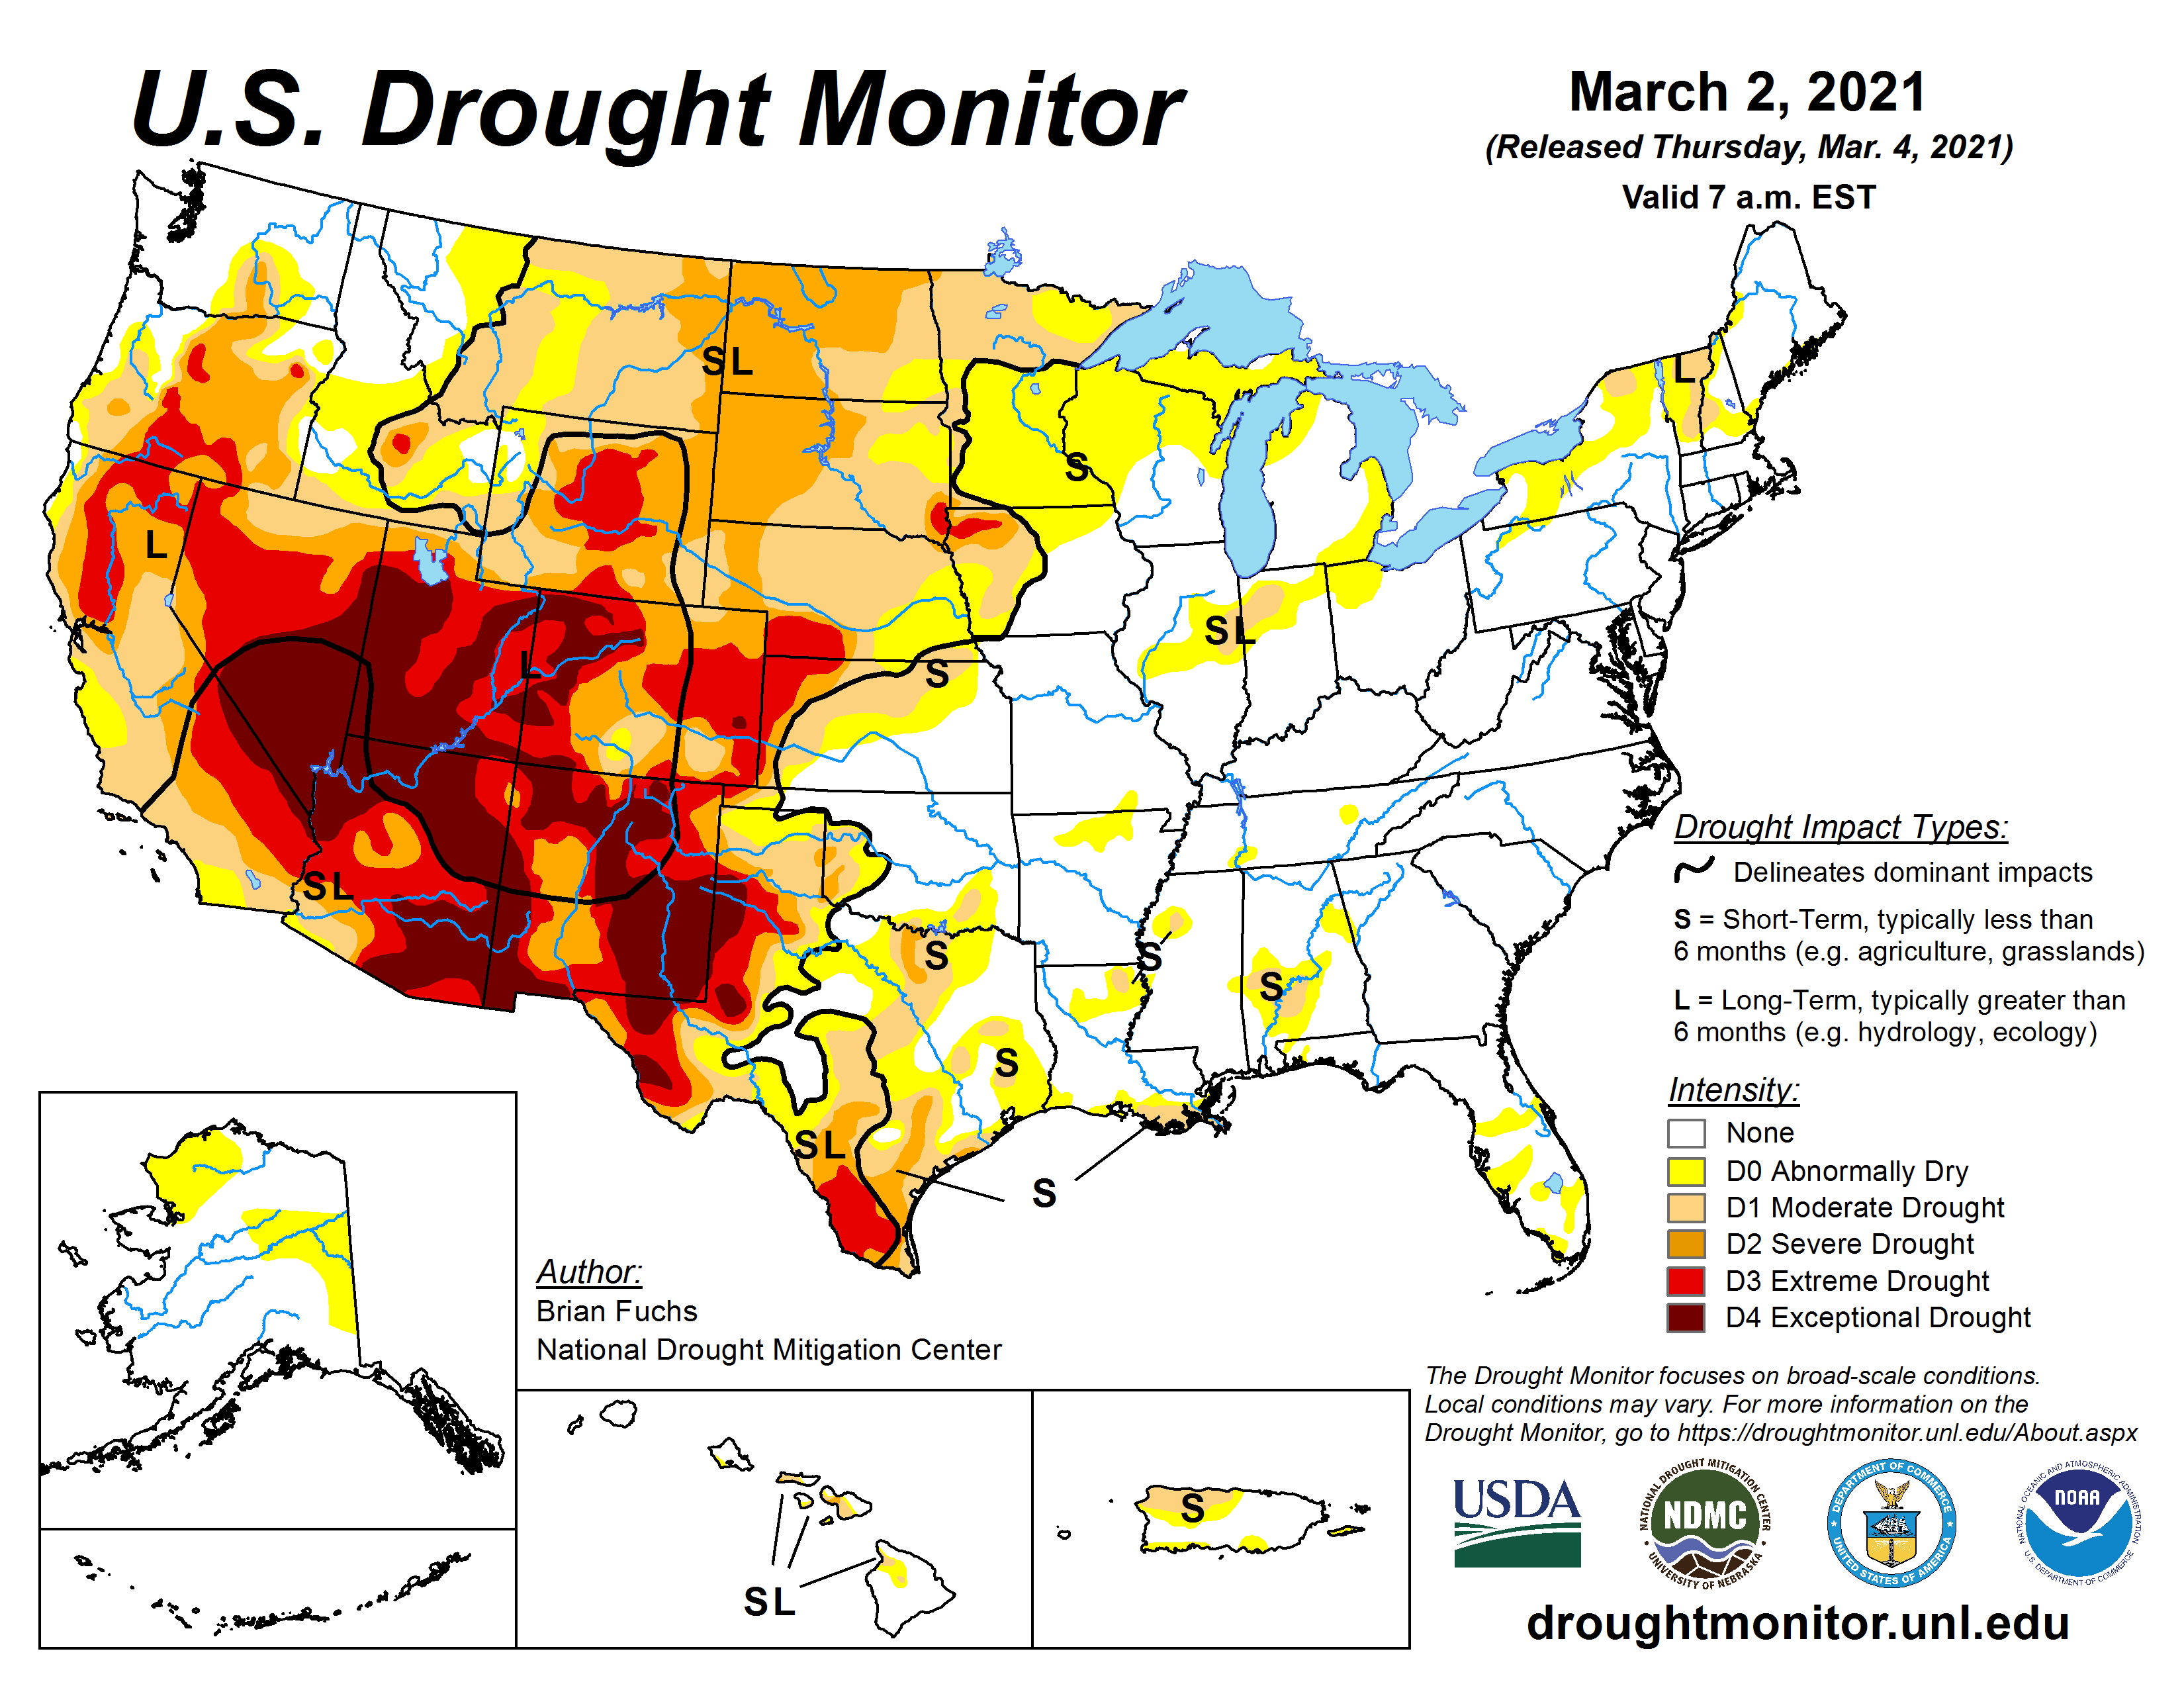

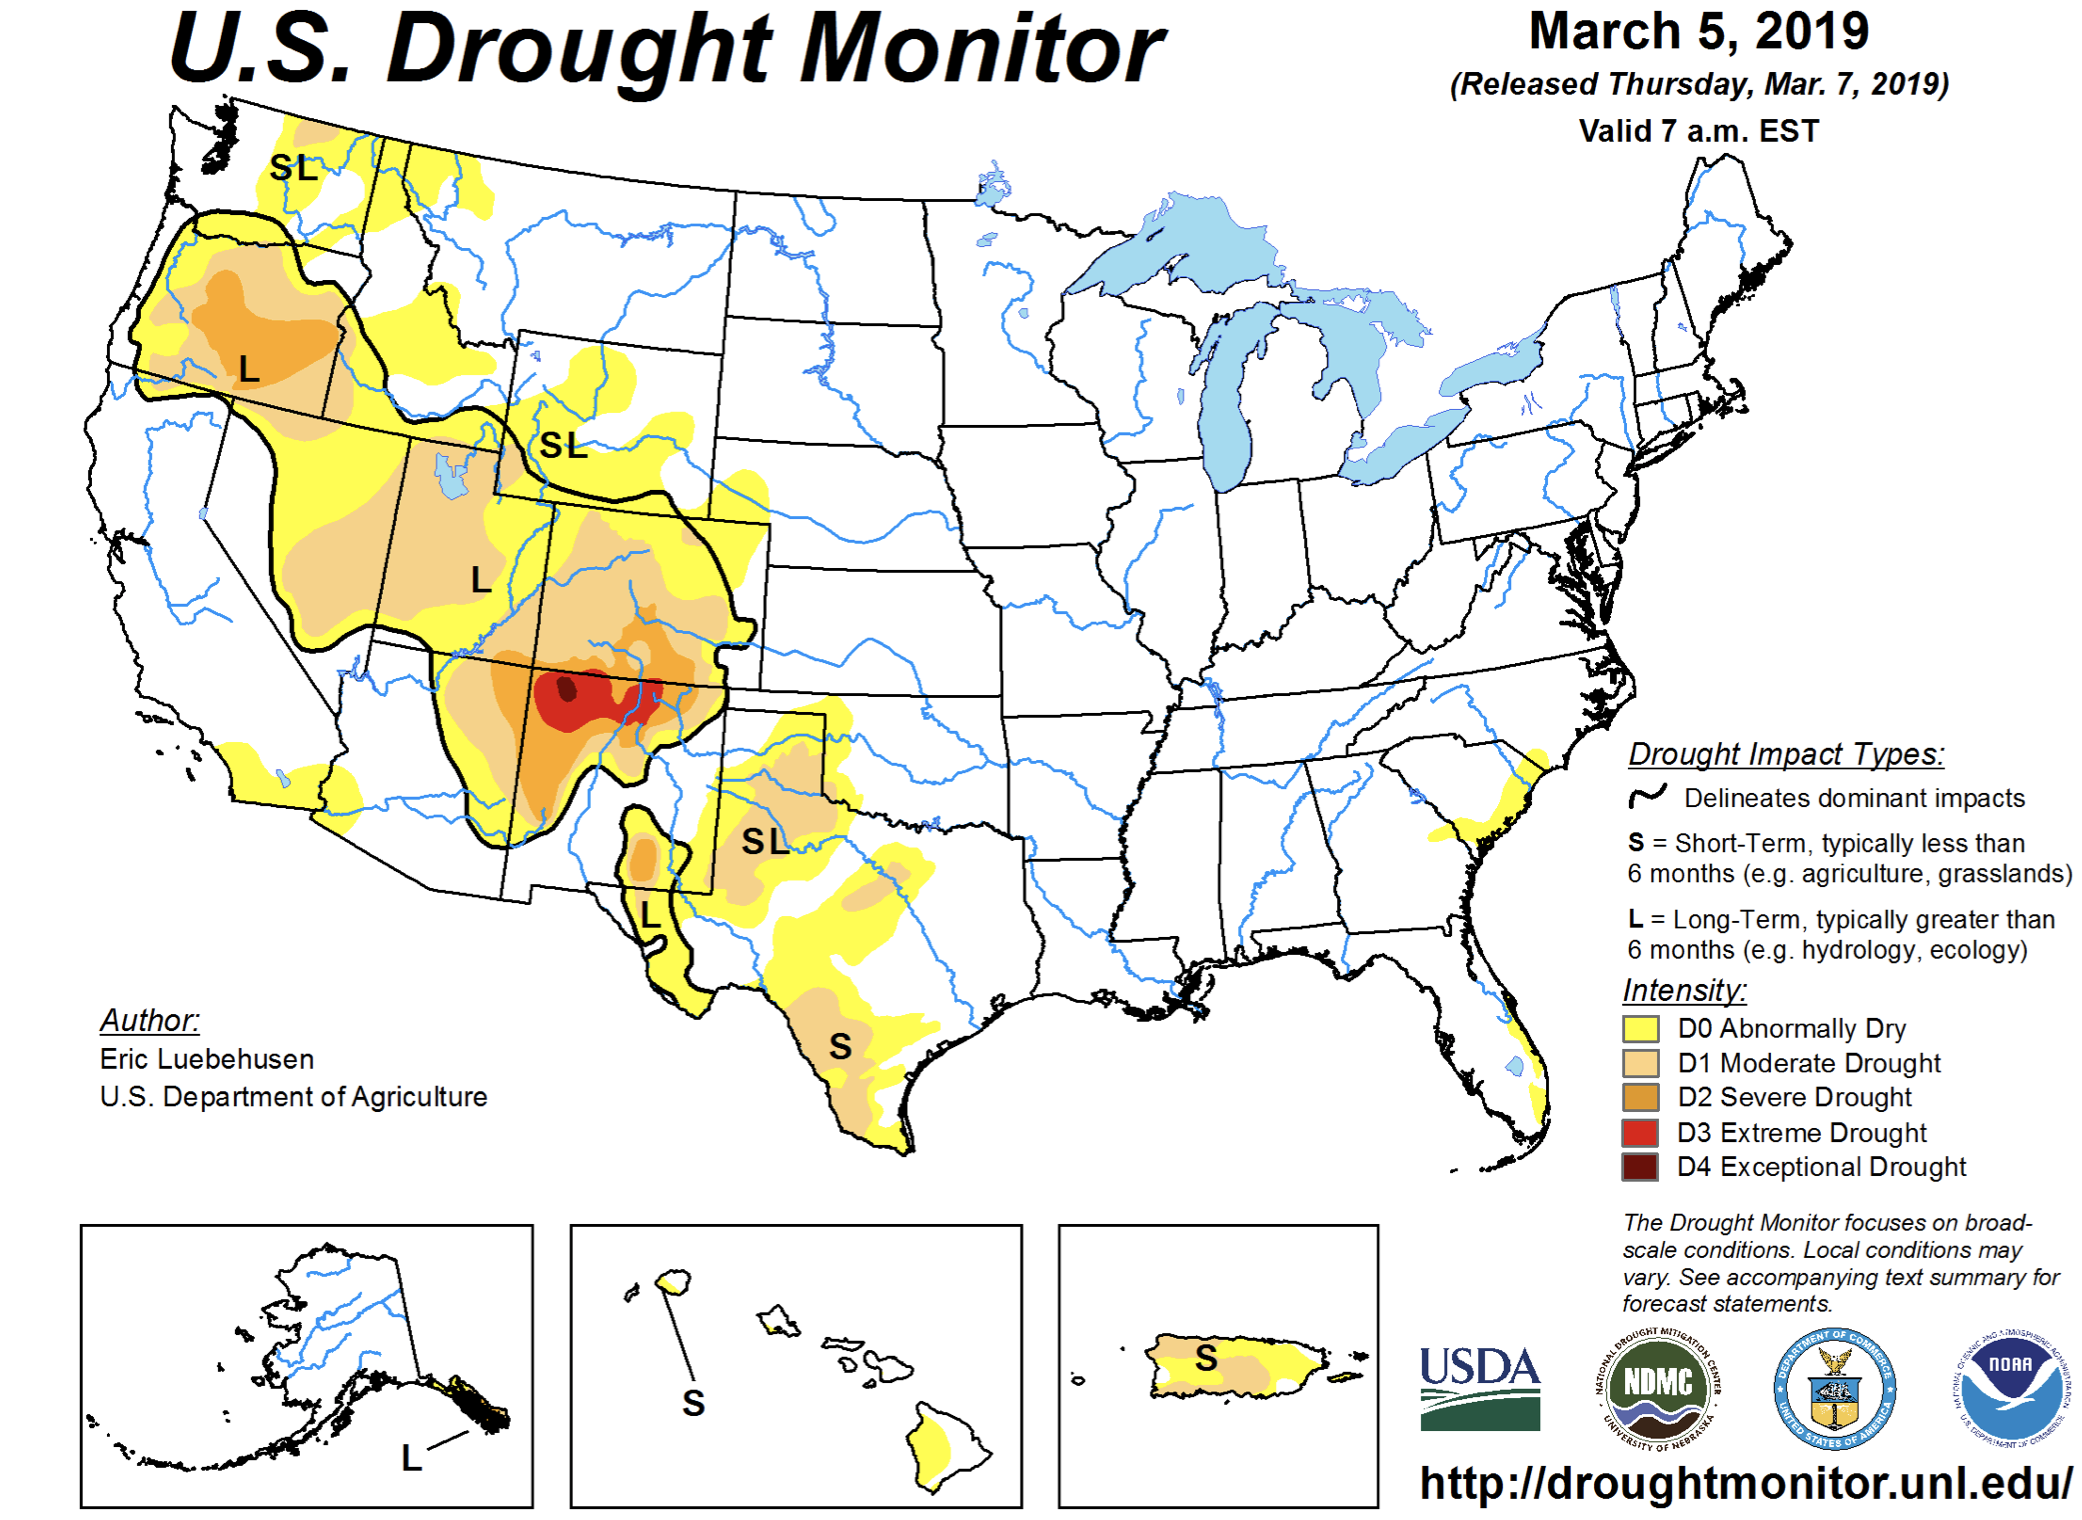
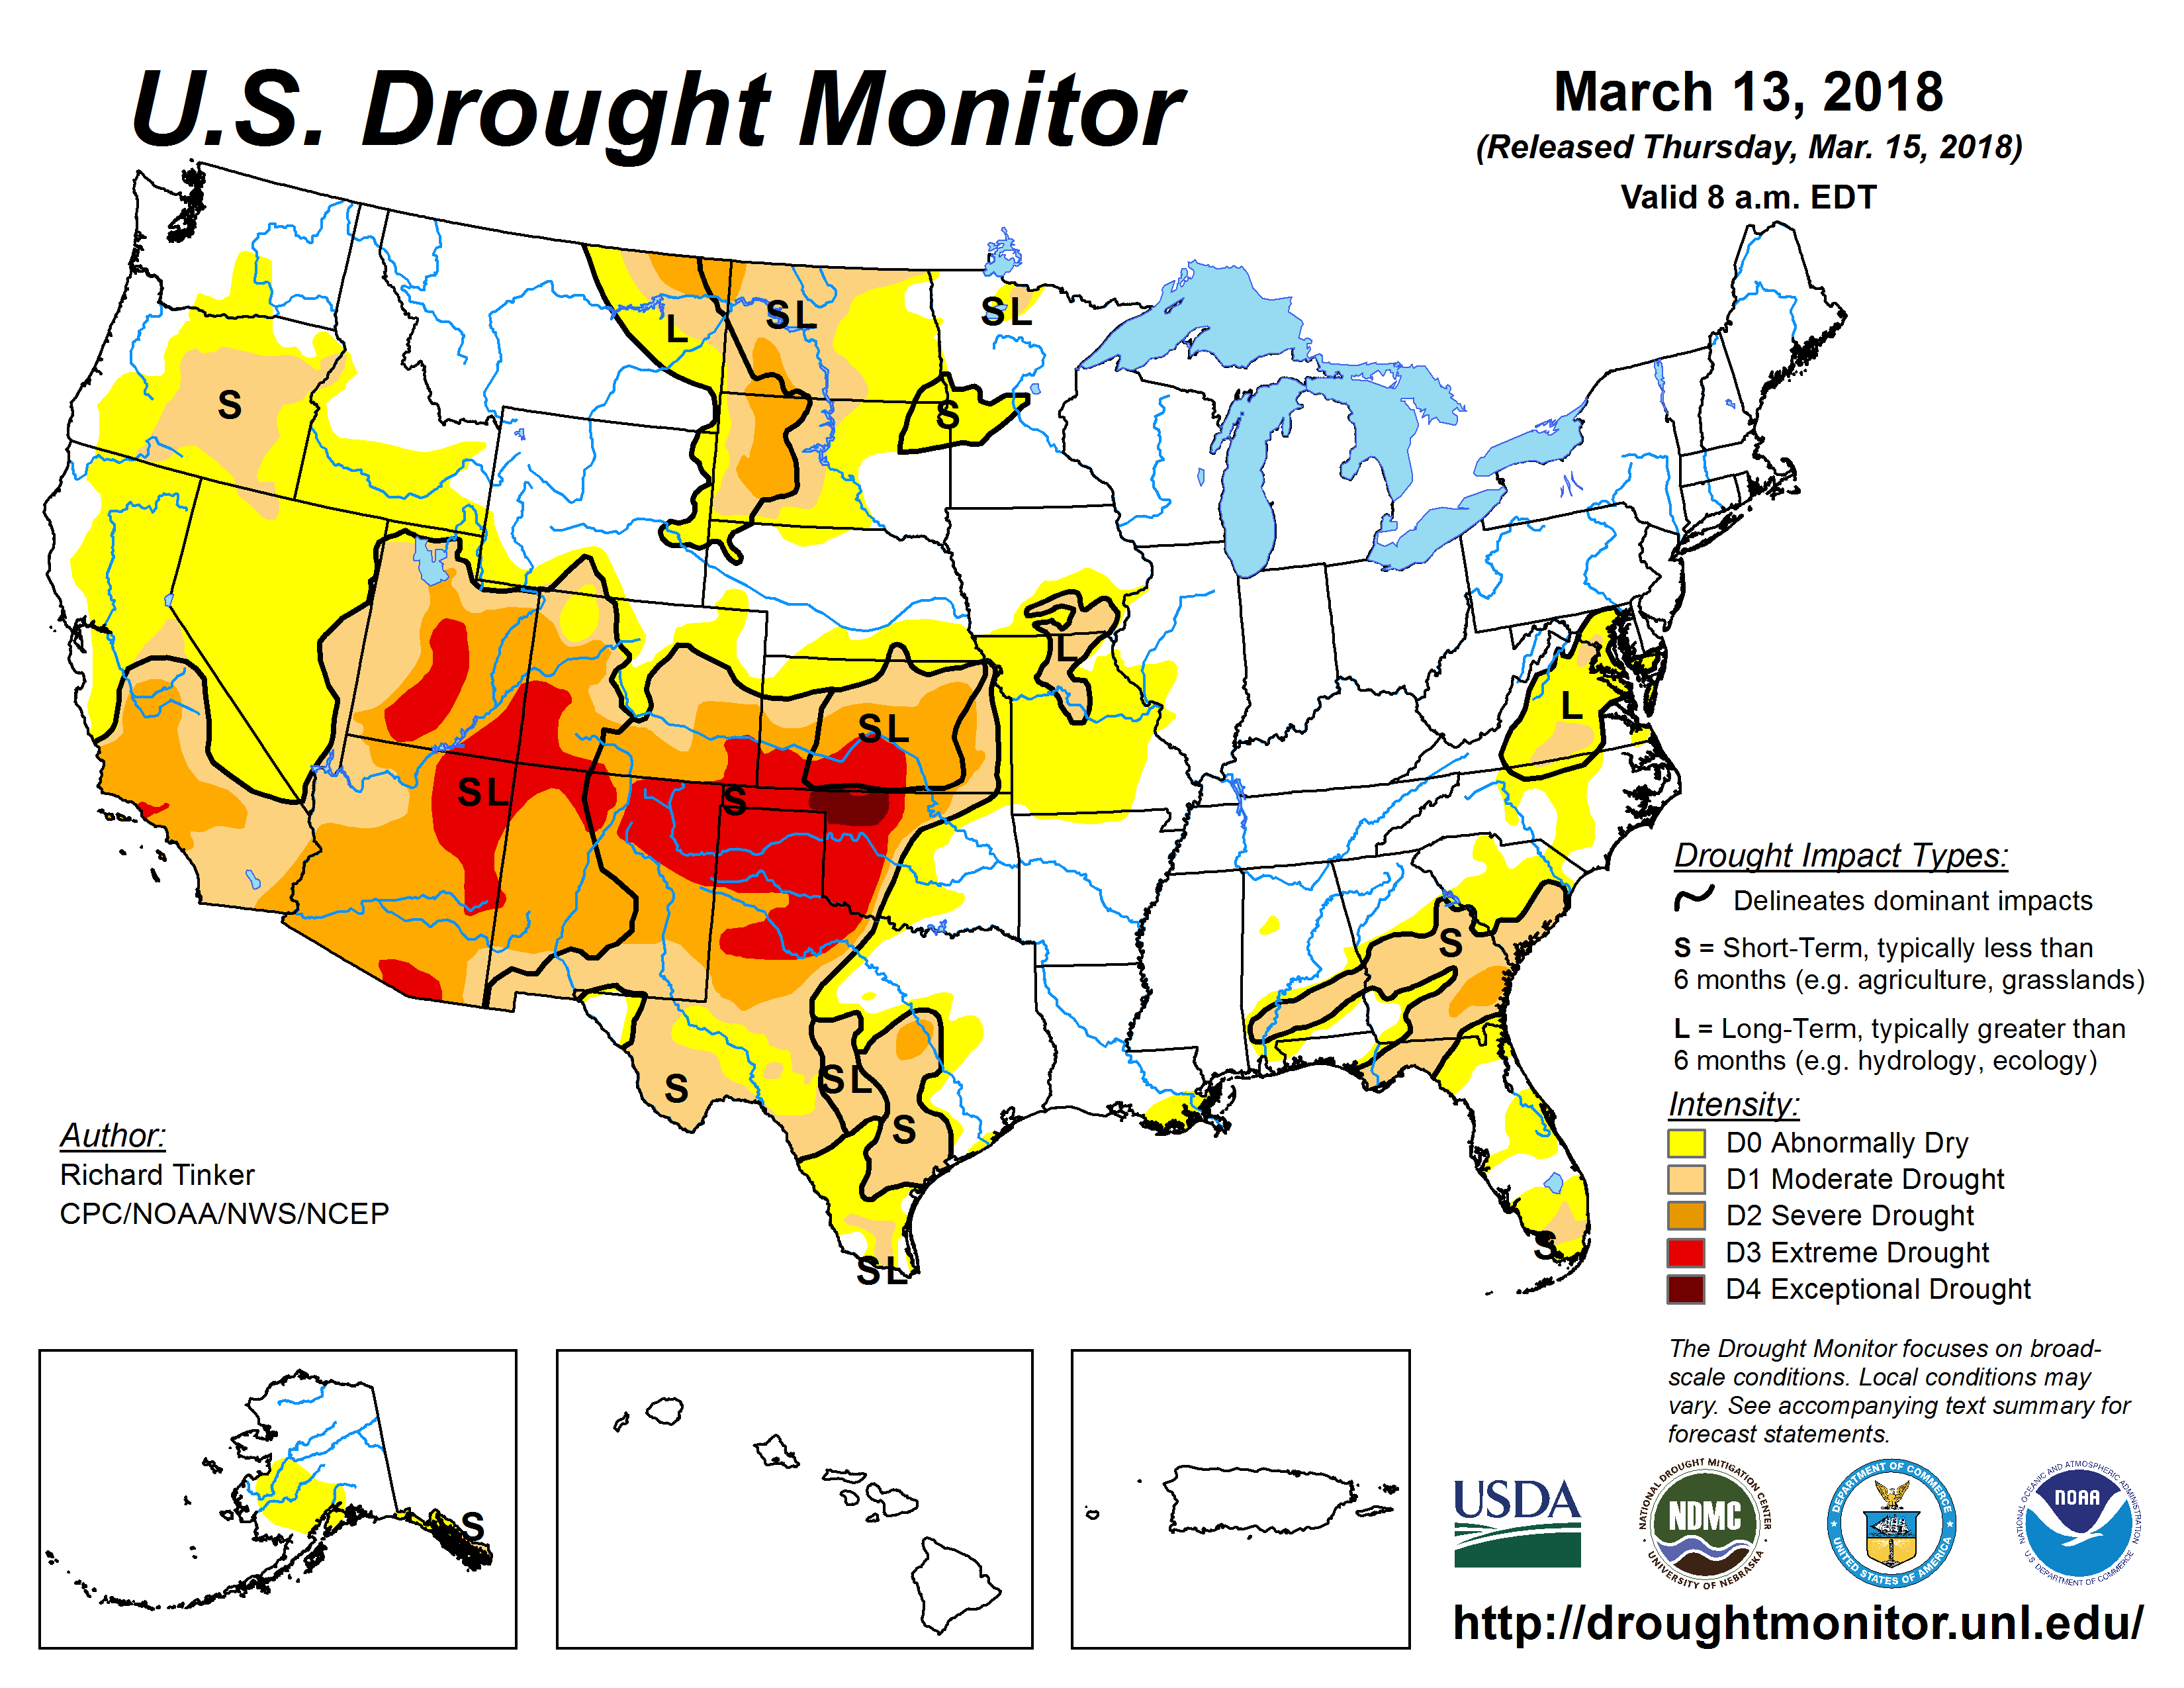
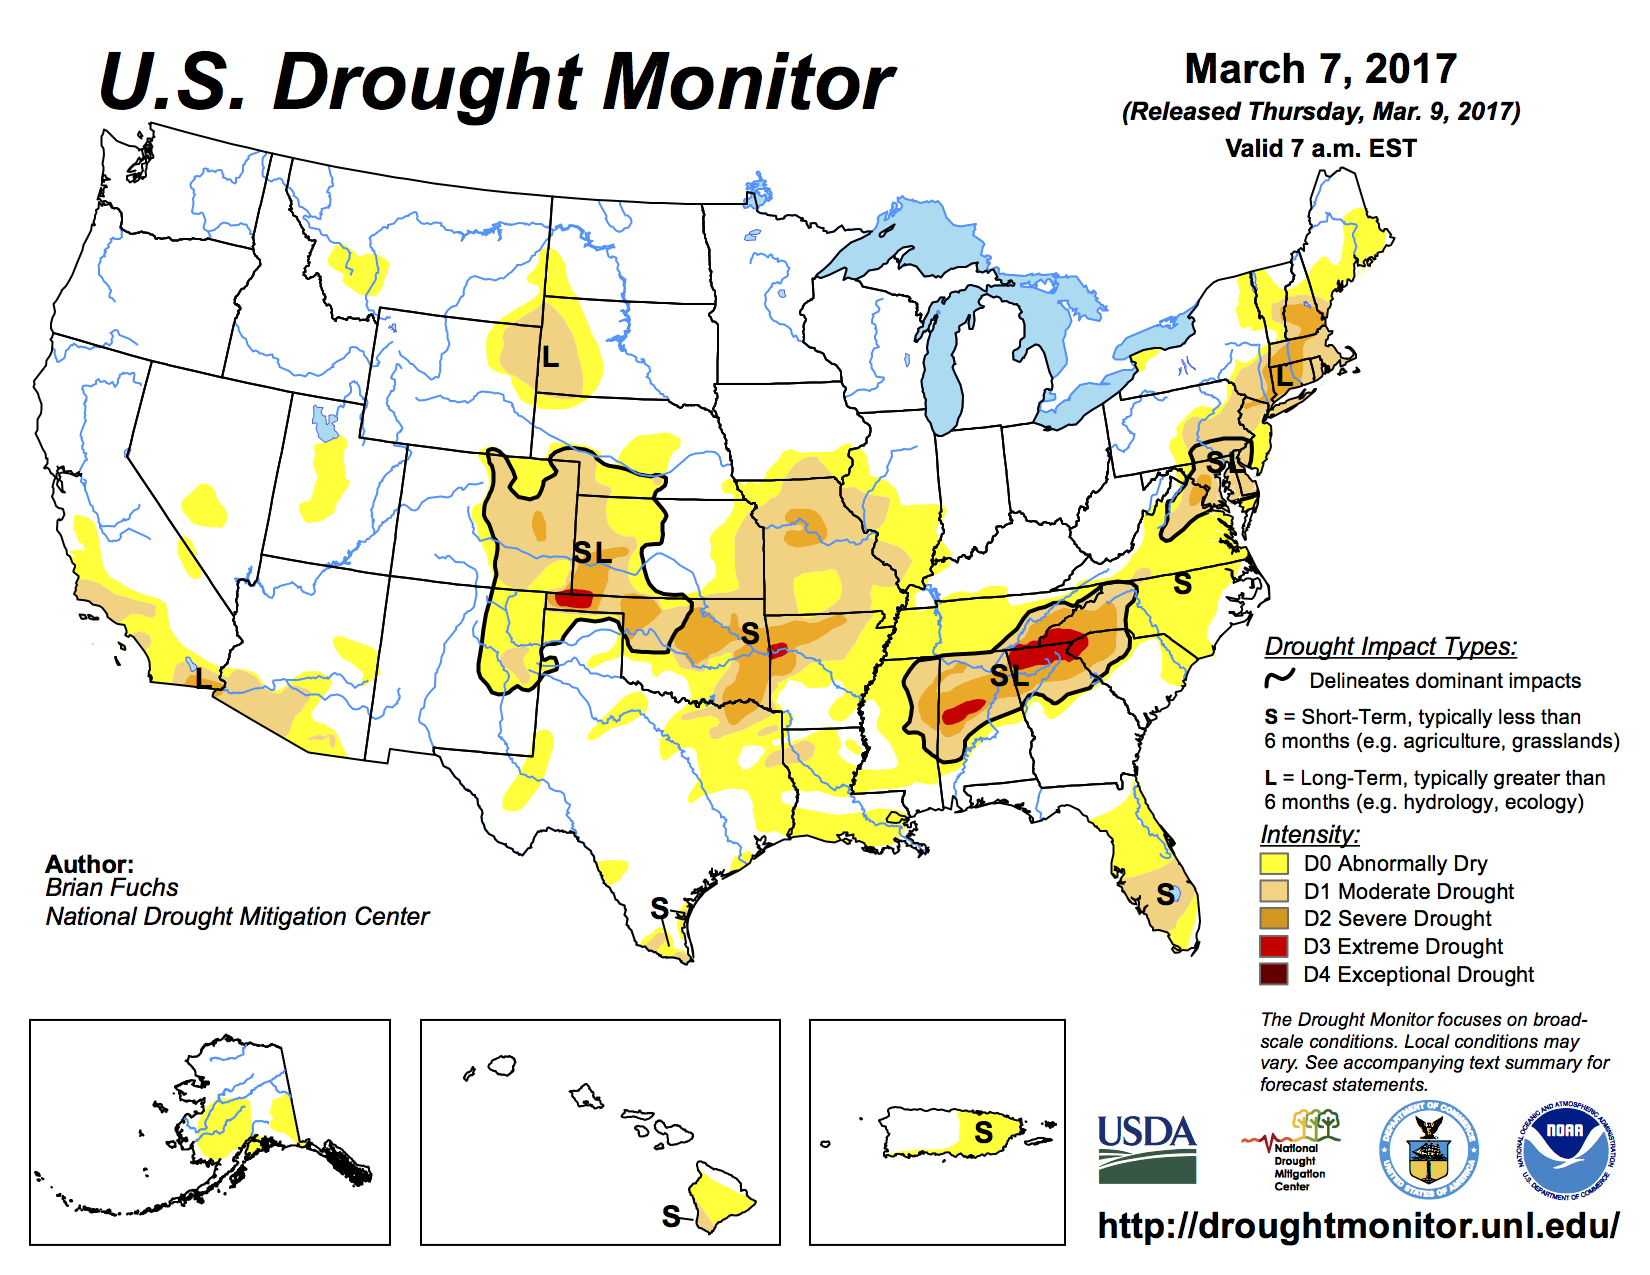

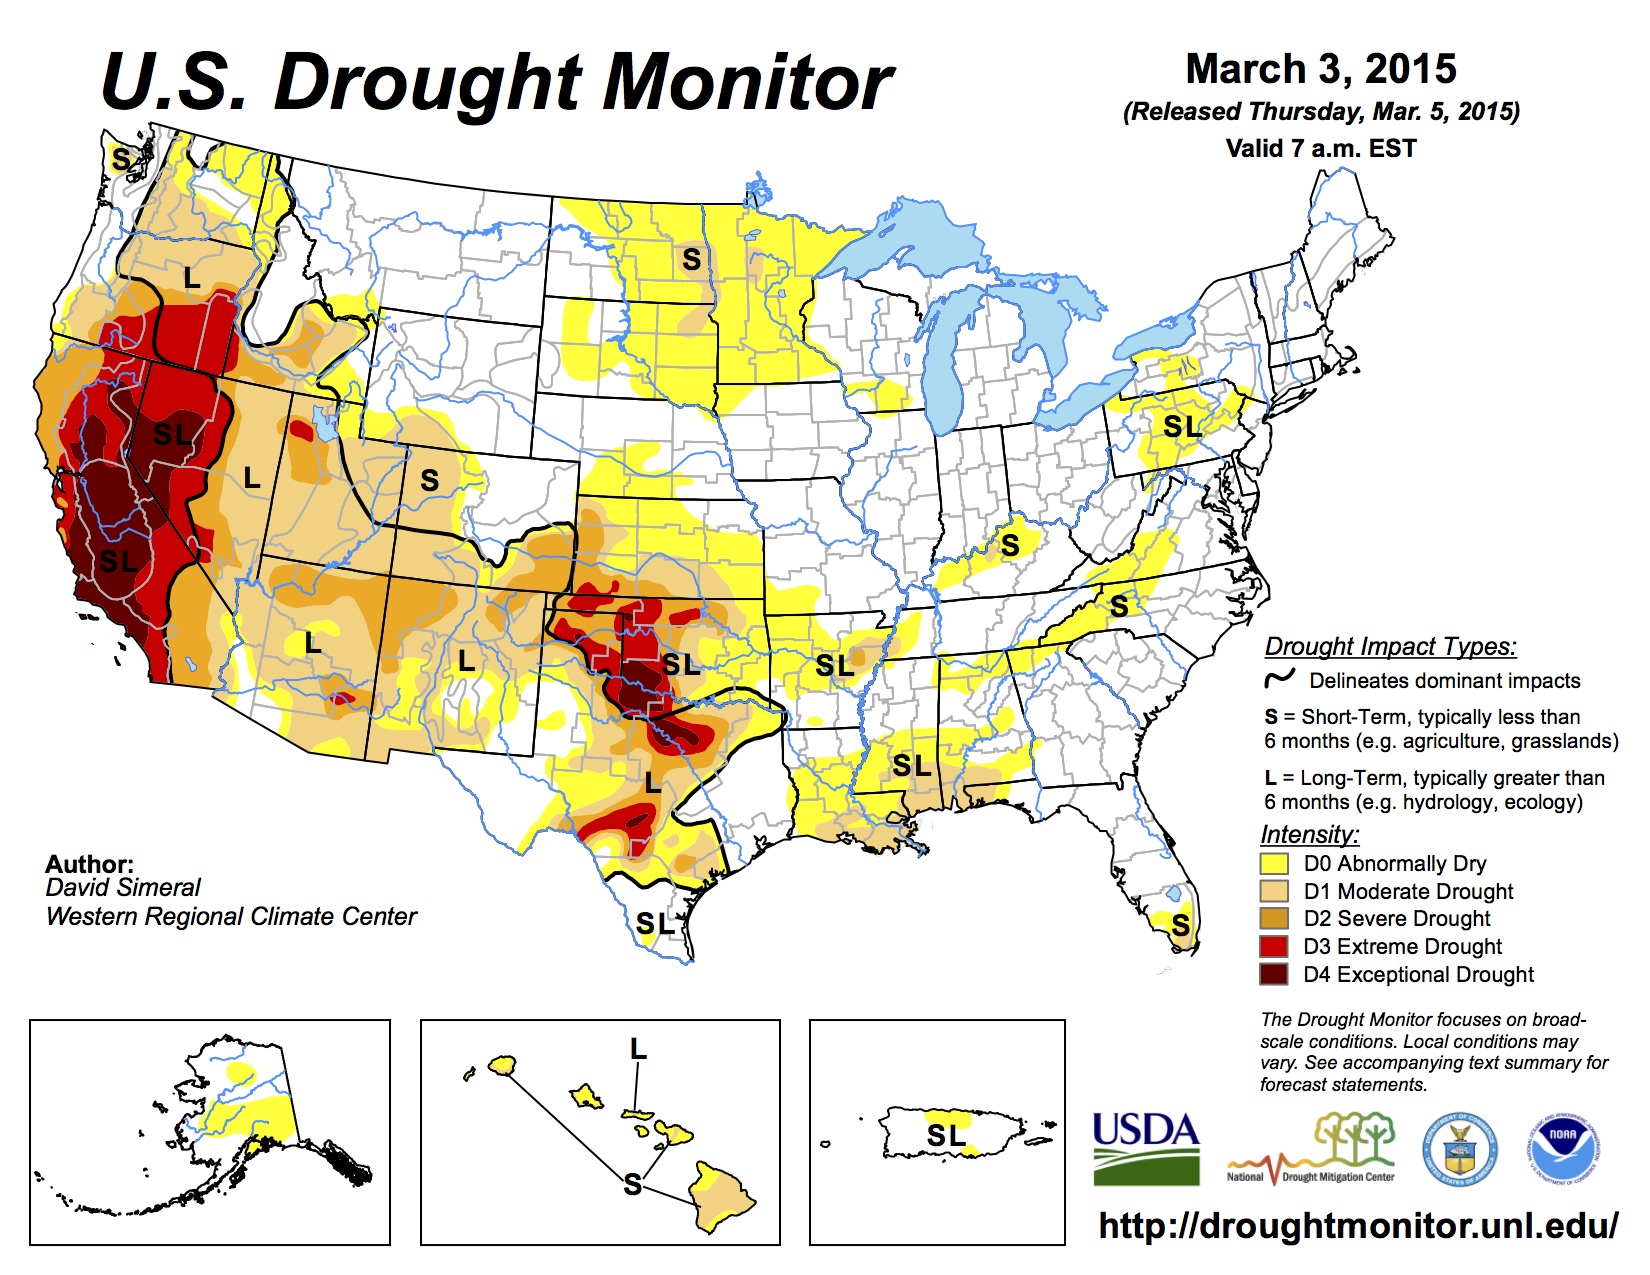


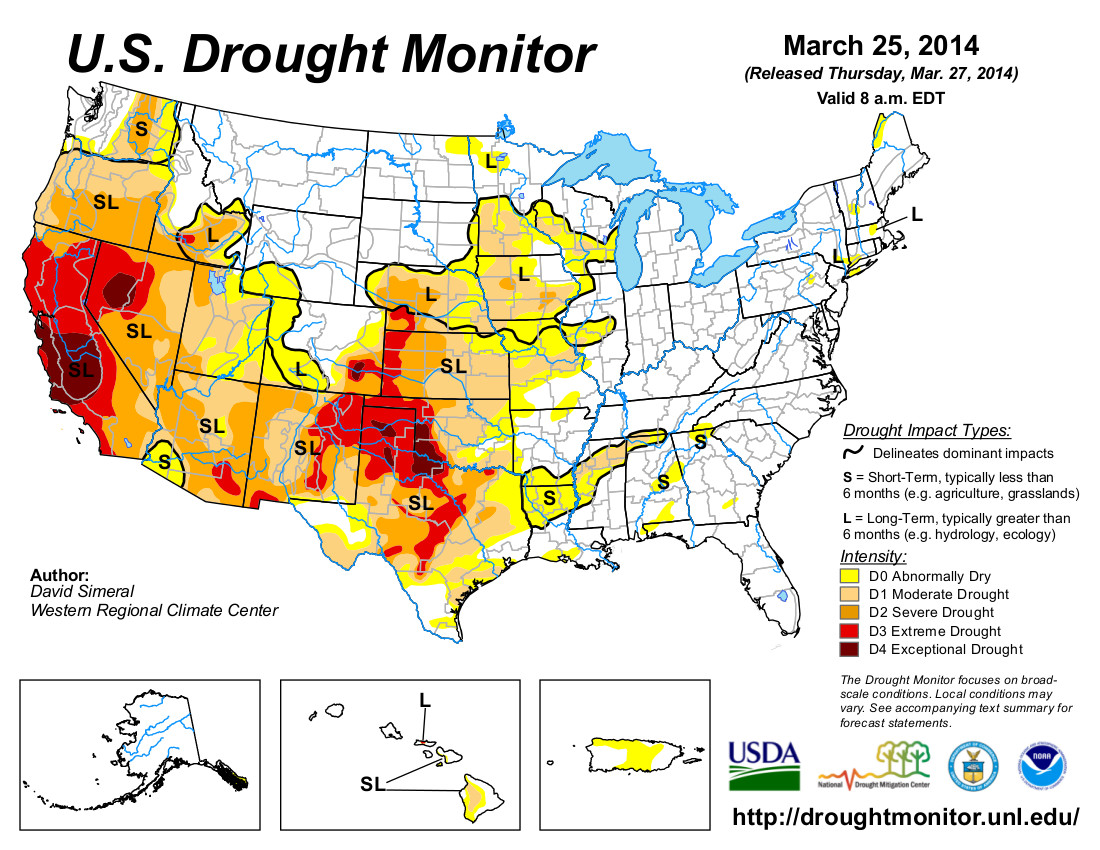
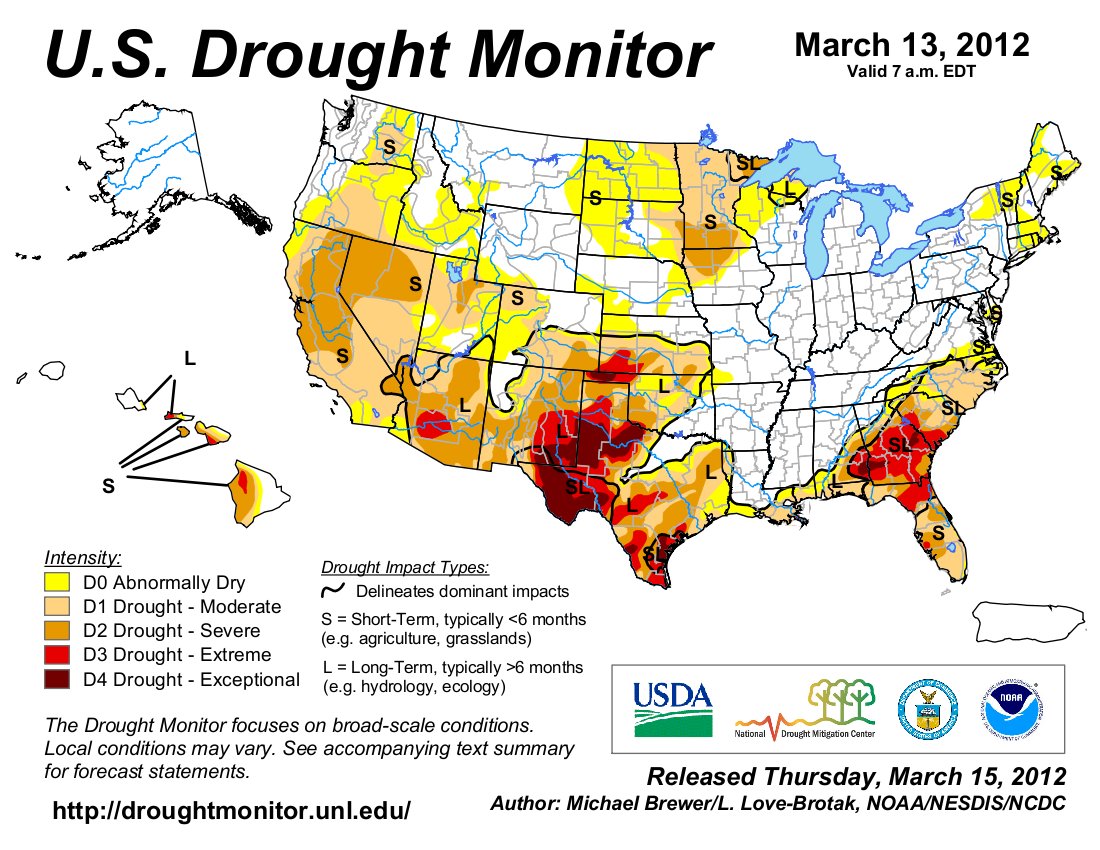
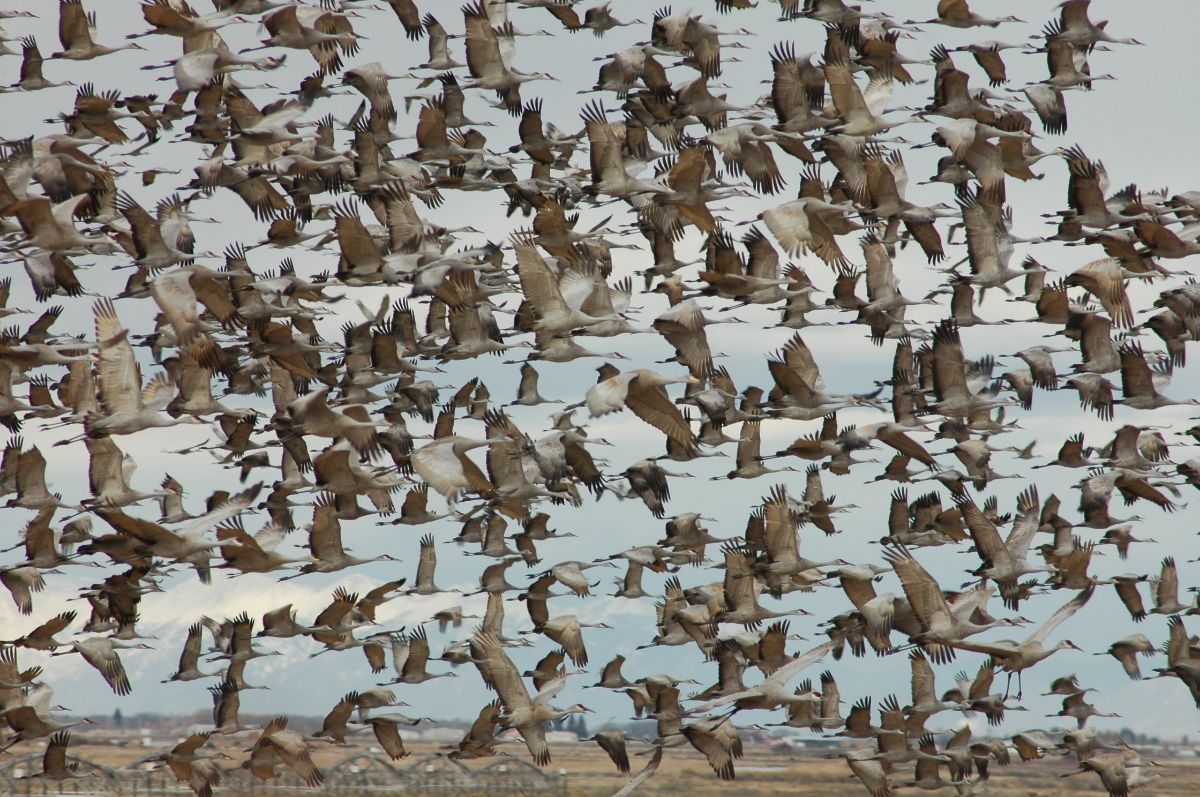
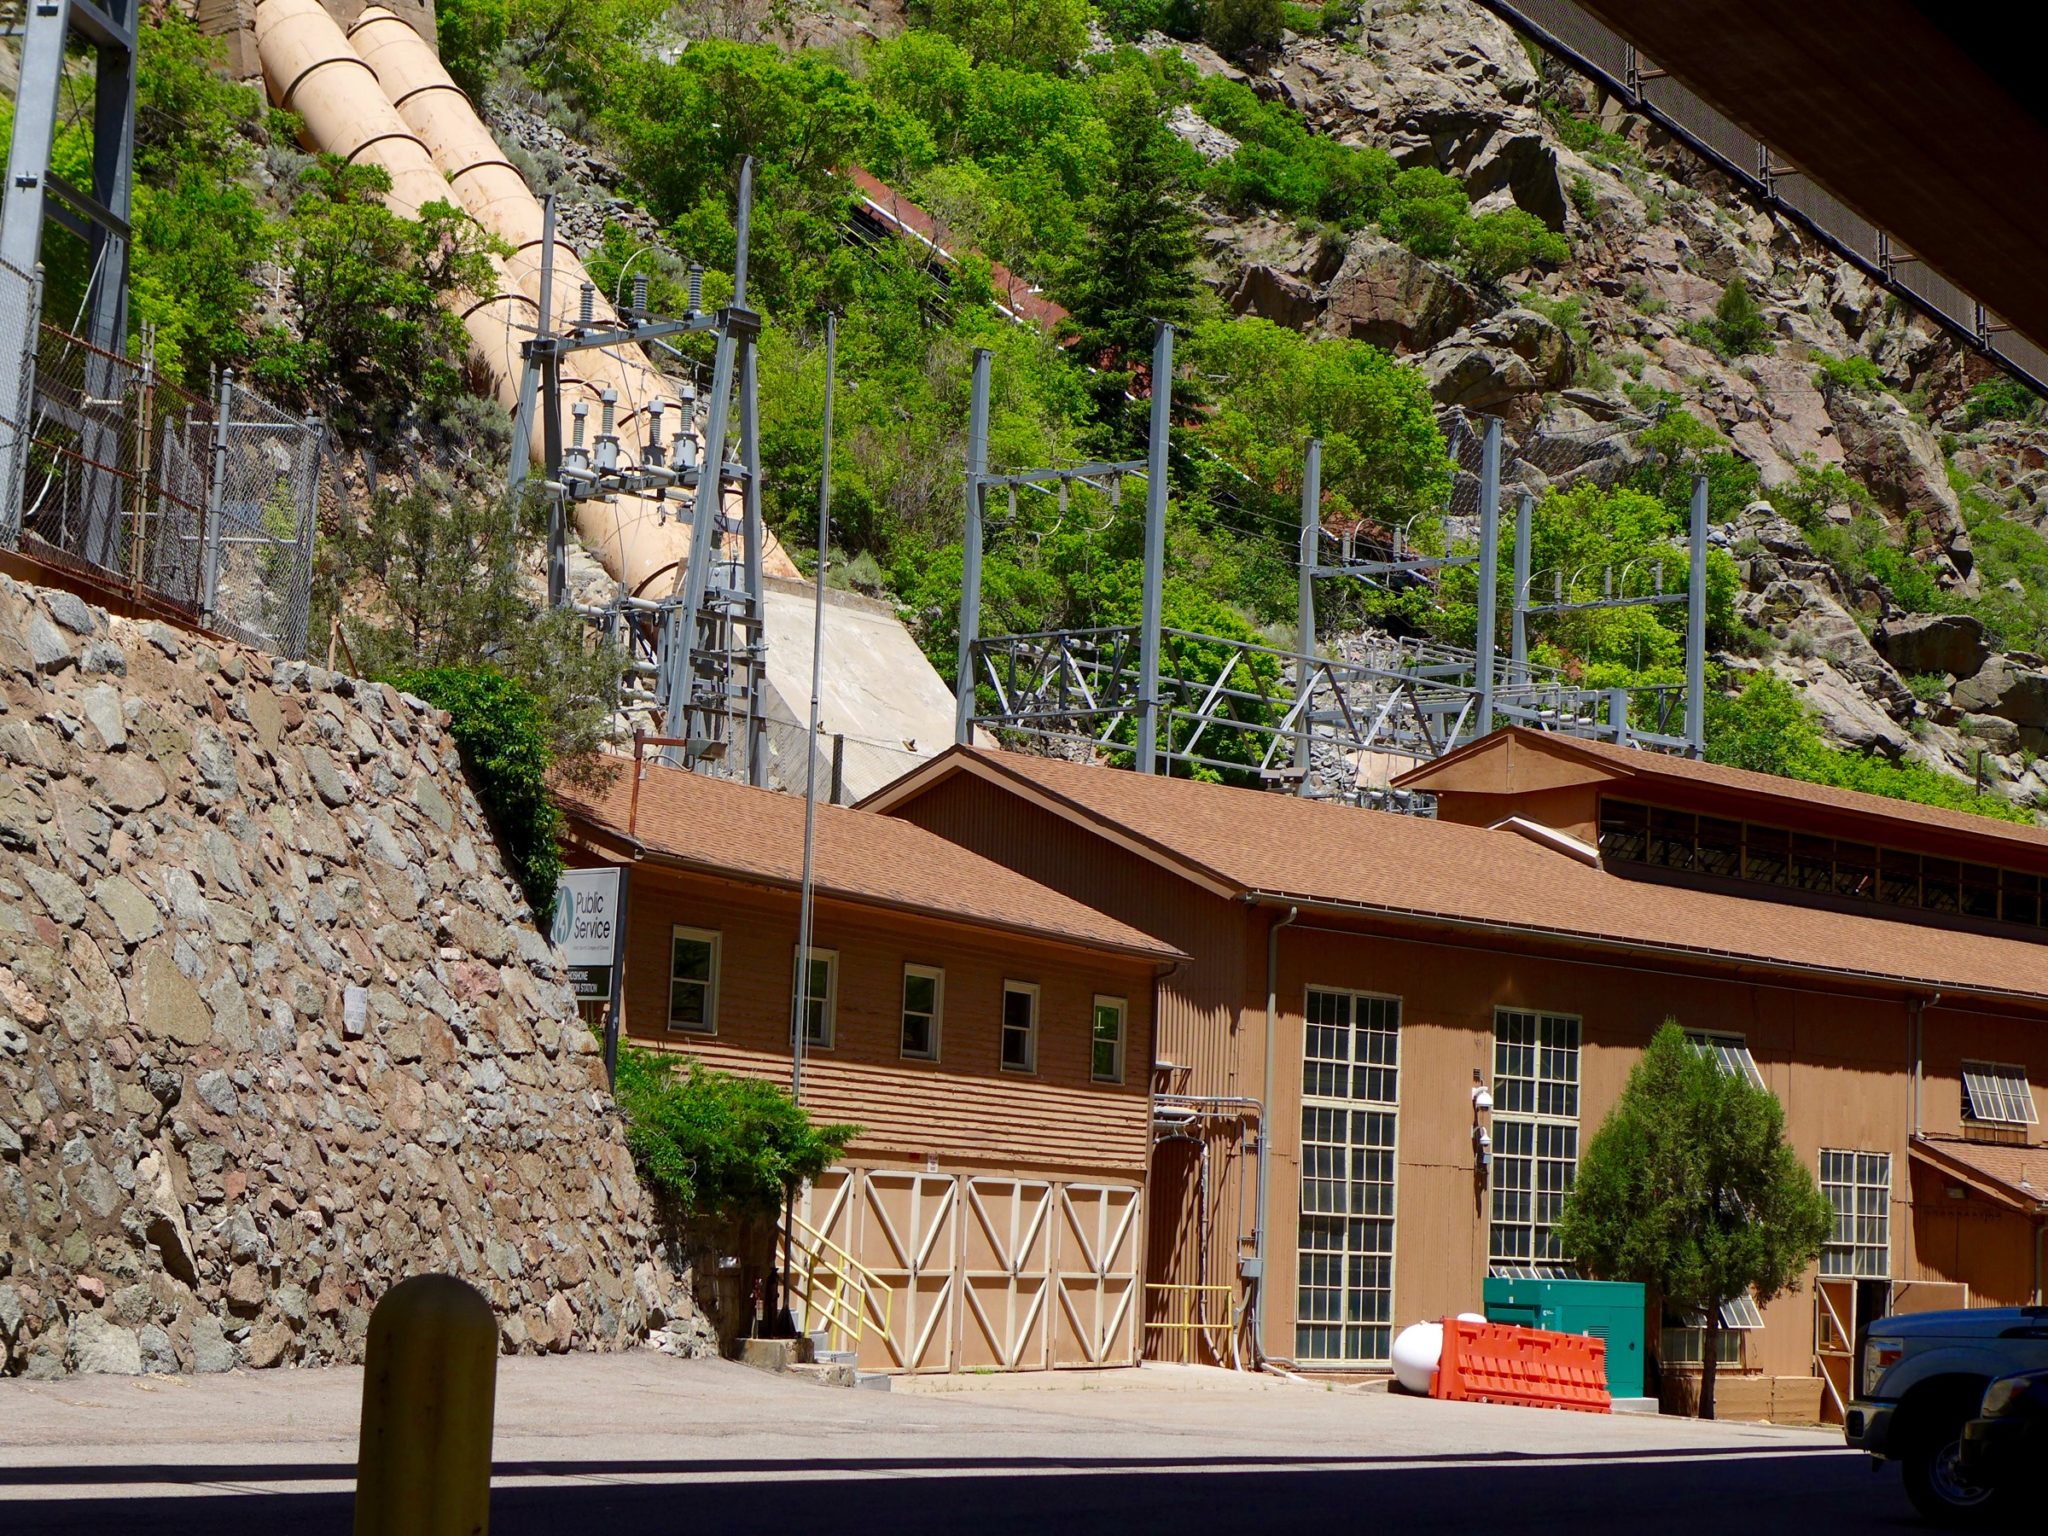
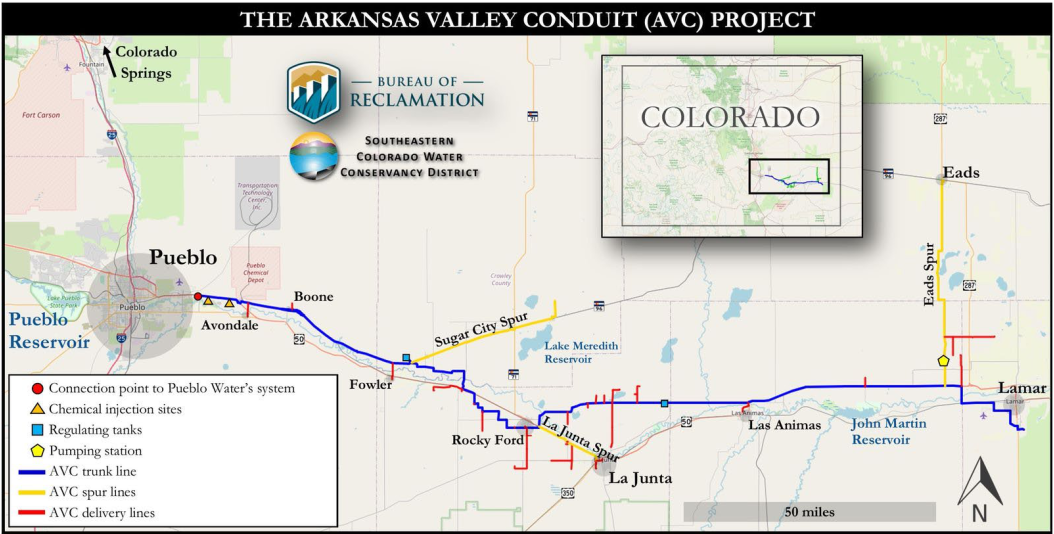

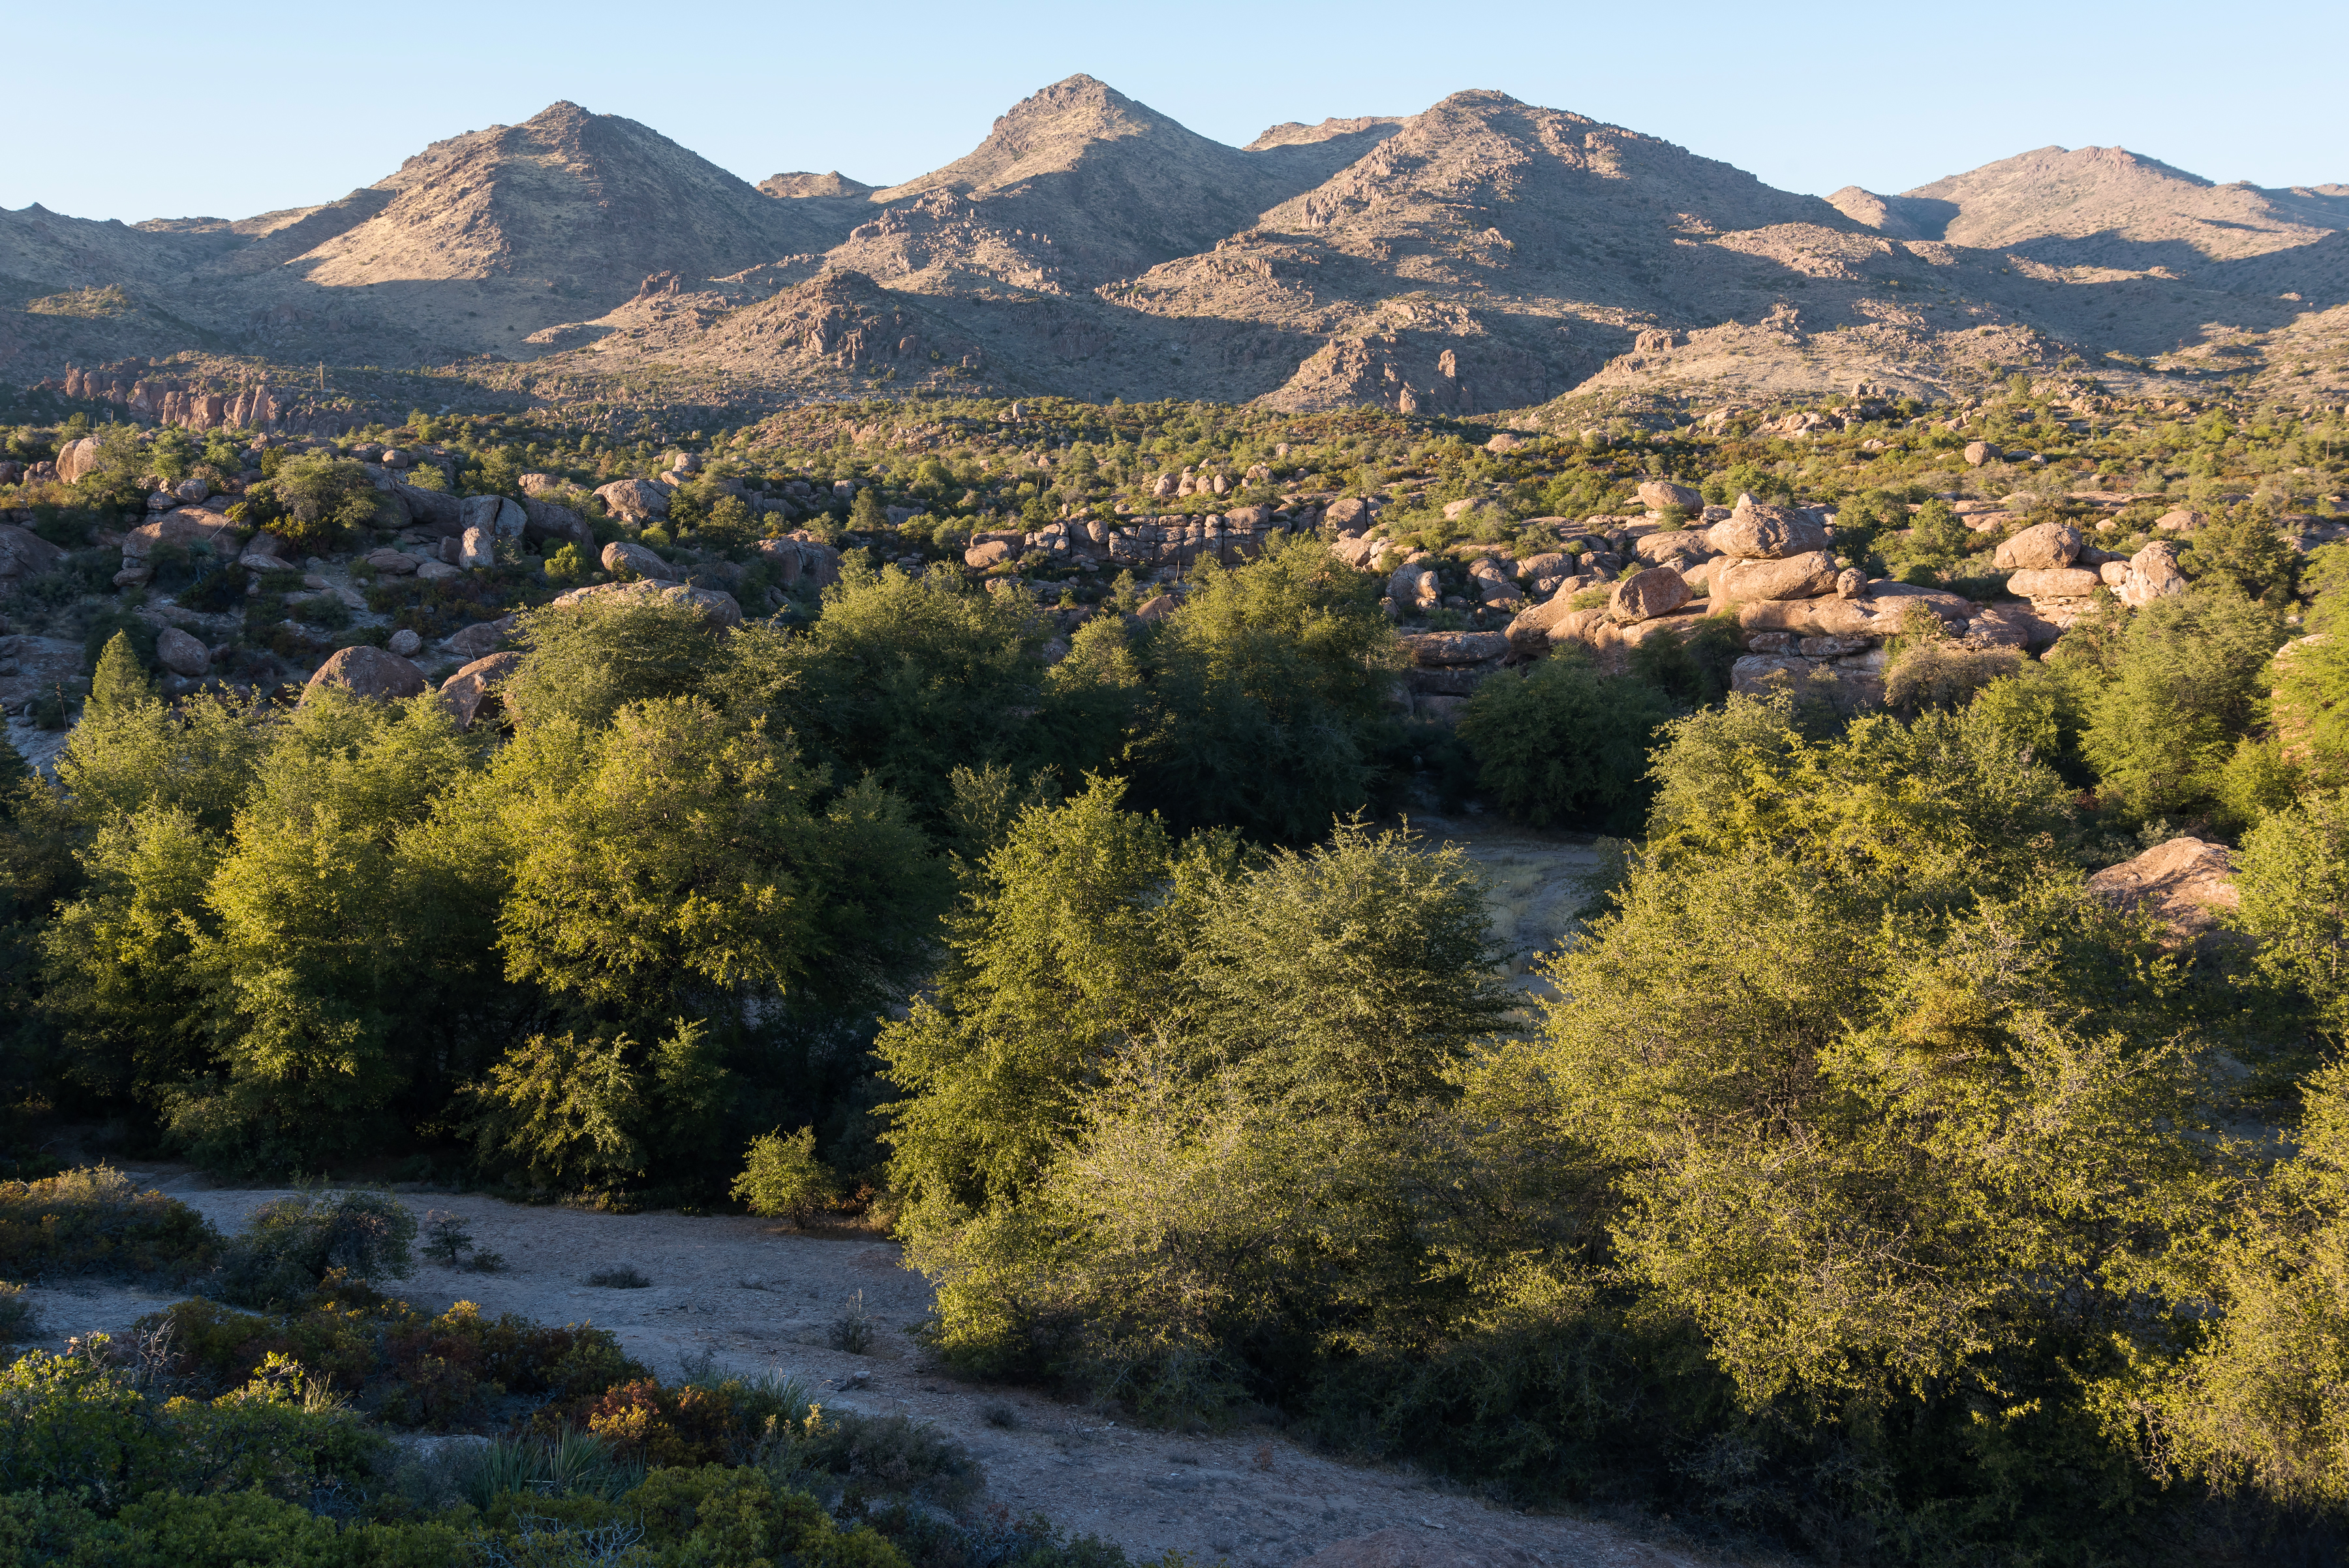

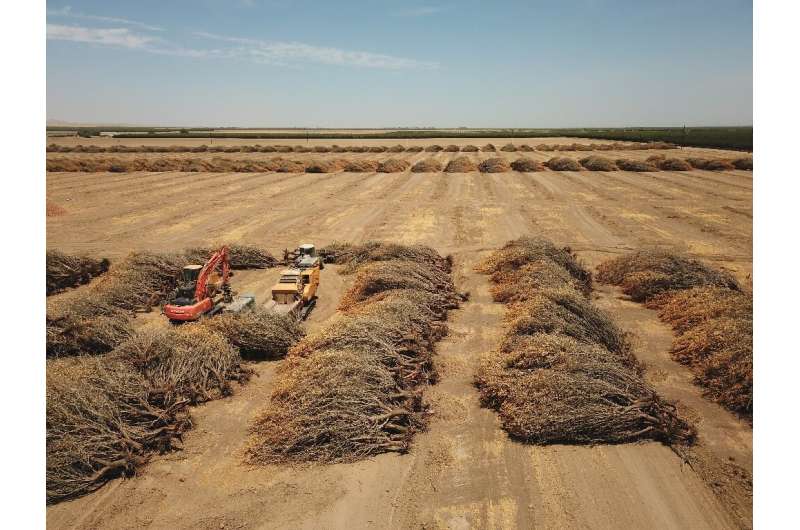


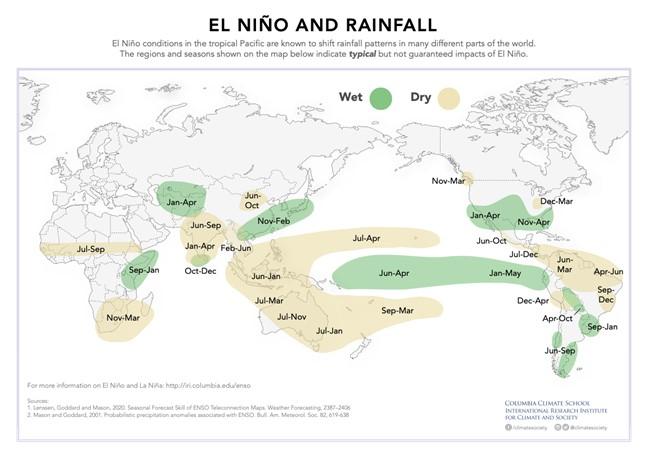
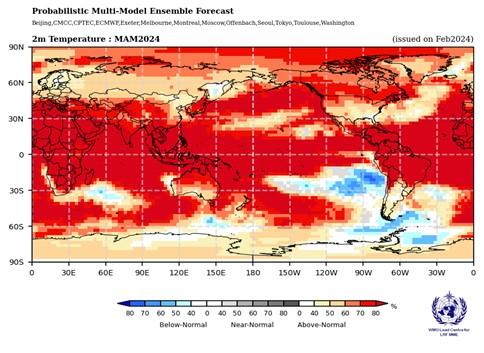
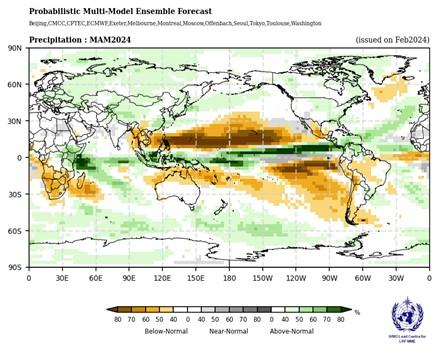
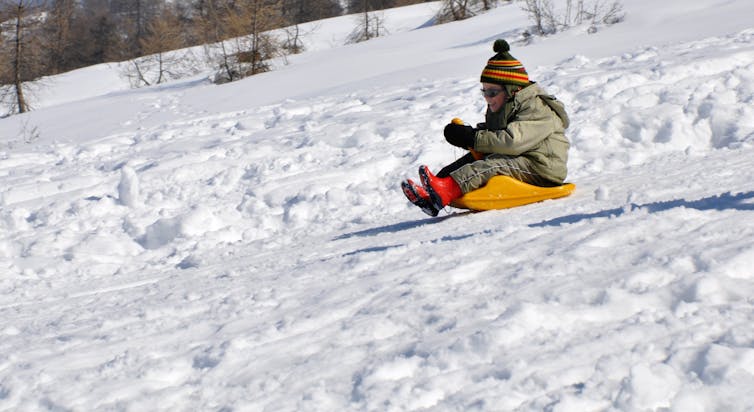

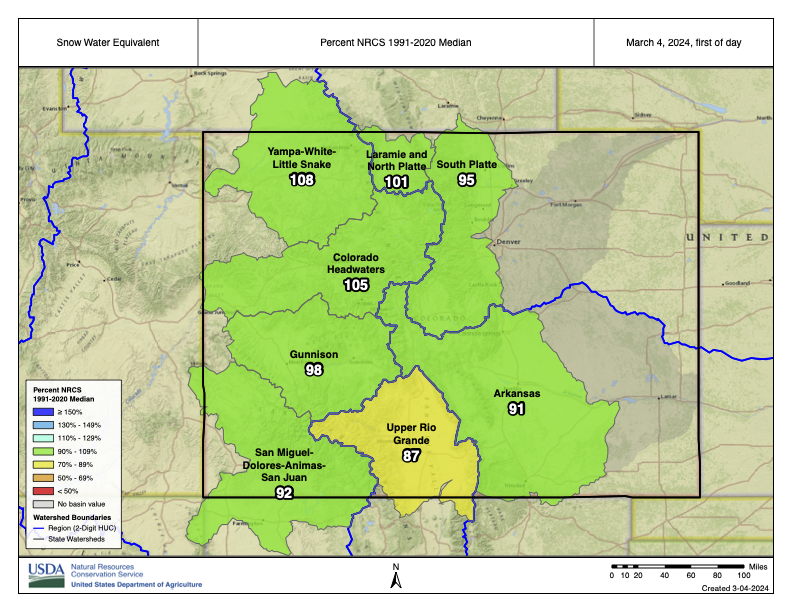
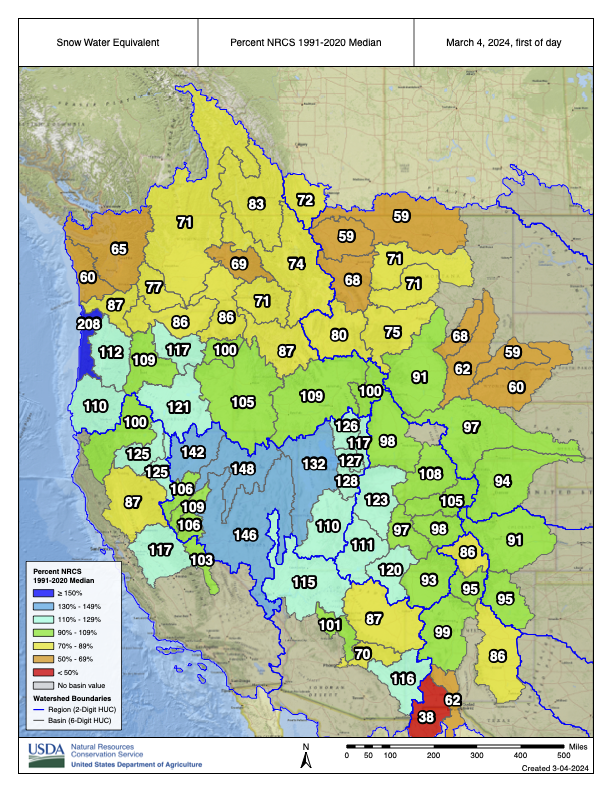
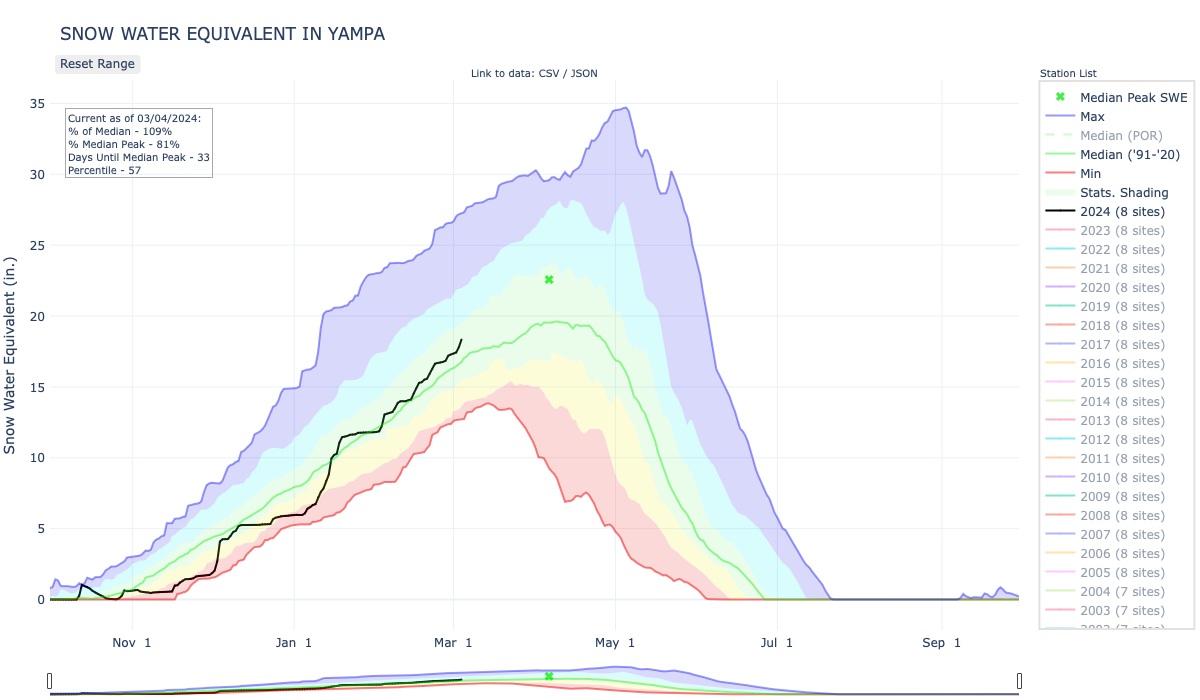

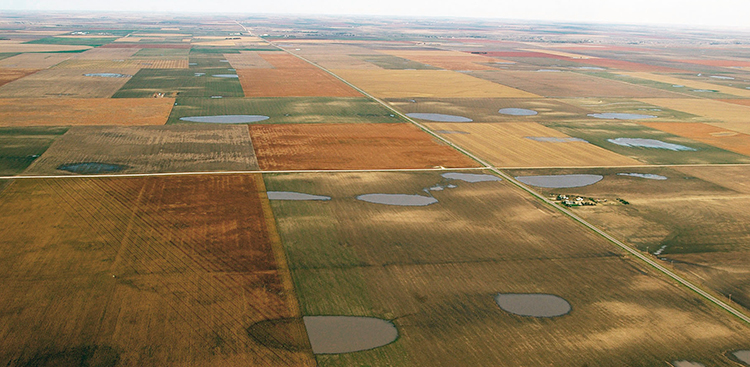


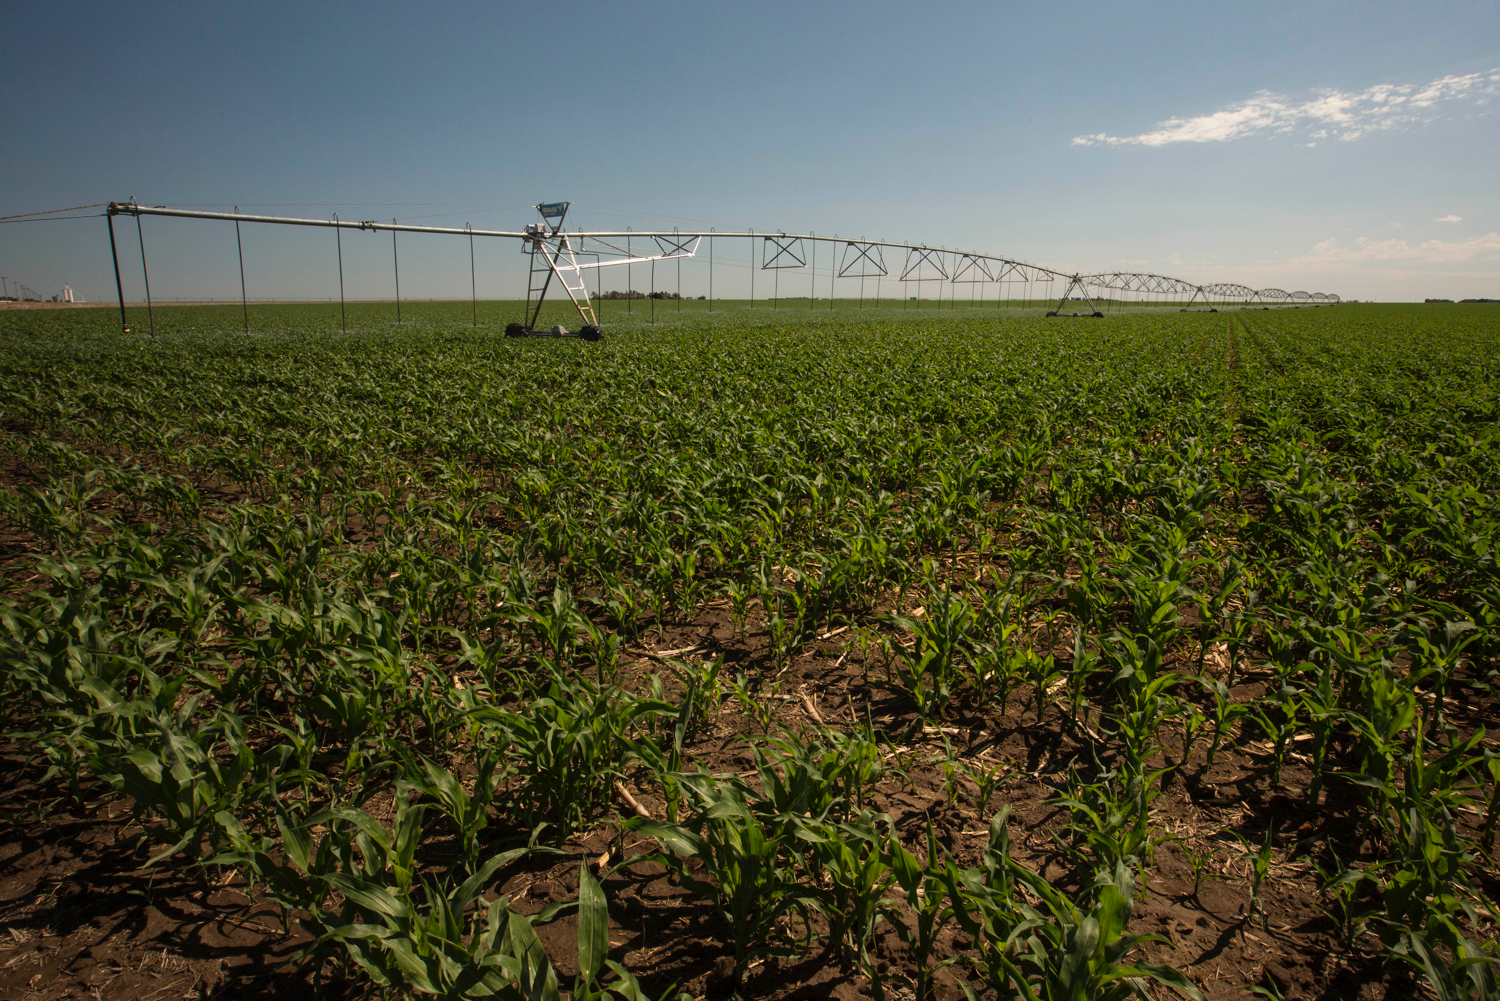


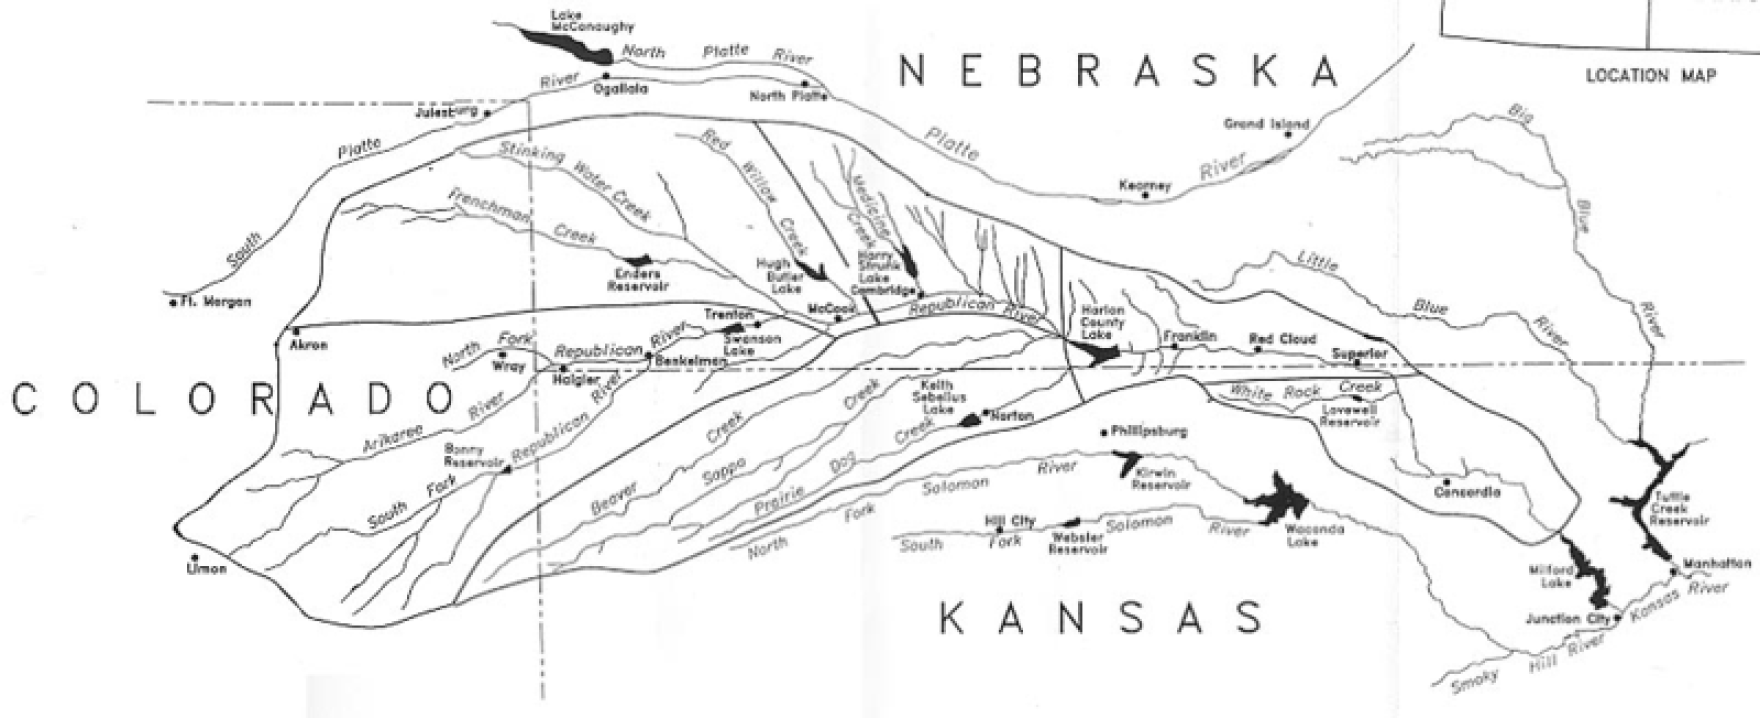


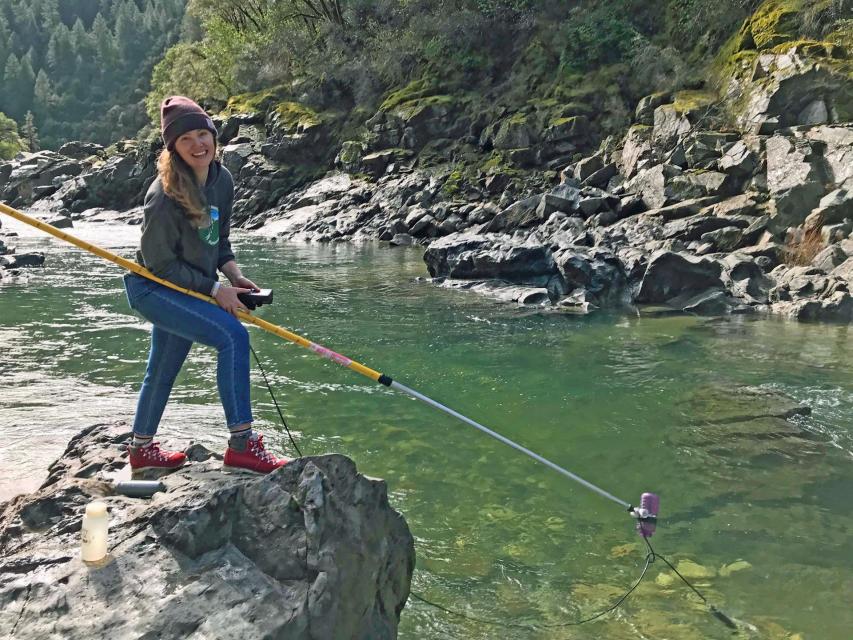


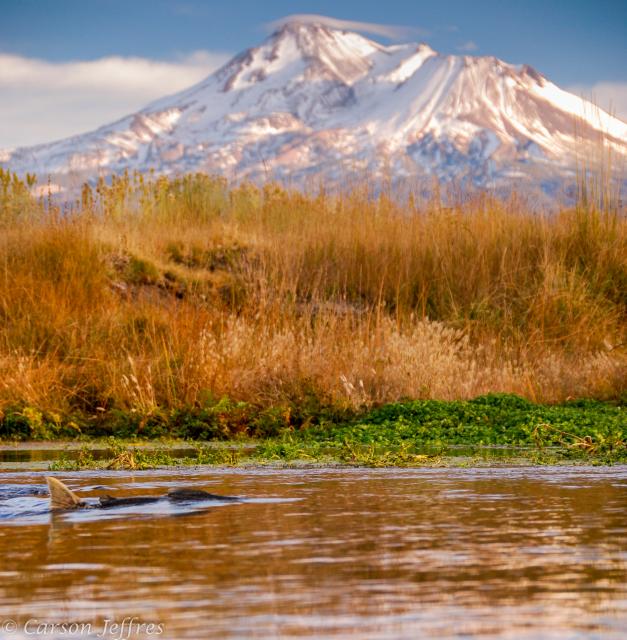
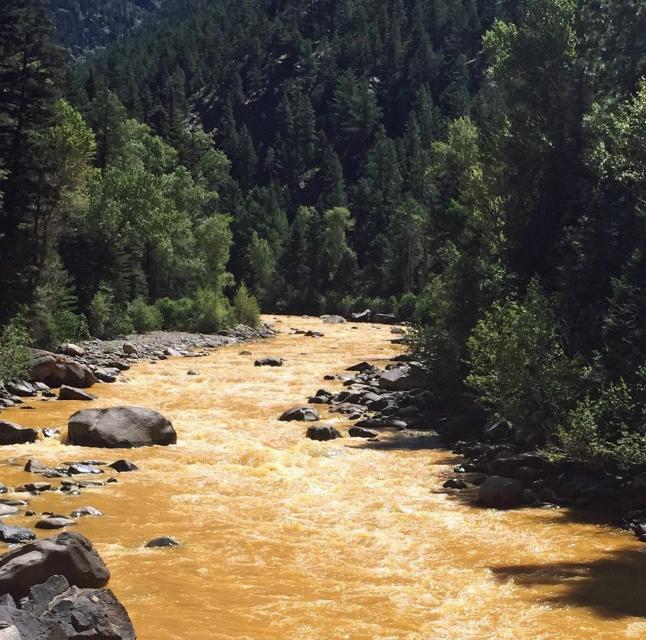
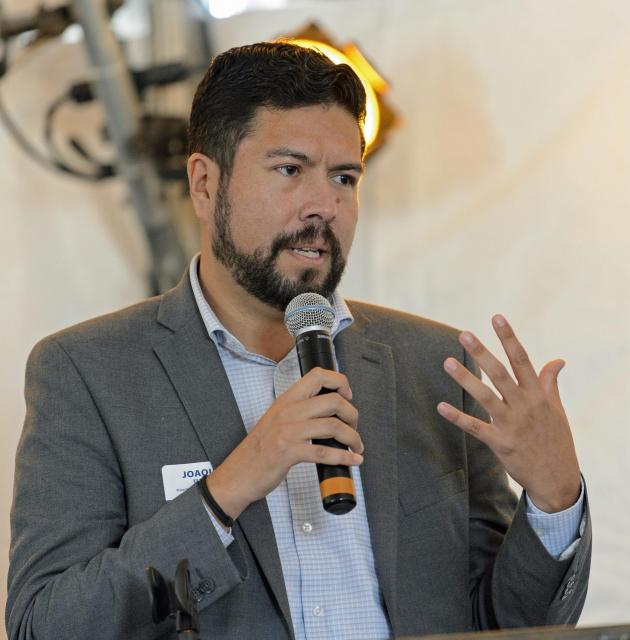

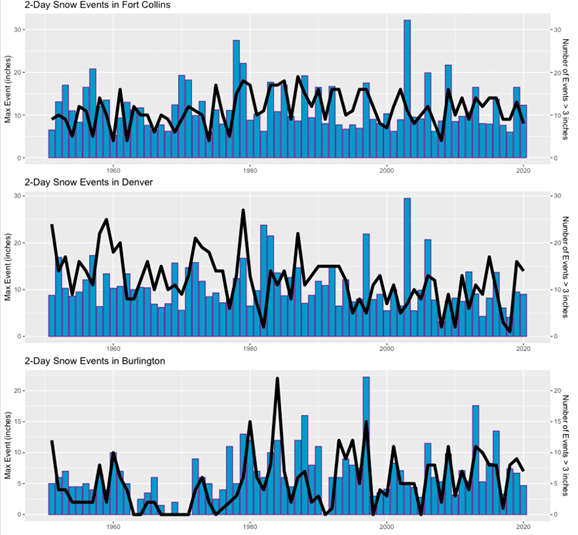
![[Fig. 1]](https://www.cpc.ncep.noaa.gov/products/analysis_monitoring/enso_advisory/figure01.gif)
![[Fig. 2]](https://www.cpc.ncep.noaa.gov/products/analysis_monitoring/enso_advisory/figure02.gif)
![[Fig. 3]](https://www.cpc.ncep.noaa.gov/products/analysis_monitoring/enso_advisory/figure03.gif)
![[Fig. 4]](https://www.cpc.ncep.noaa.gov/products/analysis_monitoring/enso_advisory/figure04.gif)
![[Fig. 5]](https://www.cpc.ncep.noaa.gov/products/analysis_monitoring/enso_advisory/figure05.gif)
![[Fig. 6]](https://www.cpc.ncep.noaa.gov/products/analysis_monitoring/enso_advisory/figure06.gif)
![[Fig. 7]](https://www.cpc.ncep.noaa.gov/products/analysis_monitoring/enso_advisory/figure07.gif)