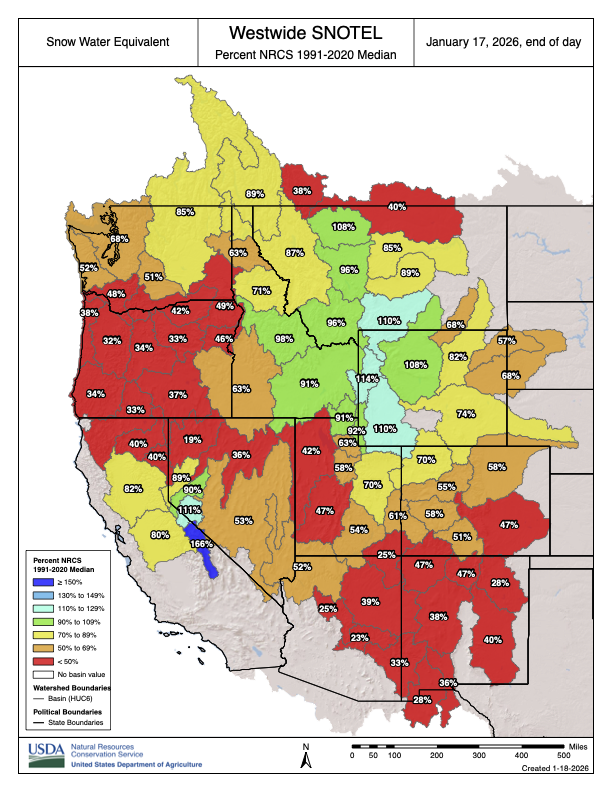
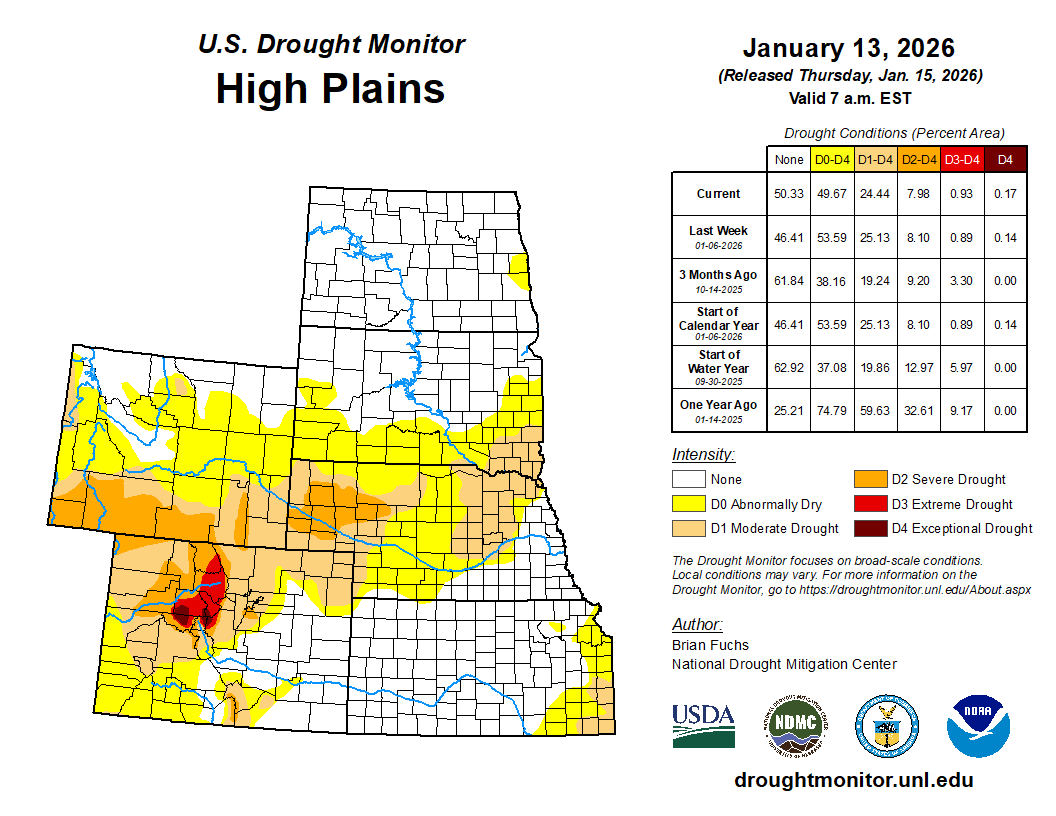
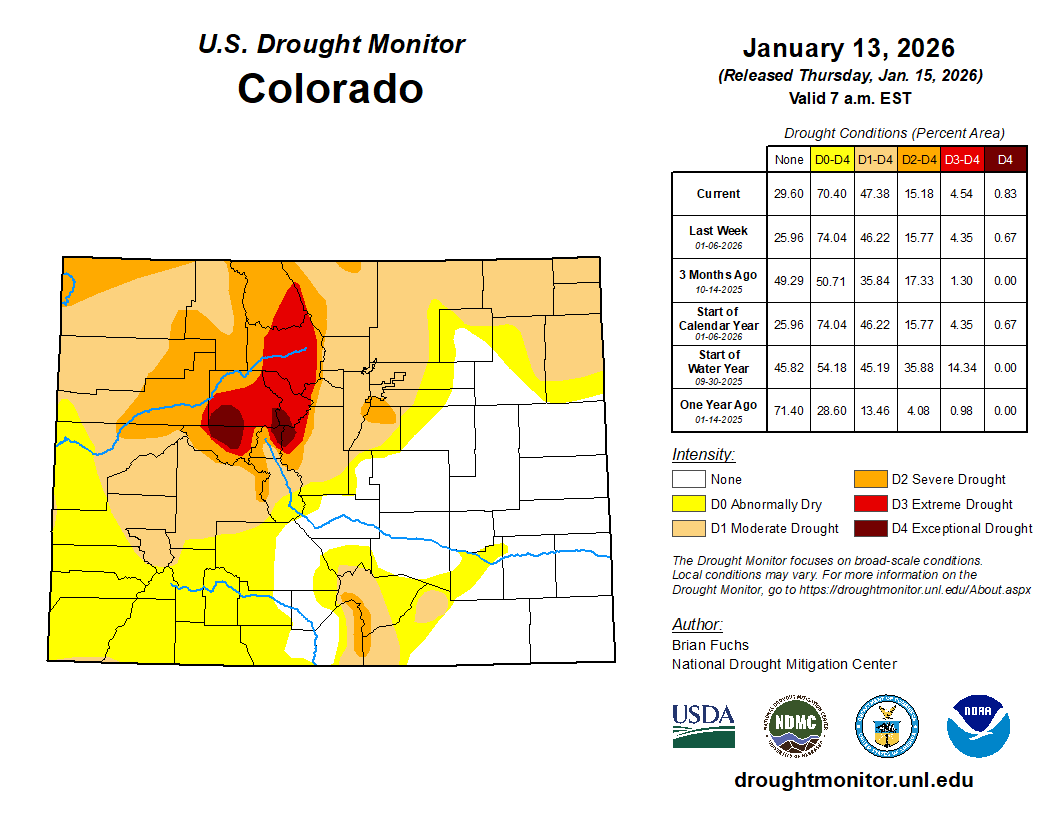
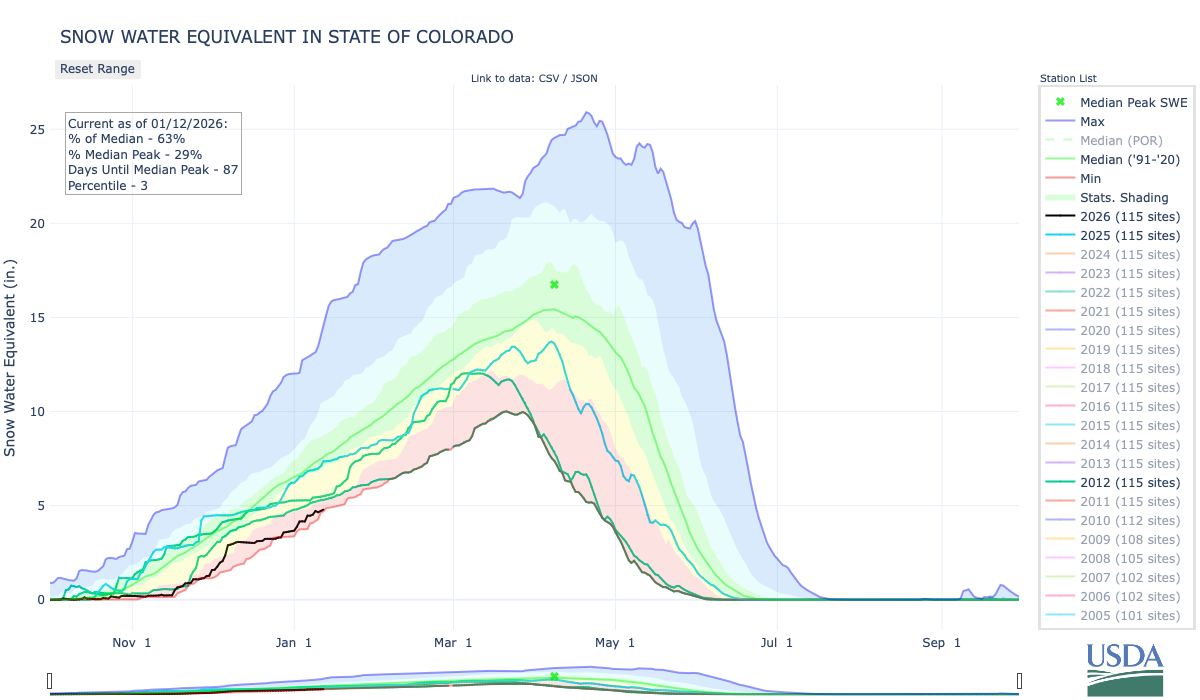
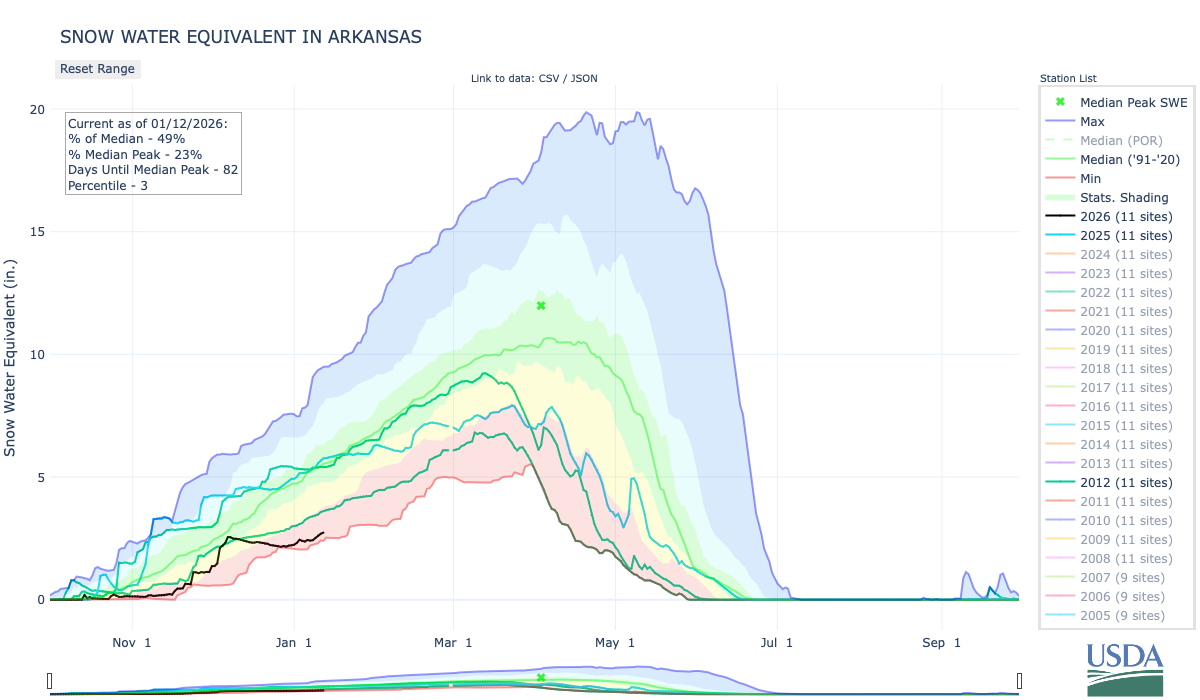
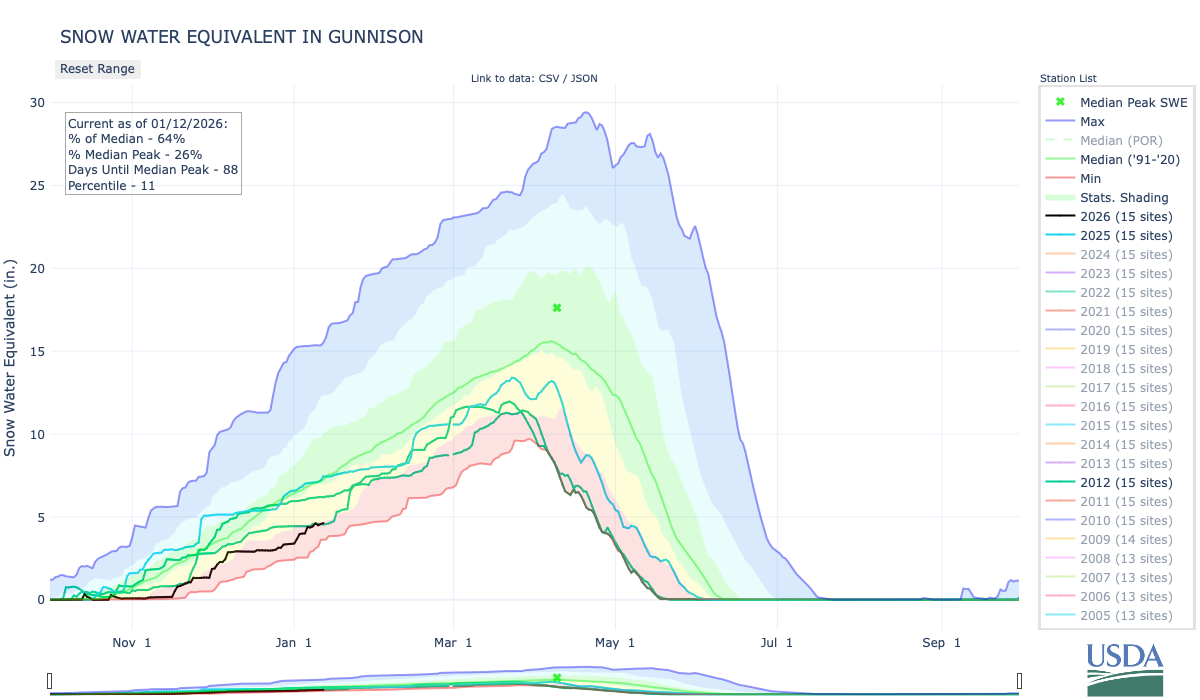
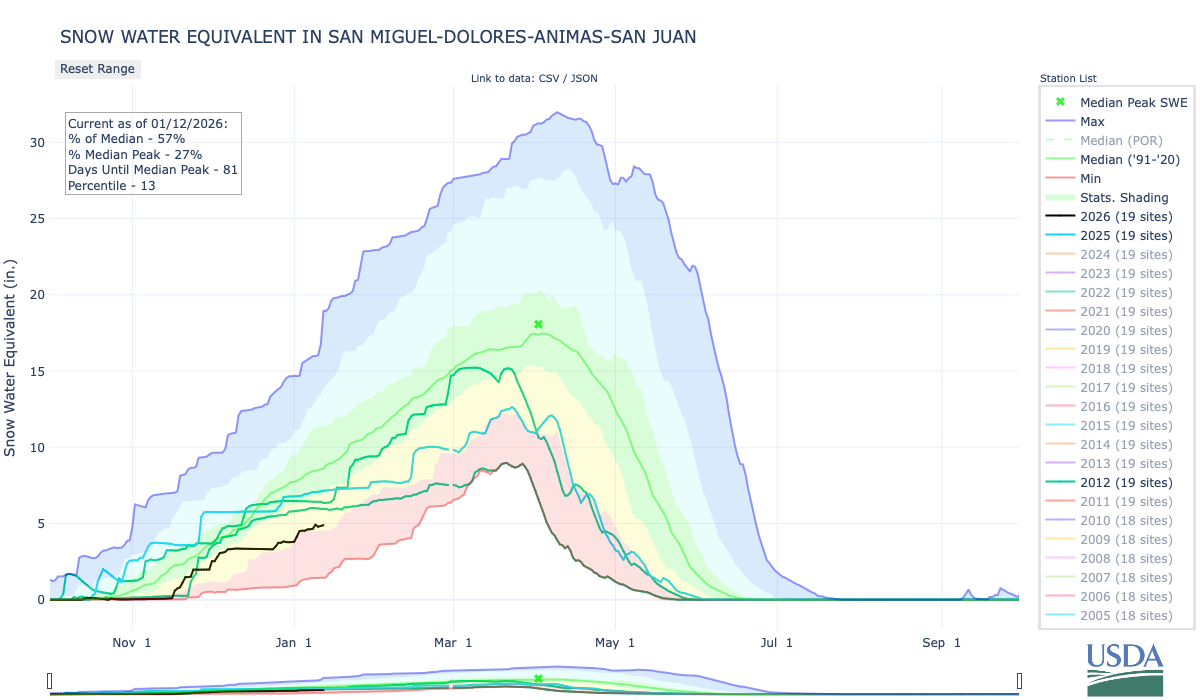
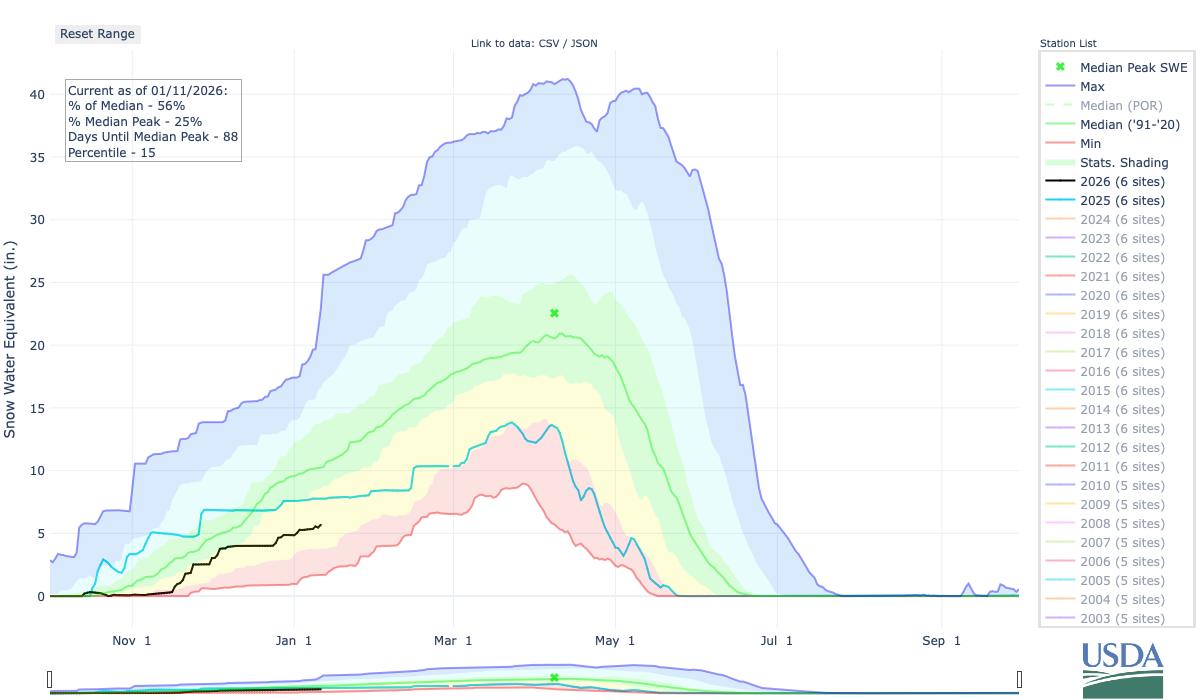
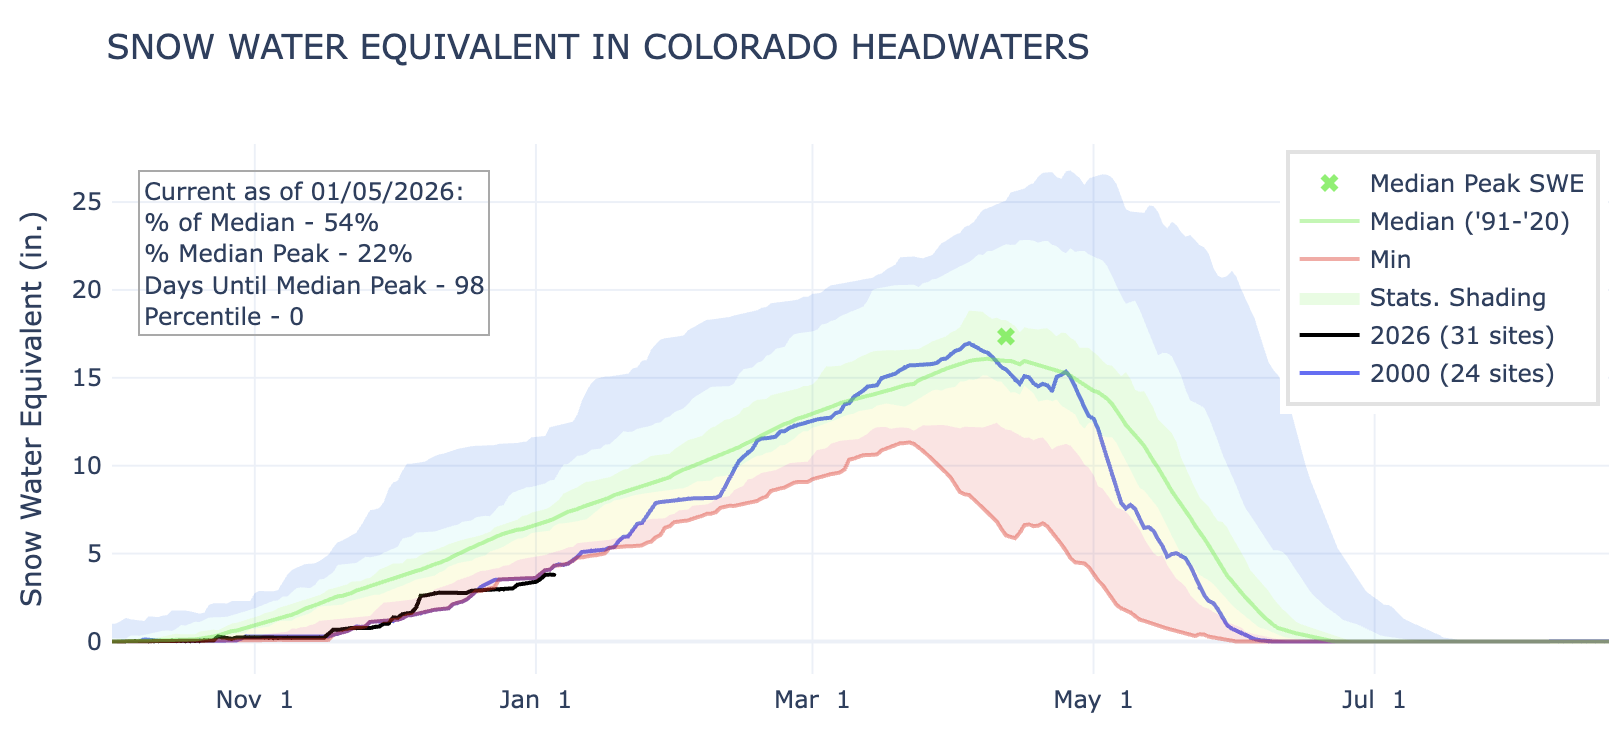
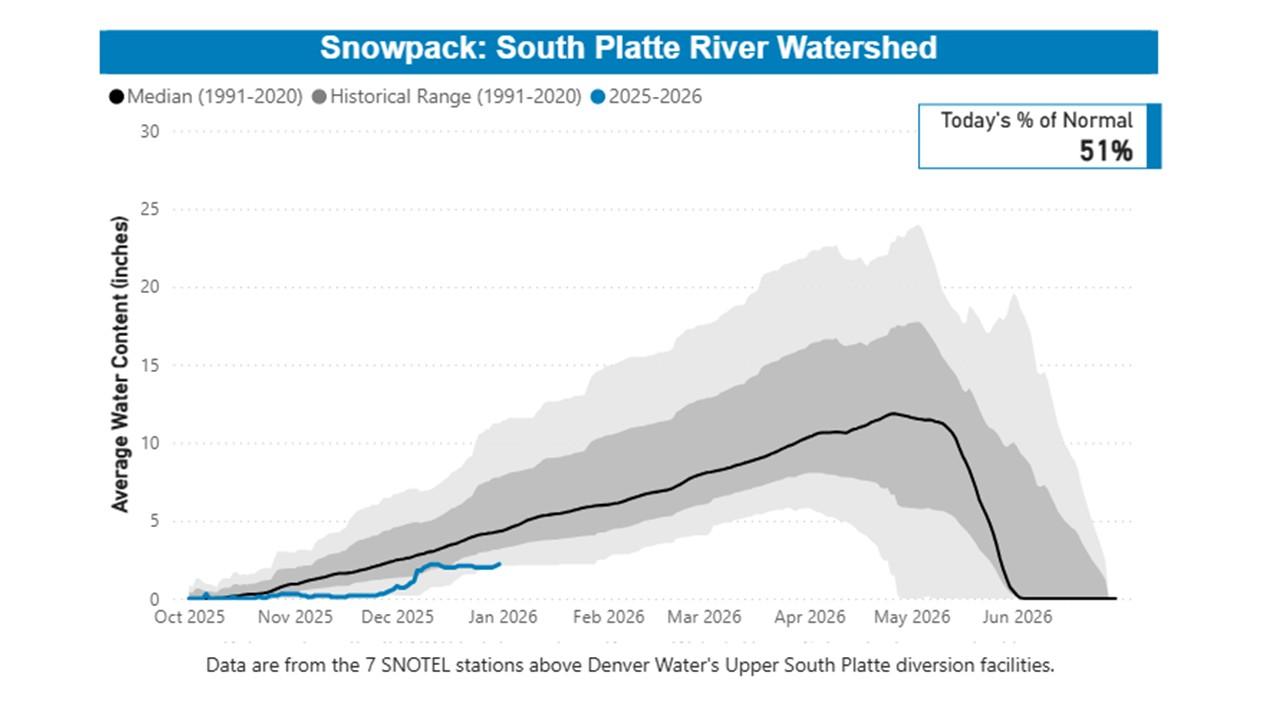
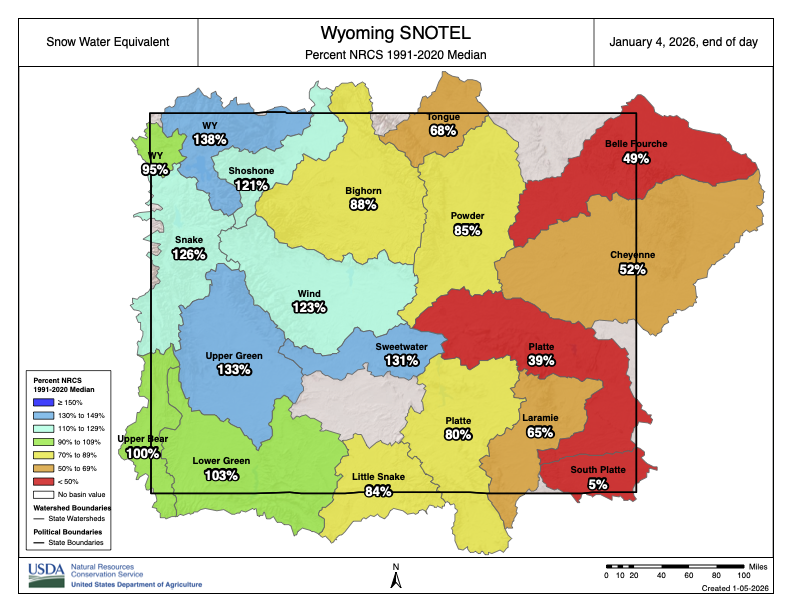
Colorado’s snowpack levels remain meager so far this winter season, with little moisture in the near-term local forecast in a year when water managers can scarcely afford a poor spring runoff season due to low storage levels downstream in Lake Powell. The state’s snowpack stood at 63% of median as of Tuesday, according to the federal Natural Resources Conservation Service. Levels range from 76-77% in some basins in far-northern Colorado to 58% in the Colorado River headwaters and just 50% in the Arkansas River basin. The Gunnison River Basin is at 63% of median.
The NRCS said in a news release that warm and dry conditions have led to the below-normal snowpack conditions. Climatologist Allie Mazurek with The Colorado Climate Center said in a December blog post that September-November was the fourth-warmest on record for that period for Colorado, with November in specific being third-warmest on record. Some Western Slope locations had their warmest fall on record, Mazurek wrote. The conditions have challenged ski resorts that have opened later, and with limited terrain. But Powderhorn Mountain Resort announced Saturday that it would be boosting its operations through the opening of its West End Lift the following day, following a 15-inch storm and cooler temperatures that allowed around-the-clock snowmaking.
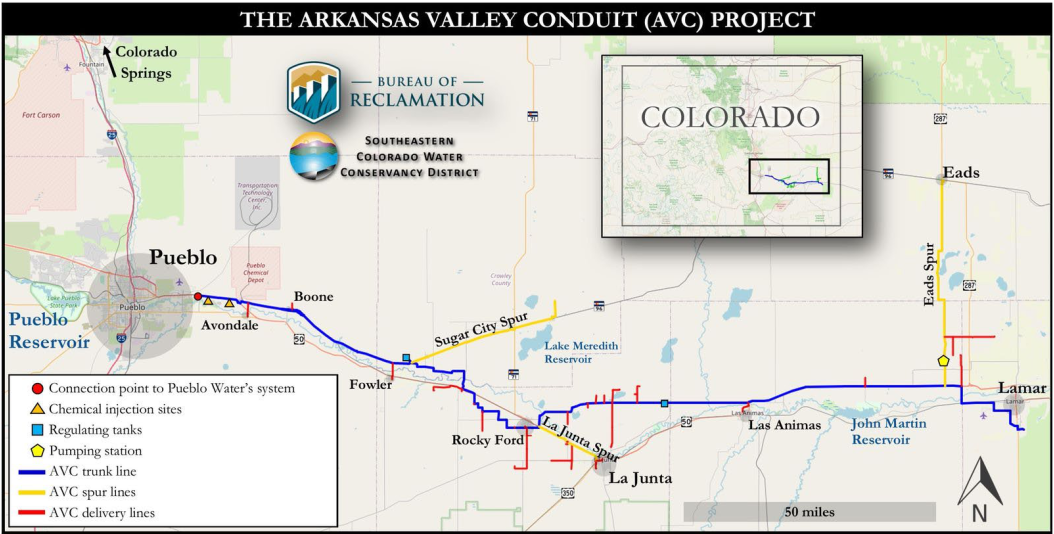
Water officials and Colorado’s congressional reps are scrambling to find an affordable path forward for communities in the Lower Arkansas Valley who had hoped the federal government would help them lower their costs for a critical clean water pipeline.
President Trump vetoed the bipartisan Finish the Arkansas Valley Conduit Act on New Year’s Eve, and despite Colorado’s efforts, Congress failed to override the veto last week.
Construction on the $1.39 billion pipeline began in 2023. There’s enough money left from the $500 million appropriated by Congress to continue building for another three to five years, according to Bill Long, president of the board for the Pueblo-based Southeastern Water Conservancy District. The district operates the federal Fryingpan-Arkansas Project and is overseeing pipeline construction for the U.S. Bureau of Reclamation.
That means the pipeline should eventually reach Rocky Ford, a point roughly halfway between its start east of Pueblo Reservoir and its endpoint farther east, near Lamar. “It’s when we get to the second half of the project where it will be challenging to build and repay our portion of the debt,” Long said. “Without this legislation, there will be a point where we will have to stop.”
What comes next isn’t clear yet, though members of Colorado’s congressional delegation and water officials in the Lower Arkansas Valley said they are evaluating their options for taking another run at the issue in Congress.
“Obviously things are up in the air,” Long said.
“Sooner rather than later we may be looking at a new piece of legislation, but the question is, would this administration be amenable to a new piece of legislation. If we can’t find something, we may have to wait this administration out,” he said.
Pueblo Dam. Photo courtesy of Colorado Parks and Wildlife
Waiting for clean water in the Lower Arkansas Valley is nothing new.
First envisioned as part of the U.S. Bureau of Reclamation’s Fryingpan-Arkansas Project in 1962, the pipeline languished on paper for decades because of high costs. The 130-mile pipeline serves 39 communities.
The need for clean water in the Lower Arkansas Valley became apparent in the 1950s and earlier, by some accounts, when wells drilled near the Arkansas River were showing a range of toxic elements, including naturally occurring radium and selenium. Both can cause severe health problems, including bone cancer and lung issues if high amounts are consumed.
Without safe drinking water, towns in the region have either had to haul water or install expensive reverse osmosis plants to purify their contaminated well water.
Things changed on the stalled project in 2023, when Congress directed some $500 million toward the pipeline.
The legislation would have gone further, allowing the repayment terms on the loans from the federal government to be extended to 75 years, up from 50 years, and to cut interest rates in half, from 3.046% to 1.523%. The legislation also would have allowed the project to be classified as one of hardship, a move that may have allowed the U.S. Bureau of Reclamation to forgive some loan payments if a case for economic hardship could have been made.
The conduit project is also partially funded with grants and loans from state agencies, including the Colorado Water Resources and Power Development Authority.
“The act was an important step in making this project affordable,” said Keith McLaughlin, executive director of the Colorado Water Resources and Power Development Authority, one of the agencies helping fund the work.
“Obviously we’re disappointed,” he said.
Colorado politicos say they’re still working to push legislation through. The bipartisan act was sponsored by Colorado Republican U.S. Reps. Lauren Boebert and Jeff Hurd in the U.S. House and Democratic U.S. Sens. John Hickenlooper and Michael Bennet in the U.S. Senate.
Trump’s veto of the measure is widely seen as being the result of ongoing conflicts between his administration and Colorado Gov. Jared Polis, a Democrat, including a request to pardon former Mesa County Clerk Tina Peters, who is serving a nine-year prison term for orchestrating a data breach of the county’s elections equipment violating state elections. Polis so far has declined to intervene in that case, although he did describe the sentence as “harsh,” leading some to speculate that he might commute it. In a statement, Polis said he was hopeful that Congress would ultimately succeed in approving some form of aid to help complete the conduit.
Neither Boebert nor Hurd responded to a request for comment. But Hickenlooper said that all the congressional reps continue to work on a new path forward.
“The people of southeastern Colorado have waited 60 years for clean, safe drinking water. We’re continuing to work with our partners in the delegation to complete the Arkansas Valley Conduit and deliver on the federal government’s promise,” Hickenlooper said via email.
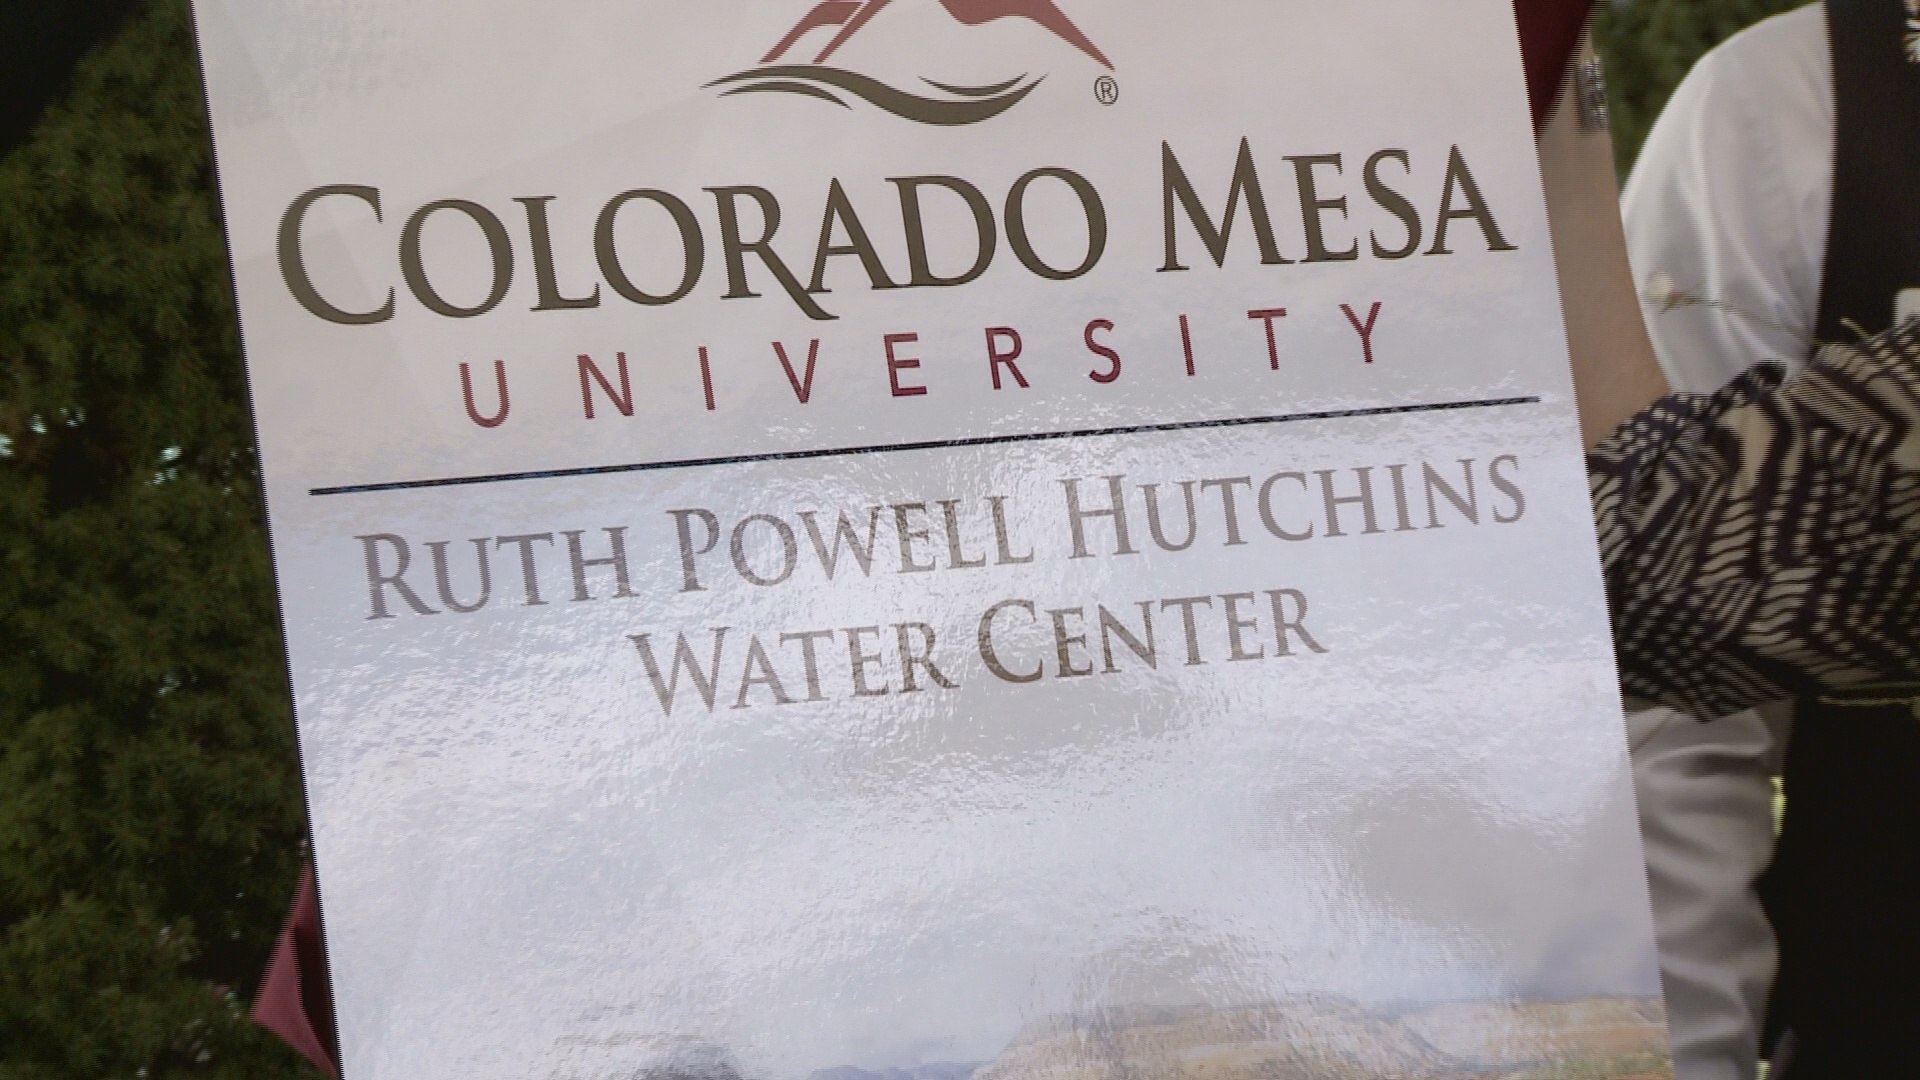
Shannon Wadas has been hired as the executive director of the Ruth Powell Hutchins Water Center (RPHWC), Colorado Mesa University announced Monday. Wadas was chosen for her experience in natural resource and organizational management in the public and non-profit sectors. CMU cited experiences including her support of watershed planning efforts in the region, coordinating and facilitating a water education course for professionals, and helping form a community navigator network in the Upper Rio Grande Basin to accelerate aquatic restoration. Most recently, Wadas worked as a private consultant focused on organizational strategy, partnership collaboration, engagement and capacity building.
“I am excited and honored to join Colorado Mesa University and lead the Ruth Powell Hutchins Water Center,” Wadas said in CMU’s announcement. “There is no greater unifying force than water. I am thrilled to have the opportunity to catalyze and strengthen the collaborative efforts of CMU and local and regional partners to support important water issues through educational opportunities, research initiatives and thoughtful conversations.”
“Shannon brings a wealth of experience and collaborative leadership to CMU that will strengthen the Ruth Powell Hutchins Water Center’s role in bringing people together, fostering innovation in water resource management and cultivating the next generation of water leaders,” added CMU President John Marshall.
The RPHWC serves as a Western Slope hub for water policy, academic education and applied research. The center also supports student programming and interdisciplinary learning opportunities, including water-focused coursework and research, seminars, continuing education classes and a Water Fellows program.
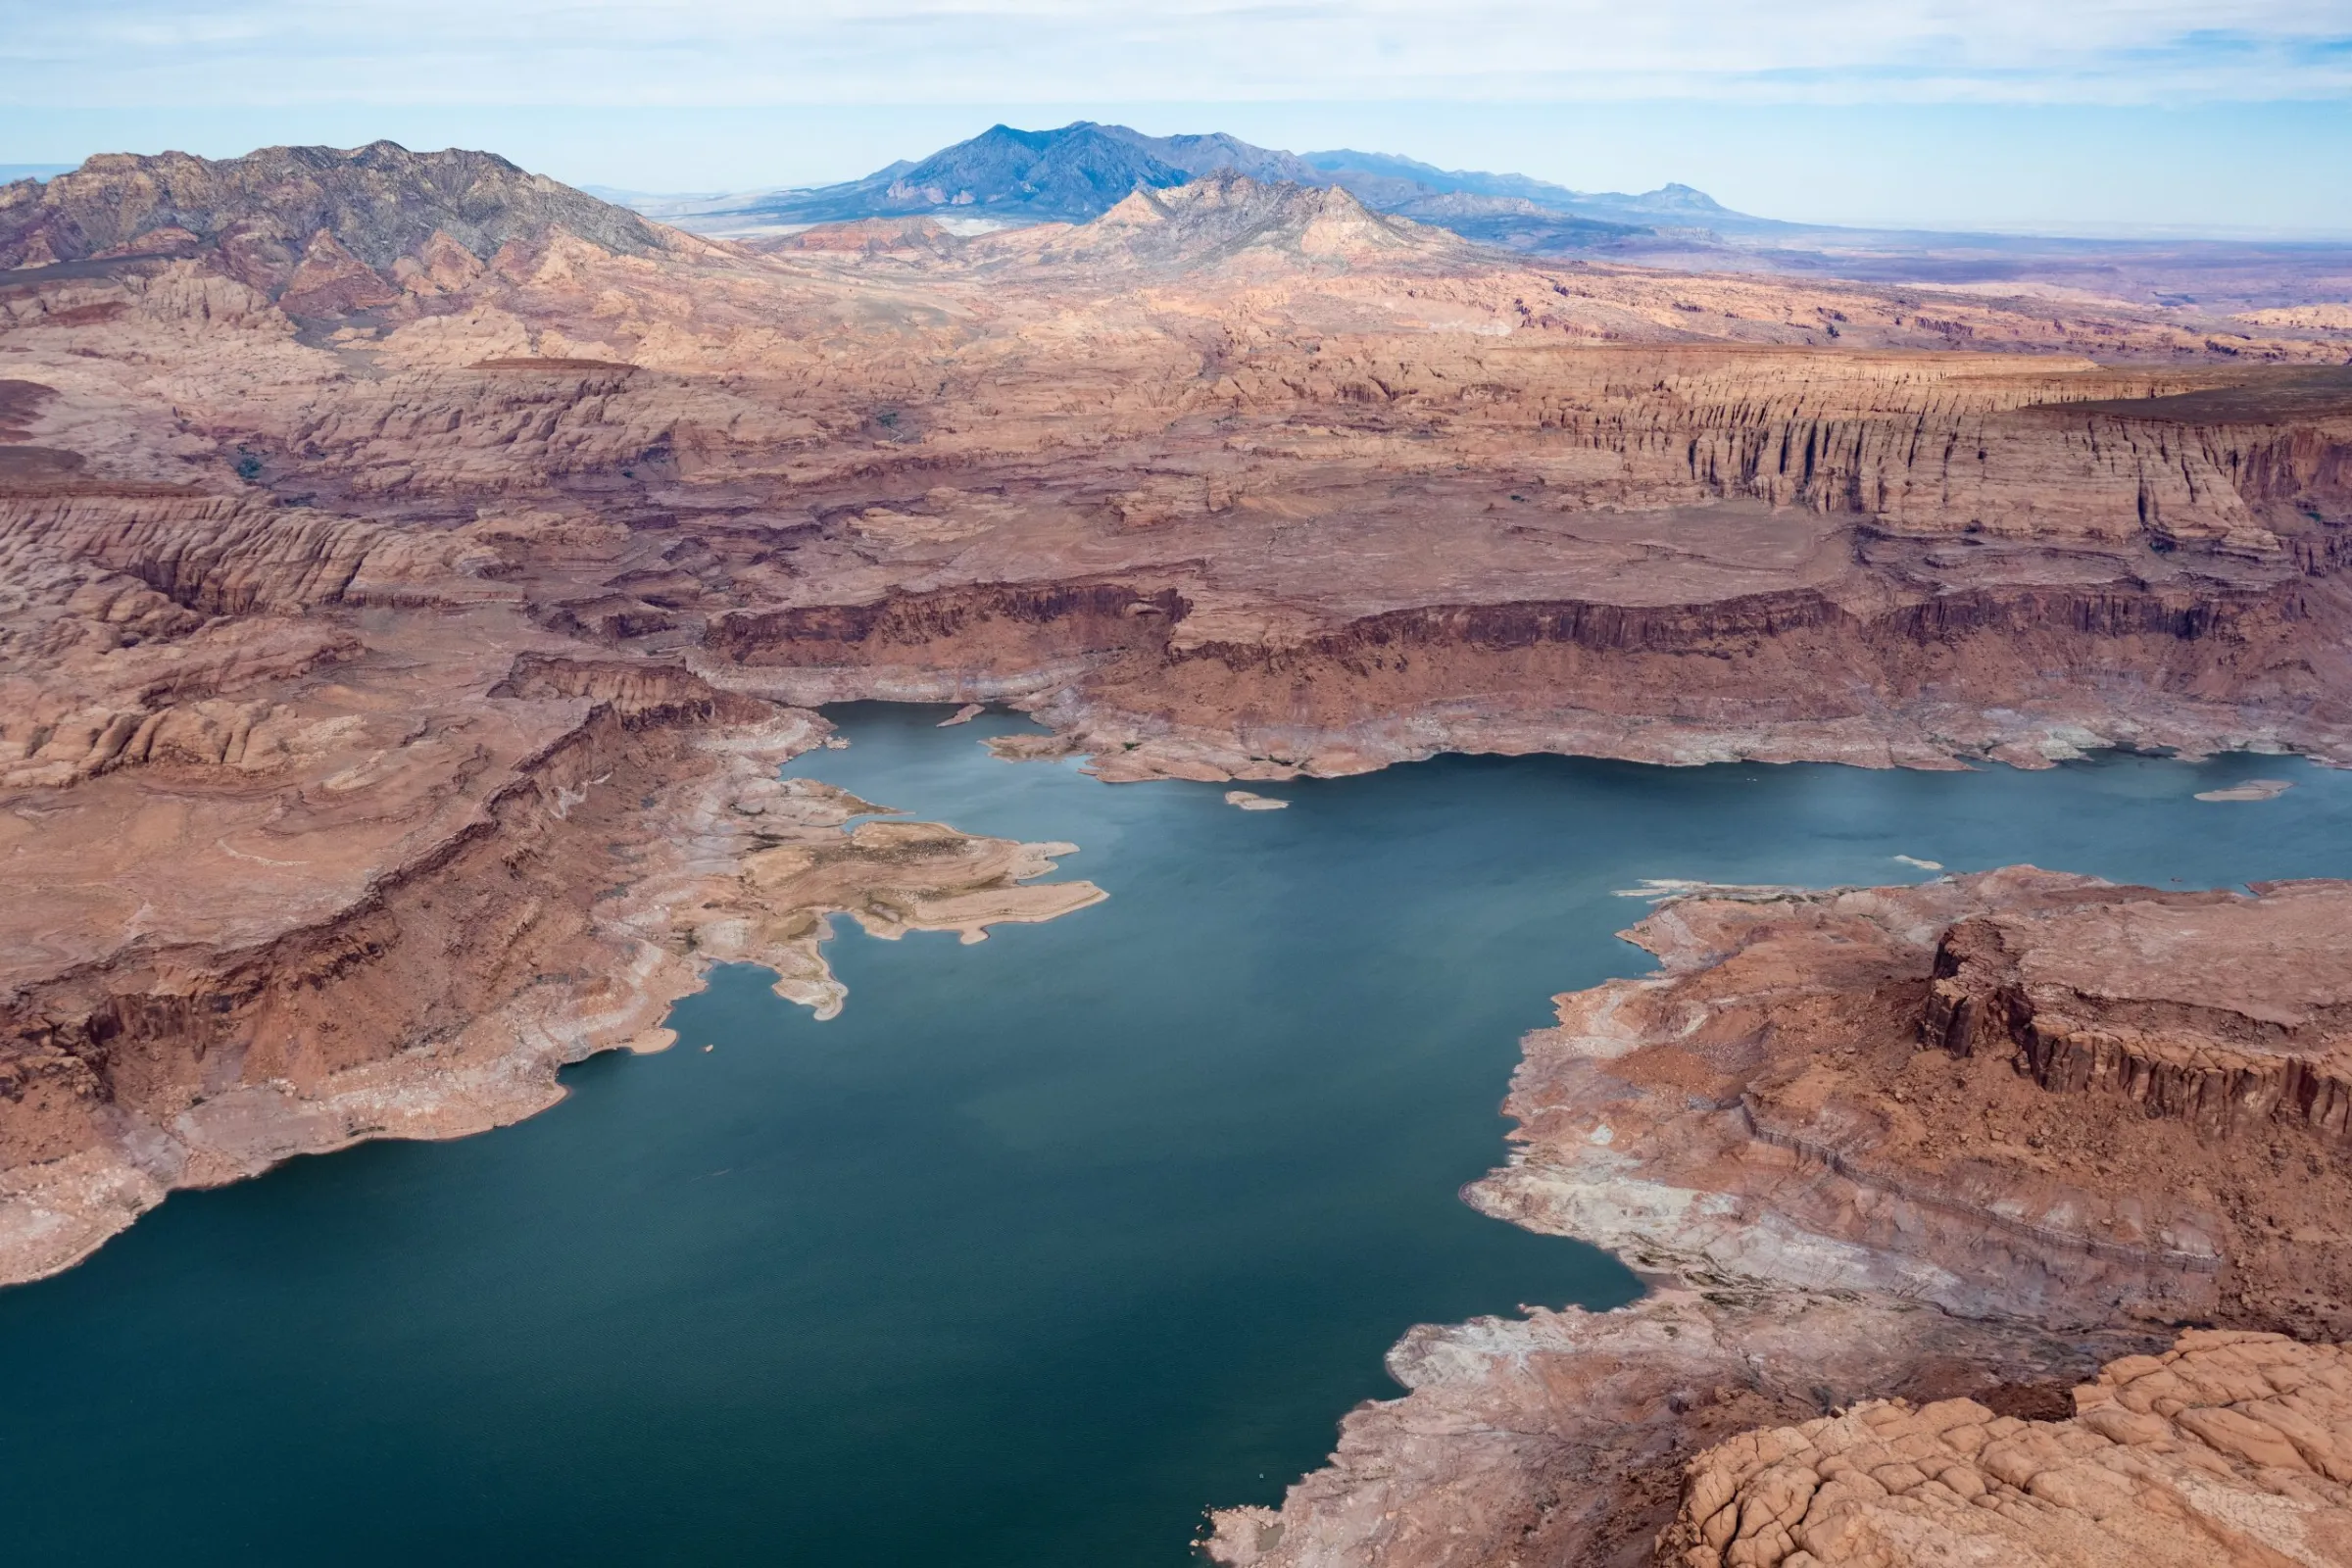
Lake Powell is seen from the air in October 2022. Three of the management options released by the feds have the option for an Upper Basin conservation pool in Lake Powell. CREDIT: ALEXANDER HEILNER/THE WATER DESK
Federal officials have released detailed options for how the Colorado River could be managed in the future, pushing forward the planning process in the absence of a seven-state deal. But some Colorado River experts and water managers say cuts don’t go deep enough under some scenarios and flow estimates don’t accommodate future water scarcity driven by climate change.
On Jan. 9, the U.S. Bureau of Reclamation released a draft of its environmental impact statement, a document required by the National Environmental Policy Act, which lays out five alternatives for how to manage the river after the current guidelines expire at the end of the year. This move by the feds pushes the process forward even as the seven states that share the river continue negotiating how cuts would be shared and reservoirs operated in the future. If the states do make a deal, it would become the “preferred alternative” and plugged into the NEPA process.
“Given the importance of a consensus-based approach to operations for the stability of the system, Reclamation has not yet identified a preferred alternative,” Scott Cameron, the acting Reclamation commissioner, said in a press release. “However, Reclamation anticipates that when an agreement is reached, it will incorporate elements or variations of these five alternatives and will be fully analyzed in the final EIS, enabling the sustainable and effective management of the Colorado River.”
For more than two years, the Upper Basin (Colorado, New Mexico, Utah and Wyoming) and the Lower Basin (California, Arizona and Nevada) have been negotiating, with little progress, how to manage a dwindling resource in the face of an increasingly dry future. The 2007 guidelines that set annual Lake Powell and Lake Mead releases based on reservoir levels do not go far enough to prevent them from being drawn down during consecutive dry years, putting the water supply for 40 million people in the Southwest at risk.
The crisis has deepened in recent years, and in 2022, Lake Powell flirted with falling below a critical elevation to make hydropower. Recent projections from the U.S. Bureau of Reclamation show that it could be headed there again this year and in 2027.
John Berggren, regional policy manager with Western Resource Advocates, helped craft elements of one of the alternatives, Maximum Operational Flexibility, formerly called Cooperative Conservation.
“My initial takeaway is there’s a lot of good stuff in there,” Berggren said of the 1,600-page document, which includes 33 supporting and technical appendices. “Their goal was to have a wide range of alternatives to make sure they had EIS coverage for whatever decision they ended up with, and I think that there are a lot of innovative tools and policies and programs in some of them.”
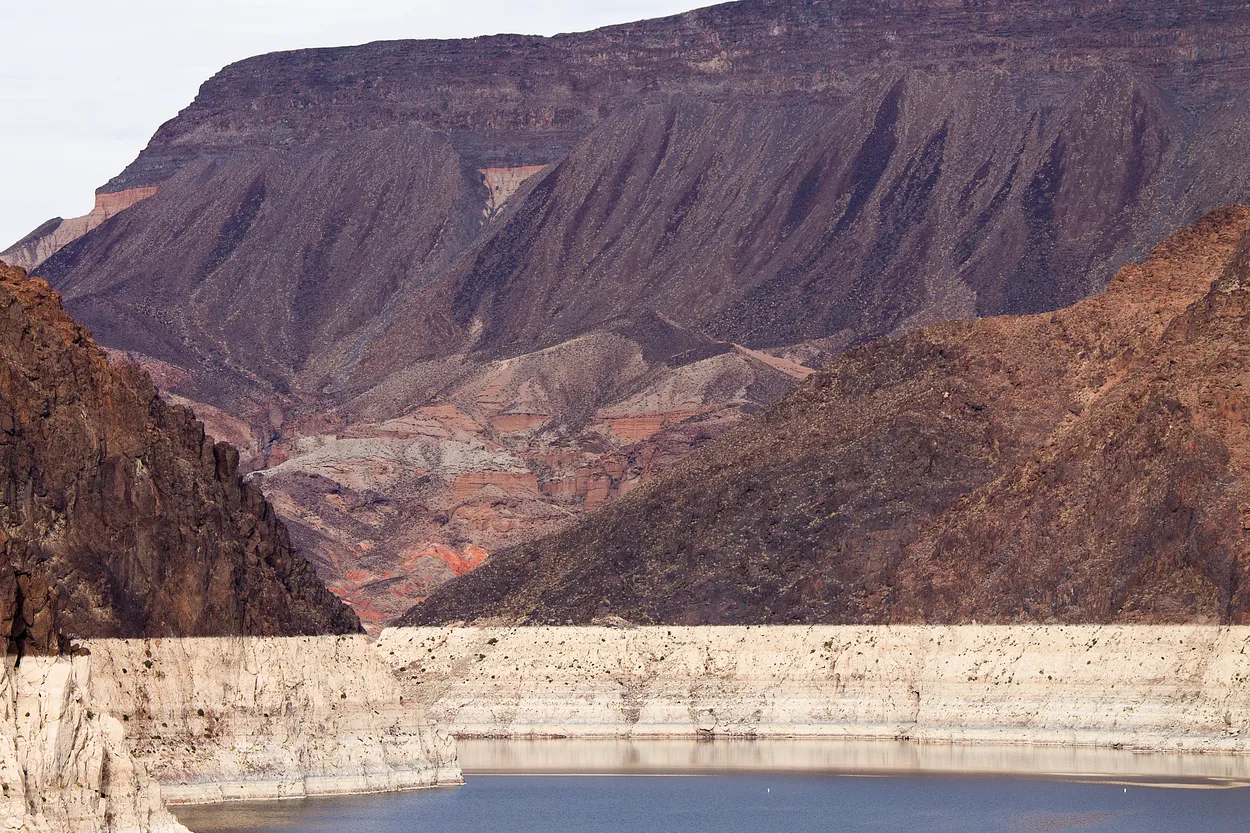
The infamous bathtub ring could be seen near the Hoover Dam in December 2021. The U.S. Bureau of Reclamation has released a draft Environmental Impact Statement for post-2026 management of the river. CREDIT: HEATHER SACKETT/ASPEN JOURNALISM
Alternatives
The first alternative is “no action,” meaning river operations would revert to pre-2007 guidance; officials have said this option must be included as a requirement of NEPA, but doesn’t meet the current needs.
The second alternative, Basic Coordination, can be implemented without an agreement from the states and represents what the feds can do under their existing authority. It would include Lower Basin cuts of up to 1.48 million acre-feet based on Lake Mead elevations; Lake Powell releases would be primarily 8.23 million acre-feet and could go as low as 7 million acre-feet. It would also include releases from upstream reservoirs Flaming Gorge, Blue Mesa and Navajo to feed Powell. But experts say this alternative does not go far enough to keep the system from crashing.
“It was pretty well known that the existing authorities that Reclamation has are probably not enough to protect the system,” Berggren said. “Especially given some of the hydrologies we expect to see, the Basic Coordination does not go far enough.”
The Enhanced Coordination Alternative would impose Lower Basin cuts of between 1.3 million and 3 million acre-feet that would be distributed pro-rata, based on each state’s existing water allocation. It would also include an Upper Basin conservation pool in Lake Powell that starts at up to 200,000 acre-feet a year and could increase up to 350,000 acre-feet after the first decade.
Under the Maximum Operational Flexibility Alternative, Lake Powell releases range from 5 million acre-feet to 11 million acre-feet, based on total system storage and recent hydrology, with Lower Basin cuts of up to 4 million acre-feet. It would also include an Upper Basin conservation pool of an average of 200,000 acre-feet a year.
These two alternatives perform the best at keeping Lake Powell above critical elevations in dry years, according to an analysis contained in the draft EIS.
“There are really only two of these scenarios that I think meet the definition of dealing with a very dry future: Enhanced Coordination and the Max Flexibility,” said Brad Udall, a senior water and climate research scientist at Colorado State University. “Those two kind of jump out at me as being different than the other ones in that they actually seem to have the least harmful outcomes, but the price for that are these really big shortages.”
The final scenario is the Supply Driven Alternative, which calls for maximum shortages of 2.1 million acre-feet and Lake Powell releases based on 65% of three-year natural flows at Lees Ferry. It also includes an Upper Basin conservation pool of up to 200,000 acre-feet a year. This option offers two different approaches to Lower Basin cuts: one based on priority where the oldest water rights get first use of the river, putting Arizona’s junior users on the chopping block, and one where cuts are distributed proportionally according to existing water allocations, meaning California could take the biggest hit.
This alternative is based on proposals submitted by each basin and discussions among the states and federal officials last spring. Udall said the cuts are not deep enough in this option.
“You can take the supply-driven one and change the max shortages from 2.1 million acre-feet up to 3 or 4 and it’s going to perform a lot like those other two,” he said. “I think what hinders it is just the fact that the shortages are not big enough to keep the basin in balance when push comes to shove.”
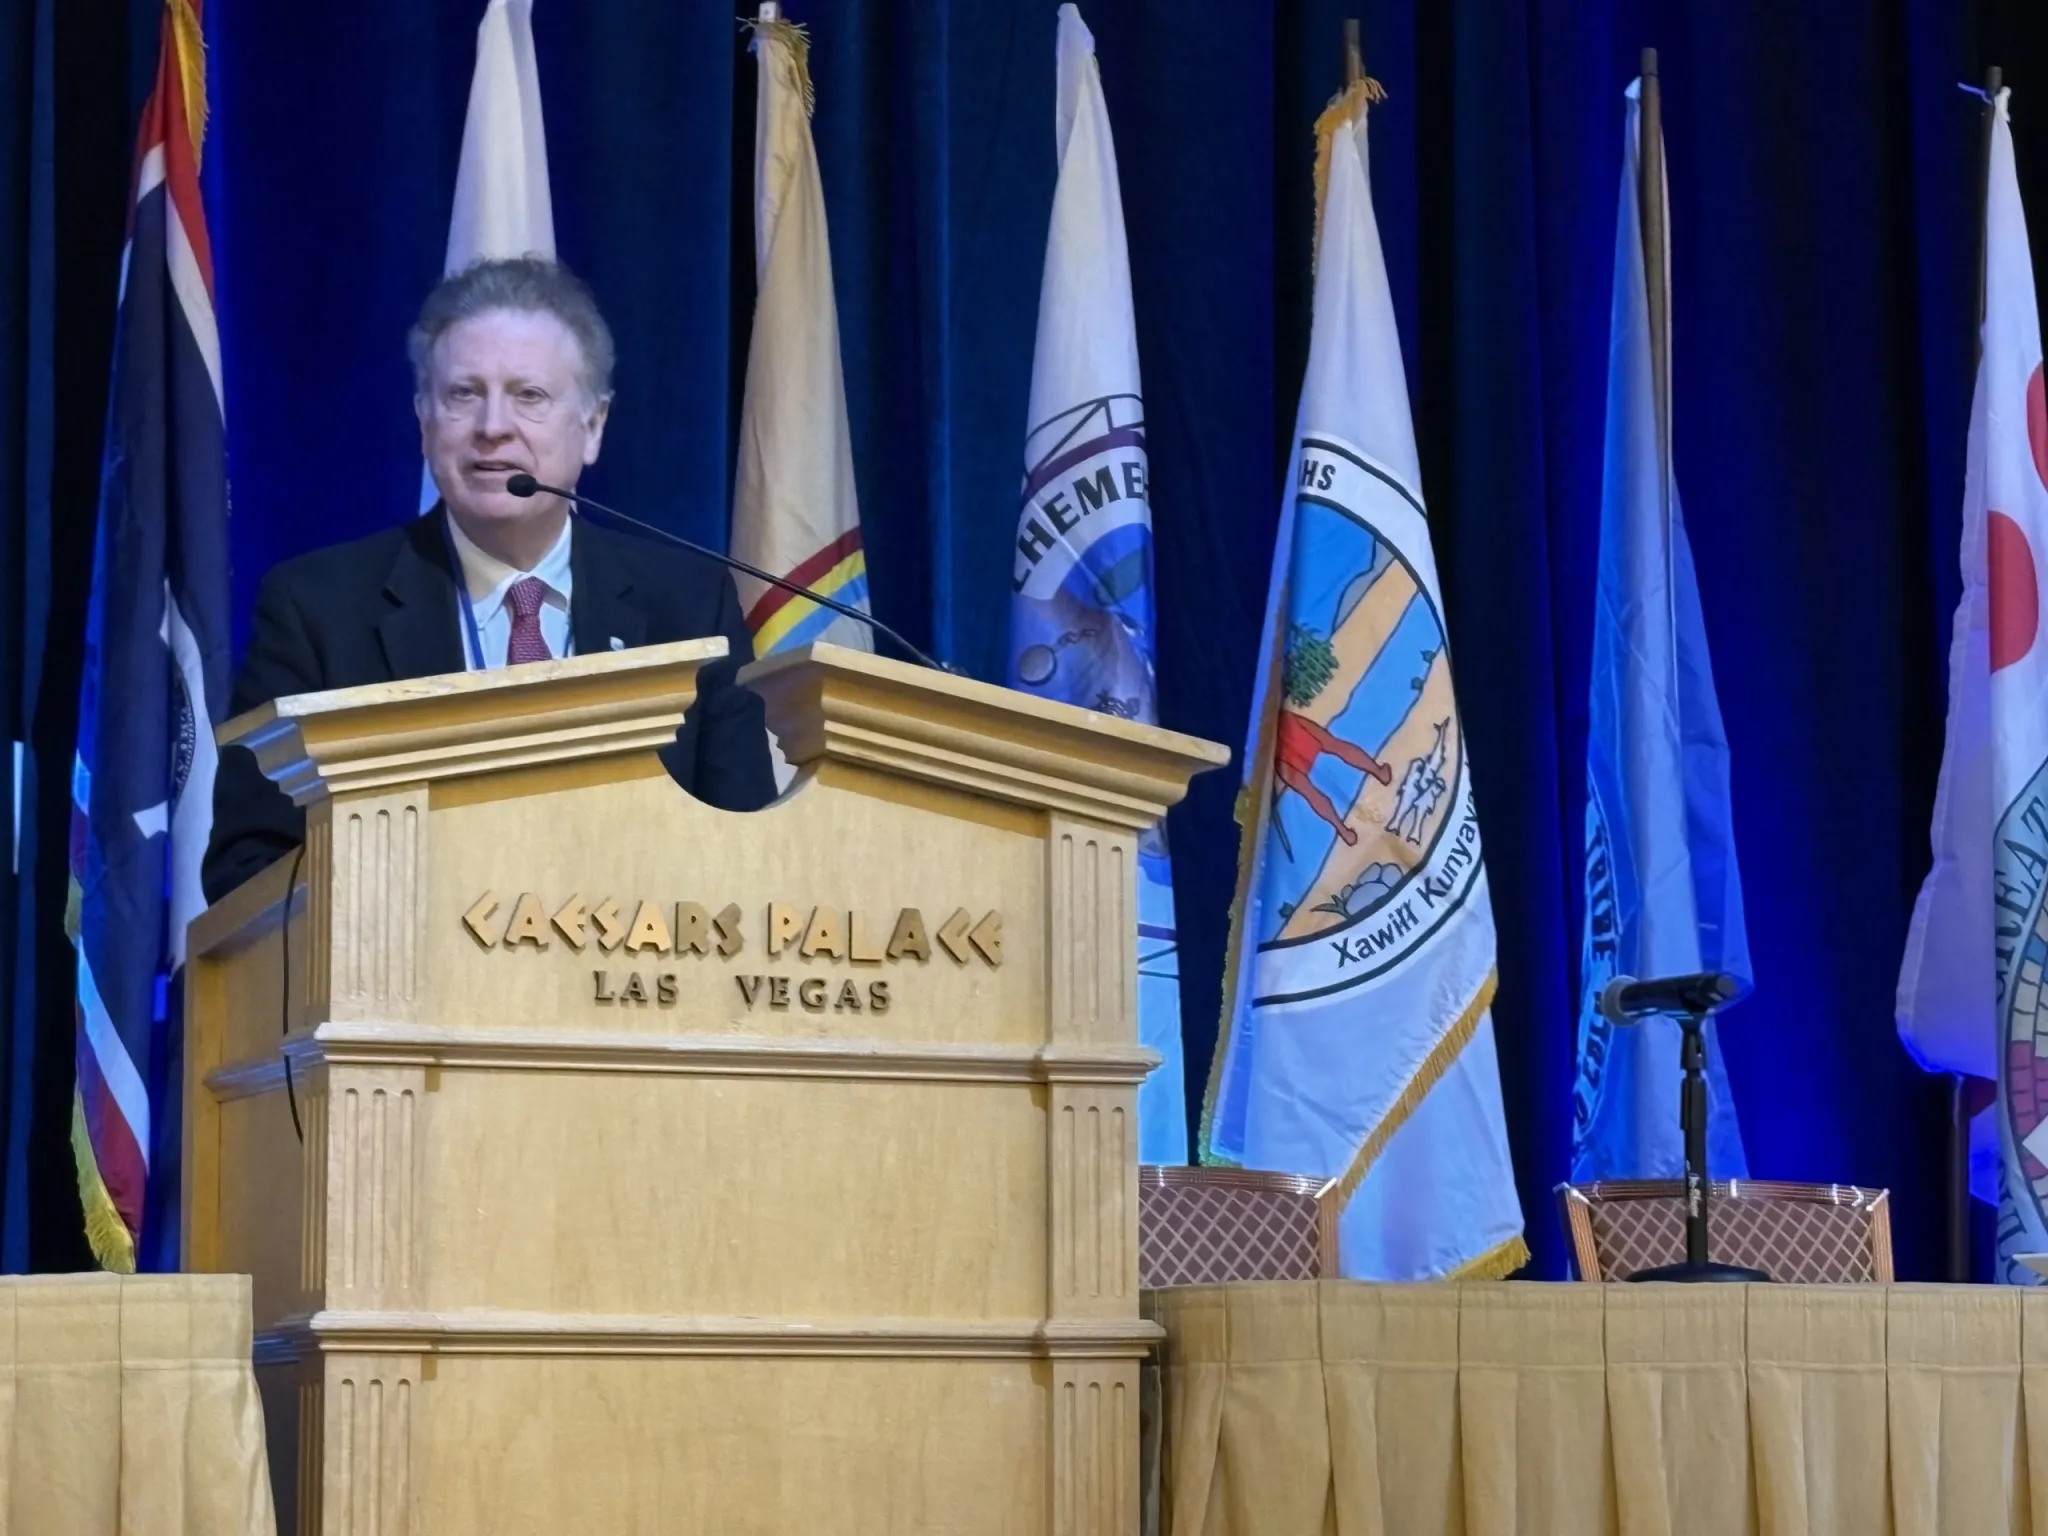
Reclamation’s Acting Commissioner Scott Cameron speaks at the Colorado River Water Users conference in Las Vegas in December 2025. The agency has released a draft Environmental Impact Statement, which outlines options for managing the river after this year. CREDIT: HEATHER SACKETT/ASPEN JOURNALISM
Pivotal moment
In a prepared statement, Glenwood Springs-based Colorado River Water Conservation District officials expressed concern that the projected future river flows are too optimistic.
“We are concerned that the proposed alternatives do not accommodate the probable hydrological future identified by reliable climate science, which anticipates a river flowing at an average of 9-10 [million acre feet] a year,” the statement reads. “The Colorado River Basin has a history of ignoring likely hydrology, our policymakers should not carry this mistake forward in the next set of guidelines.”
The River District was also skeptical of the Upper Basin conservation pool in Lake Powell, which is included in three of the alternatives. Despite dabbling in experimental programs that pay farmers and ranchers to voluntarily cut back on their water use in recent years, conservation remains a contentious issue in the Upper Basin. Upper Basin water managers have said their states can’t conserve large volumes of water and that any program must be voluntary.
Over the course of 2023 and 2024, the System Conservation Pilot Program, which paid water users in the Upper Basin to cut back, saved about 101,000 acre-feet at a cost of $45 million.
The likeliest place to find water savings in Colorado is the 15-county Western Slope area represented by the River District. But if conservation programs are focused solely on this region, they could have negative impacts on rural agricultural communities, River District officials have said.
“Additionally, several alternatives include annual conservation contributions from the Upper Basin between [200,000 acre-feet] and [350,000 acre feet],” the River District’s statement reads. “We do not see how that is a realistic alternative given the natural availability of water in the Upper Basin, especially in dry years.”
In a prepared statement, Colorado officials said they were looking forward to reviewing the draft EIS.
“Colorado is committed to protecting our state’s significant rights and interests in the Colorado River and continues to work towards a consensus-based, supply-driven solution for the post-2026 operations of Lake Powell and Mead,” Colorado’s commissioner, Becky Mitchell, said in the statement.
The release of the draft EIS comes at a pivotal moment for the Colorado River Basin. The seven state representatives are under the gun to come up with a deal and have less than a month to present details of a plan by the feds’ Feb. 14 deadline. Federal officials have said they need a new plan in place by Oct. 1, the start of the next water year. This winter’s dismal snowpack and dire projections about spring runoff underscore the urgency for the states to come up with an agreement for a new management paradigm.
Over a string of recent dry years, periodic wet winters in 2019 and 2023 have bailed out the basin and offered a last-minute reprieve from the worst consequences of drought and climate change. But this year is different, Udall said.
“We’re now at the point where we’ve removed basically all resiliency from the system,” he said. “Between the EIS and this awful winter, some really tough decisions are going to be made. … Once we finally get to a consensus agreement, the river is going to look very, very different than it ever has.”
The draft EIS will be published in the Federal Register on Jan.16, initiating a 45-day comment period that will end March 2.
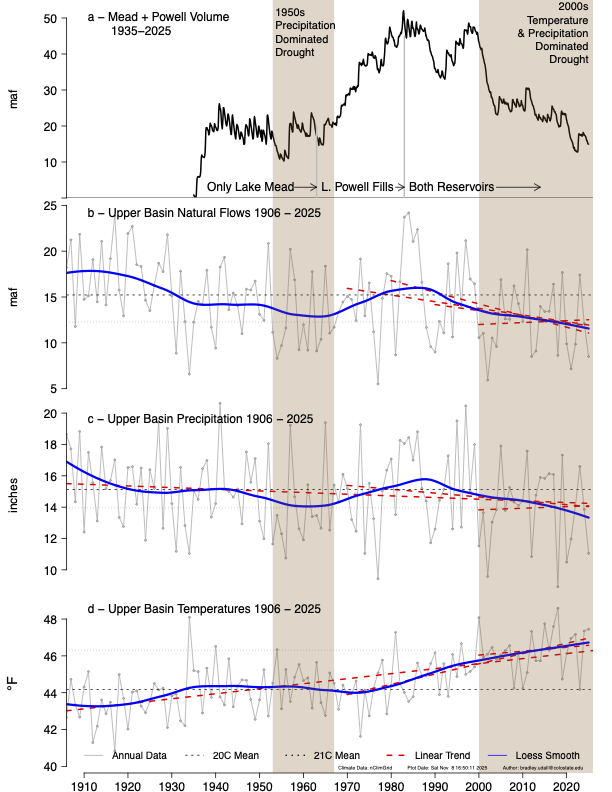
Udall/Overpeck 4-panel Figure Colorado River temperature/precipitation/natural flows with trend. Lake Mead and Lake Powell storage. Updated through Water Year 2025. Note the tiny points on the annual data so that you can flyspeck the individual years. Credit: Brad Udall
Just over a month before the deadline for the Colorado River states to agree on a plan for sharing the river’s diminishing waters, the feds released their options, one of which could be implemented if the states don’t reach a deal. The Bureau of Reclamation’s “Post-2026 Operational Guidelines and Strategies for Lake Powell and Lake Mead” offers five alternative scenarios for how to run the river, all of which are aimed at keeping the two reservoirs viable through different methods of divvying up the burden of inevitable shortages in supply.
The document, and the need to deal with present and future shortages, is necessary because human-caused climate change-exacerbated aridification has diminished the Colorado River’s flow, throwing the supply-demand equation out of balance. So it is somewhat surreal to peruse the voluminous report that was published by an administration whose leader has called climate change a “hoax” and a “con job.”
My cursory search of the document turned up only one occurrence of the term “climate change.”1 Yet the authors do acknowledge, if obliquely, that global warming is shrinking the river. “The Basin is experiencing increased aridity due to climate variability,” they write, “and long-term drought and low runoff conditions are expected in the future.” This tidbit also evaded the censors: “Since 2000, the Basin has experienced persistent drought conditions, exacerbated by a warming climate, resulting in increased evapotranspiration, reduced soil moisture, and ultimately reduced runoff.”
All of the alternatives put most of the burden of cutting consumptive use on the Lower Basin states, while directing the Upper Basin to take unspecified conservation measures. I’ll summarize the alternatives below, but first, it seems telling to see which which proposed alternatives the Bureau considered, but ultimately eliminated from detailed analysis.
The “boating alternative,” which would prioritize maintaining Lake Powell’s surface level at or above 3,588 feet to serve recreational boating needs. This proposal was put forward in the “Path to 3,588” plan by motorized recreation lobbying group BlueRibbon Coalition. It was dismissed because, basically, it would sacrifice downstream farms and cities for the sake of boating.
The ecosystem alternative, which would prioritize the Colorado River’s ecosystem health by focusing management and reducing consumptive human use to protect wildlife, vegetation, habitats, and wetlands.
One-dam alternative, a.k.a. Fill Mead First. This proposal would entail either bypassing or decommissioning Glen Canyon Dam with the aim of filling Lake Mead. The Bureau said they rejected the plan because it would be inconsistent with the Law of the River and might be unacceptable to stakeholders (even though some Lower Basin farmers got a little Hayduke-fever a couple of years back, suggesting that ridding Glen Canyon of the dam might be the best way to manage the river).
Okay, so that’s what’s NOT going to happen. So what might happen if the feds feel the need to intervene? Here’s a very short summary of each alternative:
No Action: This is always offered in these things, and it just means that they would revert back to the pre-2007 interim guidelines era, when releases from Lake Powell were fixed at an average of 8.23 million acre-feet per year and shortages were determined based on Lake Mead levels and would be distributed based on priority.
Basic Coordination Alternative: Lake Powell releases would range from 7 to 9.5 maf annually, based on the reservoir’s surface level, and releases from upper basin reservoirs would be implemented to protect Glen Canyon Dam’s infrastructure. Lower Basin shortages (and cuts) would be based on Lake Mead elevations and would be distributed based on water right priority (meaning Arizona gets cut before California).
Enhanced Coordination Alternative: Lake Powell annual releases would range from 4.7 maf to 10.8 maf, based on: a combination of Powell and Mead elevations; the 1-year running average hydrology; and Lower Basin deliveries. The Upper Basin would implement conservation measures to bolster Lake Powell levels if needed, and the Lower Basin shortages would range from 1.3 maf (when Mead and Powell, combined, are 60% full) to 3.0 maf (when Mead and Powell are 30% full or lower) annually. The Lower Basin shortages would be distributed proportionally, meaning that California — which has the largest allocation — would take 49% of the cuts, Arizona 31%, Nevada 3.3%, and Mexico 17%.
Maximum Operational Flexibility Alternative: Lake Powell annual releases would range from 5 maf to 11 maf, based on total Upper Basin system storage and recent hydrology. But when Lake Powell’s surface level drops to 3,510 feet, Glen Canyon Dam would be operated as a “run of the river” facility, meaning that it would release only as much as what it running into the reservoir minus evaporation and seepage to keep the elevation from dropping further. Lower Basin shortages would be on a sliding scale, starting when Powell and Mead drop below 80% full, reaching 1 maf when the two reservoirs are 60% full. When the reservoirs drop below 60%, then shortages would be determined by the previous 3-year flows at Lee Ferry, topping out at a maximum shortage of 4 maf. Shortages would be distributed according to priority and proportionally.
Supply Driven Alternative: This one is based on the amount of water that is actually in the river (go figure!). Lake Powell releases would range from 4.7 maf annually to 12 maf, or about 65% of the 3-year natural flows at Lees Ferry. Lower Basin shortages would kick in when Lake Mead’s surface elevation drops below 1,145 feet, reaching a maximum of 2.1 maf at 1,000 feet and lower. (As of Jan. 12, Mead’s level was 1,063 feet). Shortages would be distributed according to priority and proportionally.
The estimated “natural flow” at Lee Ferry. Some of the alternatives would base Lake Powell releases on recent average natural flows at Lee Ferry. If the recent past is an indicator of what’s to come, we could expect a relatively minuscule amount of water running through the Grand Canyon to the Lower Basin states. Source: Bureau of Reclamation.
The Lower Basin states reportedly aren’t too happy about any of the alternatives, because they put most of the onus for cutting consumption on the Lower Basin. Under the Maximum Flexibility option, for example, Lower Basin shortages could go as high as 4 million acre-feet, or about half of those states’ total annual consumptive use. And under another, California alone could have to cut up to 1.5 million acre-feet of water use, which could trigger litigation, since California users have some of the most senior rights on the river. Some of the alternatives would potentially nullify the Colorado Compact’s clause ordering the Upper Basin to “not cause the flow of the river at Lee Ferry to be depleted below an aggregate of 75 maf for any period of ten consecutive years.”
The Bureau does not pick a “preferred” alternative, like federal agencies typically do with environmental impact statements, leaving readers guessing about which option or combination of options might be chosen should the need arise. But it also gives more room for the states to reach some sort of agreement to pick an option from the provided list.
* It is found in the Hydrologic Resources section: “While the flows in the Colorado River would not affect groundwater in the region, changes to the groundwater systems in the Grand Canyon due to climate change may be an additional environmental factor that affects flows in the Colorado River.”
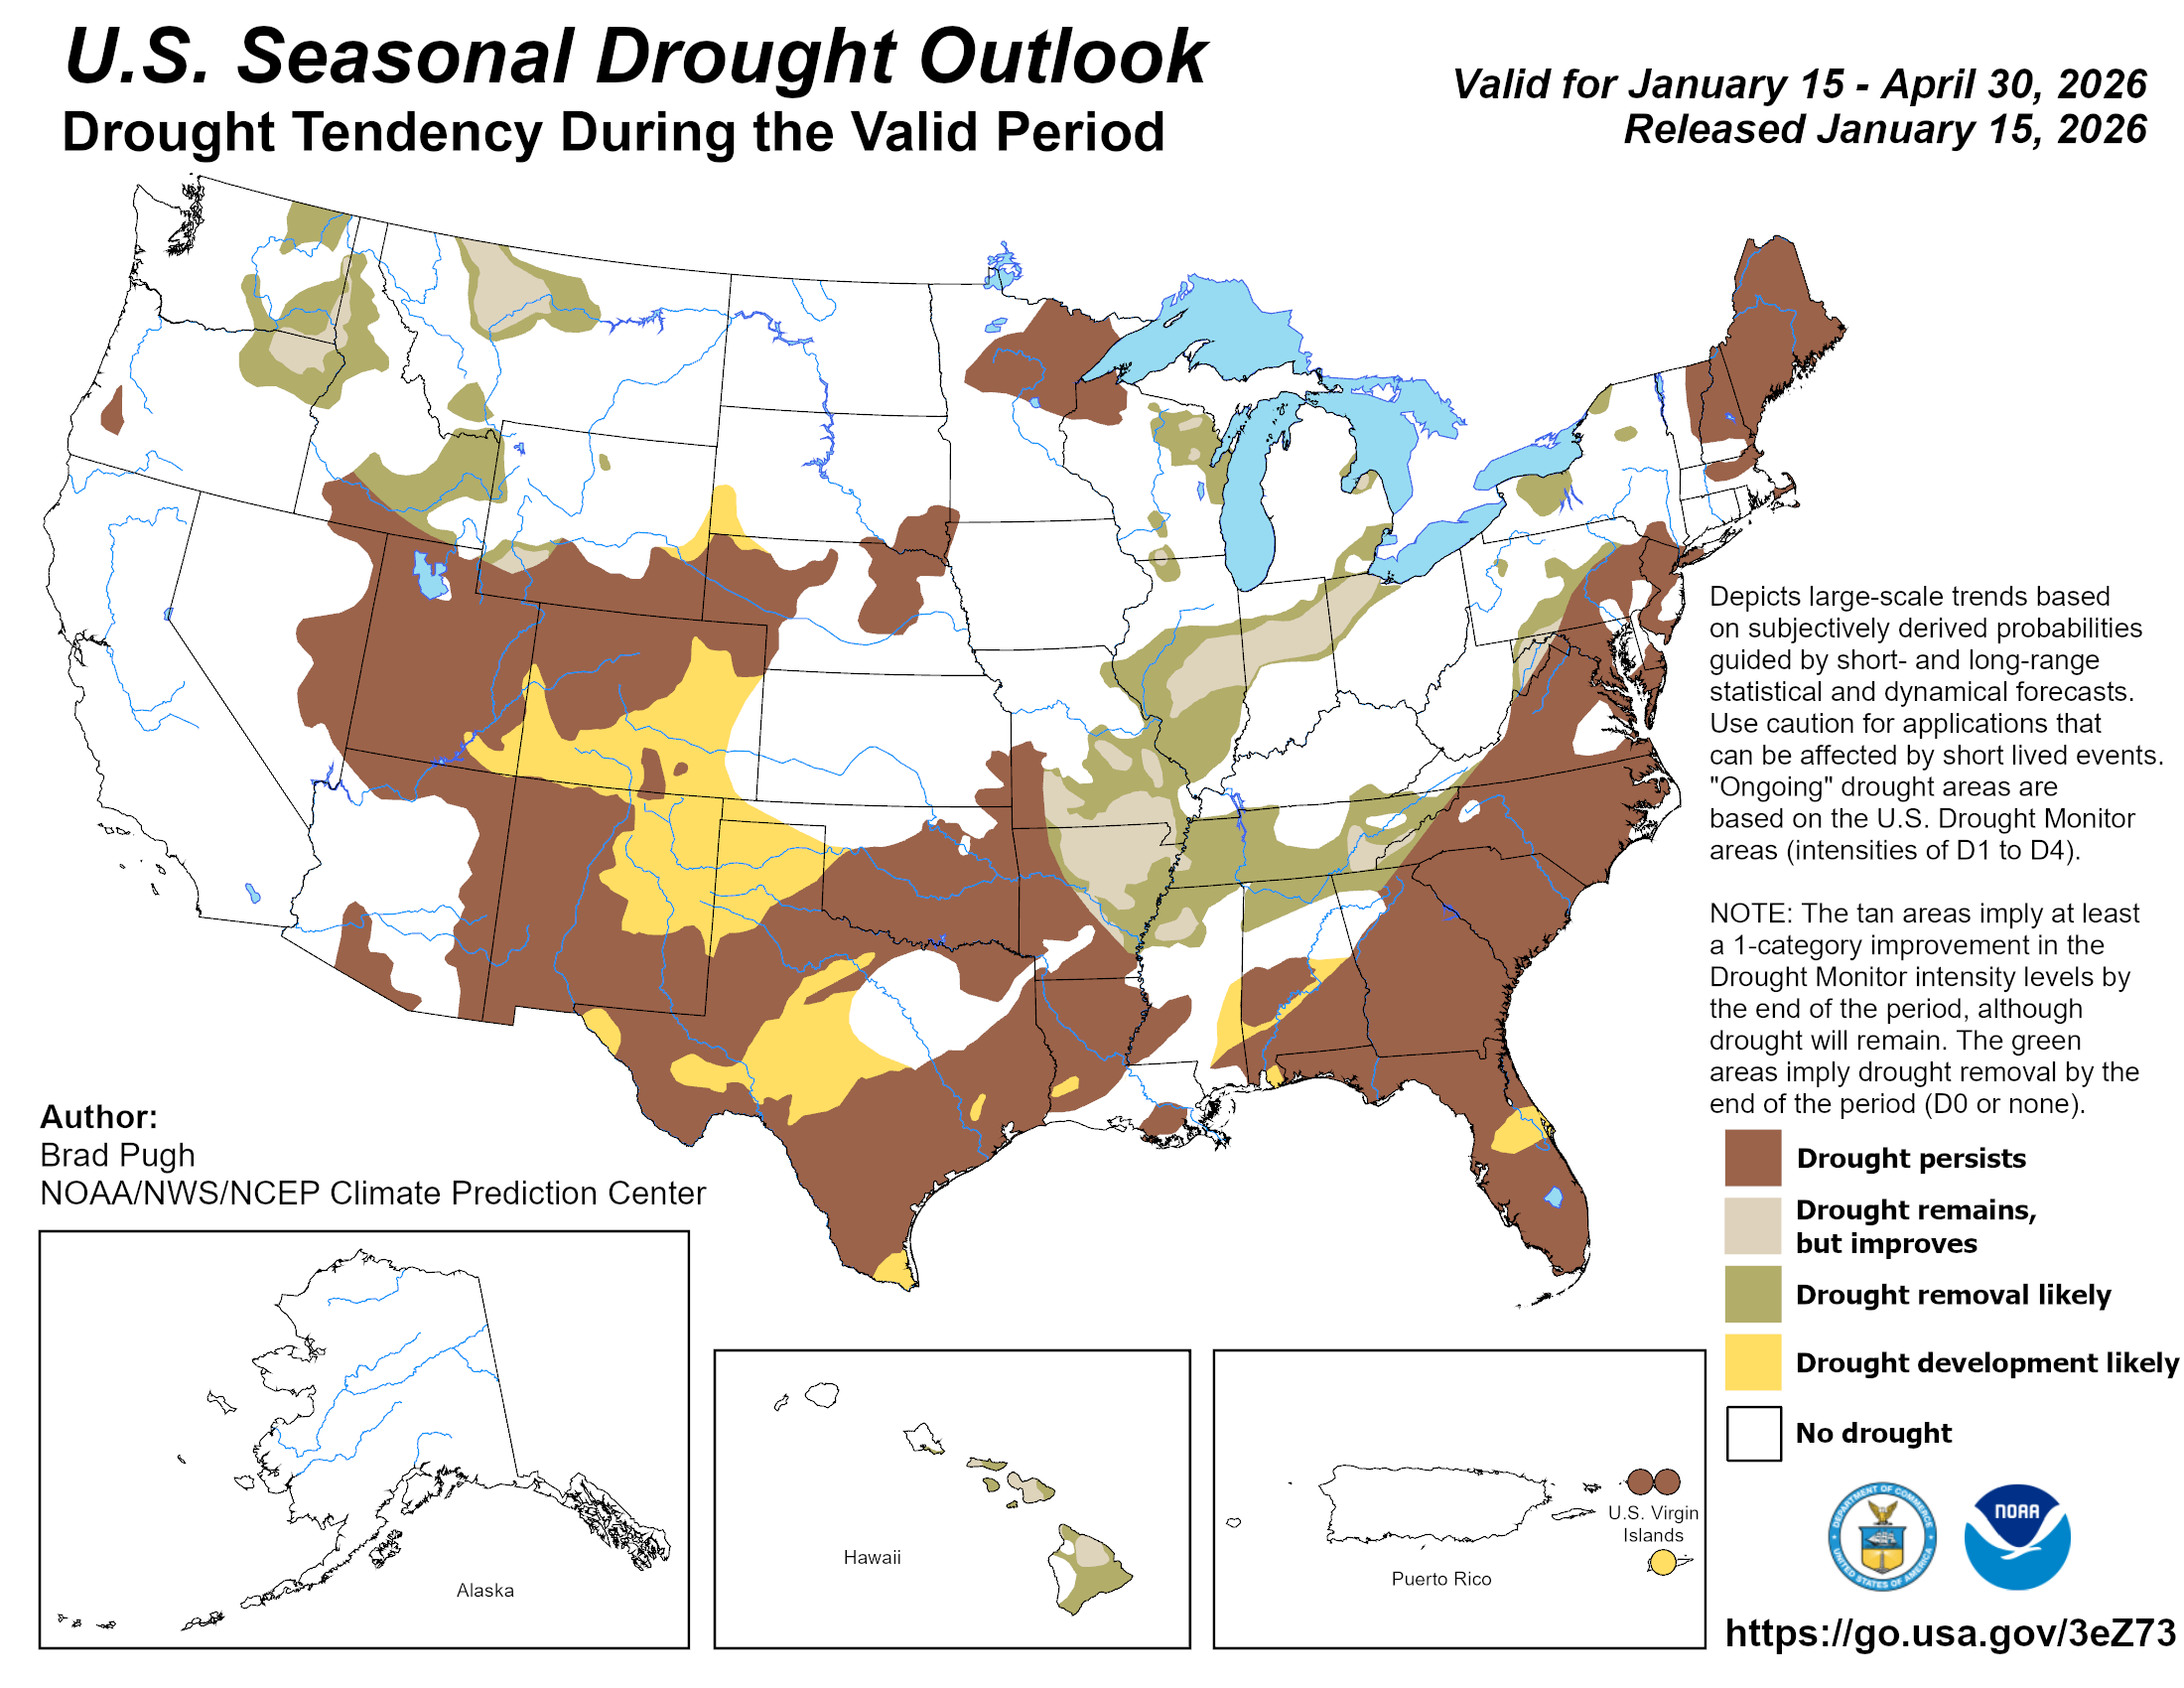
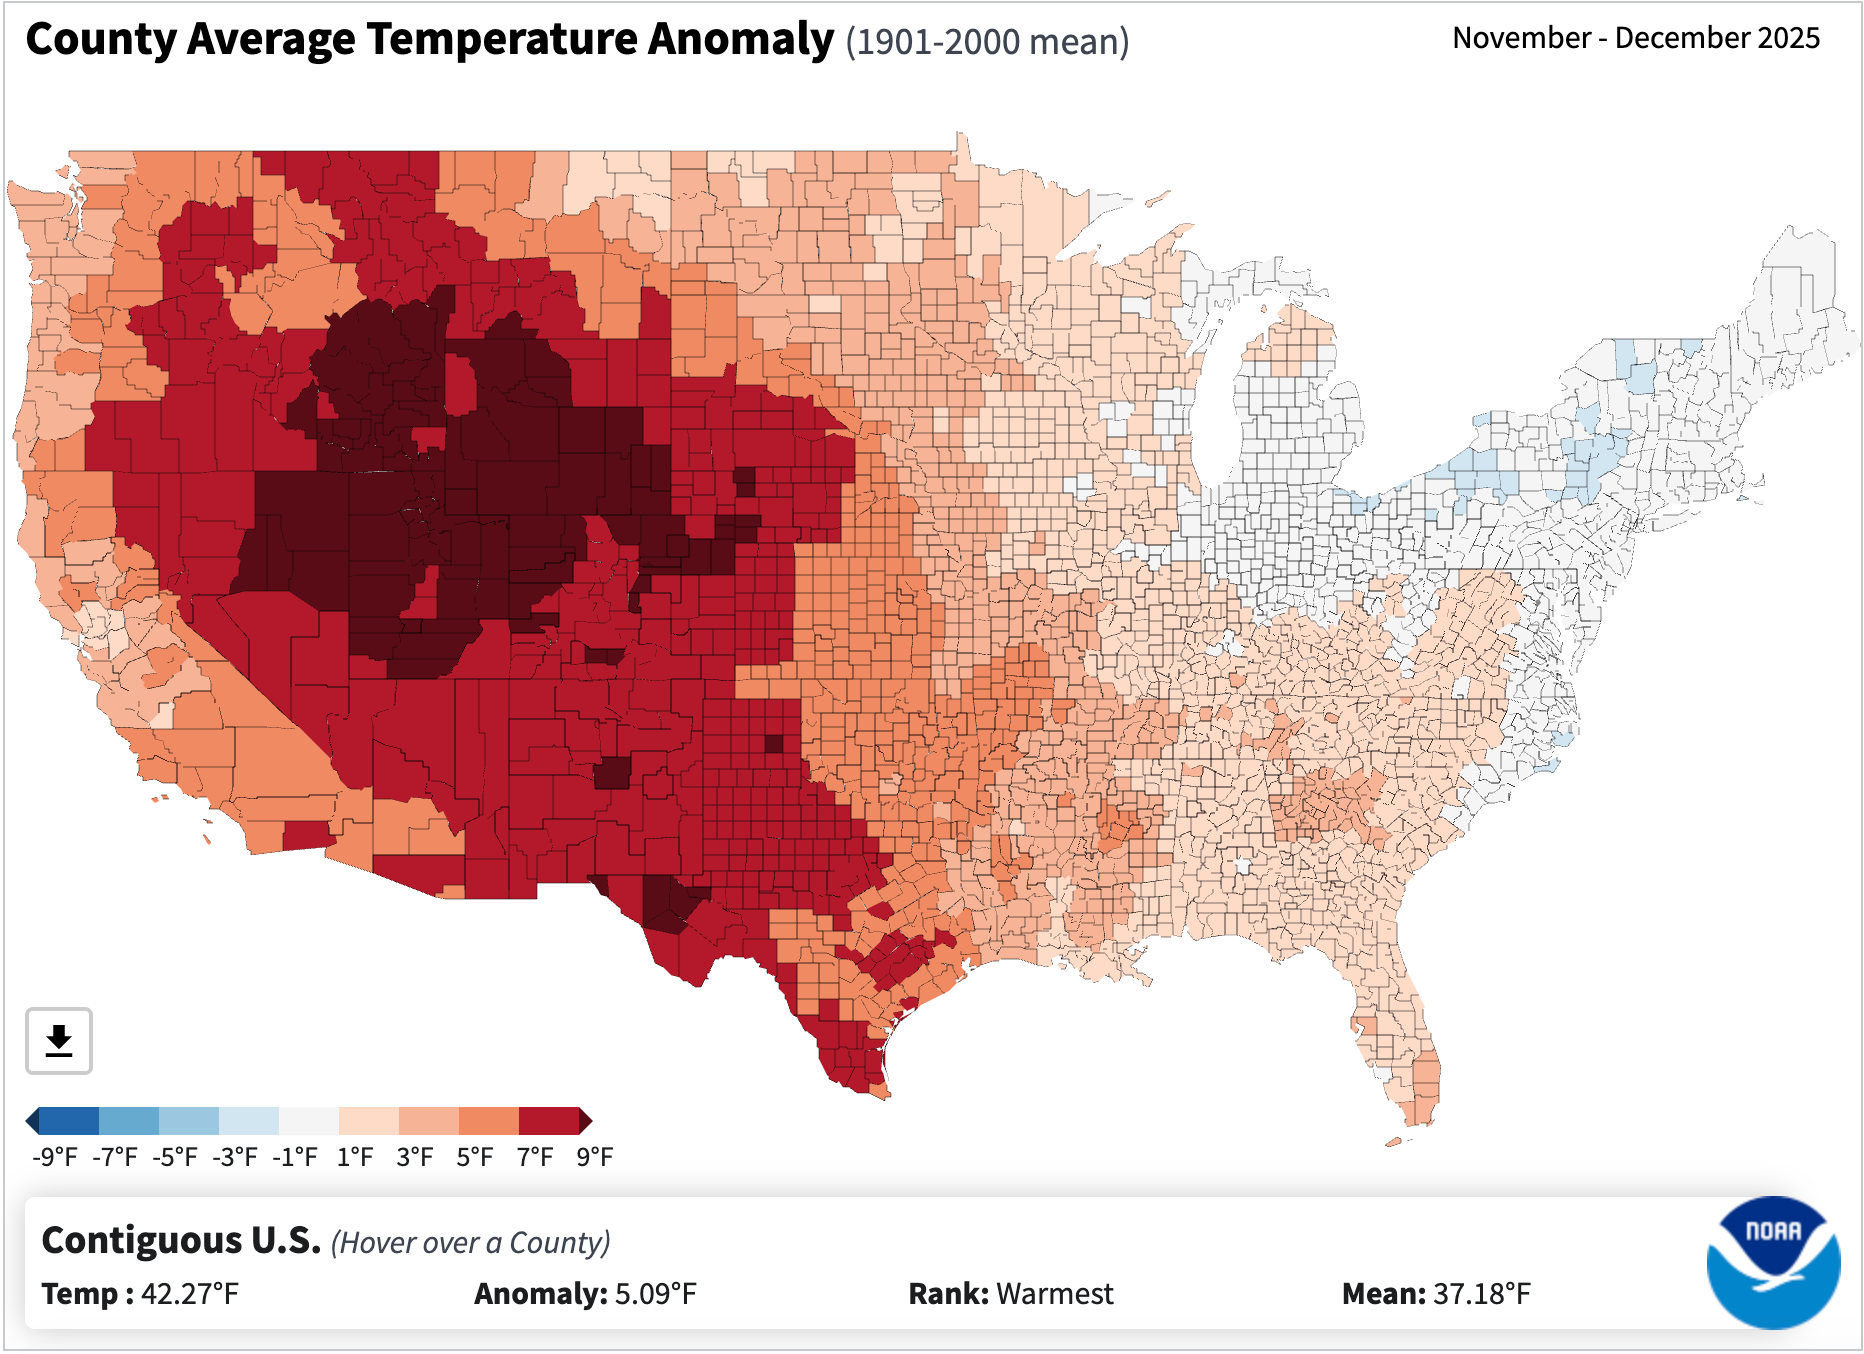
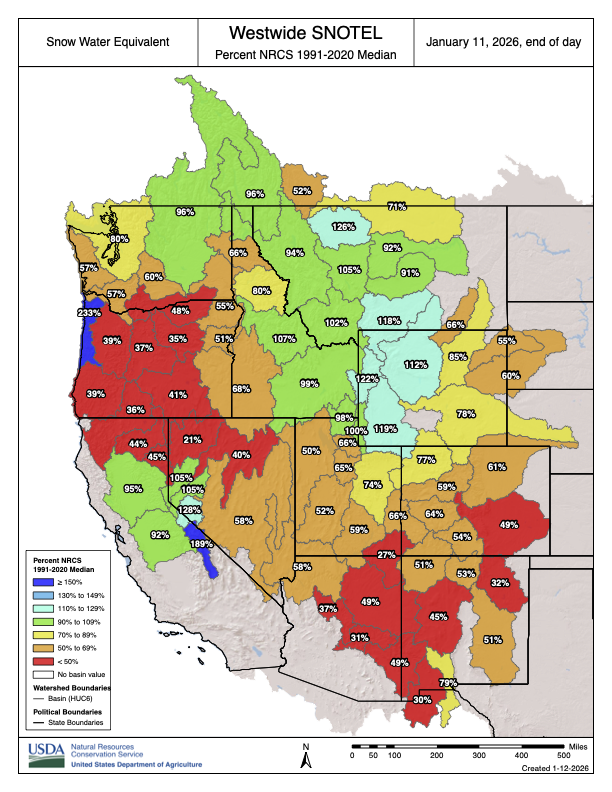
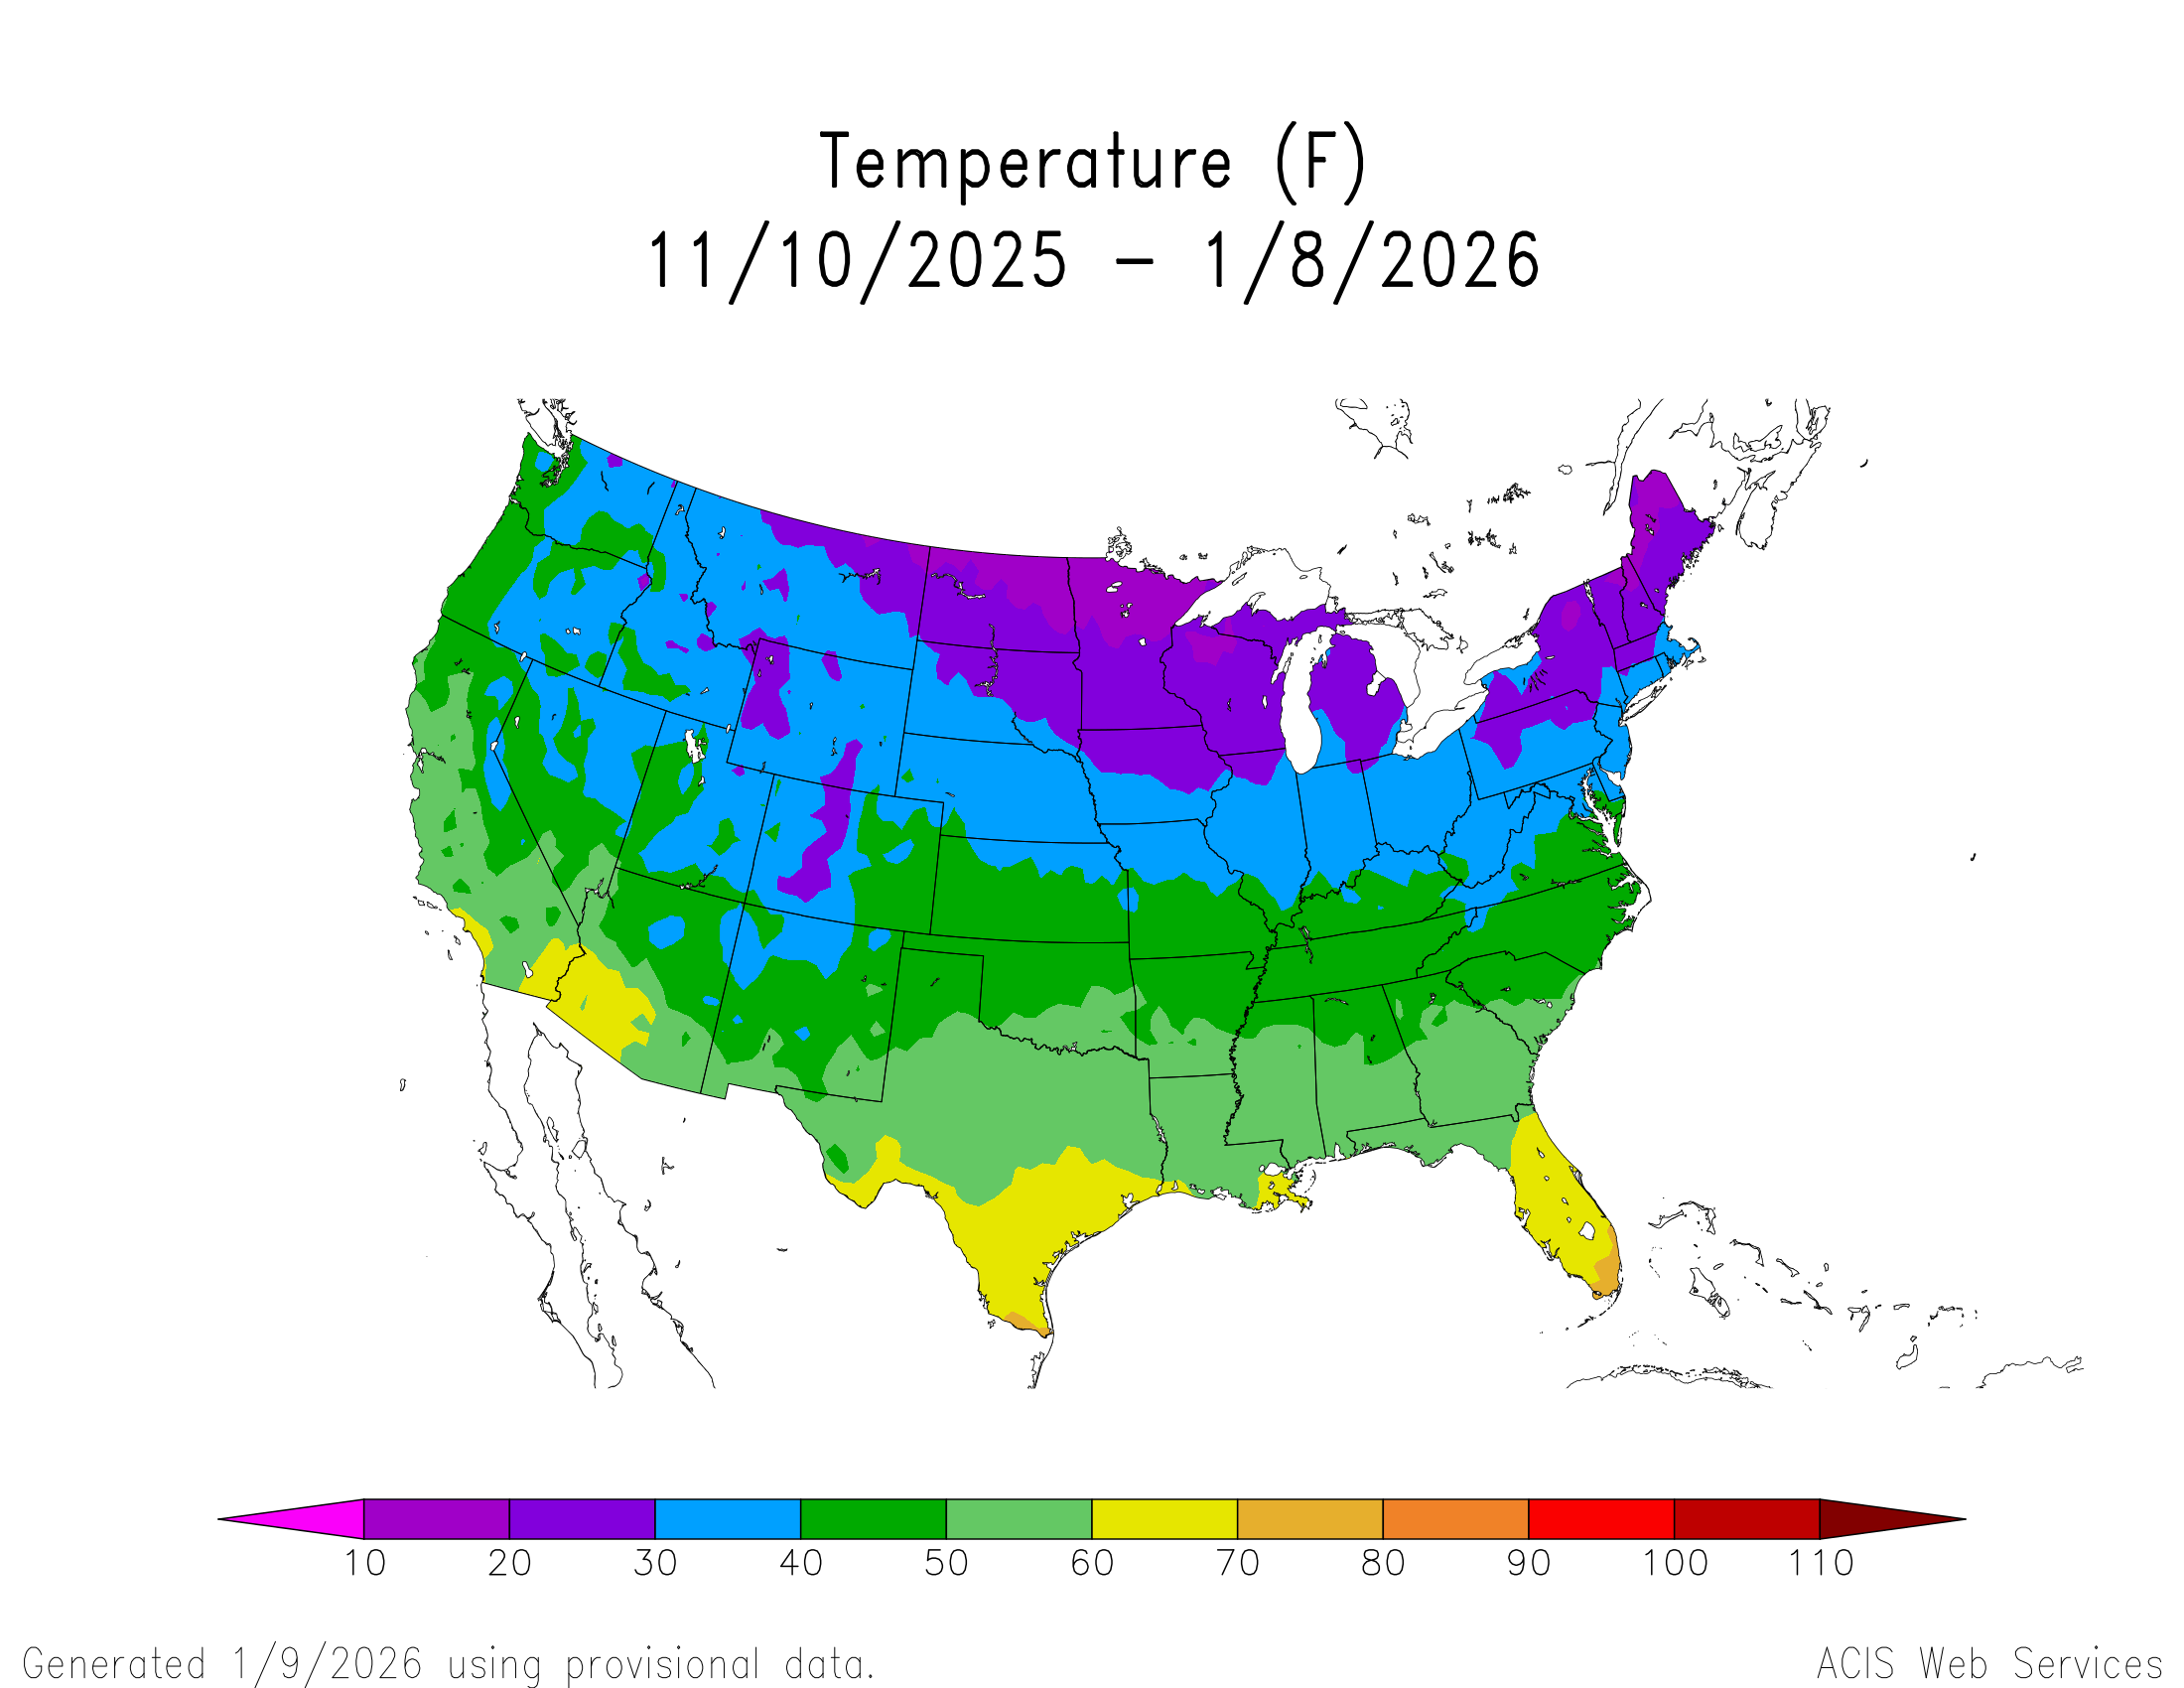
The snowpack remains dismal in most of the West, and it’s not just because of lack of precipitation. In fact, it’s probably more due to the crazy-warm temperatures. The average temperatures across the Interior were way above normal in November and December, as the map below shows. And January’s similarly unseasonably balmy so far. Yikes.
Precipitation levels were mixed across the West during late autumn and early winter, but temperatures were warmer than normal across the entire region, diminishing snowpack and leading to rather unwintery conditions. Source: NOAA.
🌵 Public Lands 🌲
Last week the new public lands media outlet, RE:PUBLIC, warned readers of “major shrinkage” this year. They meant, of course, that the Trump administration will probably get around to eliminating or eviscerating at least one national monument in the next twelve months. It’s probably a pretty safe bet, given that in Trump’s first term he shrank Bears Ears and Grand Staircase-Escalante national monuments, and Project 2025, which the administration has hewn closely to, calls for even more reductions.
Indeed, I’m surprised they haven’t already moved to eliminate some of these protected areas, especially the more recently designated ones like Bears Ears, Baaj Nwaavjo I’tah Kukveni-Ancestral Footprints of the Grand Canyon National Monument, or Chuckwalla National Monument in California. An optimist might hope that the Trump administration has realized how deeply unpopular this would be, or has come to terms with the fact that the Antiquities Act only allows presidents to establish national monuments, not eliminate them. But I think it’s more likely they were simply too busy dismantling other environmental safeguards — and, for that matter, democracy — to get around to diminishing national monuments.
I was a little surprised by RE:PUBLIC’s list of vulnerable national monuments, however. It included Bears Ears et al, which makes sense, but then also speculates about other “likely targets, due to their proximity to energy and mining interests,” including: Aztec Ruins, Dinosaur, Hovenweep, and Natural Bridges national monuments.
I hate trying to predict what the Trump administration will do in the future, but I’m going to go out on a limb here and say that these particular national monuments are not in the administration’s crosshairs. While these protected areas are close to energy-producing areas, and probably have some oil and gas, uranium, lithium, and/or potash producing potential, they simply offer too little to the extractive industries to make it worth the political blowback from eviscerating them.
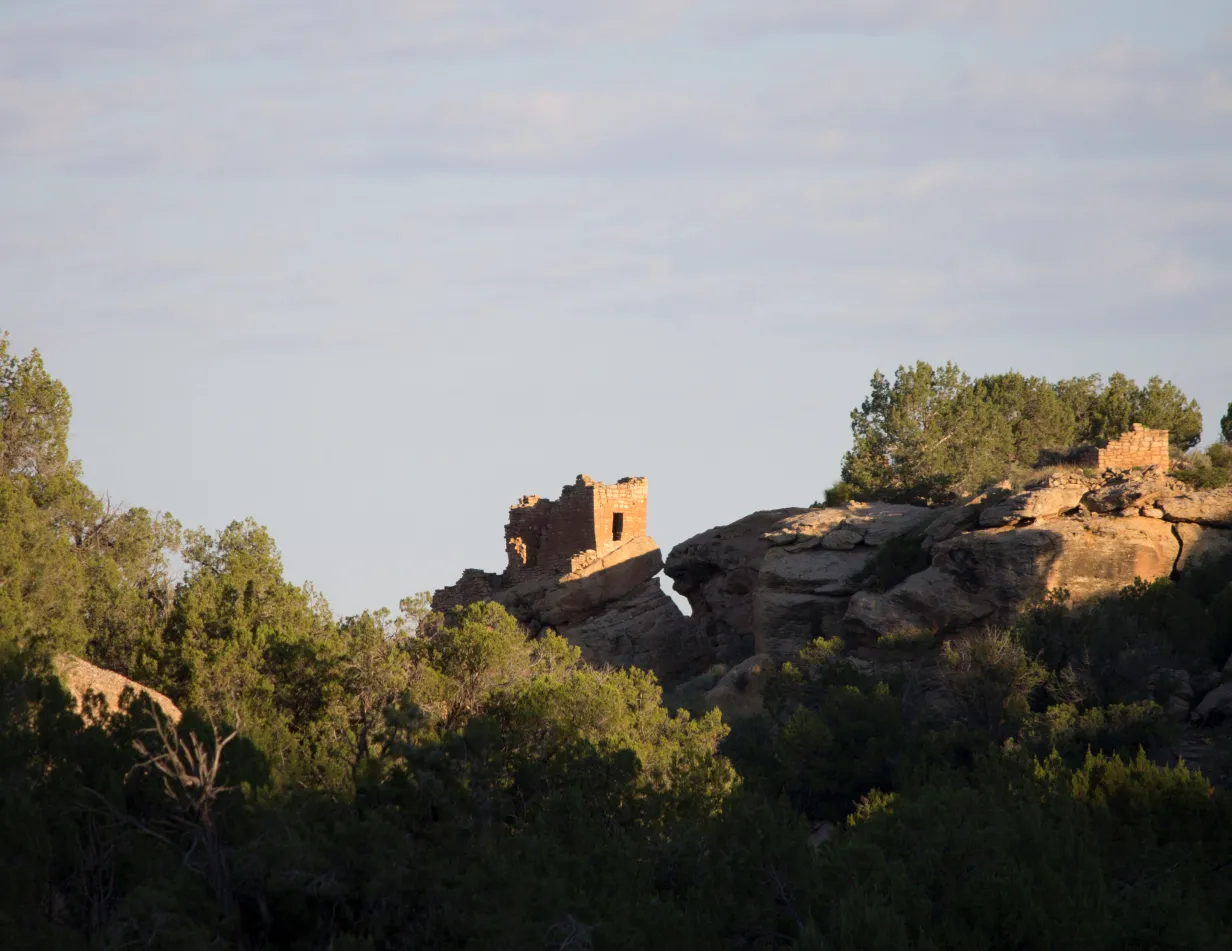
Hovenweep National Monument. Jonathan P. Thompson photo
For those who may be unfamiliar with these places, I’ll take each one individually:
Aztec Ruins: First off, this tiny national monument adjacent to the residential neighborhoods of Aztec, New Mexico, is an amazing place and well worth the visit. The Puebloan structures here are built in the style of Chacoan great houses, and the community — which was established at the end of Chaco’s heyday — may have been become succeeded Chaco as a regional cultural and political center. It is in the San Juan Basin coalbed methane fields and is surrounded by gas wells. In fact, there are a few existing, active wells within the monument boundaries. But no one is champing at the bit to drill any new wells in this region, and they certainly don’t need to do so in this tiny monument.
Dinosaur National Monument, in northwestern Colorado, is probably somewhat vulnerable, given its size and proximity to oil and gas fields. But again, there’s not a whole lot of new drilling going on in the area. It was established in 1915 to protect dinosaur quarries — clearly in tune with the Antiquities Act — so shrinking it would be met with serious bipartisan political pushback.
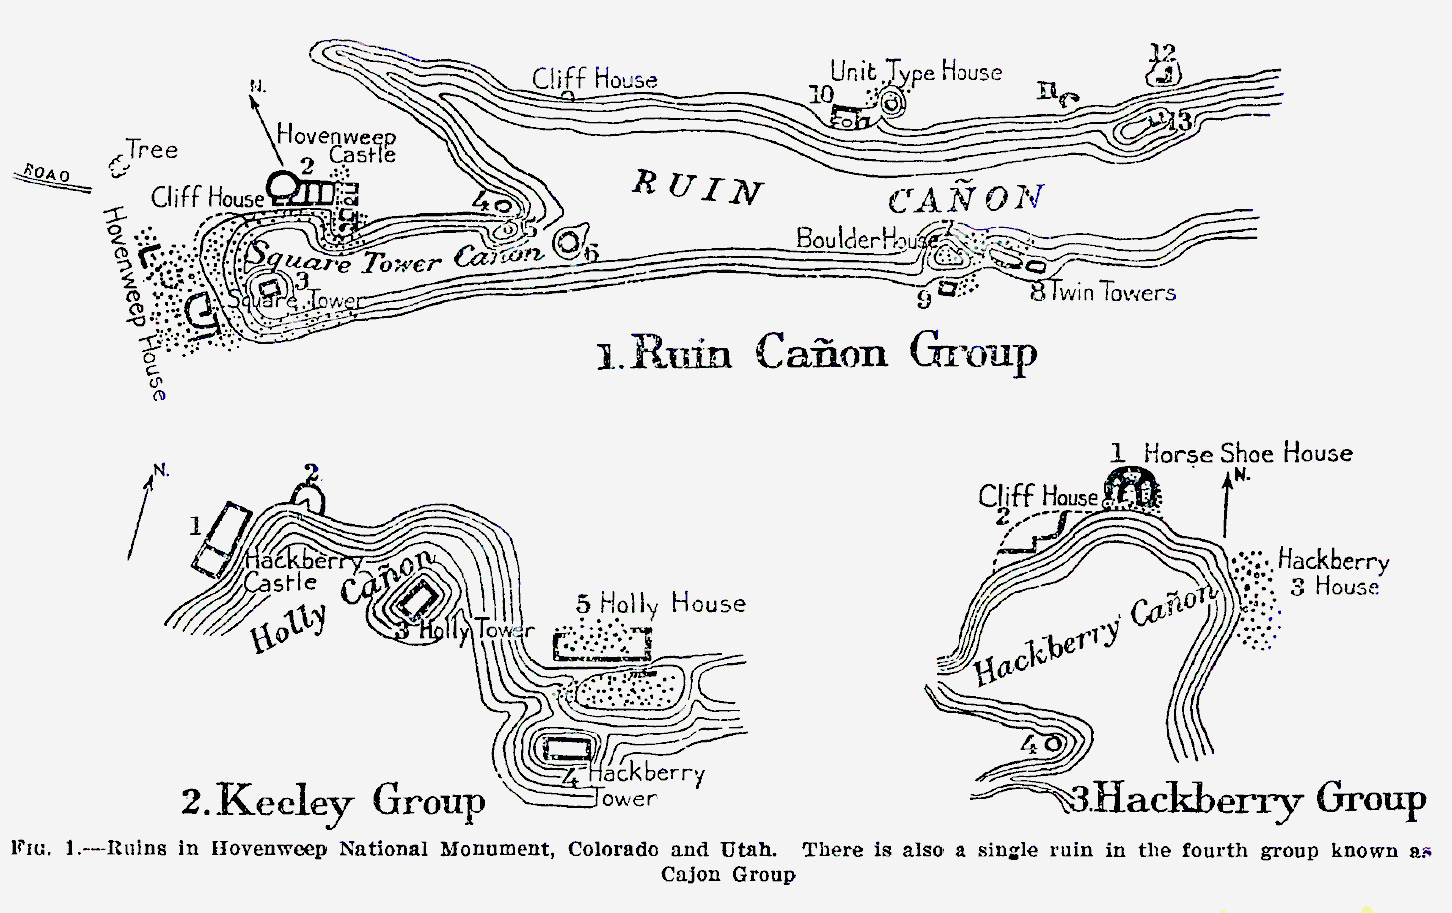
When Warren G. Harding designated Hovenweep National Monument in 1923 to protect six clusters of Puebloan structures in southeastern Utah from development and pothunters, he strictly followed the Antiquities Act’s mandate to confine its boundaries to “the smallest area compatible with proper care and management of the objects to be protected.” As such, the boundaries of each “unit” is basically drawn right around the pueblo and a small area of surroundings, leaving little room for shrinkage. Though it lies on the edge of the historically productive Aneth Oil Field, oil and gas drillers have no need to get inside the boundaries to get at the hydrocarbons. Besides, Trump and Harding have a lot in common, so Trump’s not likely to want to erase his predecessor’s legacy.
Natural Bridges: It’s odd to me that this one, which is currently surrounded by Bears Ears National Monument, is included on this list. Yes, there are historic uranium mines nearby, and yes, White Canyon, where the monument’s namesake formations are located, was once considered for tar sands and oil shale development. But the small monument itself — which was designated by Teddy Roosevelt in 1908 — is not getting in the way of any of this sort of development. It’s much more likely that Trump would remove the White Canyon area from Bears Ears National Monument, as he did during his first term, potentially opening the area around Natural Bridges back up to new uranium mining claims, while leaving the national monument’s current boundaries intact.
So, in summary: Don’t fret too much about these national monuments getting eliminated or shrunk anytime soon. And for now, maybe we shouldn’t worry about any national monument shrinkage. It is possible that Trump won’t go there this term. Trump shrunk Bears Ears and Grand Staircase-Escalante during his first term in part out of spite toward Obama and Clinton, but also to get then-Sen. Orrin Hatch’s legislative support. That the shrinkage also re-opened some public lands to new mining claims and drilling was a secondary motivation.
This time around, Trump has come up with far more generous gifts for the mining and drilling companies, and much more sinister ways to attack his political adversaries. Besides, he’s got his eyes on much bigger prizes — like Greenland.
1 * The single use of the term “climate change” is found in the Hydrologic Resources section: “While the flows in the Colorado River would not affect groundwater in the region, changes to the groundwater systems in the Grand Canyon due to climate change may be an additional environmental factor that affects flows in the Colorado River.”
Map of the Colorado River drainage basin, created using USGS data. By Shannon1 Creative Commons Attribution-Share Alike 4.0
The Government Highline Canal, in Palisade. The Government Highline Canal near Grand Junction. The Grand Valley Water Users Association, which operates the canal, has been experimenting with a program that pays water users to fallow fields and reduce their consumptive use of water. Photo: Brent Gardner-Smith/Aspen Journalism
Click the link to read the article on The Denver Post website (Elise Schmelzer). Here’s an excerpt:
January 15, 2026
Absent a crucial but elusive consensus among the seven Colorado River states, federal authorities are forging ahead with their own ideas on how to divvy up painful water cuts as climate change diminishes flows in the critical river. The Bureau of Reclamation last week made public a 1,600-page behemoth of a document outlining five potential plans for managing the river after current regulations expire at the end of this year. The agency did not identify which proposal it favors, in hopes that the seven states in the river basin will soon come to a consensus that incorporates parts of the five plans. But time is running out. The states — Colorado, Wyoming, Utah, New Mexico, California, Arizona and Nevada — already blew past a Nov. 11 deadline set by federal authorities to announce the concepts of such a plan. They now have until Feb. 14 to present a detailed proposal for the future of the river that makes modern life possible for 40 million people across the Southwest. They were set to meet this week in Salt Lake City to continue negotiations. Federal authorities must finalize a plan by Oct. 1…
“The Department of the Interior is moving forward with this process to ensure environmental compliance is in place so operations can continue without interruption when the current guidelines expire,” Andrea Travnicek, the assistant secretary for water and science at the Department of the Interior, said in a news release announcing the document. “The river and the 40 million people who depend on it cannot wait. In the face of an ongoing severe drought, inaction is not an option.”
A 45-day public comment period opens Friday on the proposed plans for managing the river system, contained in a document called a draft environmental impact statement. The current operating guidelines expire at the end of 2026, but authorities need a replacement plan in place prior to the Oct. 1 start to the 2027 water year. The water year follows the water cycle, beginning as winter snowpack starts to accumulate and ending Sept. 30, as irrigation seasons end and water supplies typically reach their lowest levels…
Udall/Overpeck 4-panel Figure Colorado River temperature/precipitation/natural flows with trend. Lake Mead and Lake Powell storage. Updated through Water Year 2025. Note the tiny points on the annual data so that you can flyspeck the individual years. Credit: Brad Udall
Already, Lake Mead — on the Arizona-Nevada border — and Lake Powell are only 33% and 26% full, respectively. Projections from the Bureau of Reclamation show that, in a worst-case scenario, Powell’s waters could fall below the level required to run the dam’s power turbines by October and remain below the minimum power pool until June 2027. Experts monitoring the yearslong effort to draft new operating guidelines said any plan implemented by Reclamation must consider the reality of a river with far less water than assumed when the original river management agreements were signed more than a century ago.
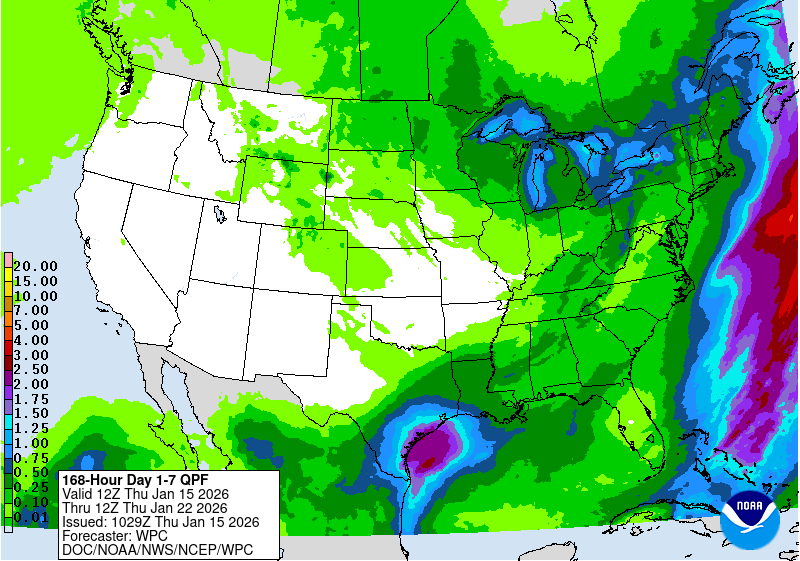
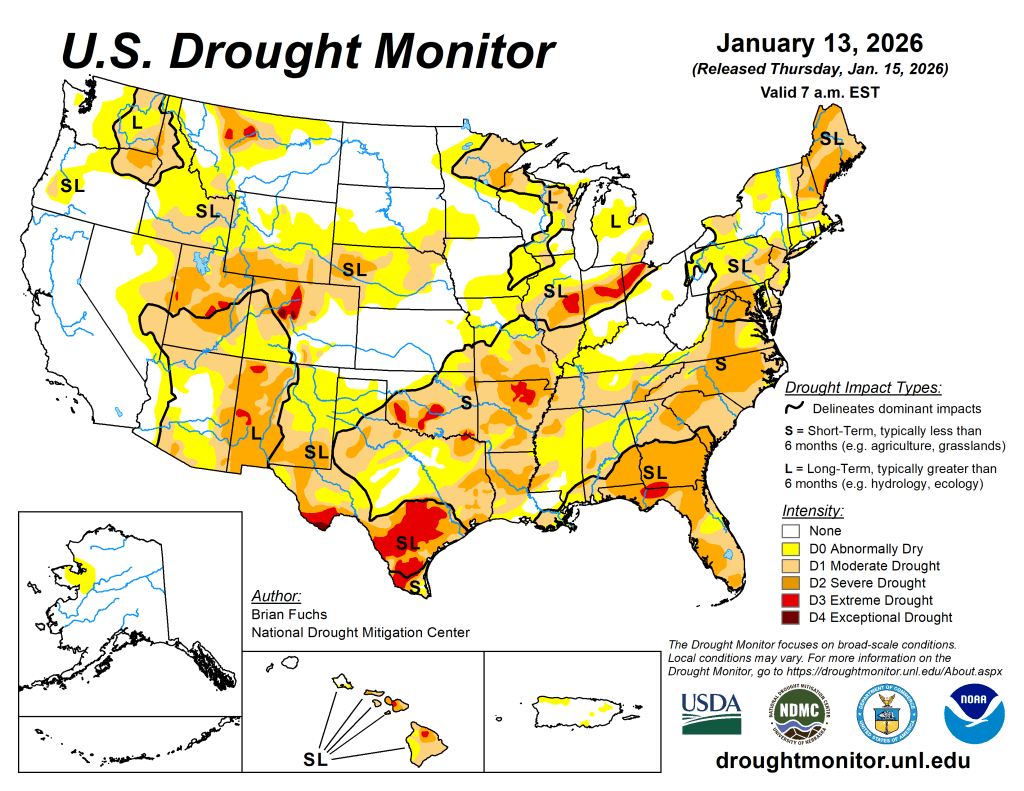
It was a more active week nationwide, with significant precipitation across the central Plains, Midwest, and Southeast. Parts of Mississippi and Alabama received more than 5 inches of rain. In the Plains and Midwest, much of the precipitation fell as rain rather than snow due to unseasonably warm temperatures. Portions of the Southwest and central Rocky Mountains also received beneficial rain and snow, slowing drought intensification and leading to localized improvements. Temperatures were warmer than normal across most of the country, with near- to slightly below-normal temperatures limited to the West and Southwest. The largest departures occurred in the upper Midwest and northern Plains, where temperatures were 15–20°F above normal…
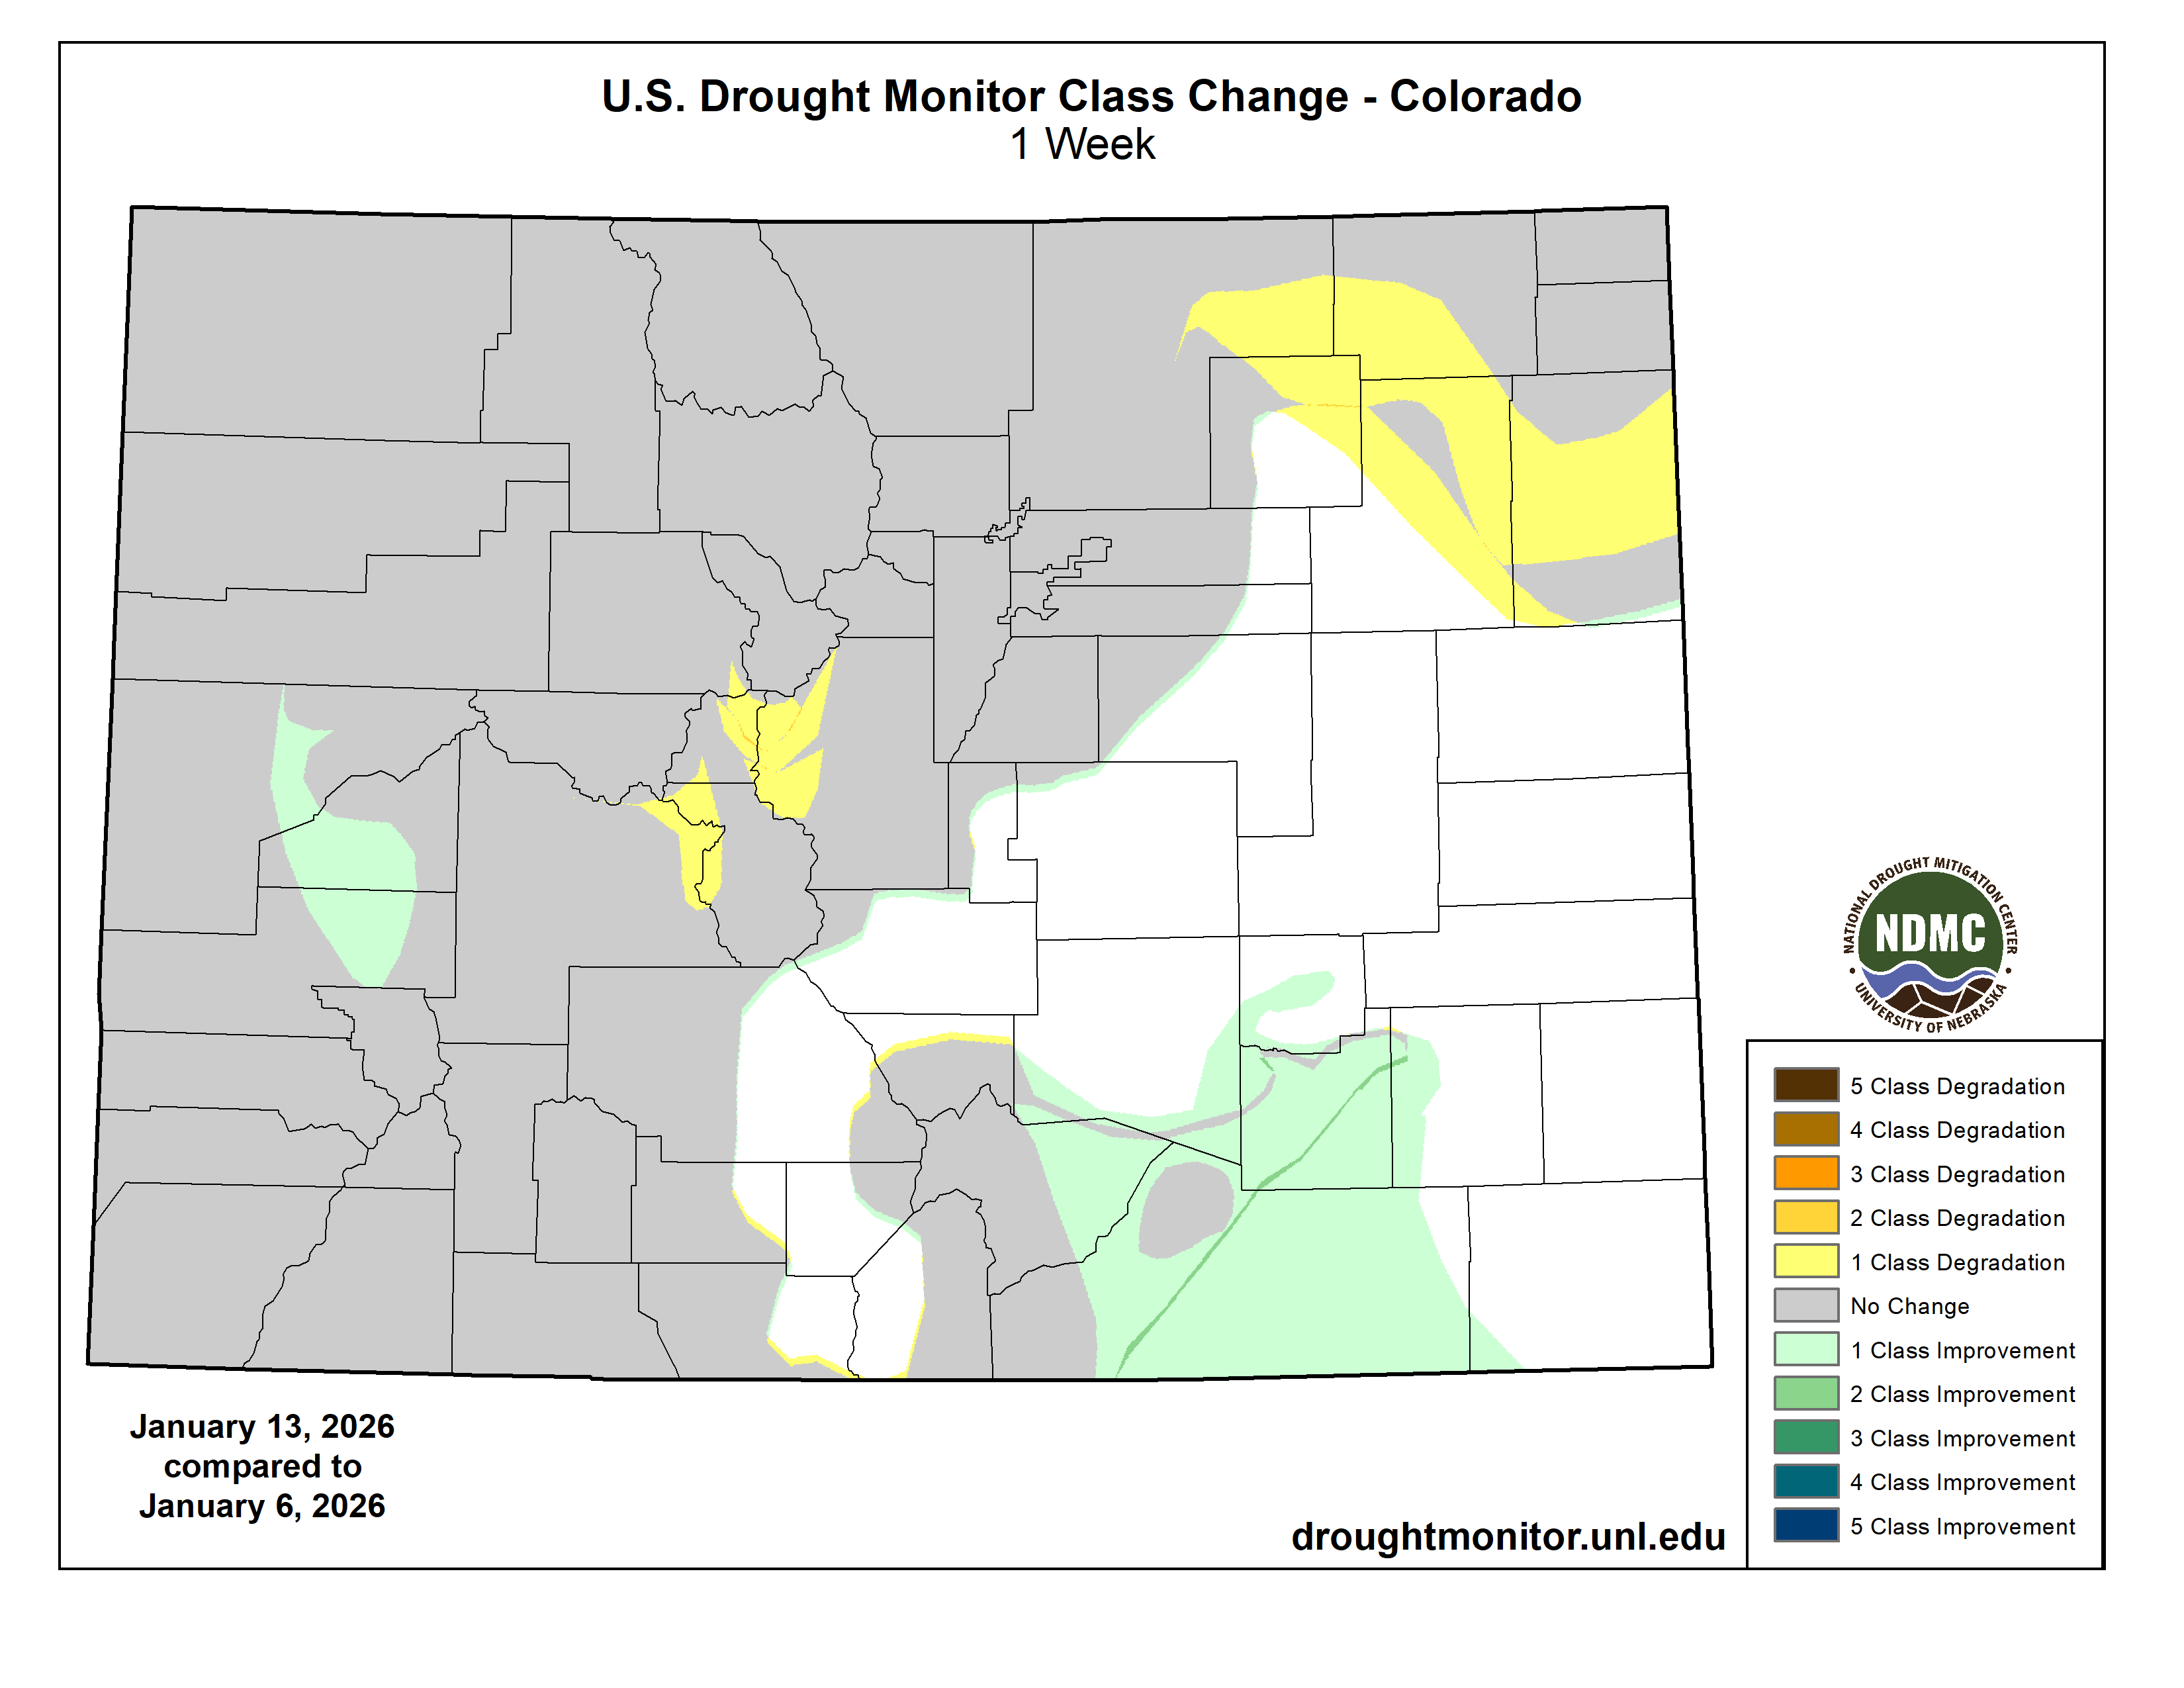
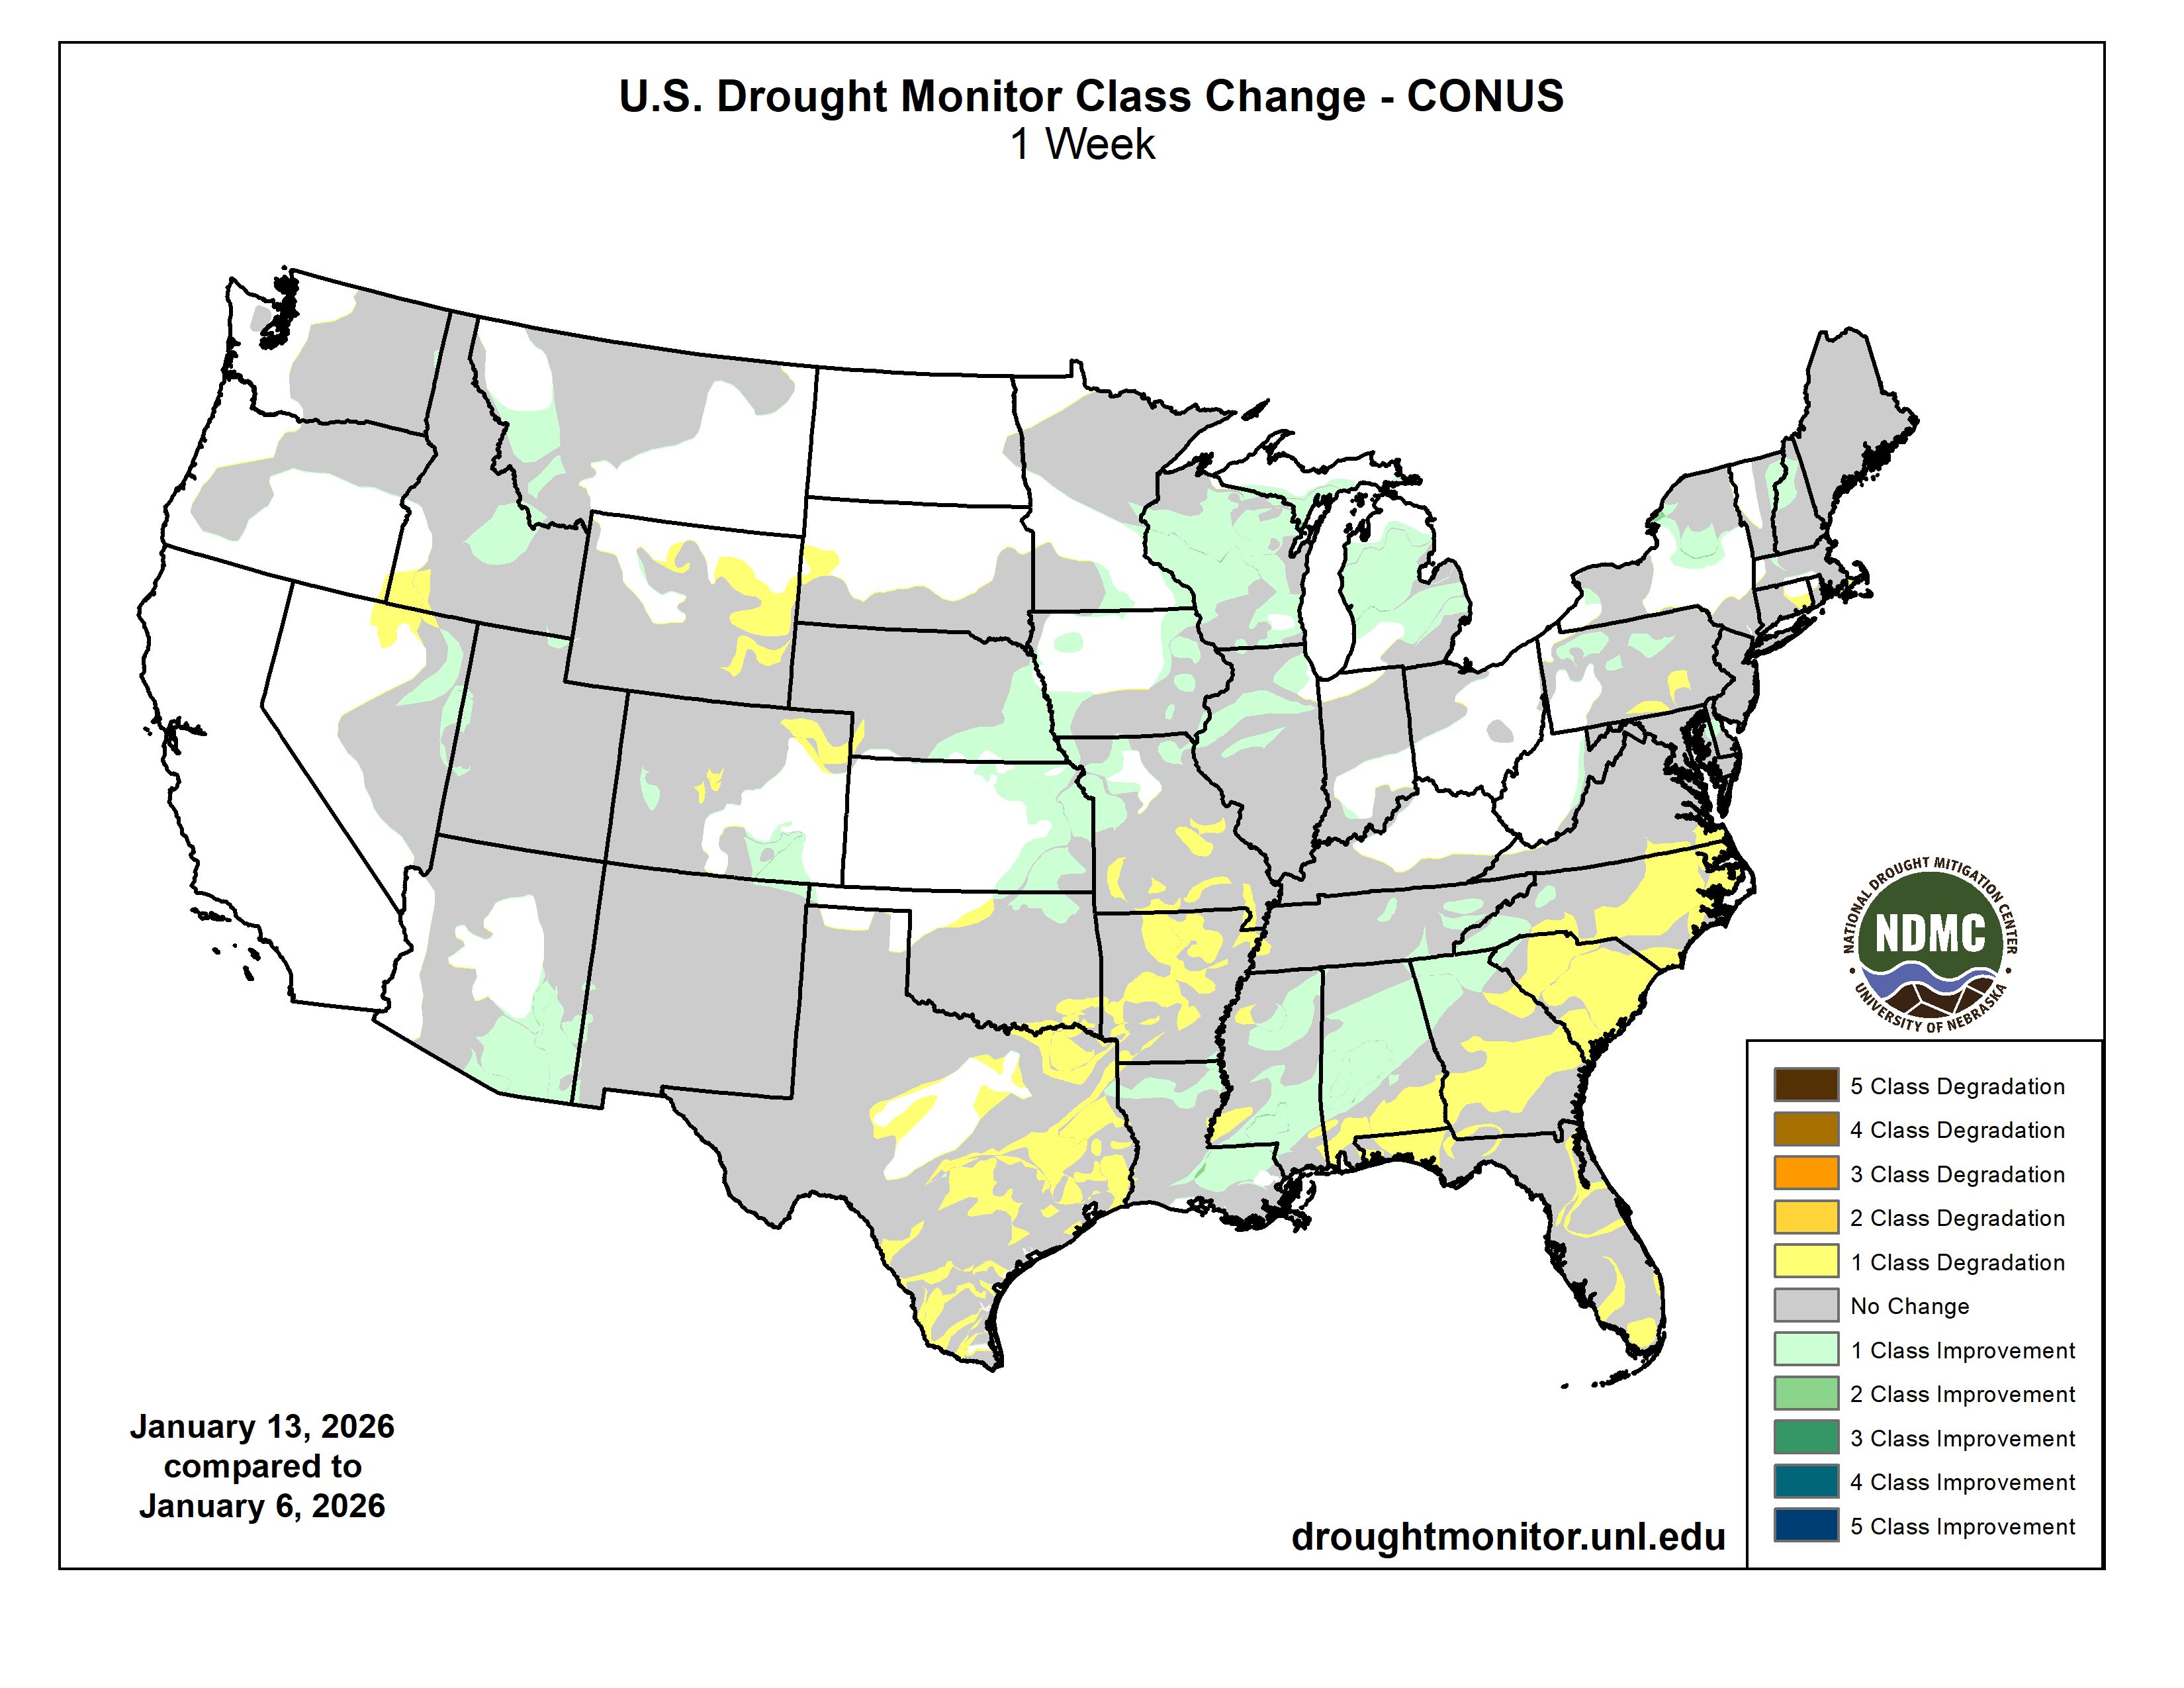
Above-normal precipitation occurred across eastern Colorado, Kansas, and southeast Nebraska, falling primarily as rain and infiltrating soils due to warm temperatures. Much of the rest of the region remained dry. Temperatures were 10–15°F above normal across most areas, with parts of the Dakotas and eastern Montana 15–20°F above normal. Southeast Colorado was the only area near to below normal. Abnormally dry and moderate drought conditions improved in southeast Nebraska, eastern Kansas, and parts of south-central Colorado. Drought expanded across eastern Wyoming, west-central South Dakota, and northeast Colorado…
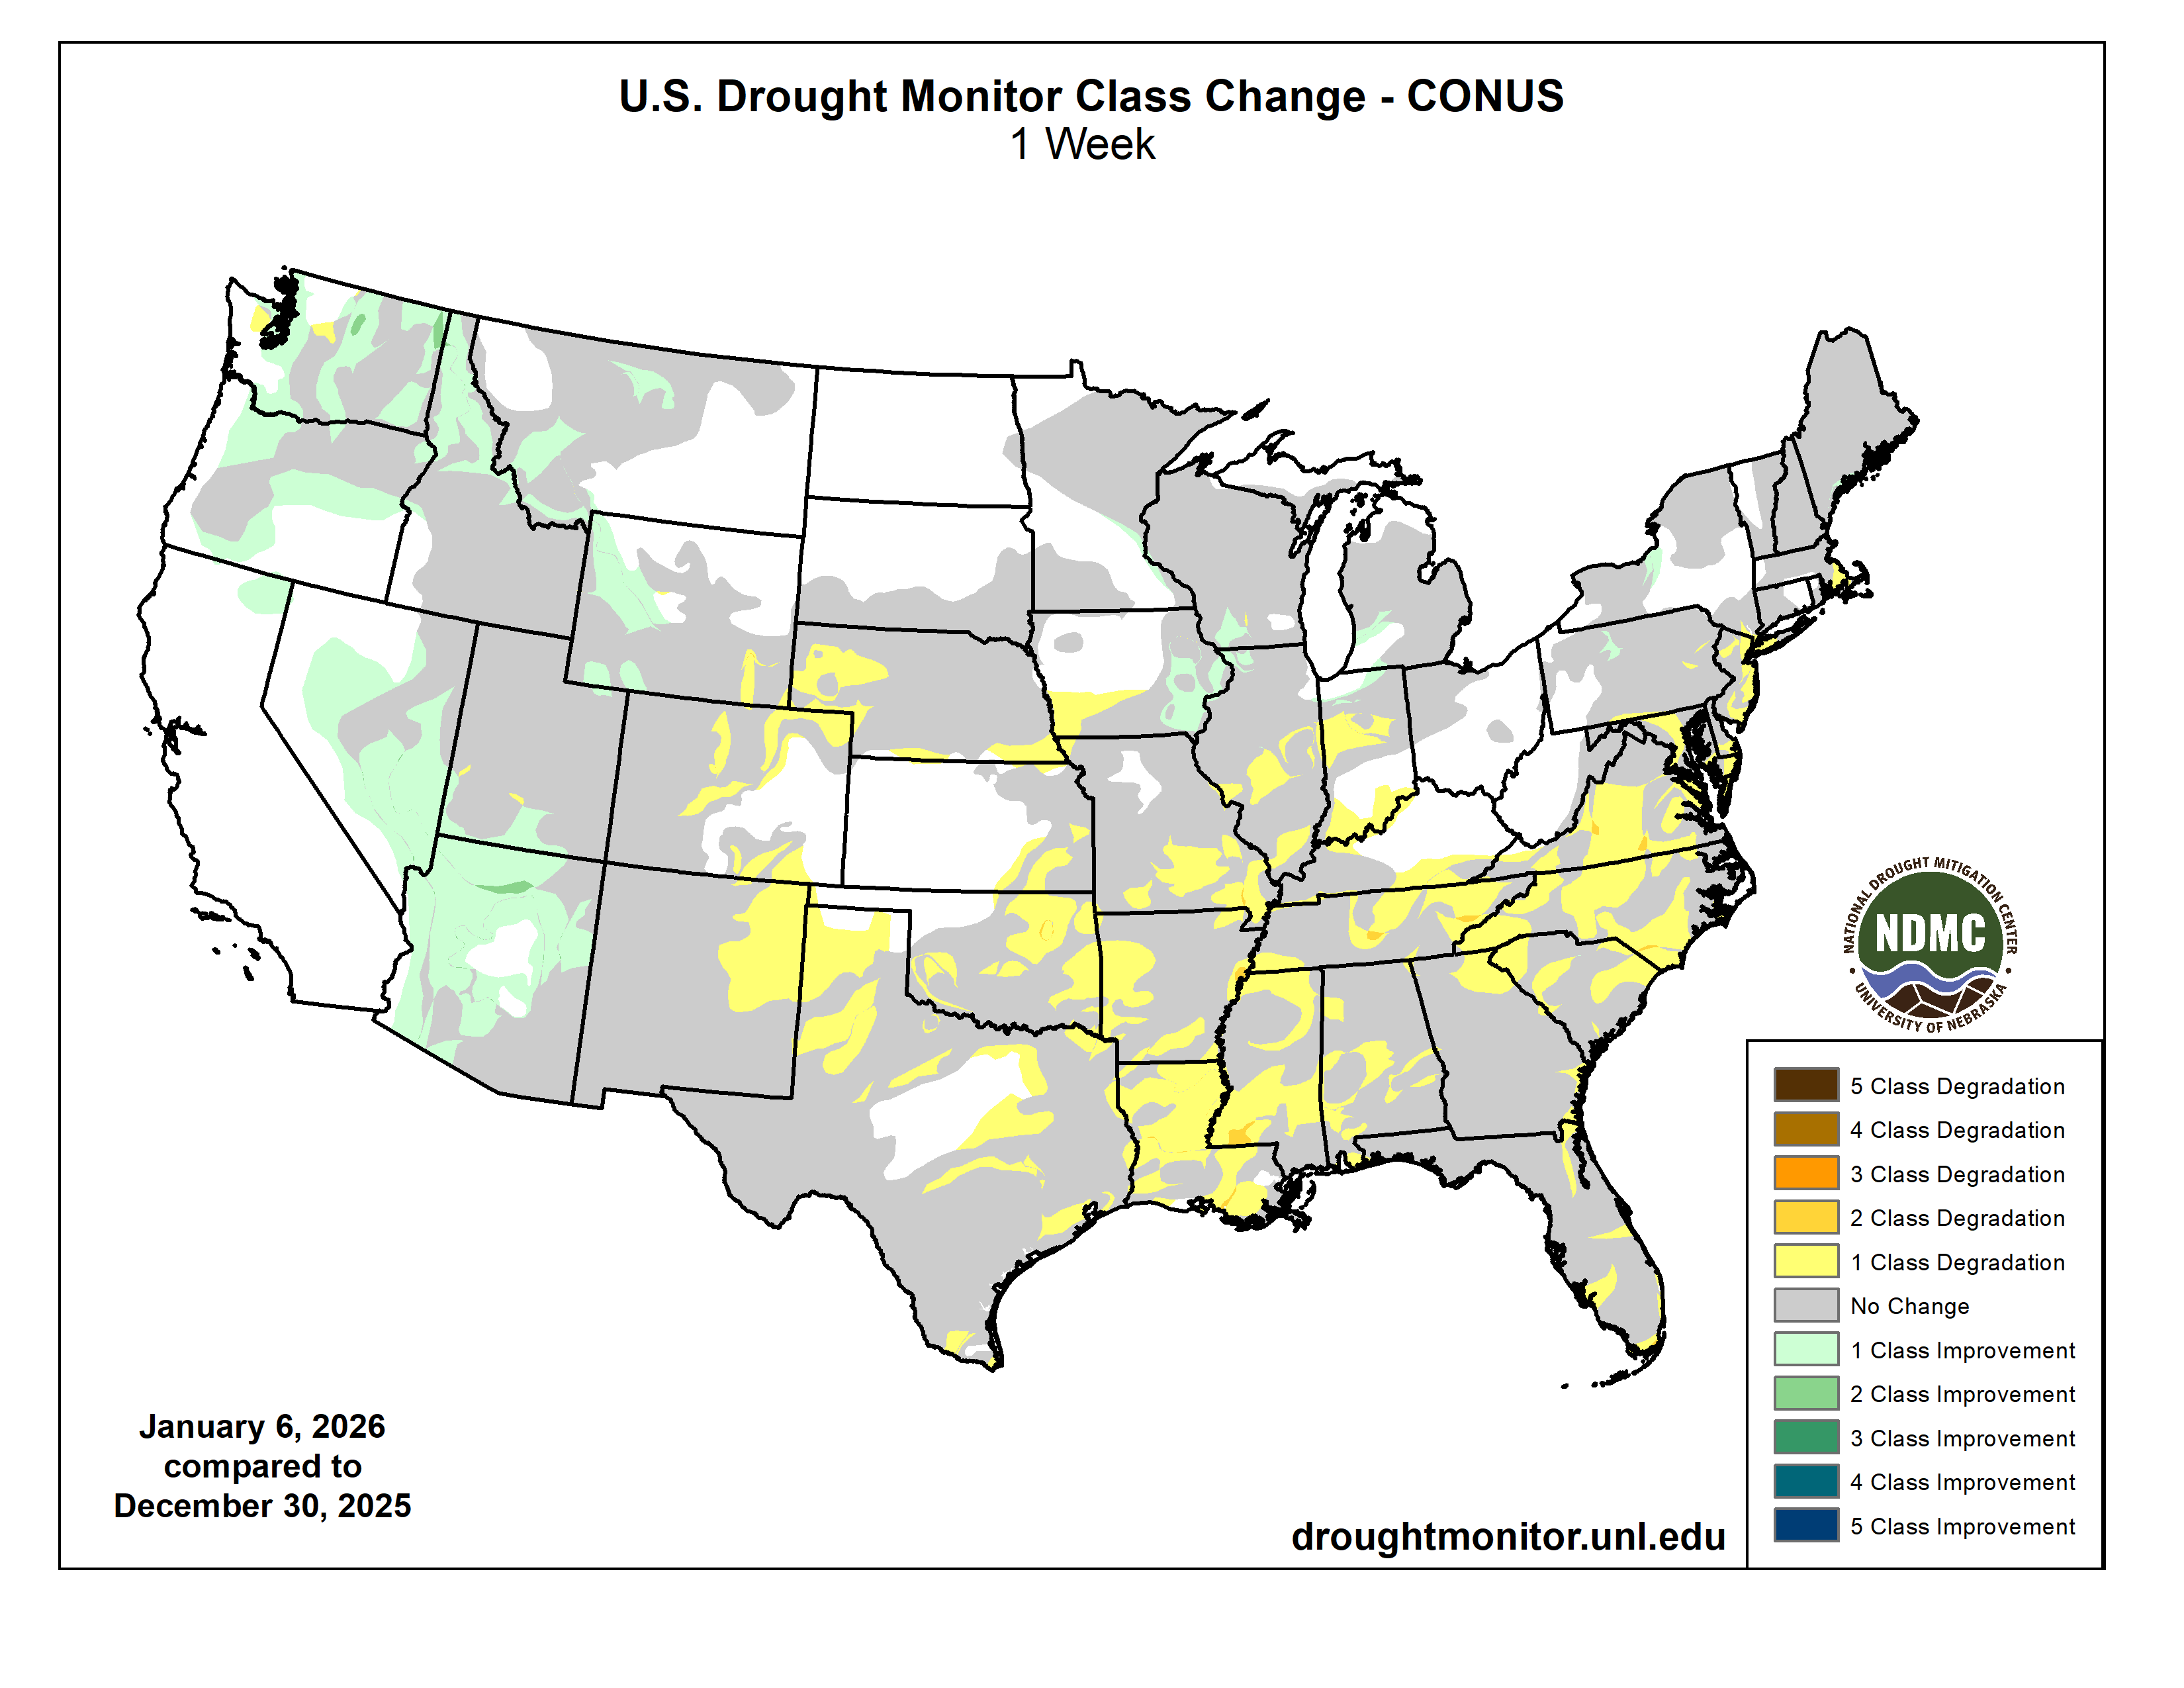
Colorado Drought Monitor one week change map ending January 13, 2026.
Above-normal precipitation occurred across southeast Arizona, western and central New Mexico, parts of Colorado, and western Washington. Temperatures were mixed, with California, Nevada, Utah, Arizona, and New Mexico up to 5°F below normal, while northern areas were 5–10°F above normal and parts of central Montana 15–20°F above normal. Most drought changes reflected improvement, including moderate drought and abnormally dry conditions in western Montana and central Idaho, severe drought in western Colorado, and severe to extreme drought in eastern Arizona, western New Mexico, eastern Nevada, and western Utah. However, drought expanded in southwest Idaho and northern Nevada, extreme and exceptional drought expanded in central Colorado, and abnormally dry and moderate drought conditions expanded across much of eastern Wyoming…
Temperatures were above normal across nearly the entire region, with departures of 9–12°F above normal in the east and 6–9°F above normal across Texas and Oklahoma. Northern Louisiana, Mississippi, central and eastern Tennessee, and southeast Arkansas received well above-normal precipitation, with southern Mississippi recording 200–400% of normal. Central and southern Texas, eastern Oklahoma, and Arkansas remained largely dry. Drought improvements occurred across Mississippi, southern Louisiana, and eastern Tennessee, including improvements to severe drought in northwest Mississippi and northern Louisiana. In contrast, drought expanded across much of Arkansas and eastern and southern Texas. Extreme drought expanded across south Texas, with a new area in northeast Texas. Moderate and severe drought also expanded across east Texas into Arkansas, while abnormally dry conditions increased in central Texas and western Oklahoma. Severe drought expanded from eastern Arkansas into western Tennessee…
Looking Ahead
Over the next five to seven days, much of the western half of the U.S. is anticipated to be dry from the West into the Plains. The wettest areas are anticipated to be over the Great Lakes region and into the Northeast. At the end of the period, there could be some coastal precipitation in portions of south and east Texas as well as Louisiana. Temperatures during this time are anticipated to well above normal over the West, with departures of 10-13°F above normal from Nevada into Utah and Wyoming. Cooler-than-normal temperatures will be commonplace over the eastern half of the country, with the greatest departures over the upper Midwest and Great Lakes with departures of 10-13°F normal. The below-normal temperatures will migrate all the way into the South, with portions of the Southeast and Florida 6-9°F below normal.
The 6-10 day outlooks show that the likelihood of above-normal temperatures over much of the Southwest and southern Plains. The best chances of below-normal temperatures will be over the upper Midwest and into the Northeast. From the northern Plains into the Southeast and Florida and areas east of here have the best chances of below normal temperatures. Precipitation is expected to be below normal over Florida and the coastal areas of the Pacific Northwest. The best chances of above-normal precipitation are anticipated over the Tennessee Valley as well as over the Rocky Mountains and into the Southwest.
US Drought Monitor one week change map ending January 13, 2026.
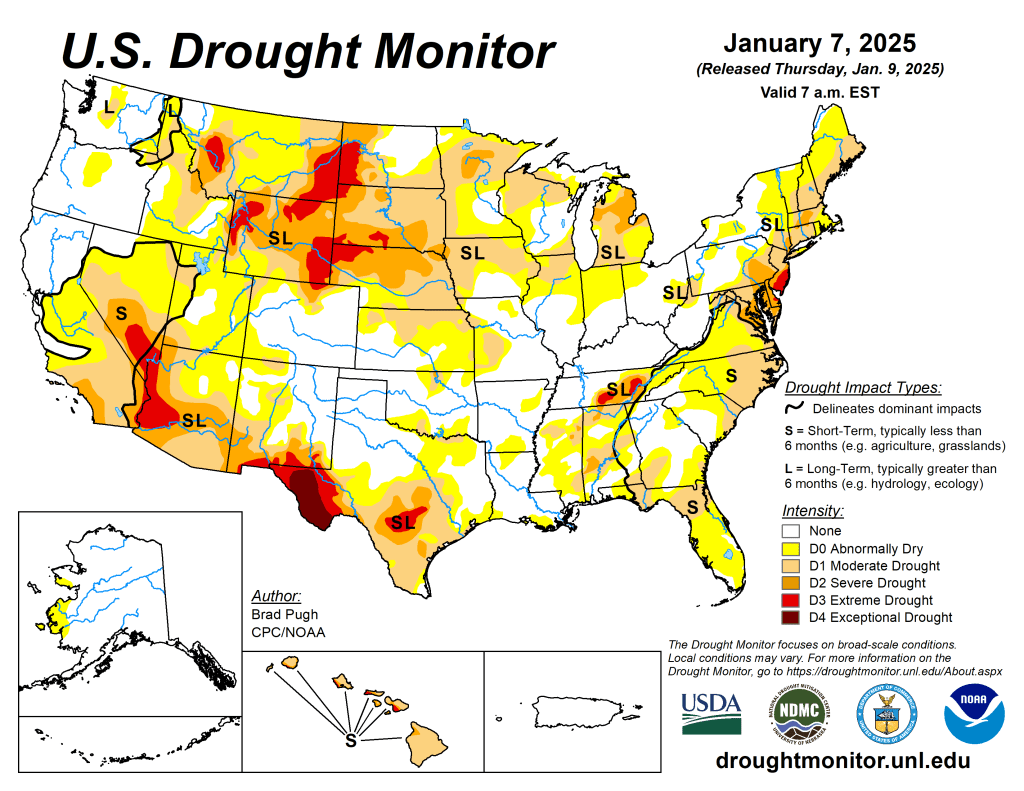
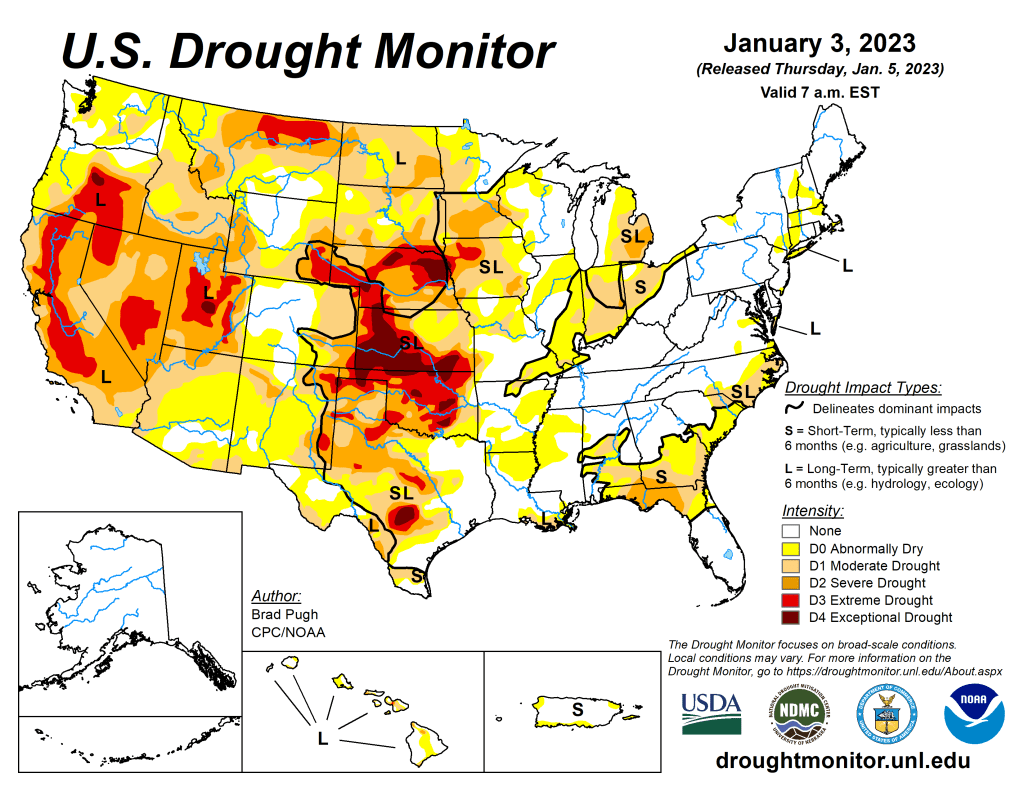
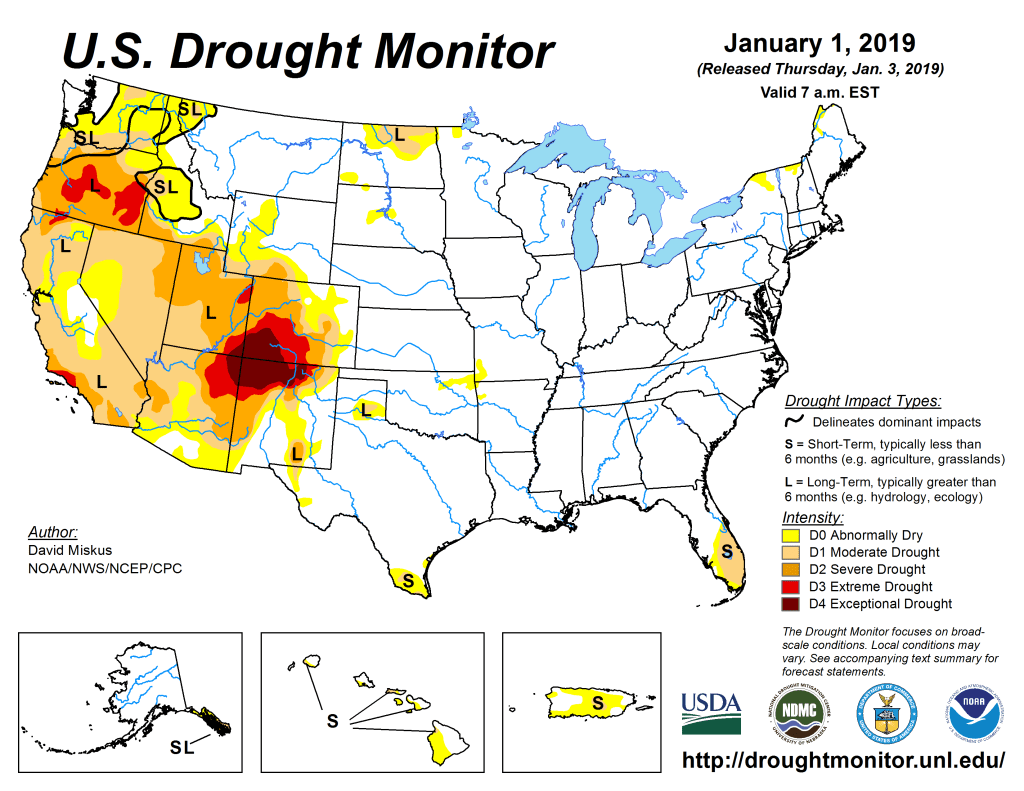
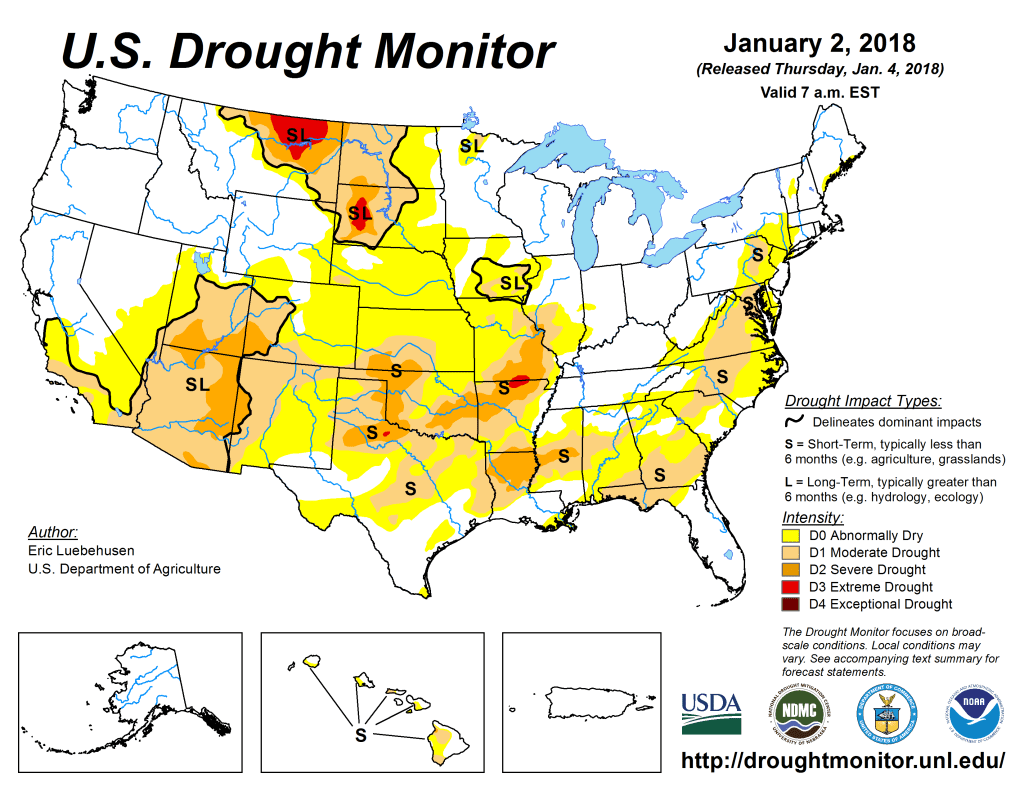
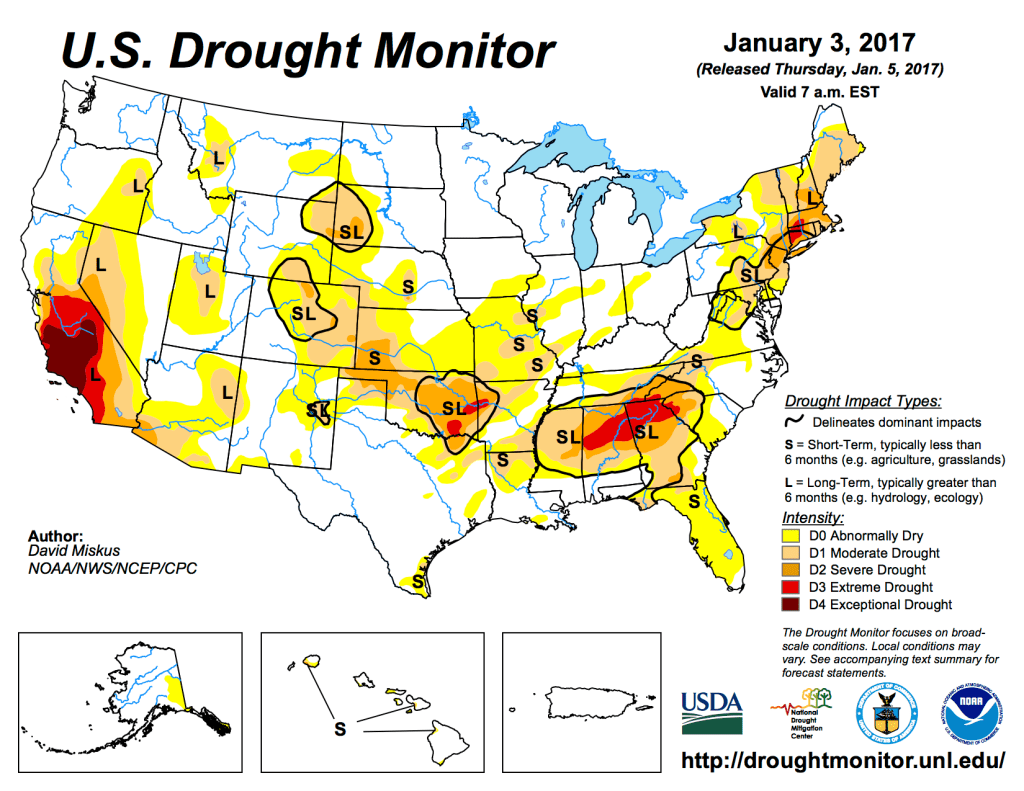
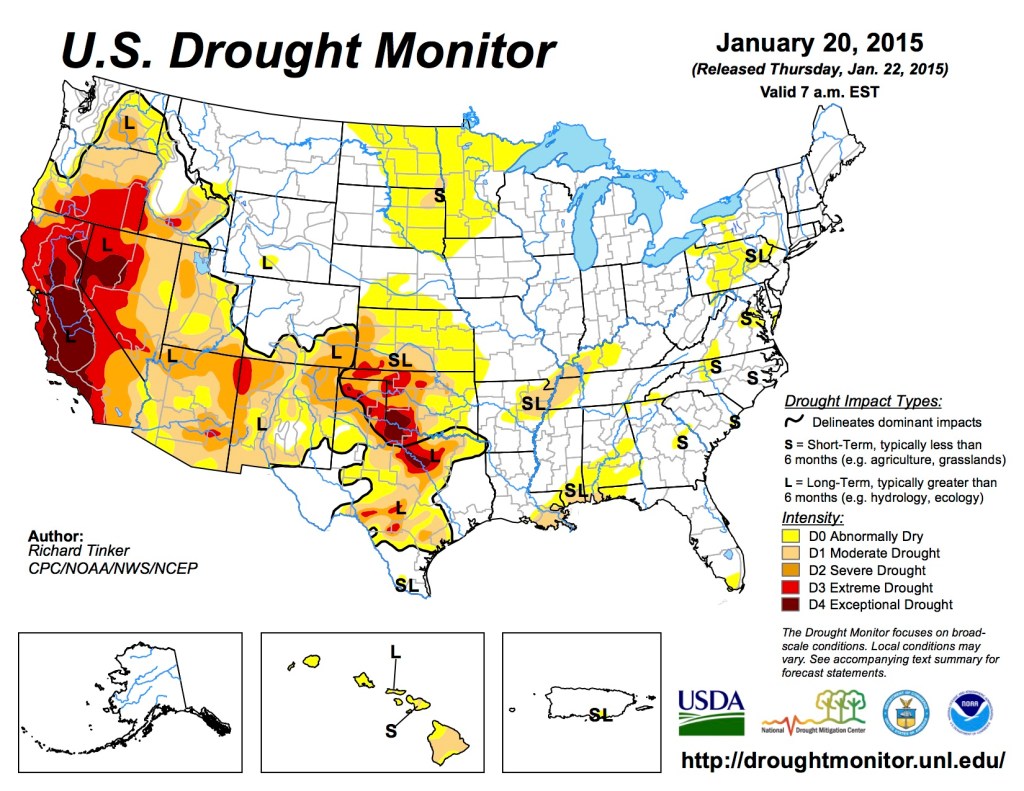
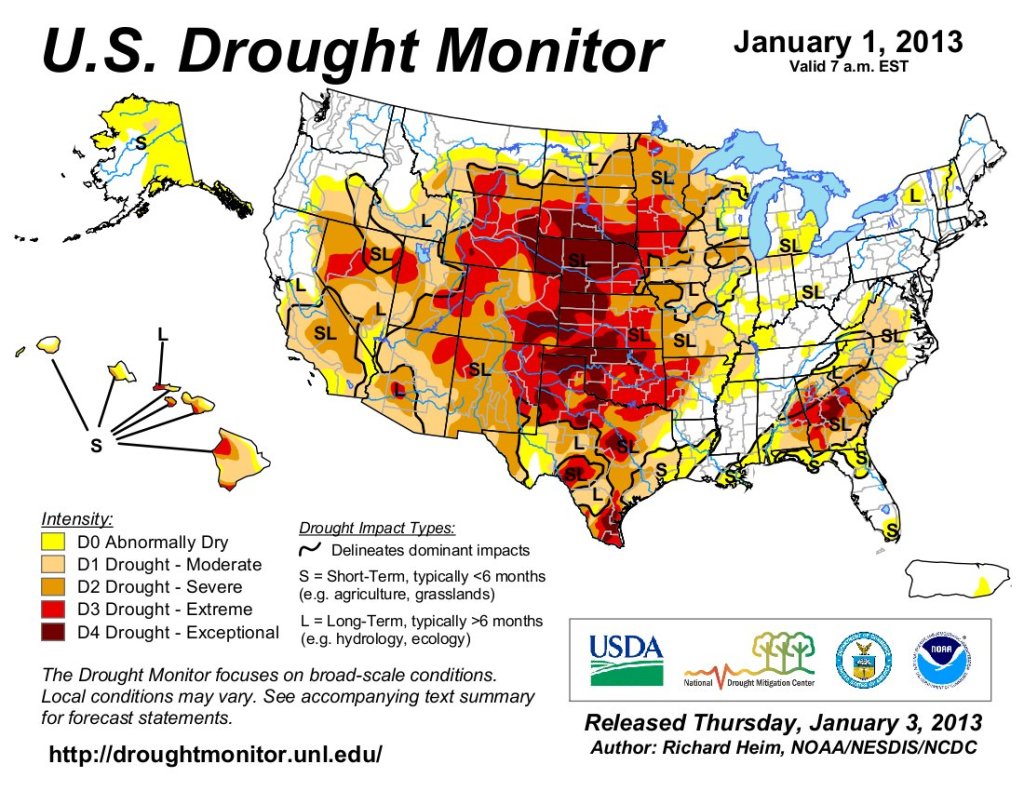
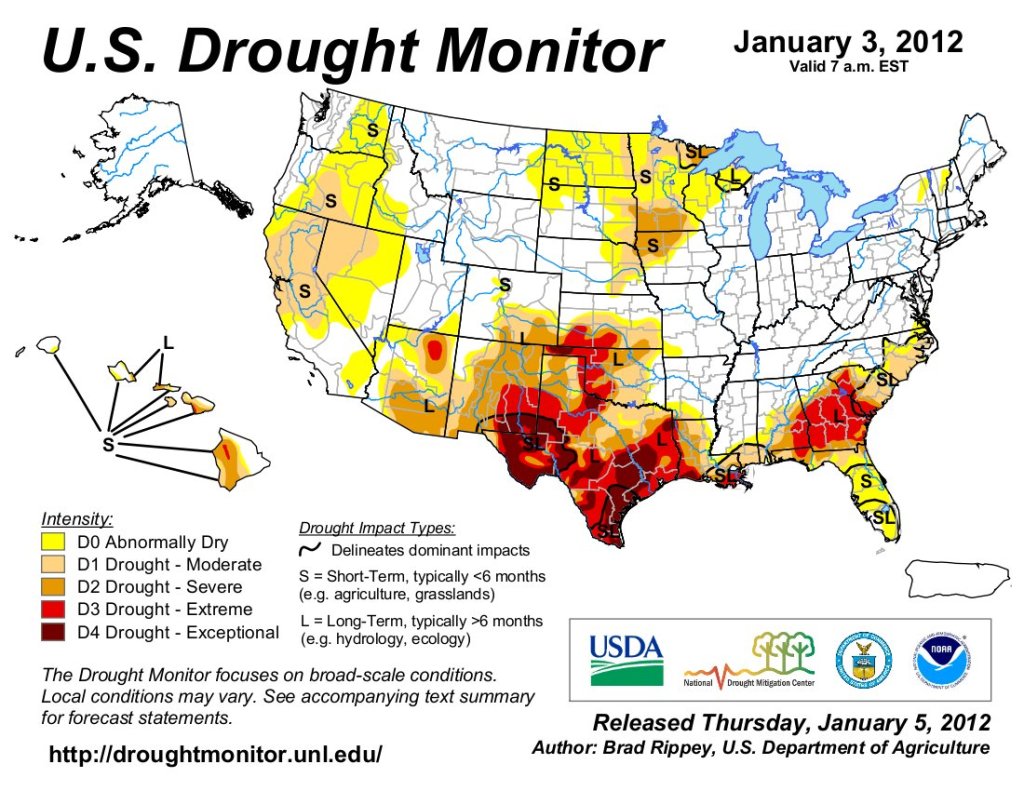
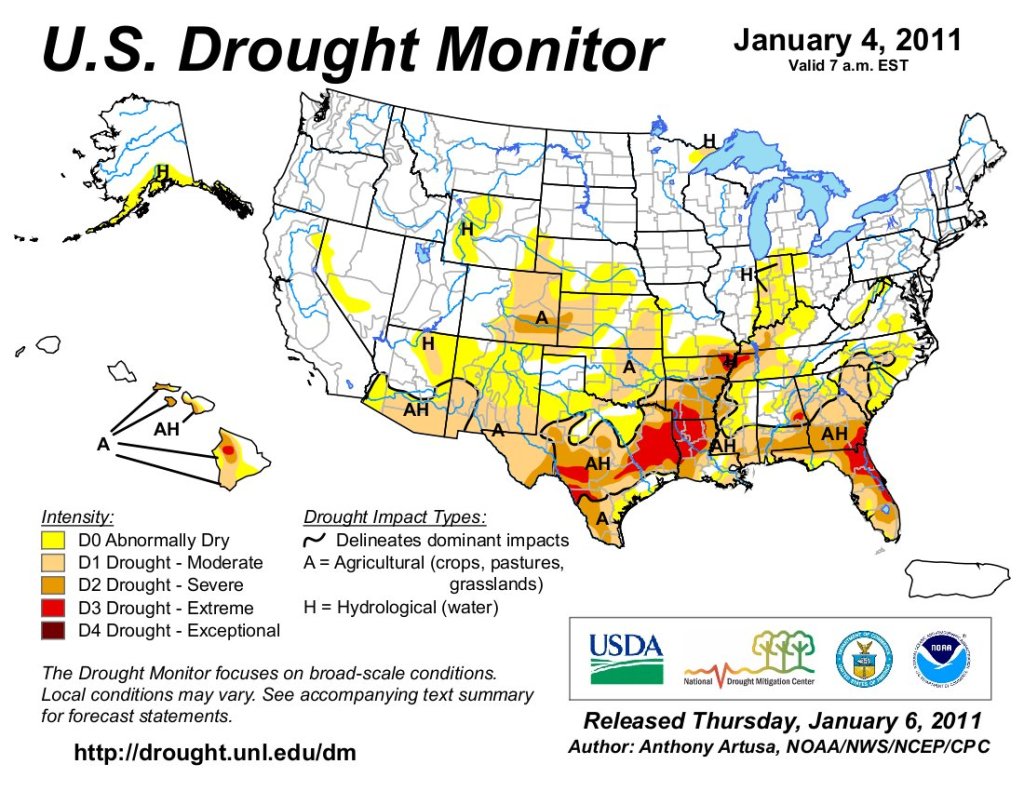
Just for grins here’s a slideshow of early January US Drought Monitor maps for the past few years.
Exceptional. Record-smashing. Disturbingly warm. December 2025 was one for the record books in Colorado. 🌡️ Warmest December🌡️ >1000 daily high temperature records 🌡️ Warmest October thru December by far🌡️ 4th-warmest yearRead more in our monthly summary: climate.colostate.edu/monthly_summ…
Several annual international climate reports released Tuesday indicate that relentless human-caused warming continued in 2025, especially in the oceans and at the poles.
For the third year in a row, Earth’s average temperature ran close to 1.5 degrees Celsius hotter than the climate that sustained human civilizations as the 20th century began, before fossil-fuel pollution started damaging the atmosphere.
Avoiding more than that level of warming is also the key long-term temperature goal of the 2015 Paris Agreement. Research shows that warming by more than 1.5 degrees Celsius above the baseline will spell the end of nearly all global glaciers and coral reefs and mark a dangerous red zone for damage and destruction of ecosystems, food supplies, human health and infrastructure.
The European Union’s Copernicus Climate Change Service report released Tuesday ranked 2025 as the third-warmest year on record, just a hair cooler than 2023 and within striking distance of 2024, the hottest year on record. Together, the past three years averaged more than 1.5 degrees Celsius above pre-industrial temperatures, the first time any three-year stretch has crossed that threshold.
“Exceeding a three-year average of 1.5 degrees Celsius above pre-industrial levels is a milestone none of us wished to reach,” said Mauro Facchini, head of earth observation at the European Commission’s directorate general for defense industry and space.
The report reinforces the importance of Europe’s leadership in climate monitoring to inform both mitigation and adaptation, he added. The U.S. is rapidly pulling back amid Trump administration attacks on climate science.
Global temperatures from 2023 to 2025 suggest that the past warming rate is no longer a reliable predictor of the future, said Kristen Sissener, executive director of Berkeley Earth, an nonprofit climate research organization that also released a global report Tuesday.
“The warming spike of the past three years underscores how quickly the climate system can change, and how essential sustained monitoring is to understanding those changes in real time,” she said. “Continued investment in high-quality, resilient and robust open climate data is critical to ensuring that governments, industry and local communities can respond based on evidence, not assumptions.”
At today’s pace of emissions, Copernicus scientists said, the world is on track to hit the Paris Agreement’s 1.5-degree Celsius limit permanently by the end of this decade, sooner than expected when the deal was signed.
“Emissions simply haven’t come down as fast as people believed they would,” Samantha Burgess, deputy director of Copernicus, said when asked about crossing the Paris Agreement limit so soon. “That’s the big difference between where we thought the world would be in 2015, and where we are now.”
And the extreme temperatures of 2023, 2024 and 2025 will be seen as cooler than average in just a few years, Burgess said, warning that continued fossil-fuel emissions are rapidly resetting what the world considers normal.
Faster Warming Likely Ahead
The Copernicus report was foreshadowed by a Dec. 18 analysis of recent temperature trends by noted climate scientist James Hansen and colleagues. They found that 2025 stayed near or above the 1.5-degree Celsius threshold even after the strong planet-warming El Niño weather pattern of 2023–2024 eased.
And they projected that a new El Niño could push global warming to about 1.7 degrees Celsius in 2027. El Niño is a Pacific Ocean temperature cycle that alternately warms or cools the entire planet by 0.1 to 0.2 degrees.
A series of new international climate reports released this week show that 2025 ranked as one of the hottest years on record, driven by the unabated buildup of greenhouse gases in the atmosphere. Credit: Copernicus Climate Change Service
“These three years stand apart from those that came before,” Samantha Burgess told reporters at a media briefing Monday, noting that record-high ocean temperatures are now persisting even without a strong El Niño influence.
“By far and away, the high global temperatures of the last three years have been due to the record amount of greenhouse gas concentrations in the atmosphere,” Burgess said. Other factors can have regional impacts, such as reductions in industrial and shipping pollution that reflect heat away from Earth, especially over oceans, and can also nudge the global average by about 0.1 degrees Celsius.
Major climate monitoring centers around the world are releasing their annual assessments in coordinated fashion Tuesday and into early Wednesday, including the World Meteorological Organization, NASA and the United Kingdom’s Met Office.
The reports’ exact global temperature figures differ by a few tenths of a degree, reflecting slightly different datasets and analytical methods, but they all point in the same direction: Global warming is accelerating, driven overwhelmingly by human emissions.
“We’re all very consistent in the near term, because our planet is better observed than it has ever been,” said Burgess.
Their synchronized release demonstrates that science and data speak for themselves. Even at a time when scientific institutions face extraordinary ideological attacks, the world’s leading climate agencies are allowing the measurements to define the reality of a rapidly warming planet.
A separate analysis released last week by Climate Central quantifies the damage caused by climate extremes in the United States. The group found that the country experienced 23 weather and climate disasters in 2025, from destructive storms and floods to heat-driven wildfires, that each caused at least $1 billion in damage, totaling about $115 billion in losses.
Climate Central is a nonprofit organization of scientists and journalists that researches and communicates climate science and impacts. After the Trump administration cut NOAA’s billion-dollar disaster database, the group revived it to keep long-term loss tracking publicly available using the same scientific methods.
In addition to the disaster database, the Trump administration last year reduced weather balloon launches, said it would shut down the National Center for Atmospheric Research and cut thousands of positions at science-focused agencies. Experts warn that weakening or sidelining science leaves communities more vulnerable.
Several groups of former federal scientists are working outside the government to ensure critical information continues to flow. The American Meteorological Society and the American Geophysical Union are teaming up to publish a series of peer-reviewed papers to help fill the gap left by the discontinuation of the National Climate Assessment. Other former federal officials are building Climate.us as a replacement for a federal website that the Trump administration shut down last year.
Asked about the potential impact of cuts to U.S. climate science programs, Carlo Buontempo, director of the Copernicus Climate Change Service, emphasized that the global climate record does not belong to any single nation, and that the greatest risk lies not in past data, but in future gaps. The international observation system goes far beyond data gathered by the United States, he added. [ed. emphasis mine]
“Global data observations are essential to efforts to confront climate change and air quality challenges,” said Florian Pappenberger, who leads the forecast and services department as deputy director-general of the European Centre for Medium-Range Weather Forecasts.
“These challenges don’t know any borders,” he said. “They don’t know what language is spoken underneath them, and therefore, it’s, of course, concerning that we have an issue in terms of data.”
Polar regions played an outsized role in driving global temperatures higher last year. Antarctica experienced its warmest year on record, while the Arctic had its second-warmest year, a pattern scientists attribute to feedback loops associated with sea-ice loss and, in Antarctica’s case, a rare atmospheric disruption that spiked surface temperatures.
In February, the combined sea-ice cover of both poles fell to the lowest level observed in the satellite era, underscoring how quickly the planet’s reflective ice shield is shrinking.
Photo Credit: Mauri Pelto
Extreme heat is increasingly how people experience that global warming signal. Copernicus reported that about half of the world’s land surface experienced more days than usual with dangerous heat stress in 2025, conditions that strain the human body. Scientists warned that while no single heat wave or wildfire can be attributed solely to climate change, the background warming is making such extremes more intense, more frequent and more disruptive in a preview of what will become more common as the planet moves deeper into Paris Agreement overshoot territory.
For the contiguous U.S., 2025 was the fourth-warmest year on record, according to the annual State of the Climate report from the National Oceanic and Atmospheric Administration, also published Tuesday. The NOAA report highlights that heat was concentrated in the West, with Nevada and Utah recording their warmest years in the 134-year record. As part of that report, the U.S. Climate Extremes Index ranked 2025 as the 12th-highest on record, particularly for maximum and minimum temperatures and for dry conditions.
Climate Extremes Affect Energy
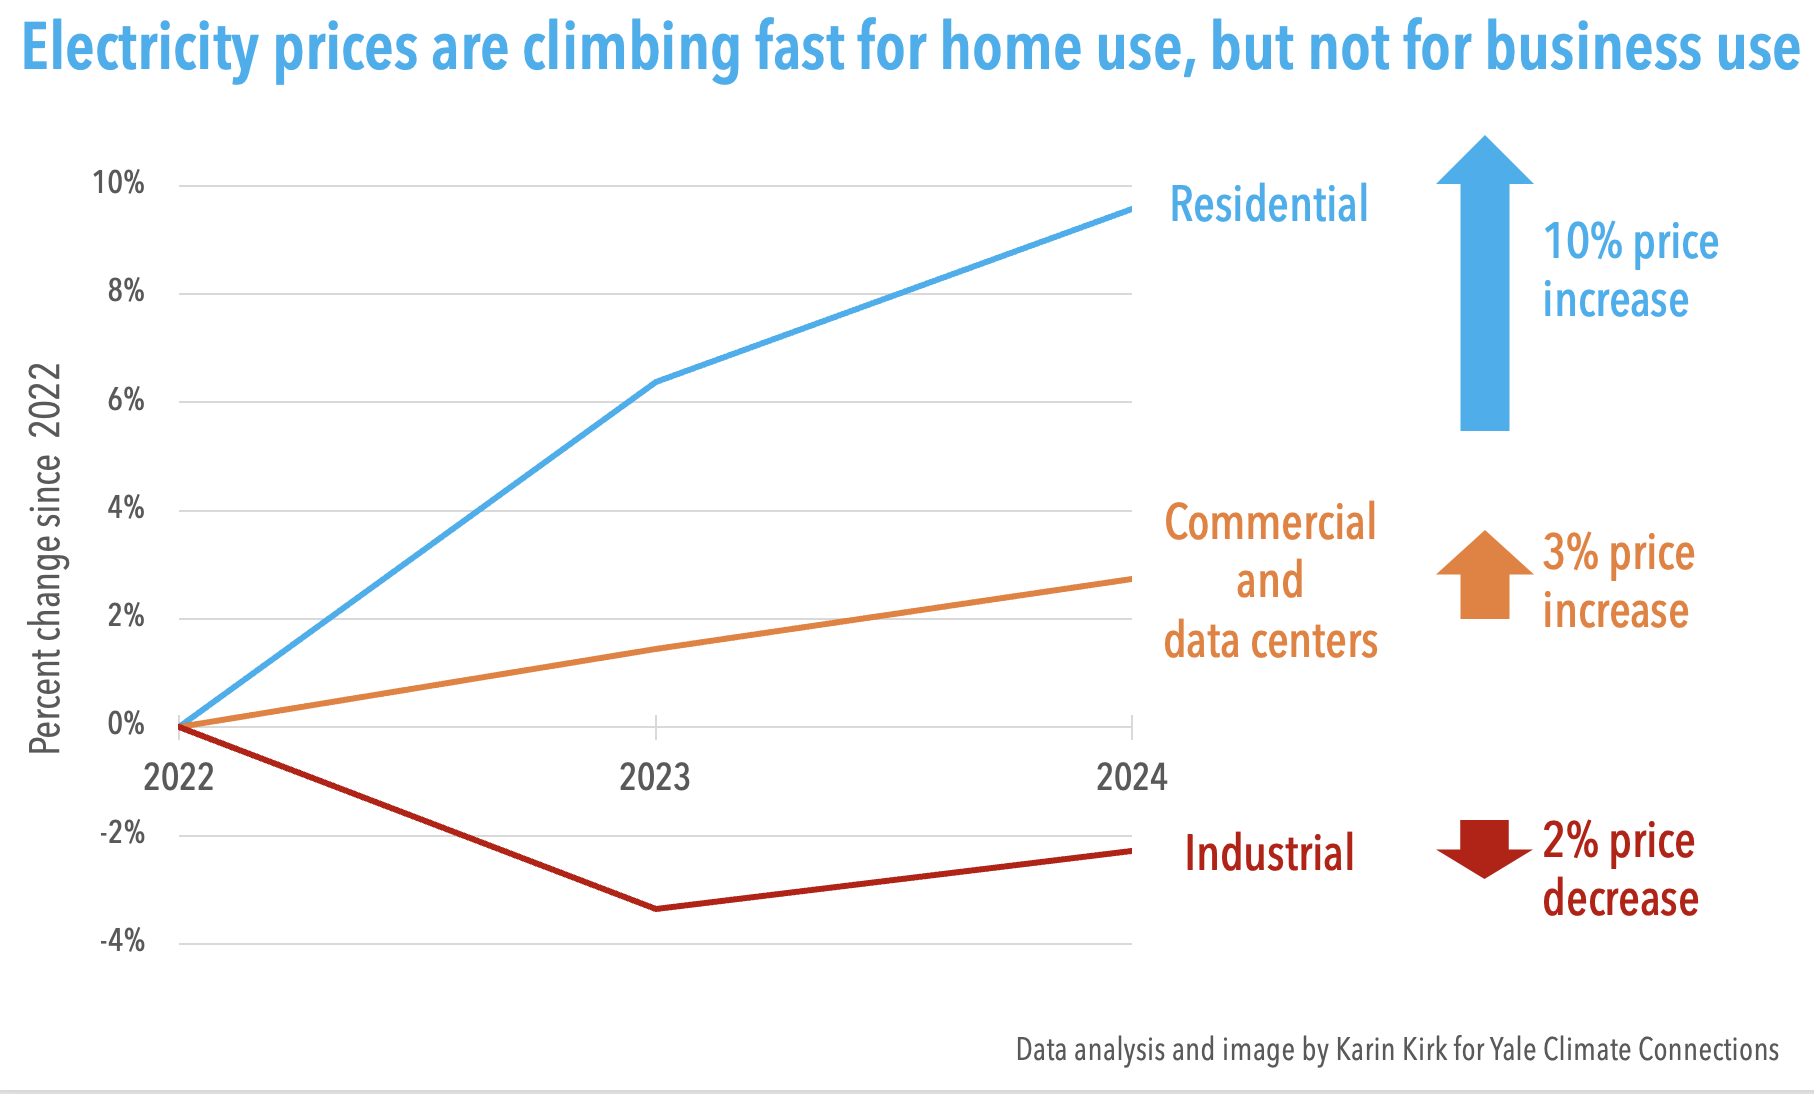
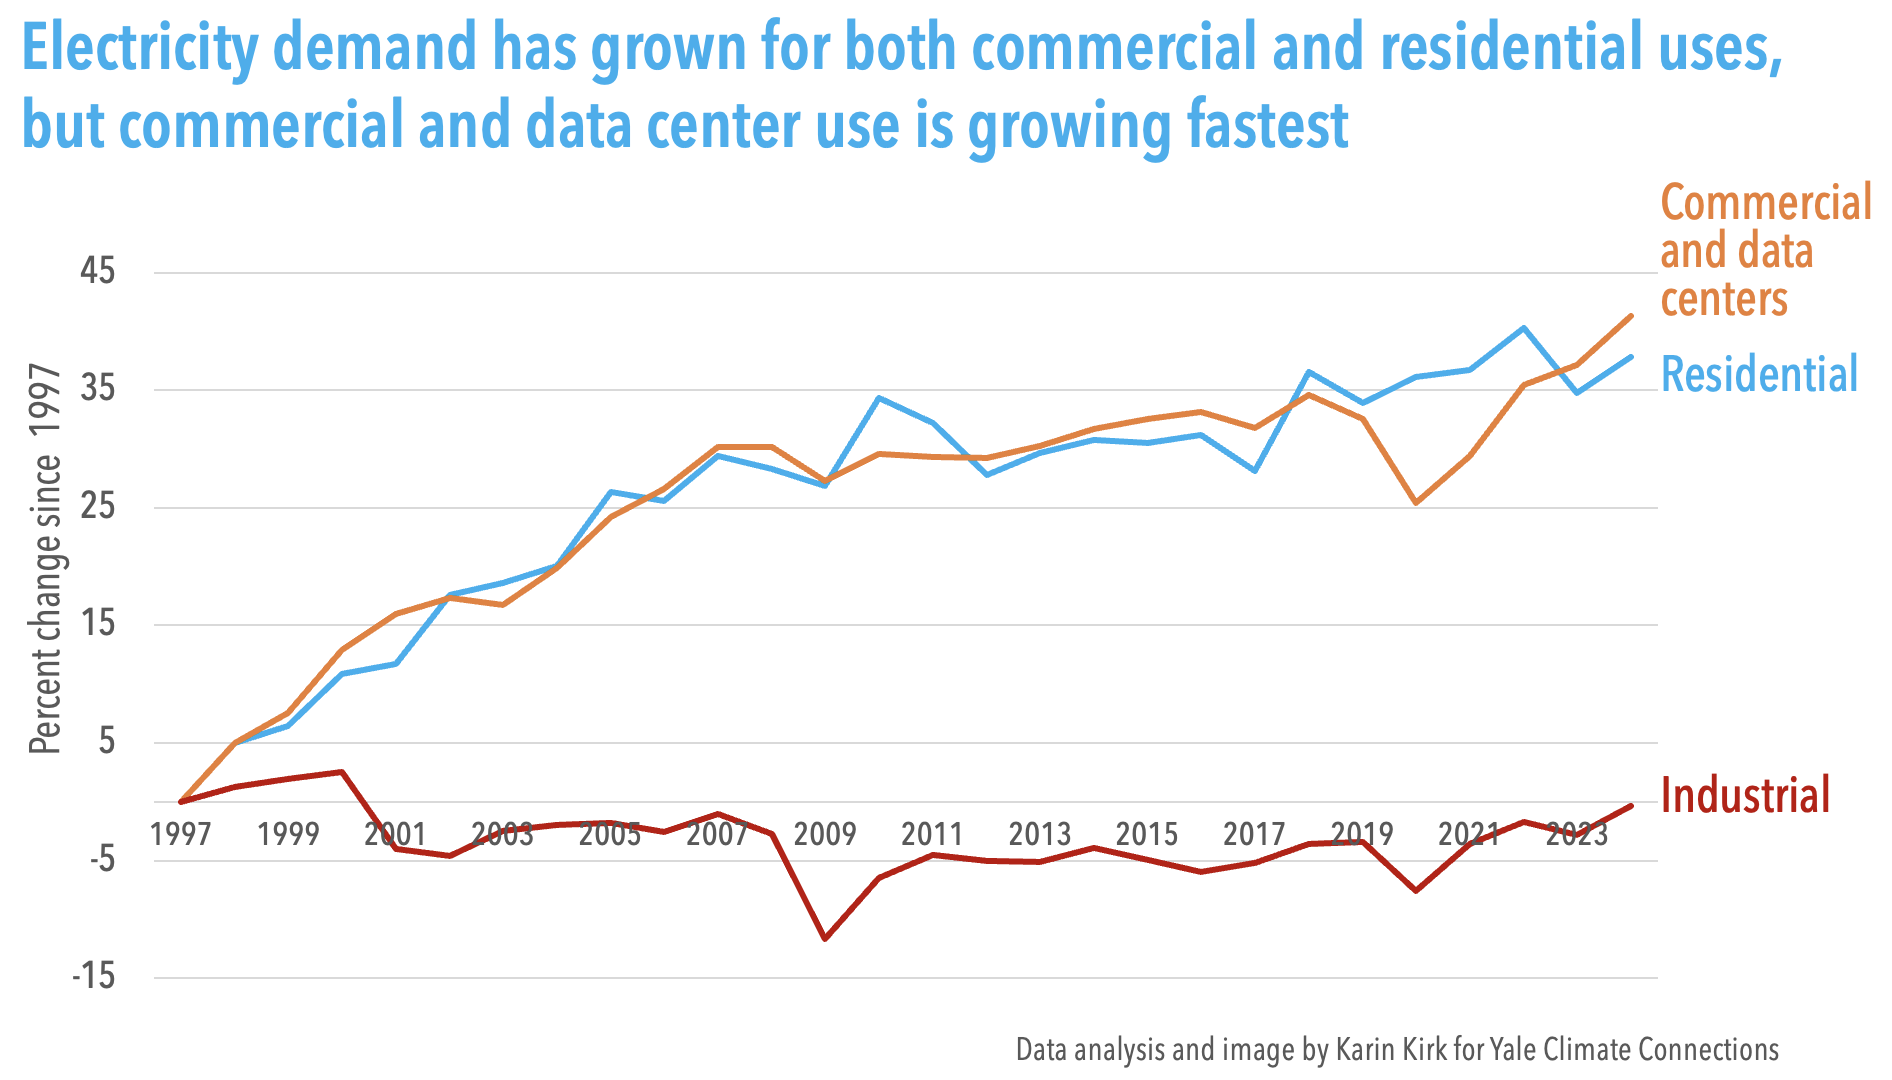
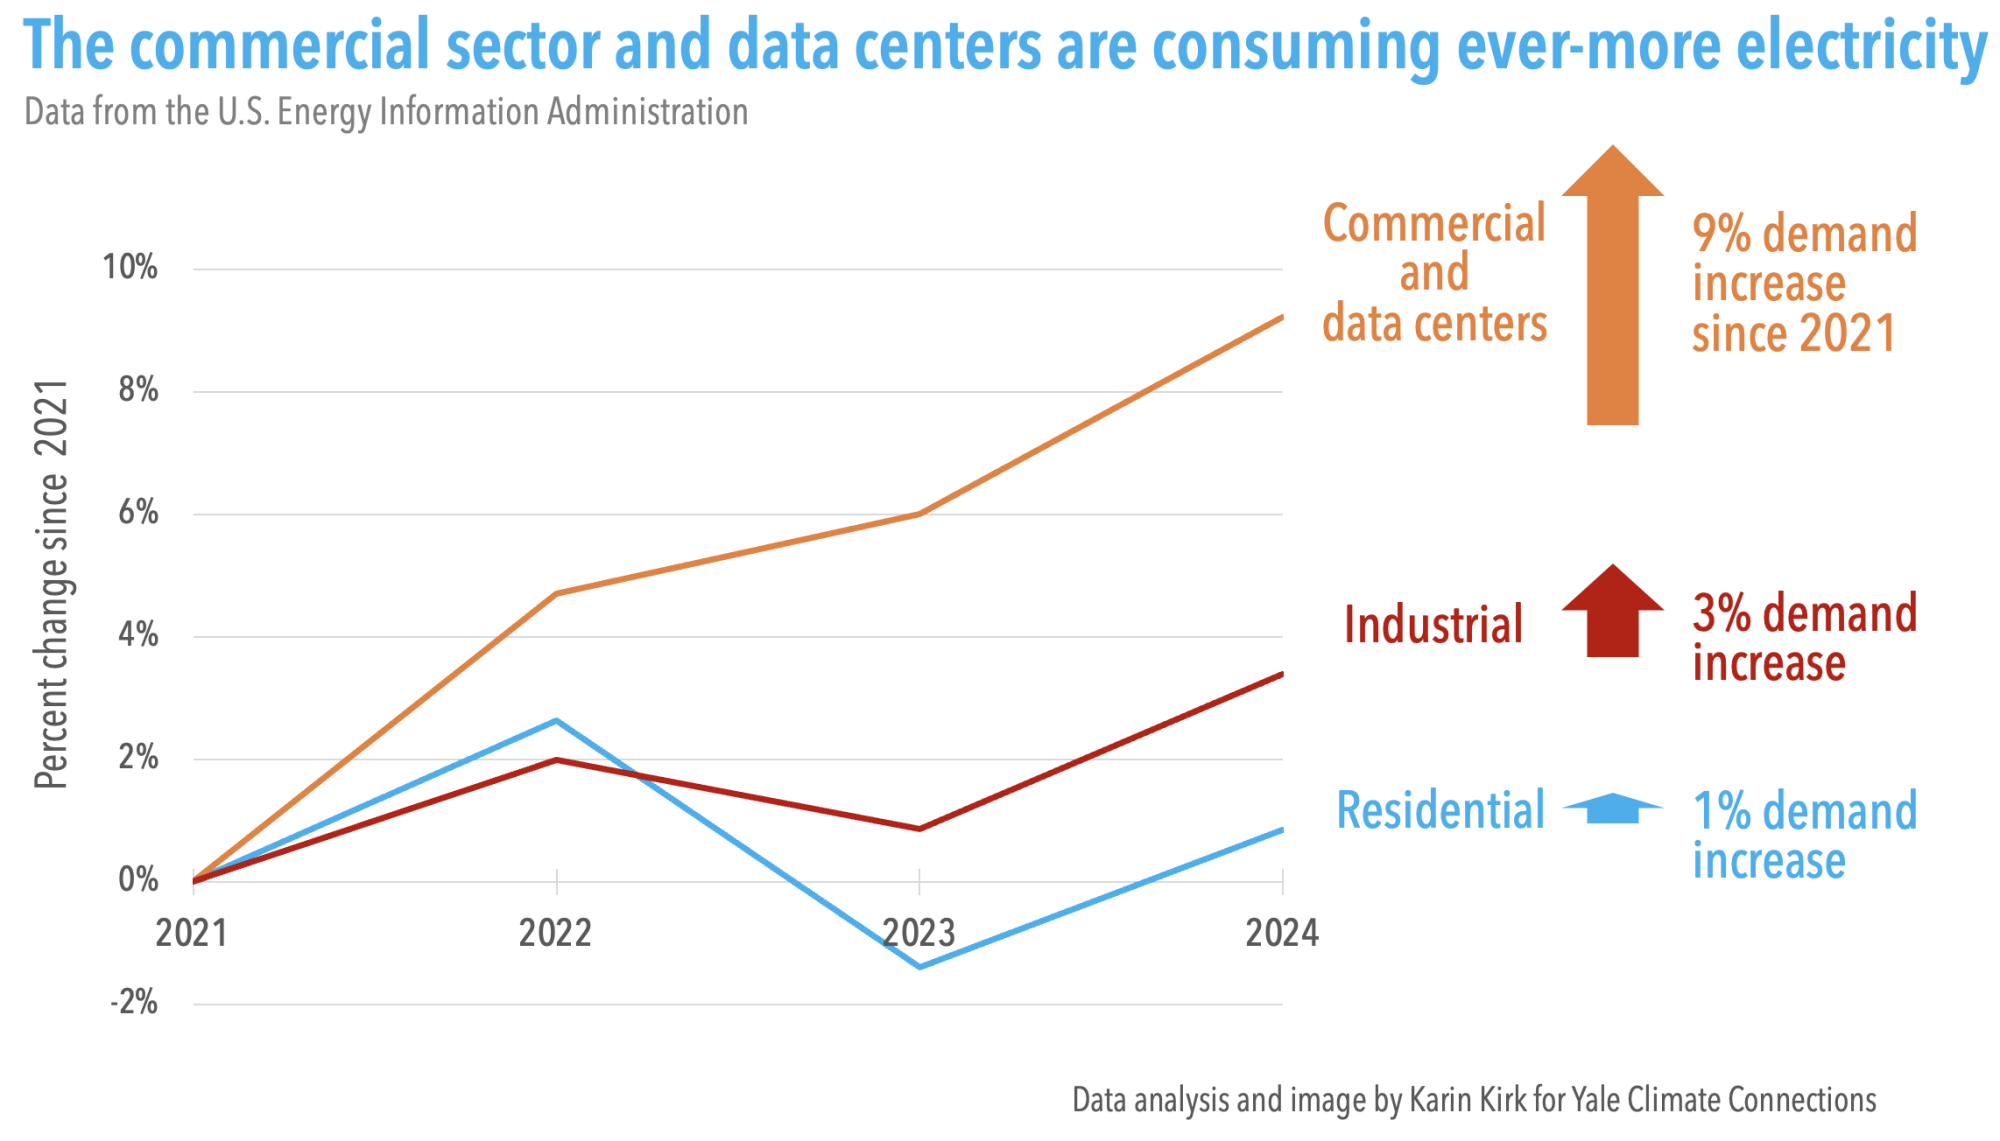
In a separate report Tuesday, the World Meteorological Organization warned that rising temperatures and climate extremes are reshaping electricity demand and energy-system risks worldwide, as hotter summers drive surging cooling demand while drought, heat waves and wildfires threaten power generation, transmission lines and fuel supply chains.
The report, produced with the International Renewable Energy Agency, found that climate extremes are increasingly disrupting both renewable and conventional energy systems, including drought-stressed hydropower plants and strained grids during hot spells.
Together, the findings underscore that climate change is no longer just an emissions problem but an operational risk for energy systems, which will increasingly shape how power grids are designed, protected and modernized as the world warms even further.
Copernicus’ Buontempo said that, with the inevitability of passing the 1.5-degree mark of the Paris Agreement, “it’s up to us to decide how we want to deal with the higher risks that we’ll face as a consequence.”
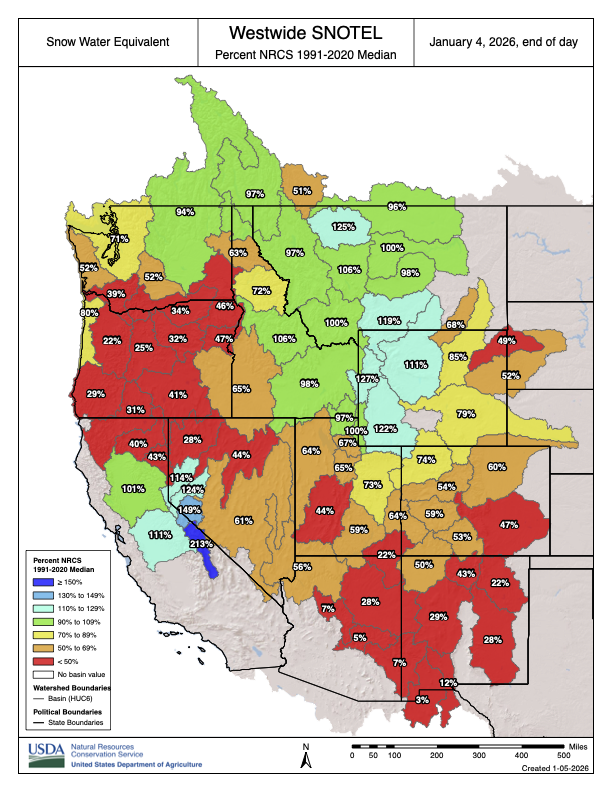
Westwide SNOTEL basin-filled map January 11, 2026.
Aerial view of wetlands and tundra typical of the Bristol Bay watershed in Alaska. Utilizing the Clean Water Act, the EPA is currently in the process of vetoing the Pebble Mine in Alaska’s Bristol Bay, which would pose a critical threat to the area’s wetlands. Photo credit: EPA
Click the link to read the article on the NOAA website:
January 13, 2026
Annual Key Points:
For the first time since 2015, no hurricanes made landfall in the U.S. or its territories during 2025.
The tornado in Enderlin, North Dakota, was the first verified EF-5 since 2013.
The Eaton and Palisades Fires were the second- and third-most destructive California wildfires on record, respectively.
The Texas Hill Country experienced a 1-in-100- to 1-in-1,000-year flood event that killed at least 135 people after nearly two feet of rain fell in just a few days.
Utah and Nevada set new annual temperature records, with Utah eclipsing its previous record that had stood since 1934.
Map of the U.S. notable weather and climate events in 2025.
Other Highlights:
Temperature
Annual temperatures across the contiguous U.S. (CONUS) averaged 54.6°F in 2025, which was 2.6°F above the 20th-century average and ranked as the fourth-warmest year in the 131-year record. Temperatures were above average nationwide, with the most pronounced warmth across the western third of the country. Averaged across the entire region from the West Coast through the Rocky Mountains, this area recorded its warmest annual temperature on record.
Map of the U.S. Mean Temperature Percentiles in 2025.
Based on average annual temperatures across NOAA climate regions, the Southwest saw its warmest year on record; the West and Northwest both ranked third warmest, and the South tied for its fourth-warmest year. Statewide, Utah and Nevada recorded their warmest years on record at 4.3°F and 3.7°F above their 20th-century averages, respectively. In total, a dozen states experienced one of their four warmest years. At the county level, 62 counties across 10 states—more than eight million people—recorded their warmest year on record.
Annual temperatures in Alaska averaged 29.5°F, 3.5°F above the 1925–2000 average, ranking as the ninth warmest in the 101-year record. Much-above-average temperatures persisted through most of the year, producing the third-warmest January–November statewide, though a notably cold December lowered the annual ranking.
Hawaiʻi recorded an average annual temperature of 67.0°F, 0.7°F above the 1991–2020 average, placing the year within the warmest third of the 35-year record.
Precipitation
The CONUS received an average of 29.19 inches of precipitation in 2025, 0.73 inch below the 20th-century average, placing the year in the driest third of the 131-year record. The annual average does not fully reflect some of the pronounced regional wet and dry patterns seen throughout the year: the western U.S. experienced drier-than-average conditions in the first half of the year, followed by wetter-than-average conditions late in the year, while central and eastern regions generally saw above-average precipitation in spring and early summer, then below-average totals in the fall.
Map of the U.S. Total Precipitation Percentiles in 2025.
Much of the Southwest and Southeast ended the year below average, with deficits exceeding one foot in parts of the Southeast, while the central and northern Plains, along with the western Ohio Valley, were wetter than average. Kentucky had its 10th-wettest year on record, with over a third of its counties receiving more than a foot above their average annual rainfall.
Alaska received 39.72 inches of precipitation in 2025, 3.02 inches above average, placing the year within the wettest third of the 101-year record. Hawaiʻi recorded a total of 41.96 inches, 19.77 inches below average for the state, or about 68 percent of normal (1991–2020), marking its third-driest year in the 35-year record.
Tropical Cyclones
Despite the lack of U.S. landfalls in 2025, the North Atlantic hurricane season was active, producing 13 named storms, including five hurricanes and four major hurricanes; this amount was near the long-term average. The season was particularly notable for three Category 5 hurricanes—Erin, Humberto and Melissa—the second-most to form in a single year. While Erin and Humberto remained offshore, Hurricane Melissa made landfall on Jamaica at peak intensity with maximum sustained winds of 185 mph—tying with the 1935 Labor Day Hurricane as the strongest landfall on record in the Atlantic Basin and ranking as the strongest tropical cyclone worldwide in 2025. Although no direct landfalls occurred, remnants of tropical systems—including Super Typhoon Halong (Alaska) and Hurricane Priscilla (Southwest)—brought flooding impacts to the U.S. late in the year.
Floods
2025 was characterized by widespread and significant flooding, driven by a combination of atmospheric rivers, slow-moving convective systems and tropical moisture. Significant flood events were observed in every season and region; July alone recorded 1,434 flash flood warnings from the National Weather Service—the second-highest July total in 40 years. Several historic precipitation events overwhelmed infrastructure, producing 1-in-1,000-year rainfall recurrence intervals in parts of Kentucky, Tennessee, North Carolina and Texas. These events resulted in significant loss of life; catastrophic flooding in the Texas Hill Country in July resulted in at least 135 fatalities, while recurring storms in the Ohio Valley and severe weather across the South contributed to dozens of additional fatalities throughout the year.
The year featured stark regional extremes, beginning and ending with strong atmospheric rivers that impacted the West Coast; notable events in February, November and December caused widespread damage and fatalities in California and the Pacific Northwest. In the interior, stalled spring fronts produced historic rainfall across the Lower Ohio Valley, while summer saw a shift to the Northeast, where record-breaking rainfall rates inundated the New York City metro area. Unique hydrological extremes also marked the year, including a record-breaking glacial outburst flood in Alaska, tsunami-induced flooding in Hawaiʻi and deadly flash floods over wildfire burn scars in New Mexico.
Tornadoes
The preliminary U.S. tornado count for 2025 was 1,559, ranking as the fifth-highest on record and 127 percent of the 30-year (1991–2020) average. The year was marked by several notable extremes, including 300 preliminary tornado reports in March—a new March record—more than three times average. In addition to the Enderlin EF-5 tornado, five EF-4 tornadoes occurred in Arkansas, Louisiana, Illinois and Kentucky. At the state level, North Dakota shattered its previous annual tornado record of 61 (set in 2010), with 72 tornado reports in 2025.
Wildfires
The number of wildfires in 2025 was approximately 105 percent of the 20-year (2001–20) average, with more than 72,000 wildfires reported. The total number of acres burned from these wildfires—5.0 million acres—was 72 percent of the 20-year average of nearly seven million acres.
Southern California experienced some of the year’s most destructive fires. Fueled by Santa Ana winds gusting up to 90 miles per hour and dry conditions, the Eaton Fire burned 14,000 acres, while the Palisades Fire burned more than 23,000 acres and was the most destructive wildfire on record for Los Angeles. Together, these fires damaged or destroyed over 18,000 structures during January and were responsible for 31 fatalities. Later in the year, the Gifford Fire became the largest wildfire for California in 2025, burning over 131,000 acres across San Luis Obispo and Santa Barbara counties in August.
In Arizona, the Dragon Bravo Fire burned more than 145,000 acres between July and September, making it the largest wildfire of the year in the U.S. and the 10th-largest in Arizona history.
Alaska had a below-average 2025 wildfire season, with approximately one million acres burned—about two-thirds of the state’s 20-year (2001–20) average.
Drought
The drought footprint across the CONUS experienced marked fluctuations during 2025, following a distinct pattern of spring expansion, early summer contraction and autumn resurgence. The year began with 38.1 percent of the lower 48 states in moderate to exceptional drought (D1–D4). Coverage expanded steadily through March, reaching a spring peak of 44.7 percent on March 25. Widespread precipitation then drove a substantial decline, with drought coverage falling to its annual minimum of 29.6 percent by June 3. However, this improvement was short-lived. Drought conditions intensified during late summer and autumn, with coverage increasing rapidly to a yearly maximum of 46.1 percent on October 21 and again on November 18. By the final week of the year (December 30), drought coverage had eased slightly but remained elevated at 42.8 percent, leaving a larger portion of the country in drought than at the start of 2025.
Snowfall
The 2024–25 snow season featured above-average snowfall across parts of the mountainous West, central Plains, Gulf Coast, Southeast and Ohio Valley, while below-average snowfall occurred across much of the Great Basin, southern Rockies, northern Plains, Upper Midwest and portions of the Northeast.
The 2025–26 snowfall season to date (October 1–December 31, 2025) saw above-average snowfall across much of the Midwest and Great Lakes region, with lake-effect areas receiving more than a foot above average for this period. In contrast, much of the Mountain West and High Plains received lower-than-average snowfall, particularly the Cascades, Wasatch and Uinta and the northern and southern Rockies, with the exception of the Sierra Nevada and parts of the northern Cascades, Bitterroots and middle Rockies.
Climate Extremes Index
The U.S. Climate Extremes Index (USCEI) for 2025 was 58 percent above average, ranking 12th-highest in the 116-year record. Warm extremes in both maximum and minimum temperatures were above average across the CONUS, as was the extent of exceptionally dry conditions (very low Palmer Drought Severity Index); each of these indicators ranked among the top 10 on record. Several regions had an annual CEI that was much above average, with the Southwest recording its third highest on record.
Warm temperature extremes were widespread in 2025. Extremes in overnight minimums affected more than 85 percent of the West, Northwest and Southwest regions and over half of the CONUS as a whole, while extremes in daytime maximums covered more than three-quarters of those same western regions. The Southwest also recorded its fourth-largest extent of extremely dry conditions on record, with all regions ranking in the driest third historically.
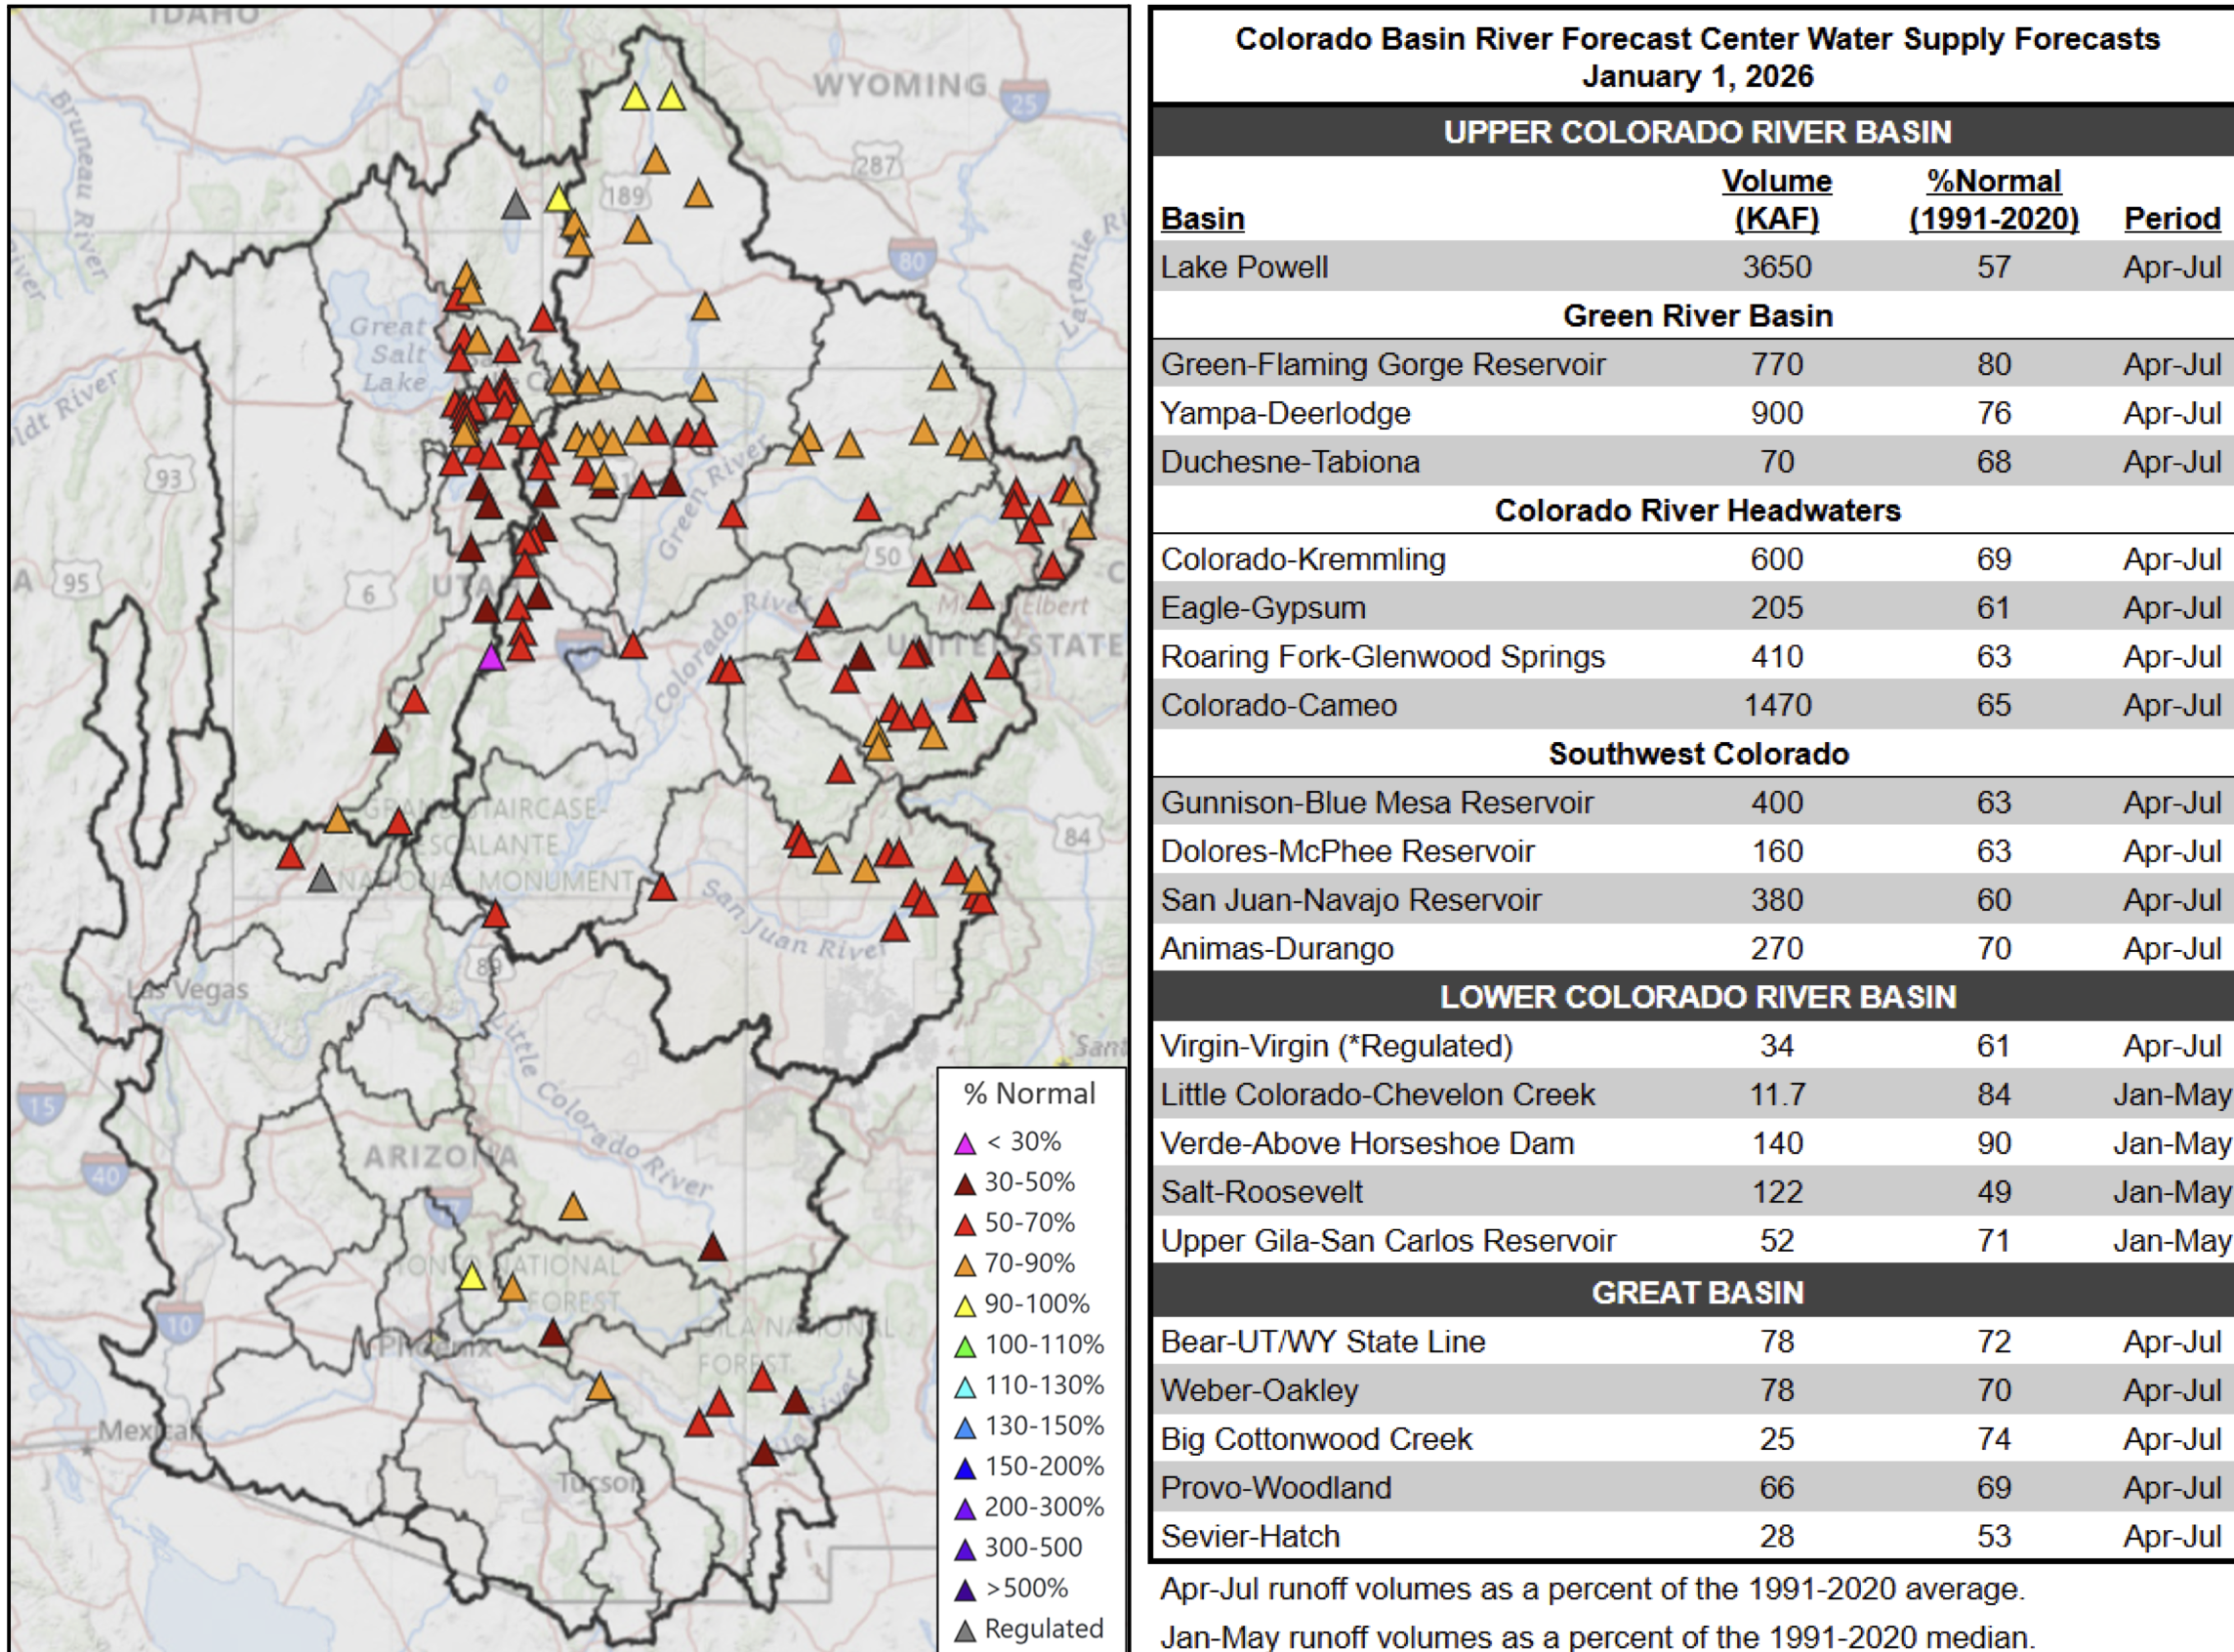
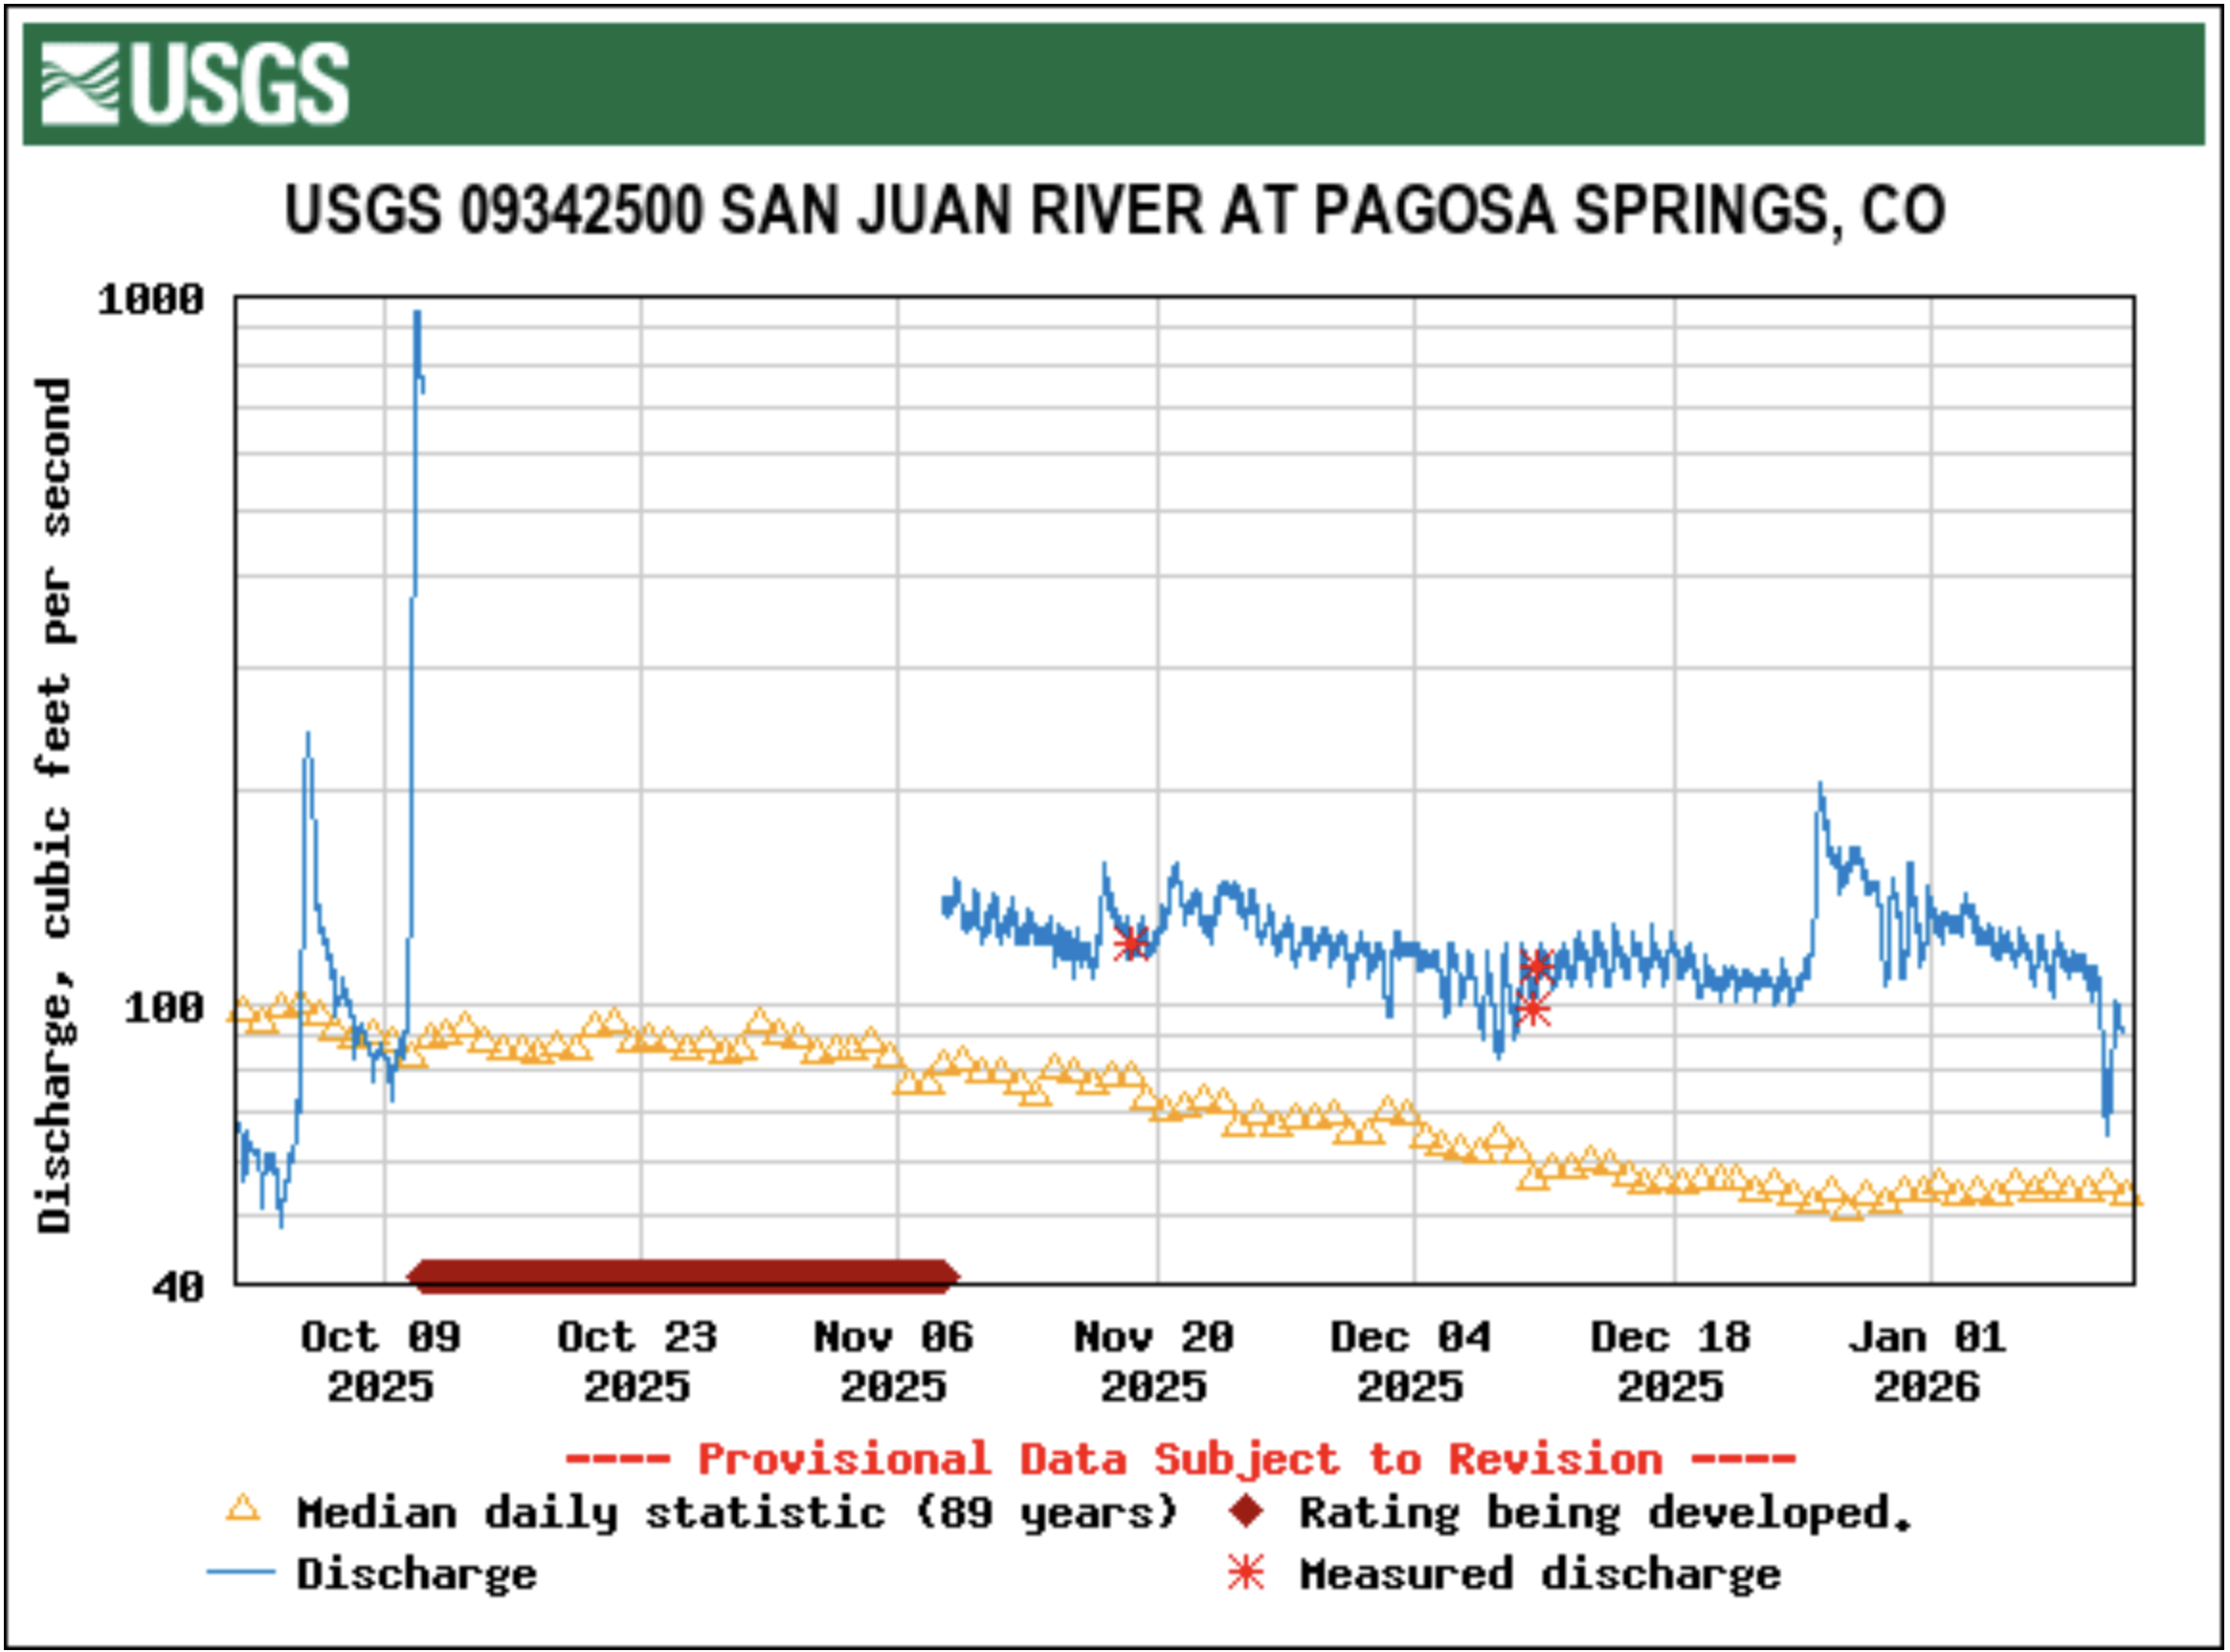
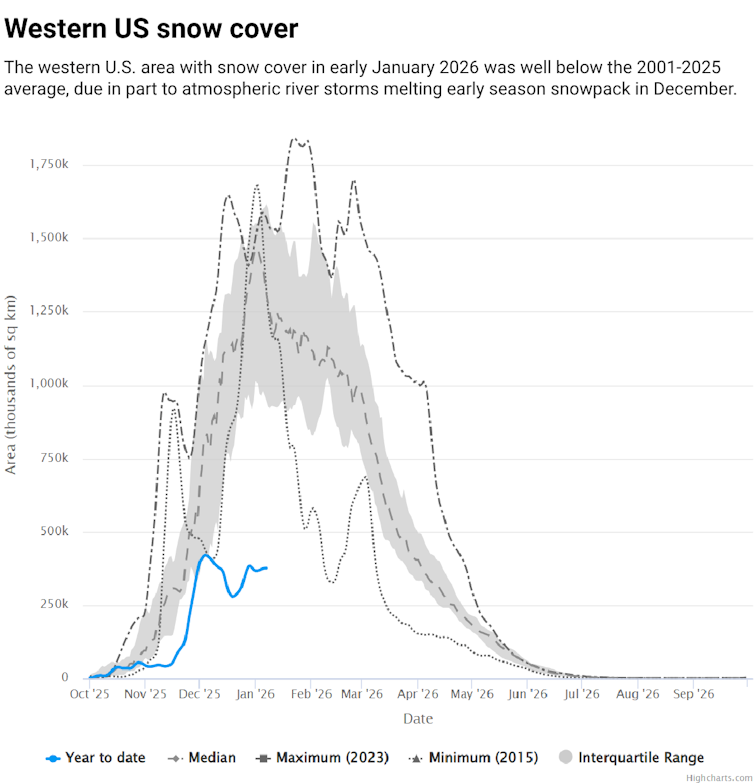
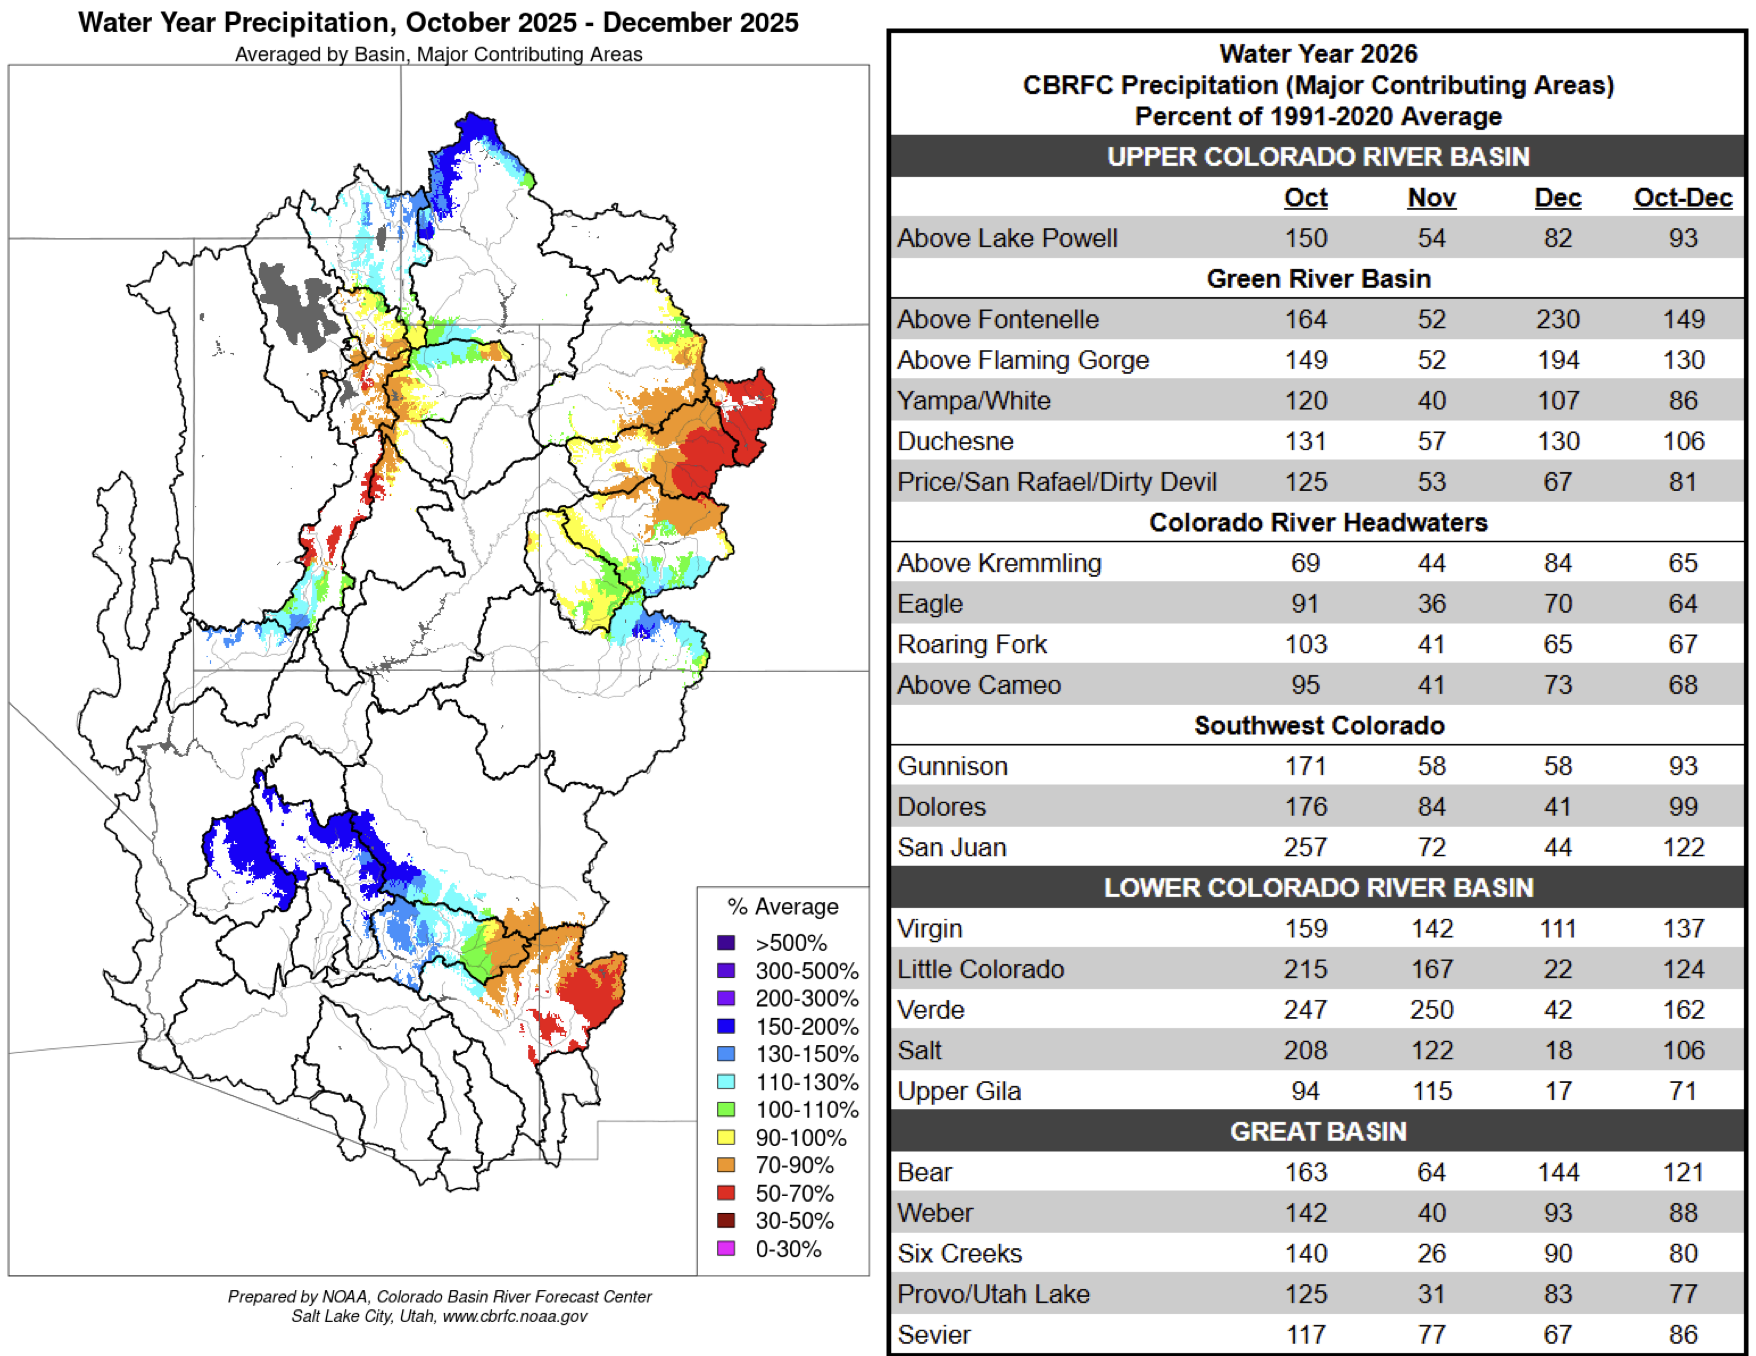
Water forecasts for the Colorado River are grim going into 2026 as several bad trends are converging. The Colorado Basin River Forecast Center (CBRFC) cited snowpack levels that are lagging badly, dry ground conditions that will soak up moisture that falls, and snow cover statistics that are the lowest on record since satellite monitoring started in 2001. CBRFC water scientist Cody Moser said conditions are “extremely poor” right now. He spoke during a webinar on Thursday morning. The two biggest factors in the CBRFC’s forecasts are snowpack levels and soil conditions. Storms that soaked California in November and December didn’t continue on to the Colorado Rockies, and that meant a slow start on building the foundation for a good snowpack to feed the river before it flows to Lake Powell and down the Grand Canyon to Lake Mead…Water flowing into Lake Powell this year is expected to be 57% of normal levels, and those “normal” levels are based on 30-year averages that include a 25-year megadrought.
Left: January 1, 2026 SWE – NRCS SNOTEL observed (squares) and CBRFC hydrologic model. Right: CBRFC hydrologic model SWE condition summary.
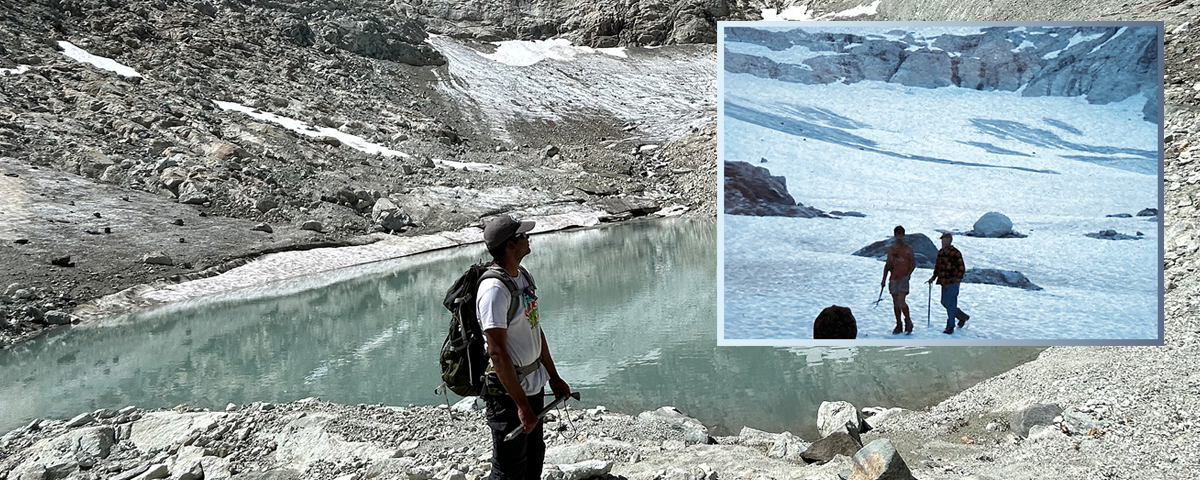
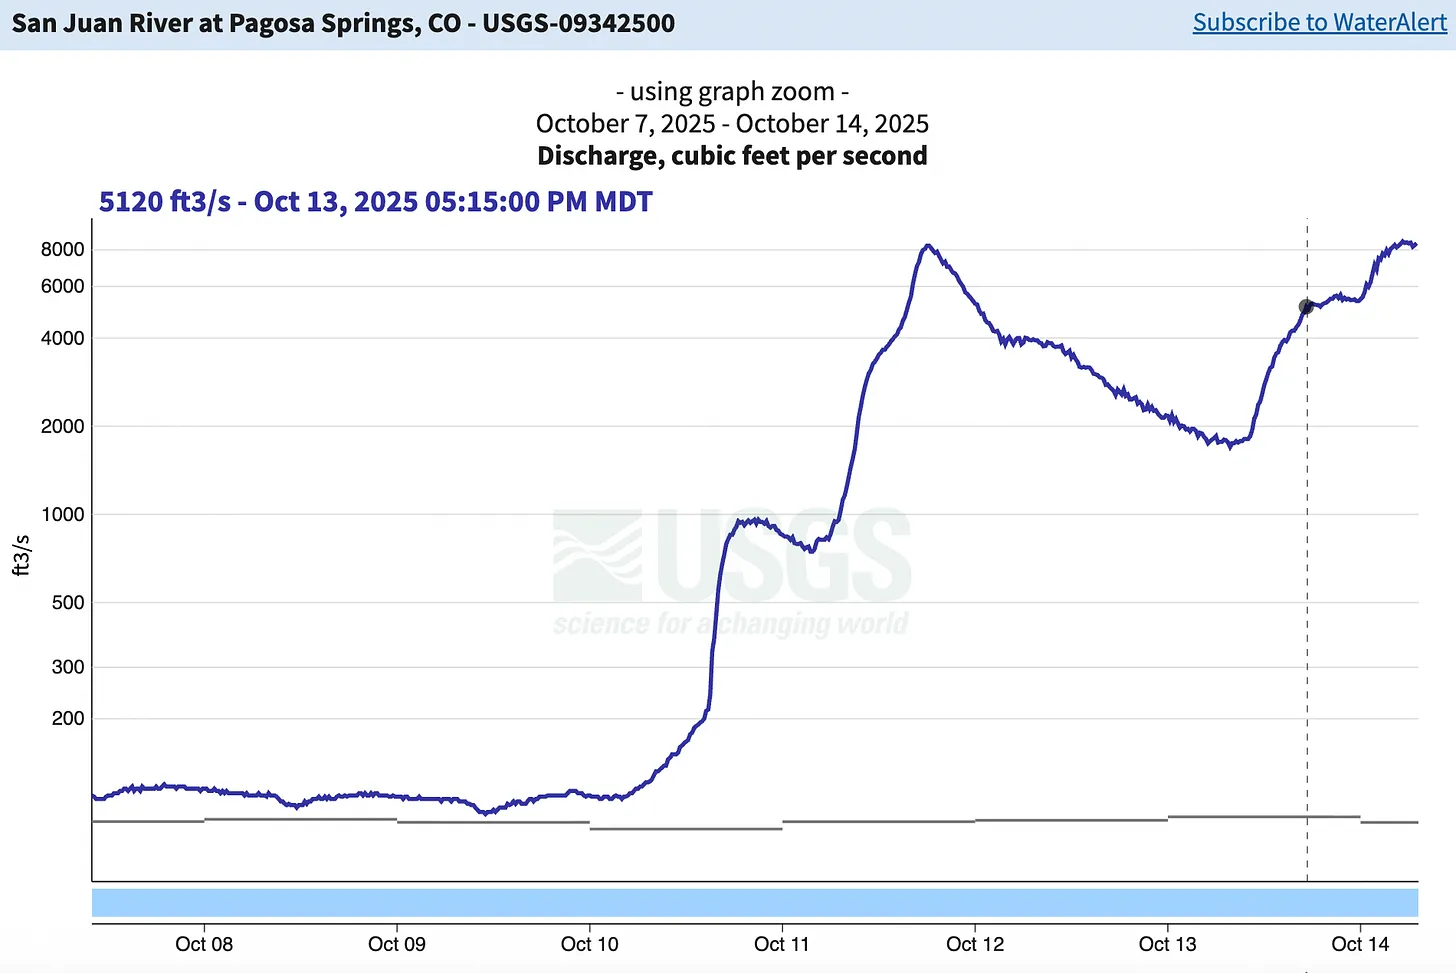
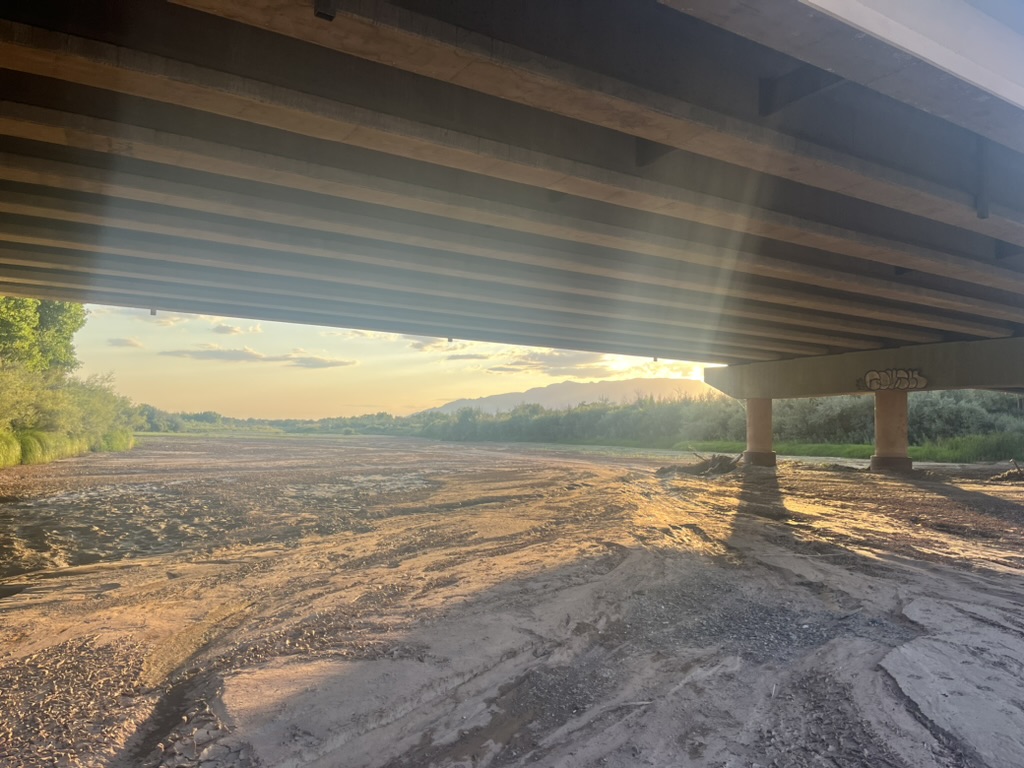
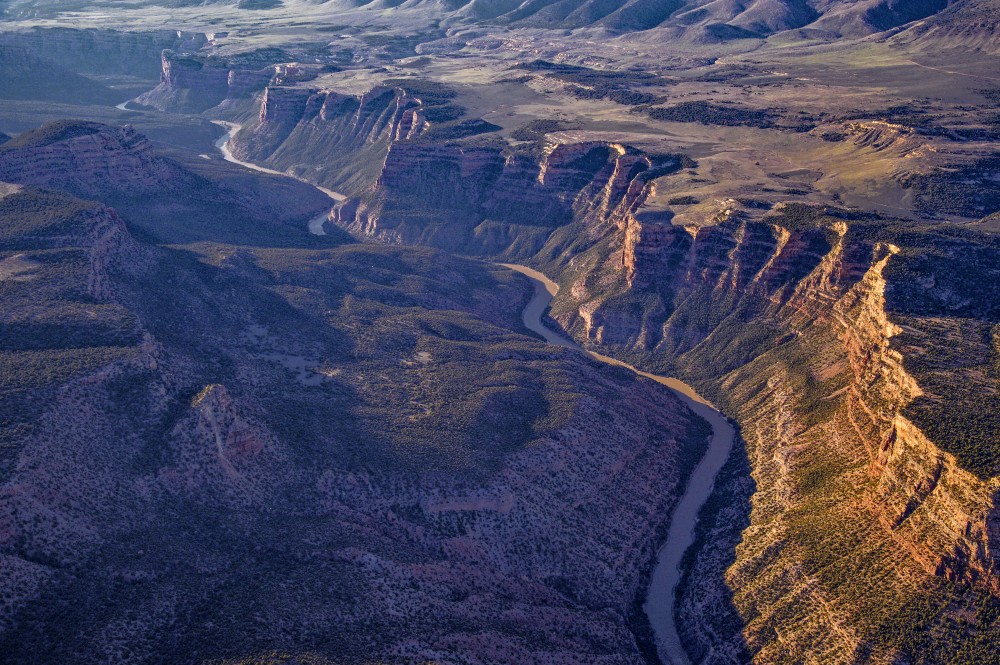
By now everybody’s sick and tired of the term “Dead Pool”. But what about reaches? Last summer as I was driving from Denver to Grand Junction I was horrified to see that the Mighty Colorado that had been flowing outside my left window had suddenly dried up, completely. This was nine miles east of Glenwood Springs. The view of the dessicated riverbed reminded me of a scene from a post-apocalyptic movie.
The culprit of course was the Shoshone Hydroelectric Generating Station which diverts 1250 cfs from a diversion at Hanging Lake, then returns that water 2-1/2 miles downstream after it’s been used to drive the plant’s hydroelectric turbines.
As the name implies Grand Junction’s “15 mile reach” is much longer. In the late summer a full 15-miles of dry river bottom can be seen along the I-70 beginning at the Cameo Diversion Dam and ending 15 miles downstream at the confluence of the Gunnison River. The Cameo Diversion Dam supplies 1.2 million acre feet of river water annually to irrigate Grand Valley farms, then returns about half of that water to the Colorado river at a variety of points downstream.
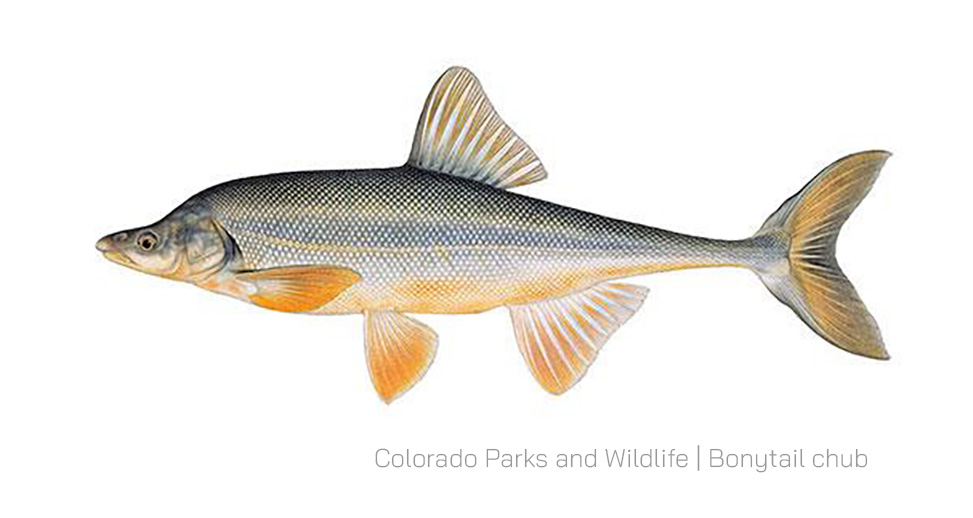
Not surprising these dry patches are hell for native fish, at least four of which are on the verge of extinction. The Bonytail – which has no wild populations left, the Colorado Pikeminnow, the Razorback Sucker, and the Humpback Chub, are all critically imperiled due to habitat loss from dams and competition from non- native species.
Gratefully one organization has ponied up to keep the water flowing. The Colorado Water Trust uses donations from people like me to buy water from sources that are upstream of these reaches in order to maintain a limited amount of water flow, year round. It may not be much but they’re hoping it’s enough to keep these fish, and many other aquatic species alive through the summer.
I can’t help but wonder whether those who are responsible for managing the river couldn’t do more to balance its many uses in order to ensure that the river’s ecological health isn’t left hanging by such a fragile thread.
Click the link to read the article on the USGS website:
Aqueducts move water
June 5, 2018
If you live in an area where ample rain falls all year, you won’t see many aqueducts like the ones pictured here. But there are many areas of the world, such as the western United States, where much less rainfall occurs and it may only occur during certain times of the year. Large cities and communities in the dry areas need lots of water, and nature doesn’t always supply it to them.
The California Aqueduct, San Joaquin Valley, California. Sources/Usage: Public Domain. View Media Details
Some parts of the western U.S. do have ample water supplies, though. So, some states have developed ways of moving water from the place of ample supply to the thirsty areas. Engineers have built aqueducts, or canals, to move water, sometimes many hundreds of miles. Actually, aqueducts aren’t a high-tech modern invention—the ancient Romans had aqueducts to bring water from the mountains above Rome, Italy to the city.
Can you see something about the aqueduct picture above that causes some water to be lost in transit? In all environments, but especially In places where the climate is hot and dry, a certain portion of the water flowing in the aqueduct is bound to evaporate. It would be more efficient to cover the aqueduct to stop loss by evaporation, but the cost of covering it must be weighed against the value of the evaporated water.
Aqueducts were popular in ancient Rome
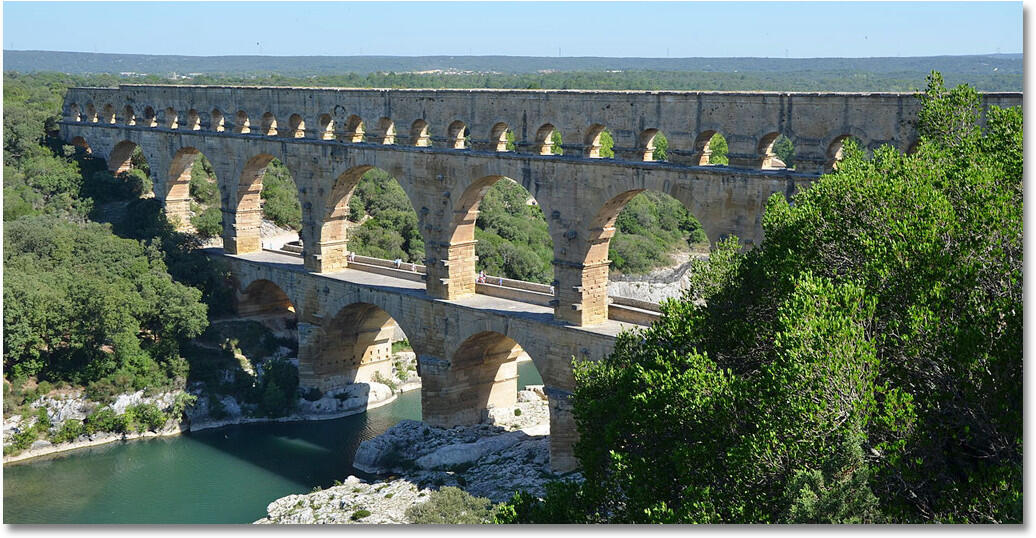
Below is a picture of the Roman aqueduct at Pont du Gard, crossing the Gard River in southern France. The aqueduct was used to supply water to the town on Nimes, which is about 30 miles from the Mediterranean Sea. Although the water ended up in the baths and homes in Nîmes, it originated about 12 miles away in higher elevations to the north. The total length of the aqueduct was about 31 miles, though, considering its winding journey.
There is even a Roman aqueduct that is still functioning and bringing water to some of Rome’s fountains. The Acqua Vergine, built in 19 B.C., has been restored several time, but lives on as a functioning aqueduct.
Roman aqueduct at Pont du Gard, crossing the Gard River in southern France. Credit: Carole Raddato, Creative Commons
Aqueducts were not the Roman’s choice for water-delivery systems, as they would use buried pipes when possible (much easier to bury a pipe than build an above-ground system). Although aqueducts use gravity to move water, the engineering feats of the Romans are shown in that the vertical drop from the highlands source to Nîmes is only 56 feet. Yet, that was enough to move water over 30 miles. And, if you think you can see the aqueduct in this picture “leaning” to one side, it is a illusion, as the vertical drop is only 1 inch for the 1,500 foot length. It is estimated that the aqueduct supplied the city with around 200,000,000 liters (44,000,000 imperial gallons) of water a day, and water took nearly 27 hours to flow from the source to the city. (Source: Wikipedia)
For the second straight time, Salt Lake City set a new record for its warmest year. That’s according to National Oceanic and Atmospheric Administration data that goes back to 1875. The city’s average temperature across 2025 was 57.7 degrees. That’s a full three degrees warmer than its historical average from the previous three decades. And it’s the culmination of several years of increasing warmth in Salt Lake City that has begun to top the record book.
“It looks like the past several years were in the top 15 or so,” National Weather Service Meteorologist Julie Cunningham said. “Kind of crazy to see that trend.”
Provo, Kanab, Bountiful and Boulder also set records for their warmest year in 2025. Several others, including Cedar City, St. George, Spanish Fork and Logan, saw temperatures that landed in their top 10…The summer of 2025 may not have had as many headline-grabbing heat waves as 2024 or 2023, Cunningham said, but it was consistently toastier than usual across the year as a whole. The fall was Utah’s warmest on record. The week of Christmas, cities from Kanab to Tooele broke daily records. On Dec. 22, the overnight low temperature in Salt Lake City was so warm, Cunningham said, it even surpassed that date’s record for a daytime high…Scientists say the record-breaking temperature events are another example of how global climate change — driven by fossil fuel emissions — is affecting life in places like Utah. That’s especially evident with the state’s precious water, said the University of Utah’s Paul Brooks.
“It’s really a dual threat,” the professor of hydrology and water management said. “One is just reducing the amount of water we have, and two is changing its timing, so it’s not as predictable as it once was.”
Higher temperatures fuel more evaporation. When temperatures increase across the year, it lengthens the season when evaporation occurs — essentially extending summer into parts of spring and fall. Warming also messes with the foundation of Utah’s water supply: snow. Snowpack provides 95% of the water used by Utahns. And Brooks said the state’s water management system is based on a predictable cycle of water becoming available when snow melts and flows downstream in the spring and early summer — just as demand for water starts to go up.
Bob Weir, a guitarist and songwriter who was a founding member of the Grateful Dead, which rose from jug band origins to become the kings of psychedelic rock, selling millions of records and inspiring a small nation of loyal fans, has died. He was 78.Bob Weir in 2010. By PAIRdoc – Own work, CC BY-SA 3.0, https://commons.wikimedia.org/w/index.php?curid=15998086
Bob Weir, a guitarist and songwriter who was a founding member of the Grateful Dead, which rose from jug band origins to become the kings of psychedelic rock, selling millions of records and inspiring a small nation of loyal fans, has died. He was 78…The band, which was founded in the San Francisco Bay Area in 1965, blended rock, folk, blues and country, with mellow ease and a gift for improvisation that became its trademark. In a rock milieu that was still based on short songs and catchy hooks, the Grateful Dead created a niche for meandering, exploratory performances that each seemed to have their own personalities…The band became the pied pipers of the wider hippie movement, providing the soundtrack for 1960s dropouts and LSD dabblers…Even after hippie culture faded, the band retained a gigantic fan base — called Deadheads, a term worn with pride and later adapted for numerous other fandoms — which followed the group wherever it played, traded recordings of its concerts and set up mini-encampments, complete with craft bazaars, oceans of tie-dye and no small amount of drugs.
It was one of rock’s original subcultures. “Our audience is like people who like licorice,” the band’s lead guitarist and singer, Jerry Garcia, once said. “Not everybody likes licorice, but the people who like licorice really like licorice.”
In the band, Mr. Weir — who, like Mr. Garcia, had an early fascination with folk music — stood alongside strong musical personalities. Mr. Garcia was a wizard of improvisation, and gave the group its aesthetic and conceptual direction. Phil Lesh, its bassist, had training as a composer. Mickey Hart, a percussionist, had eclectic tastes and played a major part in introducing Western audiences to world music…But Mr. Weir also developed a reputation for inventive timing on the rhythm guitar, his chords alternately grounding and contending with the melodic chaos of Mr. Lesh and Mr. Garcia’s instruments. Although Mr. Garcia and Robert Hunter, the group’s lyricist, were the Dead’s primary composers, Mr. Weir was also a contributor to the writing of key songs like “Playing in the Band” and “Sugar Magnolia.”
While Donald Trump seems to think he coined terms like “Drill, Baby, Drill,” the fact is, they’ve been around for a long, long time. This sign appeared at the 2008 Democratic National Convention in Denver. While Republican candidate John McCain and his VP candidate Sarah Palin were most vocally calling for increased drilling, the Democrats were also getting behind the nascent “fracking” revolution and touting natural gas as a cleaner bridge fuel from coal to solar and wind. And the so-called shale oil and gas drilling boom took off during the Obama administration. Jonathan P. Thompson photo.
Donald Trump made a lot of promises on the campaign trail: If elected, he would bring down the cost of groceries (a word that seemed new to him), he would secure the borders, he would end all of the wars on day one, and he would unleash the oil companies so they could “drill, baby, drill” and secure “energy dominance.”
Groceries are still expensive, “border security” is now MAGA-speak for federal agents gunning down innocent bystanders, and not only are the wars still raging, but the administration’s newly named “Department of War” has bombed Iran, Nigeria, and Venezuela, and is now threatening to invade Greenland and even Mexico.
In fact, the only war that Trump can take credit for ending was Biden’s “war” on energy. And that’s only because the “war” didn’t exist in the first place! It was and remains a figment of the GOP’s imagination.
Still, the administration did live up to at least one promise: It used a fabricated “energy emergency” to help increase extractive corporations’ profit margins by rolling back environmental protections, handing out drilling permits like candy at a parade, fast-tracking various mine and oil and gas infrastructure permits, and offering oodles of public land to energy companies.
But has it really achieve the stated goal, to establish “energy dominance” — i.e. boost production, bring down prices, and end oil imports?
Maybe the data will help us figure that one out …
Leasing
As I think we’ve established, the Biden administration did not wage a war on energy or even oil and gas. In fact, under Biden, the nation became the world’s largest oil producer, the largest exporter of liquefied natural gas, and so on, while also fast-tracking solar, wind, and transmission projects on federal lands.
Biden’s Interior Department did, however, put up some guardrails aimed at protecting some public lands. While it leased out parcels in the Permian Basin without restraint, it also refrained from putting some more sensitive parcels up for auction in more sensitive areas with limited oil and gas production.
The Trump administration has been far more friendly to oil and gas companies looking to bolster their land-holding portfolios, not only offering up hundreds of thousands of acres, but then putting them up for auction a second time if the first round didn’t attract enough bids.
328,000 acres: Amount of public land and minerals the BLM leased to oil and gas companies between Jan. 20 and Dec. 31, 2025. This brought in about $356 million in revenue.
$327 million: Amount a single oil and gas lease sale for 31 parcels, mostly in New Mexico’s Permian Basin, brought in this January, a record per-acre high average bid amount.
0: Number of bids received for 23 offered oil and gas lease parcels in Colorado in January. The sale was a “replacement” sale held after the initial auction failed to attract enough bids.
Drilling Permits
President Trump’s BLM issued an average of 909 permits to drill per month during the first year of his second term. This is almost triple the monthly average for Biden’s administration.
Environmentalists often attacked Biden for issuing more drilling permits for public lands than Trump did during his first administration. The comparison was dumb, but whatever. Trump apparently didn’t like Biden’s apparent energy dominance, so he struck back by issuing more than 5,000 drilling permits last year, far exceeding the Biden administration’s monthly and yearly averages.
1,124: Number of drilling permits the BLM issued to EOG Resources in 2025, mostly in the Permian Basin. That compares to 755 for XTO Permian and XTO Energy; 293 for Anschutz Exploration; 503 to Devon Energy; 338 to OXY USA; 241 to Matador Production; 119 to Chevron; 106 to Middle Fork Energy Uinta; and 80 to ConocoPhillips.
95: Number of drilling permits the BLM’s Farmington Field Office issued in 2025, to Hilcorp, Logos, SIMCOE, DJR Operating, and other companies. While this pales in comparison to the Permian Basin, it is a marked increase from recent years.
8: Number of drilling permits the BLM’s Moab Field Office issued in 2025.
100: Approximate number of drill rigs operating in all of New Mexico during any given week of 2025.
8,949: Number of approved federal drilling permits held by oil and gas companies that were available to drill as of Jan. 2, 2026. That is to say, they have the permits, but haven’t yet used them.
Production
During the past year, domestic crude oil production continued to increase month-to-month, but at a slower rate than it had previously. Oil production on federal lands was down about 2% from fiscal year 2024. This is mostly due to industry’s lack of enthusiasm for more drilling, thanks to a combination of low oil prices and higher expenses due to inflation and tariffs on steel and other equipment. So much for drill, baby, drill.
Oil production from federal and tribal nation lands was down for fiscal year 2025 as of August. Source: U.S. Department of the Interior.
7.9 million: Barrels of crude oil per day the U.S. was importing from other countries in December 2025. That’s marginally less than a year earlier.
2.1 million barrels/day: Net crude oil imports (imports minus exports) to the U.S. in December 2025.
Idle Wells
*GSI/OSI: Gas or oil wells oil well that are capable of producing but have not produced during the production month.
I find this to be, perhaps, the most telling chart of all. It shows the number of idle wells on federal mineral leases (which includes public lands and split-estate private lands) by Western state. A lot of the wells have just been wrung dry and have been abandoned and need to be plugged and reclaimed, probably at the taxpayer’s expense.
Still others, the ones in the GSI (non-producing gas completion) and OSI (non-producing oil completion) columns, are officially capable of producing oil and gas, it’s just that for one reason or another they aren’t producing currently. Dozens of the GSI/OSI wells in Wyoming, for example, are owned by bankrupt companies that were unable to offload them to someone else.
This brings up a question: If we are indeed in an “energy emergency,” as the Trump administration has declared, shouldn’t we be pumping all of the oil and gas from existing wells that we possibly can before issuing thousands of new drilling permits, most of which aren’t even being used?
Let me answer that one: We’re not in an energy emergency.
🗺️ Messing with Maps 🧭
I came across this cool old map of the Sangre de Cristo land grant while perusing the Green Fire Times’ tribute to Malcolm Ebright, who was a land grant community advocate and historian. In order to get a high-res version I had to, um, copy this from an online auction site (thus the watermarks). I don’t have much to say about it, except it’s a pretty cool map of a very cool area.
The energy transition was not meant to be a main topic when world leaders and negotiators met at the 2025 United Nations climate summit, COP30, in November in Belém, Brazil. But it took center stage from the start to the very end, bringing attention to the real-world geopolitical energy debate underway and the stakes at hand.
Brazilian President Luiz Inácio Lula da Silva began the conference by calling for the creation of a formal road map, essentially a strategic process in which countries could participate to “overcome dependence on fossil fuels.” It would take the global decision to transition away from fossil fuels from words to action.
Brazilian President Luiz Inácio Lula da Silva speaks at COP30, where he promoted the idea of a road map to help the world speed up its transition from fossil fuels to clean energy. AP Photo/Andre Penner)
More than 80 countries said they supported the idea, ranging from vulnerable small island nations like Vanuatu that are losing land and lives from sea level rise and more intense storms, to countries like Kenya that see business opportunities in clean energy, to Australia, a large fossil-fuel-producing country.
I was in Belém for COP30, and I follow developments closely as former special climate envoy and head of delegation for Germany and senior fellow at the Fletcher School at Tufts University. The fight over whether there should even be a road map shows how much countries that depend on fossil fuels are working to slow down the transition, and how others are positioning themselves to benefit from the growth of renewables. And it is a key area to watch in 2026.
The battle between electro-states and petro-states
Brazilian diplomat and COP30 President André Aranha Corrêa do Lago has committed to lead an effort in 2026 to create two road maps: one on halting and reversing deforestation and another on transitioning away from fossil fuels in energy systems in a just, orderly and equitable manner.
What those road maps will look like is still unclear. They are likely to be centered on a process for countries to discuss and debate how to reverse deforestation and phase out fossil fuels.
Over the coming months, Corrêa plans to convene high-level meetings among global leaders, including fossil fuel producers and consumers, international organizations, industries, workers, scholars and advocacy groups.
For the road map to both be accepted and be useful, the process will need to address the global market issues of supply and demand, as well as equity. For example, in some fossil fuel-producing countries, oil, gas or coal revenues are the main source of income. What can the road ahead look like for those countries that will need to diversify their economies?
Nigeria’s Bodo community is suing Renaissance Africa Energy Company Limited, an oil consortium that acquired Shell’s Nigerian subsidiary, over two major oil spills in the Niger Delta in 2008. Shell admitted liability and settled with the community in 2014, committing to cleanup efforts. However, the Bodo community has been critical of the quality and transparency of Shell’s cleanup, and is seeking further damages and remediation. Here, activists protest the company’s actions. Leon Neal/Getty Images
Oil exports consistently provide the bulk of Nigeria’s revenue, accounting for around 80% to over 90% of total government revenue and foreign exchange earnings. At the same time, roughly 39% of Nigeria’s population has no access to electricity, which is the highest proportion of people without electricity of any nation. And Nigeria possesses abundant renewable energy resources across the country, which are largely untapped: solar, hydro, geothermal and wind, providing new opportunities.
What a road map might look like
In Belém, representatives talked about creating a road map that would be science-based and aligned with the Paris climate agreement, and would include various pathways to achieve a just transition for fossil-fuel-dependent regions.
Some inspiration for helping fossil-fuel-producing countries transition to cleaner energy could come from Brazil and Norway.
In Brazil, Lula asked his ministries to prepare guidelines for developing a road map for gradually reducing Brazil’s dependency on fossil fuels and find a way to financially support the changes.
His decree specifically mentions creating an energy transition fund, which could be supported by government revenues from oil and gas exploration. While Brazil supports moving away from fossil fuels, it is also still a large oil producer and recently approved new exploratory drilling near the mouth of the Amazon River.
Norway, a major oil and gas producer, is establishing a formal transition commission to study and plan its economy’s shift away from fossil fuels, particularly focusing on how the workforce and the natural resources of Norway can be used more effectively to create new and different jobs.
Both countries are just getting started, but their work could help point the way for other countries and inform a global road map process.
In the U.S., the Trump administration has made clear through its policymaking and diplomacy that it is pursuing the opposite approach: to keep fossil fuels as the main energy source for decades to come.
The International Energy Agency still expects to see renewable energy grow faster than any other major energy source in all scenarios going forward, as renewable energy’s lower costs make it an attractive option in many countries. Globally, the agency expects investment in renewable energy in 2025 to be twice that of fossil fuels.
At the same time, however, fossil fuel investments are also rising with fast-growing energy demand.
The IEA’s World Energy Outlook described a surge in new funding for liquefied natural gas, or LNG, projects in 2025. It now expects a 50% increase in global LNG supply by 2030, about half of that from the U.S. However, the World Energy Outlook notes that “questions still linger about where all the new LNG will go” once it’s produced.
What to watch for
The Belém road map dialogue and how it balances countries’ needs will reflect on the world’s ability to handle climate change.
Corrêa plans to report on its progress at the next annual U.N. climate conference, COP31, in late 2026. The conference will be hosted by Turkey, but Australia, which supported the call for a road map, will be leading the negotiations.
With more time to discuss and prepare, COP31 may just bring a transition away from fossil fuels back into the global negotiations.
Jennifer Morgan, Senior Fellow, Center for International Environment and Resource Policy and Climate Policy Lab, Tufts University
Incorporating instream flow uses into municipal water supply planning efforts can provide numerous public benefits. This article discusses the framework and opportunity for collaborative instream flow protection in municipal water supply operations.
Colorado’s instream flow program is a dynamic approach to protecting the natural environment that encourages practical and creative solutions to evolving environmental concerns. While water rights typically involve diverting water from the stream, the instream flow program protects water in the stream. Environmental values associated with instream flow uses can work synergistically with municipal water supply operations to realize several public benefits, such as improved water quality, riparian health, urban cooling, resiliency, recreational opportunities, and aesthetic value. As illustrated by the examples discussed later in this article, the instream flow program can facilitate cooperative agreements with municipal water providers for shared beneficial use of our state’s most precious resource.
Water Rights and the Prior Appropriation Doctrine in Colorado
The prior appropriation doctrine governs the ownership and use of water and water rights in Colorado. In simple terms, the prior appropriation system is described as “first in time, first in right.” A water user that has demonstrated an intent to put water to beneficial use first has a vested and prior right to use water in that amount against subsequent water users. This system developed out of necessity during the colonial expansion westward and was influenced by Spanish settlers and early miners to allocate water in the arid environment of Colorado, as an alternative to the more common riparian system of water rights based on land ownership abutting water ways.1
The prior appropriation doctrine has been enshrined in the Colorado Constitution. Article XVI, § 5 dedicates water in Colorado as public property for use by the people, subject to appropriation, and § 6 gives the right to appropriate water for beneficial use in priority.2 The 1969 Water Rights Determination and Administration Act (1969 Act) provides the legal framework for surface and tributary ground water distribution and use under the prior appropriation doctrine.3
An appropriation of a water right under the 1969 Act, as originally codified, meant “the diversion of a certain portion of the waters of the state and the application of the same to a beneficial use.”4 Similarly, beneficial uses were limited to diversions of water from the stream system for extractive uses such as domestic or municipal, irrigation, and manufacturing or industrial activities.5 Environmental uses of water, including instream flows, were not initially addressed in the 1969 Act but were later incorporated through amendments.6
Colorado Instream Flow Program
The Colorado Water Conservation Board (CWCB) was first established by the Colorado legislature in 1937 to protect and develop Colorado’s water resources for the benefit of present and future generations.7 It was not until the national environmental movement in the late 1960s, however, that discussions regarding the value of instream flows and role of the CWCB in the protection of such flows began to garner serious attention and focus.8 In 1973, those discussions culminated in the passage of SB 97 to create the Colorado Instream Flow and Natural Lake Level Program.9 SB 97 was unprecedented at the time and amended the 1969 Act to define beneficial use of a water right to include use by the CWCB for protection of stream flows within a specified reach without a diversion of water from the stream.10
Under the instream flow program, the CWCB has exclusive authority to hold a water right for instream flow uses in Colorado and may appropriate water rights or acquire existing water rights for instream flow, provided that it determines that such water rights are necessary to preserve or improve the natural environment to a reasonable degree.11 Since the program’s inception, the CWCB has appropriated nearly 1,700 instream flow rights across 9,700 miles of stream and completed over 35 water acquisition transactions.12
The General Assembly has reinforced and expanded the CWCB’s ability to acquire water rights for instream flow purposes on several occasions.13 Acquiring and changing senior water rights for instream flows in over-appropriated systems can add great value by preserving the priority date, and therefore the availability, of the water for greater instream flow protection.14 Acquisitions can be donated to or purchased by the CWCB, and the statutory language specifically anticipates potential acquisitions from governmental entities, like municipalities.15 Other free-market developments to the Colorado instream flow program enacted by the state legislature over the years include streamlined processes for loans of water rights for instream flow use, instream flow protection for mitigation releases, and stream flow augmentation plans.16 These developments provide additional opportunities for water users, including municipalities, to participate in the program in support of instream flows.
In addition to implementing the instream flow program, the CWCB is tasked with creating the Colorado Water Plan, which addresses the state’s water challenges through collaborative water planning, including expanded opportunities for instream flow protection.17
Case Studies Along the Front Range
The instream flow program provides reasonable protection of the environment for benefit of the public and is emphasized in the Colorado Water Plan as a balanced approach to addressing environmental needs in the face of climate change.18 Similarly, municipal water service providers, acting in the interest of their respective jurisdictions, must often balance water supply with other public interests. Municipal water projects and water supply planning efforts can be designed to address multiple needs and related uncertainties across a jurisdiction, informed by integrated planning efforts. The various public interests typically considered by municipalities may align with instream flow protection in many respects. The Colorado Water Plan includes several policy considerations that highlight this potential overlap between municipal water interests and instream flows.19
Fundamentally, the Colorado Water Plan encourages a holistic, collaborative approach to water management that balances multiple uses and benefits to meet water shortages throughout the state.20As competition for water resources in Colorado becomes more pronounced with increased demands and costs, the benefits of water sharing and collaboration will also likely increase.21 The Colorado Water Plan focuses on thriving watersheds as an action area to support stream health, recreational uses, resiliency, erosion control, and water quality, all of which provide tangible benefits to municipal water service providers.22 Accordingly, more water in the stream system for instream flows can be a natural complement to a municipality seeking to balance growing water demands with related public interests. The following examples demonstrate how instream flow uses can benefit municipal water supply, and vice versa, to realize this balance in a meaningful way.
Boulder Creek Instream Flow Project
The Boulder Creek instream flow project is a long-standing cooperative project that has been operating in Boulder County for almost 35 years. This project has operated successfully due in large part to the partnership between the City of Boulder and the CWCB and their collaboration with neighboring water users in Boulder County to support environmental stream flows and other uses in the creek.
In the early 1990s, Boulder donated a suite of valuable senior water rights to the CWCB to establish a year-round instream flow program on North Boulder and Boulder Creeks.23 The acquisition was memorialized in a series of donation agreements between Boulder and the CWCB pursuant to CRS § 37-92-102(3), following certain legislative amendments throughout the 1980s that clarified and enhanced the CWCB’s acquisition authority for instream flows.24 Boulder and the CWCB, as co-applicants, also received a water court decree to change the use of the donated rights to include instream flow uses for the project.25
Figure 1. Map depicting locations of instream flow protected reaches along Boulder Creek. Image created by the City of Boulder (Oct. 2018).
The Boulder Creek instream flow project protects three segments from below the Silver Lake Reservoir near the headwaters of North Boulder Creek down to 75th Street in Boulder County (see fig. 1). The donated rights include reservoir releases, bypassed diversions, and changed irrigation ditch shares to support instream flows throughout the year. As part of its donation to the CWCB, Boulder retained the right to use water available under the donated rights (1) for municipal purposes under certain conditions, including drought and emergency conditions in its municipal water supply operations; (2) for municipal purposes anytime they are not needed to meet instream flow amounts; and (3) for beneficial reuse downstream of the protected reaches.26This provides operational flexibility for the city’s municipal water supply while also supporting instream flow uses by the CWCB in most years. Its participation in the Boulder Creek instream flow program has also helped the city address US Forest Service regulatory requirements for bypasses related to its diversions from North Boulder Creek as part of federal permitting for one of its raw water pipelines.27
The City of Boulder has a long-standing environmental ethos that incorporates instream flows into its water supply planning and operations. Boulder’s water supply planning documents from the 1980s identified the goal of supporting instream flows in Boulder Creek to enhance aquatic and riparian ecosystems, reflecting city planners’ prediction that dry-up periods in the creek would become more severe and frequent with increased water demands.28 Subsequent Boulder water supply and land use planning documents have included similar goals focused on balancing instream flows and environmental preservation with municipal water demands and operations, and emphasizing the connection between stream health and reliable drinking water supplies.29
Because the protected stream segments run through the Boulder city limits, and extend both above and below the city, the project benefits water quality, riparian health, and resiliency in the Boulder municipal watershed and water system operations and provides additional environmental benefits to the larger Boulder County community.
Gross Reservoir Environmental Pool Project
The cities of Boulder and Lafayette entered into an intergovernmental agreement in 2010 with Denver Water to establish a 5,000 acre-foot environmental pool in an enlarged Gross Reservoir to augment stream flows in South Boulder Creek.30 Boulder recognized the need to address low flows on South Boulder Creek as a key goal in its planning documents and identified Denver Water’s planned expansion of Gross Reservoir as an opportunity to use upstream storage to establish a robust instream flow program. Lafayette similarly identified Gross Reservoir for potential water storage in its water rights decrees, providing both a water supply and environmental benefit to its operations. The parties proactively agreed to cooperate to mitigate the reservoir expansion’s impacts to aquatic resources in the South Boulder Creek basin by creating and operating the environmental pool.31
Coordinated with municipal water system operations, releases from the environmental pool will allow Boulder and Lafayette to store their decreed water rights for later release to meet specific target flows below Gross Reservoir in South Boulder Creek throughout the year. The segments identified for the target flows include Gross Reservoir to South Boulder Road (Upper Segment, depicted as segments 1 and 2 in fig. 2) and South Boulder Road to the confluence with Boulder Creek (Lower Segment, depicted as segment 3 in fig. 2).32 The agreement also includes provisions to address emergencies such as extended drought or an unexpected problem with water storage, conveyance, or treatment infrastructure to allow for flexibility in operations to meet both target flows and municipal needs.
Boulder’s releases from the environmental pool are protected as instream flows according to a Water Delivery Agreement with the CWCB dated September 9, 2019, and a water court decree entered for Boulder, Lafayette, and the CWCB.33 Water released by Boulder to meet the target flows will be protected for instream flow uses to the extent that such flows do not exceed the amounts that CWCB has determined to be appropriate to preserve the natural environment to a reasonable degree in South Boulder Creek. Boulder’s target flow releases will support CWCB’s existing appropriated instream flow rights up to the specified amounts (see fig. 2). Boulder may then redivert the water downstream of the protected reaches for its municipal uses.
The environmental pool will provide permanent, dedicated storage for water rights owned by Boulder and Lafayette to be released to enhance stream flows in South Boulder Creek prior to downstream uses for municipal purposes by the parties. These operations provide added flexibility, resiliency, and redundancy to the cities’ respective water supply systems. In turn, the enhanced stream flows will benefit 17.3 miles of South Boulder Creek, including Eldorado Canyon State Park, South Boulder Creek Natural Area, and City of Boulder open space lands, and will support native fish populations and riparian and wetland habitats.
Figure 2. Map depicting target flows and reaches for enhanced stream flows on South Boulder Creek. Image created by the City of Boulder (Aug. 7, 2018).
Poudre Flows Project
The Poudre Flows Project is the first stream flow augmentation plan developed pursuant to CRS § 37-92-102(4.5).34 It is a partnership amongst the CWCB; municipalities of Fort Collins, Thornton, and Greeley; Colorado Water Trust; Northern Colorado Water Conservancy District; Cache la Poudre Water Users Association; and Colorado Parks and Wildlife. The project will augment stream flows through a 52-mile reach of the Cache la Poudre River, with an overarching goal to improve river health (see fig. 3).35 The concept was first envisioned as part of the Poudre Runs Through It working group, a collaborative group of diverse partners and stakeholders in the Poudre River.36 The City of Fort Collins planning priorities incorporate similar goals, including to “[p]rotect community water systems in an integrated way to ensure resilient water resources and healthy watersheds.”37
The project anticipates that the CWCB, through agreements with water right owners, including Fort Collins and Greeley, will use previously changed and quantified water rights owned by these municipalities and potentially others to augment stream flows in six segments of the Poudre River spanning from Canyon Gage to the confluence with the South Platte River.38 Besides the instream flow protection of the environment to a reasonable degree, project partners have identified numerous additional benefits such as connectivity for fish passage and decreased temperatures and nutrient concentrations, all while avoiding impacts to existing water rights and operations.39
By integrating water supply planning with a holistic approach to water development and management that provides multiple public benefits, municipalities can become strong partners with the CWCB. Together, they can help protect instream flows and balance growing water demands and future uncertainties with the environmental values that make Colorado a beautiful place to live.
1. See generallyCoffin v. Left Hand Ditch Co., 6 Colo. 443, 447 (Colo. 1882).
2. Colo. Const. Art. XVI, §§ 5–6. See also Colo. River Water Conservation Dist. v. CWCB, 594 P.2d 570, 573 (Colo. 1979) (“The reason and thrust for this provision was to negate any thought that Colorado would follow the riparian doctrine in the acquisition and use of water.”).
9. SB 97, 49th Gen. Assemb., Reg. Sess. (Colo. 1973). See CRS § 37-92-102(3).
10. Bassi, supra note 6 at 398. See also Colo. River Water Conservation Dist., 594 P.2d at 576. SB 97 was carefully drafted to provide environmental protection through the CWCB, as a fiduciary to the public, without inviting riparian rights for adjacent landowners. Id. The Colorado Supreme Court reiterated this important distinction in St. Jude Co. v. Roaring Fork Club, LLC, 351 P. 3d 442 (Colo. 2015), ruling that a diversion from a steam for private instream flows is a “forbidden right” contrary to the prior appropriation doctrine; only the CWCB, with strict limitations identified by the general assembly, can hold an instream flow right for the benefit of the public. Id. at 451.
11. CRS § 37-92-102(3) (The CWCB is “vested with exclusive authority, on behalf of the people of the state of Colorado, to appropriate . . . such waters of natural streams . . . as the board determines may be required for minimum streamflows . . . to preserve the natural environment to a reasonable degree.” The board also may acquire water rights “in such amount as the board determines is appropriate for streamflows . . . to preserve or improve the natural environment to a reasonable degree.”). Legislation enacted in 2002 expanded the Colorado instream flow program to provide that water rights may also be used by the CWCB to improve the natural environment (and not just for preservation purposes). Bassi, supra note 6 at 391.
14. Id. at 406. The Colorado Water Trust was formed in 2001 to support Colorado’s instream flow program by promoting voluntary, market-based efforts to restore stream flows in Colorado’s rivers. The Water Trust has been instrumental in facilitating and streamlining the acquisition of water rights from willing partners for use by the CWCB. Seehttps://coloradowatertrust.org.
16. See generally CRS §§ 37-83-105, 37-92-102(8), 37-92-102(4.5).
17. The Colorado Water Plan was adopted by the CWCB in 2023 as a framework for decision-making to address water challenges and build resiliency in the state. The 2023 Water Plan is an update to the first iteration of the plan released in 2015. Seehttps://cwcb.colorado.gov/colorado-water-plan.
18. SeeSt. Jude Co., 351 P. 3d at 449 (in its use of water for instream flows, the CWCB has a “‘statutory fiduciary duty’ to the people . . . to both protect the environment and appropriate only the minimum amount of water necessary to do so . . . .”).
20. See id. at 217–19, 231, 233 (“All areas of the Water Plan are interconnected, and projects need to consider multi-purpose, multi-benefit solutions.”).
21. See id. at 217 (“Multi-purpose projects better address water supply challenges across municipal, agricultural, environmental, and recreation sectors as they occur.”).
22. See id. at 181, 204–07 (stream health and related environmental benefits can enhance municipal supply or improve the quality of life in urban areas).
23. See Decree, In re Application for Water Rts. of the Colo. Water Conservation Bd. on Behalf of the State of Colo. and Water Rts. of the City of Boulder, No. 90CW193 (Colo. Water Div. 1, Dec. 20, 1993).
30. See Decree, In re Application for Water Rts. of City of Lafayette, City of Boulder, and Colo. Water Conservation Bd. in Boulder Cnty., No. 17CW3212 (Colo. Water Div. 1, Feb. 11, 2021). The author represented the City of Boulder in Case No. 17CW3212 and was involved in prosecuting the case and negotiating the underlying agreement with CWCB.
31. Denver Water’s enlargement of Gross Reservoir is the subject of pending litigation.
32. The target flows and target reaches are based on previously collected data and analysis by Colorado Parks and Wildlife using the R2Cross method, which supported CWCB’s previous instream flow appropriations.
38. See Application, In reApplication for Water Rts. of Cache La Poudre Water Users Ass’n, City of Fort Collins, City of Greeley, Colo. Water Tr., N. Colo. Water Conservancy Dist., City of Thornton and Colo. Water Conservation Bd. in Larimer and Weld Cntys., No. 21CW3056 (Colo. Water Div. 1 Apr. 29, 2021).
After Coloradan U.S. House Reps. Lauren Boebert and Jeff Hurd saw their Finish the Arkansas Valley Conduit Act approved unanimously by Congress in December, they were stunned when President Donald Trump — once a proponent of the project — vetoed it…After the rejection of the legislation sponsored by Boebert, the former 3rd Congressional District representative and co-sponsored by Hurd, the district’s current representative, they sought a rare move for Congressional Republicans in the Trump era: a veto override that could have defied the president. A vote on the veto override was held in the House on Thursday, needing two-thirds of voters to vote “yes” to pass. It ultimately failed with 249 “yes” votes and 176 “no” votes, with one “present” vote, around 8% short of the threshold for passage. All 213 Democrats voted to back the override, while 36 Republicans backed the override but 176 did not. Five Republicans did not vote…
Boebert’s bill, H.R. 131, would have provided communities in the region more time and flexibility to repay the federal government by extending repayment periods and lowering interest rates. In his veto decision, Trump cited financial concerns, but on the House floor, both Boebert and Hurd emphasized that the bill would not expand the project, authorize new construction or increase federal share. Per Boebert, the U.S. Bureau of Reclamation found that Arkansas Valley drinking water has such high levels of radium, uranium and other pollutant contamination that people in the area could see the cost of drinking water triple without this legislation.
“Contrary to what the veto message states, my bill does not authorize any additional federal funding. It simply modifies the repayment terms for small rural communities in my district so they’re able to afford their 35% cost share of the project that they are statutorily obligated to repay,” Boebert said…
Hurd said that rural Colorado and rural America voted “overwhelmingly” for Trump because they didn’t want to be forgotten by the government, adding, “They expected Washington to keep its word, not abandon them midway.” He also expressed concern about the precedent a failed veto override would set, not just for the rest of Trump’s term but moving forward on Capitol Hill. This was a similar, though less alarmingly phrased, point as Neguse earlier stating, “No state is safe from political retaliation.”
Arkansas Valley Conduit map via the Southeastern Colorado Water Conservancy District (Chris Woodka) June 2021.
Click the link to read the article on the Pagosa Springs Sun website (Clayton Chaney and Randi Pierce). Here’s an excerpt:
January 7, 2026
Snowpack and stream flow
According to data from the Natural Resource Conservation Services (NRCS), as of 1 p.m. on Wednesday, Jan. 7, the Wolf Creek Pass site at 10,930 feet had a snow water equivalent of 7.6 inches, compared to that date’s median of 15.5 inches. This is up from the Dec. 31, 2025, report of 7 inches. The current amount is 49 percent of that date’s median snow water equivalent…The San Miguel, Dolores, Animas and San Juan River basins were measured to be at 49 percent of its 30-year median snowpack as of December 31, 2025, and at 56 percent on January 7, 2026…
In Pagosa Springs, U.S. Geological Survey for the San Juan River at Pagosa Springs has showed record flows multiple times since the start of the year. For example, at 9 a.m. on Jan. 2, the river was running at 128 cubic feet per second (cfs), which compares to a median of 53 cfs and a previous high of 118 in 1986. At 11 a.m. on Jan. 5, the river was running at 119 cfs, which compares to a median for that date of 54.5 cfs and a previous max value of 116 in 1987. By 11 a.m. on Wednesday, Jan. 7, the river was flowing at 111 cfs. The Jan. 7 median is 55, and the record high is 116 cfs, which was recorded in 1987. According to the U.S. Drought Monitor’s most recent map released on Dec. 31, 2025, 100 percent of Archuleta County is in an “abnormally dry” drought stage.
Total precipitation (inches) from 9-15 October 2025 with gridded data from the PRISM Climate Group and observations from the Community Collaborative Rain, Hail, and Snow (CoCoRaHS) network.
On January 6, 2026 Town of Pagosa Springs staff informed the Pagosa Springs Town Council about the town’s ongoing flood recovery funding efforts in the wake of the Federal Emergency Management Agency’s (FEMA’s) denial of the town’s request for $5.7 million to aid cleanup efforts. Development Director James Dickhoff and Projects Manager Kyle Rickert were both on hand to walk the council through various other funding opportunities, with Dickhoff stating, “We are not counting on FEMA money to come through to us” after the denial on Dec. 21, 2025. Dickhoff stated that staff just wanted to inform the council “on where we are at” regarding the town’s relief funding efforts from the October 2025 flooding…
The total project cost of river cleanup and restoration following the October flood event is estimated to be just shy of $6 million, stated Town Manager David Harris in correspondence. Rickert explained that, with the FEMA funding off the table, the town is pursuing several state grants, and possibly a state loan, as well as two other federal funding programs. Dickhoff added that if the town wanted to pursue “the loan opportunity through the Colorado Water Conservation Board (CWCB),” the council would need to put it before the voters in an upcoming spring election to be legally eligible to take out the loan…
Rickert explained that the federal Emergency Watershed Protection had awarded the town about $3.3 million and the Colorado Office of Emergency Management awarded $463,504 in funds. These funds will go toward embankment stabilizations near the Pagosa Springs History Museum and near 6th Street, pedestrian bridge abutment stabilization at Centennial Park, restoring the River Center ponds, as well as Apache Street bridge repairs and log jam removals, all coming with a total project price tag of $4,178,038, the slideshow states…
He added, “The river is an important part of our tourism portfolio and we need to get it cleaned up” and make it safe for those recreating in the river before summer hits. Rickert then informed the council about a Colorado Parks and Wildlife (CPW) Fishing is Fun grant that the town has requested in the amount of $328,603. This grant would go toward dredging the River Center ponds, a headgate replacement at Pond #1 (the east pond), ditch restoration, debris and sediment removal upstream of town limits to the future 1st Street pedestrian bridge, as well as rebuilding rock structures in the same area. Rickert noted that the town was also awarded $15,000 from History Colorado Emergency Grant for its ongoing efforts to stabilize the river bank near the museum…One or possibly two water gauge stations would give the town an estimated two hours of warning time as water levels rise during another flood event, providing historic data as part of the U.S. Geological Survey monitoring system, she noted. This grant application would be due by Jan. 31, so she asked the council to pass a resolution supporting the CWCB river gauge grant, which the council passed unanimously.
The San Juan River has peaked above 8,000 cfs twice in the last several days, reaching the highest levels seen since the 1927 flood. Source: USGS.
Five years ago today, President Donald Trump incited an angry mob of his followers to attack the nation’s Capitol building in an attempt to overturn the presidential election that he had just lost. He was trying to launch a coup to overthrow America’s democracy. At the time, many of us expected him to be impeached, and maybe even go to jail for this deplorable act. Little could we have guessed that just half a decade later he’d not only be President once again, but would actually be succeeding in his bid to dismantle democracy, and would be doing it with the tacit and explicit support of Congress, the Supreme Court, and his many supporters who don’t seem to be bothered by his cognitive decline, authoritarianism, broken promises, lies, close association with a convicted sex trafficker and pedophile, disregard for the Constitution, and reckless tinkering with the U.S. economy, international affairs, and his constituents’ well-being.
The administration’s invasion of Venezuela is simply the latest, most egregious example. The military went in, lit up Caracas with explosives and gunfire, killed civilians, kidnapped the nation’s leader (who, admittedly, was a nasty authoritarian), and sowed chaos, all without authorization from Congress. The reason? Trump himself says it was to turn the country’s vast oil reserves over to American corporations, which donated generously to Trump’s campaign. But Trump and his minions were equally motivated by the need to stroke Trump’s fragile ego — which has taken a beating thanks to other failures and low approval ratings, and to distract from his ubiquity in the Epstein files (which the DOJ has yet to release as Congress ordered it to do). Don’t be surprised if they invade Greenland or Cuba or even Mexico, next, as stupid as such a scenario might be.
But let’s focus on the oil factor, since that’s the one that’s most likely to trickle down into the Land Desk beat.
Venezuela has a lot of oil, reportedly the largest proved reserves in the world, and it’s mostly made up of heavy, sour crude (more on this in a minute). It’s currently not extracting very much of that oil, for various reasons (the U.S. produces about 20 times more per day than Venezuela). Trump is encouraging American oil companies to go to Venezuela and develop the oil fields and upgrade the infrastructure. This will take time and money, and it’s not clear that petroleum corporations will be interested in this kind of investment while oil prices are low (as they are, currently). Prices are low because demand and supply are more or less balanced, meaning the world doesn’t really need Venezuelan’s oil — at least not now.
Like fine wine, oil is imbued with terroir. That is, its composition varies depending on where it’s from. Most U.S.-produced oil is tight (from tight shales), light (low density), sweet (low sulfur content) crude that requires less processing than heavy (dense), sour (high sulfur) crude. Thing is, many Gulf Coast refineries were constructed before the shale revolution and are equipped to process heavy, sour crude, like the kind that comes from Venezuela. So there is a domestic demand for the stuff.
The active drilling rig count, the most accurate indicator of oil and gas activity, remains stagnant, despite Trump’s call to “drill, baby, drill,” thanks to persistently low oil and gas prices. If Venezuelan oil production increases — and that remains a big “if” — it could further deflate crude prices and dampen enthusiasm for domestic drilling. Source: Baker Hughes
If and when Venezuelan production increases, it will add supply to both the global and domestic markets, which could bring prices down even further. That will lower the cost of driving American gas guzzlers around, and increase greenhouse gas emissions and other pollutants, but it will also reduce incentives to drill new wells, which could ease industry pressure on public lands in the U.S. In the meantime, the Trump administration continues to issue drilling permits at a blistering rate, even though companies aren’t all that interested in using them.
Last week, the Durango Herald quoted a National Weather Service meteorologist as saying that the snowpack in the southwestern part of the state was “not too bad.” I guess that depends on your definition of “not too bad.” Because it sure as heck isn’t looking good!
Red Mountain Pass has about half as much snow as it normally does this time of year. Only 1990, 2000, and 2018 rivaled this year for meagre snow levels. Source: NRCS.
The San Juan Mountain snowpack levels are currently at about 50% of normal for the first week of January, and they are tied for third lowest snowpack level on record for this date. That’s not “too bad,” it’s downright dismal. And snow cover is even more meagre in other parts of the state: The Colorado River’s headwaters SNOTEL station is experiencing the lowest snowpack since it started recording in 1986.
No bueno! Source: NRCS.
Still, it may be too early for snow lovers to abandon hope altogether, since a full recovery would not be unprecedented. Take the winter of 1989-90, when the early January snowpack was even worse than it is now. It was my first year in college, and when I came home for Christmas we played volleyball and went hiking in the mostly bare La Plata Mountains instead of going sledding or skiing. (At the time it seemed downright apocalyptic, since it followed the unusually wet 1980s, when snow would pile up in Durango and halt car traffic and turn the streets into nordic ski tracks.) But that March the snows finally came and continued into May, leading to some nice spring skiing and a decent spring runoff. The snowpack of 95-96 followed a similar pattern, as did 1999-2000.
During those years, however, the lack of snow was caused by a lack of precipitation. This year, it’s the result of a combination of light winter precipitation and unusually warm temperatures throughout December and early January. A recovery will require not only more snowfall, but also cooler temperatures, making the outlook a little grimmer.
The Upper Colorado River region has experienced some of its highest daily average temperatures on record this winter. On Christmas Eve, the daily average was a whopping 18° F higher than the median for that day. Source: NRCS.
Parts of the West were hit with five or six times as much precipitation than normal in December, but temperatures were above normal almost everywhere, too, diminishing snowpack. Source: Western Regional Climate Center.
The Phillips Bench SNOTEL station near Teton Pass, Wyoming, shows how the atmospheric rivers have helped the snowpack their rebound.
As of mid-December, the snow drought covered most of the West, but a series of atmospheric rivers pounded the West Coast and the Northern Rockies, bringing snow to higher elevations and more northern latitudes (and big rain and flooding to California). Heavy, wet snow piled up on Teton Pass near Jackson, Wyoming, bringing snow water equivalent levels from far below average to above normal for this date. Road crews triggered a huge avalanche that covered the highway in about 30 feet of snow. And, after the skies cleared, a couple of backcountry skiers triggered a slide near Teton Pass; one of the skiers was caught, buried, and killed. It was the nation’s second avalanche-related fatality this season. A few days later, two Mammoth Mountain ski patrollers were caught in a slide while doing avalanche mitigation work and one of them died.
🗺️ Messing with Maps 🧭
Now for a little New Year’s treat for all of you weather/map nerds: The Colorado Avalanche Information Center has launched an interactive map that shows 24-hour and 48-hour snowfall and snow water equivalents at various locations across the state’s mountains, letting you see at a click where the good powder is and isn’t. You can click on each station and get all the details, including current temperature and snow depth.
The Bureau of Reclamation today released a draft Environmental Impact Statement evaluating a range of operational alternatives for managing of Colorado River reservoirs after 2026, when the current operating agreements expire. The draft EIS evaluates a broad range of potential operating strategies. It does not designate a preferred alternative, ensuring flexibility for a potential collective agreement.
Prolonged drought conditions over the past 25 years, combined with forecasts for continued dry conditions, have made development of future operating guidelines for the Colorado River particularly challenging.
“The Department of the Interior is moving forward with this process to ensure environmental compliance is in place so operations can continue without interruption when the current guidelines expire,” Assistant Secretary – Water and Science Andrea Travnicek said. “The river and the 40 million people who depend on it cannot wait. In the face of an ongoing severe drought, inaction is not an option.”
The draft EIS evaluates a broad range of operational alternatives for post-2026 reservoir management informed through input and extensive collaborative engagement with stakeholders, including the seven basin states, tribes, conservation organizations, other federal agencies, other Basin water users, and the public. It includes the following alternatives that capture operational elements and potential environmental impacts:
No Action
Basic Coordination
Enhanced Coordination
Maximum Operational Flexibility
Supply Driven
The document will be published in the Federal Register on January 16, 2026, initiating a 45-day comment period that will end on March 2, 2026. The draft EIS and additional information on the alternatives are available on Reclamation’s website.
“Given the importance of a consensus-based approach to operations for the stability of the system, Reclamation has not yet identified a preferred alternative,” said Acting Commissioner Scott Cameron. “However, Reclamation anticipates that when an agreement is reached, it will incorporate elements or variations of these five alternatives and will be fully analyzed in the Final EIS enabling the sustainable and effective management of the Colorado River.”
The Colorado River provides water for more than 40 million people and fuels hydropower resources in seven states. It serves as a vital resource for 30 Tribal Nations and two Mexican states, sustaining 5.5 million acres of farmland and agricultural communities throughout the West, while also supporting critical ecosystems and protecting endangered species.
The Draft EIS addresses only domestic river operations. A separate binational process addressing water deliveries to Mexico is underway and the Department is committed to continued collaboration with the Republic of Mexico. The Department will conduct all necessary and appropriate discussions regarding post-2026 operations and implementation of the 1944 Water Treaty with Mexico through the International Boundary and Water Commission in consultation with the Department of State.
To provide certainty for communities, tribes, and water users, a decision regarding operations after 2026 will be made prior to October 1, 2026 – the start of the 2027 water year.
Photo shows Lake Mead with a water elevation of 1078. Credit: USBR
Udall/Overpeck 4-panel Figure Colorado River temperature/precipitation/natural flows with trend. Lake Mead and Lake Powell storage. Updated through Water Year 2025. Note the tiny points on the annual data so that you can flyspeck the individual years. Credit: Brad Udall
The consensus-based effort to develop new rules to manage the Colorado River system hasn’t worked – it’s time for a new approach
Federal leadership and the credible threat of managing reservoirs to protect the system is that new approach
Missing Deadlines
Way back at the end of the last century, at the annual Colorado River conference in Vegas, Marc Reisner repeated the Margaret Thatcher quote that consensus is the absence of leadership. On Veterans Day, the seven Colorado River basin states missed yet another deadline to reach consensus on a conceptual plan for managing the shrinking Colorado River after the current rules expire in 2026. Valentine’s Day marks the next holiday deadline, this time for a detailed plan, but multiple missed deadlines give no indication that the states will reach consensus then, either.
The basin state negotiators have met for years behind closed doors, without success. It’s time for a new approach. Aggressive federal intervention and the credible threat of a federally-imposed Colorado River management plan would offer political cover – or a political imperative – for the negotiators. The credible threat of a federal plan would give the negotiators the space to compromise without having to do so unilaterally and then being accused of not protecting their state’s interests.
But federal leadership alone is not enough – it must be coupled with a plausible federal plan that compels the states to act and can meet the magnitude of the ongoing crisis. As the Department of the Interior announced in its 6/15/2023 press release, the purpose of and need for the post-2026 guidelines is “to develop future operating guidelines and strategies to protect the stability and sustainability of the Colorado River.” To date, the development of the post-2026 guidelines has prioritized routine operations of Glen Canyon and Hoover dams over the system as a whole, a focus inconsistent with the magnitude and urgency of the problem. Prioritizing routine dam operations and hydropower generation over water delivery and environmental protection elevates the tool over the task. Seeking to preserve routine operations of the dams while imposing draconian cuts on water users is not a path to resilience and precludes alternatives that would help stabilize the system.
The Plan
Instead, by early next year, the Secretary should announce that Interior will implement a federal plan incorporating the following elements:
As a condition precedent, the Lower Basin states agree not to place a “compact call” for the duration of the agreement.
Implement annual Lower Basin water use reductions for the following calendar year based on total system contents on August 1:
75% – 60%: cuts to Lower Basin water uses increasing from 0 to 1.5 MAF<60% – 38%: static cut to Lower Basin water uses of 1.5 MAF<38% – 23%: increasing cuts to Lower Basin water uses of up to 3.0 MAF total
below 23% of total system contents – cut Lower Basin water uses to the minimum required to protect human health and safety and satisfy present perfected rights
If the Lower Basin states do not satisfy the condition precedent in #3 above, Reclamation limits Lower Basin deliveries to the minimum required to satisfy present perfected rights when total system contents are <75%.
Recover water stored in federal Upper Basin reservoirs unless the Upper Basin states reduce annual water use based on total system contents:
<34% – 23%: Assuming the first 0.25 MAF “reduction” would be contributed by the elimination of Powell’s evaporative losses and gains from Glen Canyon bank storage, reduce Upper Basin water uses up to 0.65 MAF
below 23% of total system contents – limit total Upper Basin water uses to 3.56 MAF (the minimum volume reported this century)
Expand the pool of parties eligible to create Intentionally Created Surplus (ICS) beyond existing Colorado River contractors, to include water agencies and other entities with agreements to use Colorado River water.
Eliminate the existing limits on the total quantity of Extraordinary Conservation ICS and DCP ICS that may be accumulated in ICS and DCP ICS accounts, while maintaining existing limits on delivery of such water.
Fully mitigate the on-stream and off-stream community and environmental impacts of the water use reductions identified above.
After a three-year phase-in period, condition Colorado River diversions on a clear “reasonable and beneficial use” standard predicated on existing best practices for water efficiency, including but not limited to the examples listed below (state(s) that already have such standards):
Require removal of non-functional turf grass (California, Nevada)
Incentivize landscape conversion and turf removal statewide (California, Colorado, Utah)
Adopt stronger efficiency standards for plumbing and equipment (Colorado, California, and Nevada)
Require urban utilities to report distribution system leakage, and to meet standards for reducing water losses (California)
Require all new urban landscapes to be water-efficient (California)
Require metering of landscape irrigation turnouts (Utah)
Ensure that existing buildings are water-efficient when they are sold or leased (Los Angeles, San Diego)
Require agricultural water deliveries to be metered and priced at least in part by volume (California)
Many of the elements listed above raise important questions about federal authorities, accounting and data challenges, the roles and obligations of state water officials to implement coordinated actions in-state, water access for disadvantaged communities, environmental compliance, and potential economic and social costs, among others. For each item listed, many details will need to be refined. Similarly, the plan’s duration will need to be determined. But as temperatures again climb into the high 40s in the Rockies near the Colorado River’s headwaters (in mid-December!), drying soils and reducing next year’s runoff, and the National Weather Service issues red flag fire warnings for Colorado’s Front Range, the need for bold action is clear.
The Dominy Bypass
Recovering water stored in Lake Powell will require the construction of new bypass tunnels around Glen Canyon Dam. Former Reclamation Commissioner Floyd Dominy sketched the design of such tunnels almost thirty years ago (see image). Such tunnels would enable the recovery of about 5.6 MAF of water stored below the minimum power pool elevation – more water than the Upper Basin states consume each year. Current operating rules and the scope of the current planning process effectively treat this massive volume of water as “dead storage” – a luxury the system can no longer afford. After Reclamation constructs the bypass tunnels, water recovery should be timed to maximize environmental and recreational benefits in the Grand Canyon.
John Wesley Powell at his desk—same desk used by the USGS Director today via the USGS
Running the River
Almost 160 years ago, John Wesley Powell – the reservoir’s namesake – demonstrated bold leadership, going where no (white) man had gone before. With leadership and a clear goal, he charted a route through the Colorado River’s iconic canyons. Now is the time for more bold leadership, a clear goal, and a plan to get there.
About the author
Michael Cohen. Photo credit: Pacific Institute
Since 1998, Michael Cohen’s work with the Pacific Institute has focused on water use in the Colorado River basin and delta region and the management and revitalization of the Salton Sea ecosystem. Michael received a B.A. in Government from Cornell University and has a Master’s degree in Geography, with a concentration in Resources and Environmental Quality, from San Diego State University.
Map of the Colorado River drainage basin, created using USGS data. By Shannon1 Creative Commons Attribution-Share Alike 4.0
Arkansas Valley Conduit map via the Southeastern Colorado Water Conservancy District (Chris Woodka) June 2021.
Click the link to read the article on The Denver Post website (Kevin Freking and Nick Coltrain ). Here’s an excerpt:
January 8, 2026
Rep. Lauren Boebert, who sponsored bill, pushed president in November to release Jeffrey Epstein files
The U.S. House refused Thursday to override President Donald Trump’s vetoes of two low-profile bills — including one that would help pay for a water pipeline in Colorado — as Republicans stuck with the president despite their prior support for the measures. Congress can override a veto with support from two-thirds of the members of the House and the Senate. The threshold is rarely reached. In this case, Republicans opted to avoid a fight in an election year over bills with little national significance, with most GOP members voting to sustain the vetoes. The two vetoes were the first of Trump’s second term. One bill was designed to help local communities finance the construction of a pipeline to provide water to tens of thousands in southeastern Colorado. The other designated a site in Everglades National Park as a part of the Miccosukee Indian Reservation…
On the Colorado bill, 35 Republicans sided with Democrats in voting for an override — with all members of the state’s delegation from both parties supporting an override. On the Florida bill, only 24 Republicans voted for the override. The White House did not issue any veto threats prior to passage of the bills, so Trump’s scathing comments in his recent veto message came as a surprise to sponsors of the legislation. Ultimately, his vetoes had the effect of punishing backers who had opposed the president’s positions on other issues. The water pipeline bill came from Republican Rep. Lauren Boebert of Colorado, a longtime Trump ally who broke with the president in November to release files on convicted sex offender Jeffrey Epstein. The bill to give the Miccosukee Tribe of Indians more control of some of its tribal lands would have benefited one of the groups that sued the administration over an immigration detention center known as “Alligator Alcatraz.”
It doesn’t matter if you’re a full-time ski bum, a longtime resident, or a first time visitor — the ramifications of the distressing 2025-26 winter on the Western Slope impacts everyone. The combination of unseasonably warm temperatures and jarring lack of snow has created a perfect storm — or lack thereof — and will continue to impact agriculture, recreation, and potable water for over 30 million people long after the 2025-26 winter concludes. Brendon Langenhuizen, the Director of Technical Advocacy for the Colorado River Water Conservation District, compared the snowpack to a reservoir but said the extreme heat is detracting from the benefits of a natural reserve.
Westwide SNOTEL basin-filled map January 8, 2026.
“How warm it’s been has been a concern for me, because snowpack is really a big reservoir for us,” he said. “You can hold that water for the warmer times of the year and then it slowly runs off or melts into the deltas and then comes back into the rivers later in the summer when we need it for crops and water temperatures and recreation.
“If we have these really warm temps continuing, it just diminishes the snowpack and we can’t hold as much snow into the spring — making it so even if we had the moisture, we wouldn’t be able to hold it.”
[…]
According to a Colorado Climate Center graph, parts of Colorado experienced some temperatures exceeding averages by double digits during the first week of January. The graph shows all of Garfield County experienced average temperatures at least eight degrees hotter than average, with northern Garfield County facing average temperatures at least 12 degrees hotter than average. He continued to explain that there was already evidence of a fast runoff, using the Dotsero marker on the Colorado River as reference…Although the area has finally experienced some precipitation since the calendar flipped to 2026, the temperatures aren’t letting a solid base build in the higher alpines – further threatening the snowpack. Walter admitted that every little bit helps, but doesn’t think the recent storms were enough to move the needle, especially since the forecast dries out after Thursday night.
As guests ski and ride down Schoolmarm, a stretch of beginner-friendly terrain at Keystone Resort in Colorado, they are treated to views of Dillon Reservoir nearly the whole way down. More eagle-eyed skiers and riders will notice that snowmaking machines line the run’s three miles, which spans from summit to base.
On a sunny, cloudless November day, it’s one of the resort’s only accessible ski runs with much of the credit going to those machines.
“It gives pretty much everybody the ability to ski here on day one,” said Kate Schifani, the resort’s senior director of mountain operations. She says Keystone is super focused on that early opening day.
“We are the first resort in the country to open,” she said, referring to the 2025 season. “So we put a lot of stock in what we can do early-season, and having great snowmaking helps us do that.”
It’s a familiar problem for Rocky Mountain ski resorts over the last 20 years, which have become increasingly prone to scant early season snow. [ed. emphasis mine] Many have chosen to stick with their traditional opening days near the Thanksgiving holiday and take the gamble that snow might arrive in time. To match their guests’ demands for skiable acreage amid a warming climate, resorts are doubling down on snowmaking technology and acquiring the water rights needed to make it happen.
Winter is off to a slow start across the West this year. Snowpack is below average in every major river basin across the entire region. That’s a concern for ski resorts, many of which have delayed their opening days. That includes Jackson Hole in Wyoming, Alta in Utah, and Beaver Creek, just down the highway from Keystone.
Human-caused climate change has changed the way precipitation falls in the mountains, especially in autumn. As more early season storm clouds bring rain instead of snow, resorts are increasingly relying on snowmaking to give their guests the ability to ski at all.
But this year, it wasn’t just a lack of snow that caused resorts headaches. November was warm as well, which also affects snowmaking operations. Throughout the Upper Colorado River Basin, temperatures were anywhere from five to eight degrees above average, with much of Utah setting records. Denver logged its warmest November day ever this year.
Schifani said ideally, snowmaking happens when it’s colder than 28 degrees.
“So it’s 32.7 degrees right now,” she said, checking the temperature on a monitor attached to one of the snow guns at the top of the River Run gondola. “So we’re just a little too warm for snowmaking.”
Keystone made upgrades to its snowmaking system in 2019, so all of its guns are relatively new. Each one has a weather system built into it, detecting temperature and relative humidity. They’re all automated, so when it finally drops below 28 degrees, the guns turn on with a loud rumble.
“This gun will know as it gets colder, we can add more water, we can make more snow,” Schifani explained. “As it gets warmer, we cut back on the water, we make a little bit less snow until it gets too warm for us to make snow at all.”
Once it’s cold enough, man-made snow takes about two parts compressed air and one part water. Unlike other uses in the West that transport water over long distances to sprawling cities or faraway farm fields, snowmaking keeps water close to where it originated.
Steven Fassnacht, a professor of snow hydrology at Colorado State University, said that about 80% of the water used in snowmaking goes back into the watershed it came from.
“[Ski resorts] are taking water out of the river, out of a reservoir … and they’re putting it on the mountain and they’re storing it somewhere different for the winter,” he said. “So the actual use, we call it consumptive use, the amount of water that leaves the system is relatively small.”
But that use still matters in a region where every drop of water is accounted for. Fassnacht said it will matter even more as the region’s climate gets warmer and drier, and as competition for water ramps up.
“In drier conditions, maybe that water use — possibly, likely — that consumptive use is actually going to increase,” he said. “And it may be harder to actually get that water out of the system to put on the mountains.”
Ski areas’ water usage can get contentious. Telluride Resort is currently in a dispute with the town of Mountain Village over its water use, and a federal court recently dismissed a lawsuit from Purgatory, a resort near Durango, over accessing decades-old groundwater rights on Forest Service land.
Chris Cushing is a principal with the consulting firm SE Group, which works on mountain planning for resorts across the country.
He recently worked with Deer Valley in Utah on a massive expansion: the resort added ten new chairlifts and doubled its skiable terrain, which it plans to open this season — with a state of the art snowmaking system.
“It’s just massive, it’s literally building a new ski resort,” he said of the expansion, which is called East Village.
Cushing says the expansion was only possible because the land acquired by Deer Valley already had water rights allocated to it — a calculation many other resorts he works with are having to factor in their plans as well.
“Absolutely the first question I ask is, ‘what’s your water situation?’” he said.
Long-term drought means ski resorts aren’t just in the game of acquiring new supplies, but also how to make the water they do have go further.
In 2023, Keystone added a new chairlift, providing skiers and riders easier access to its Bergman Bowl, which used to be an area only hikers could reach. Schifani says the resort expanded its snowmaking system to blanket that area at will too.
“But for perspective, that didn’t take any more water than we had previously used because we just got better at using what we already have,” she said.
It’s not yet clear what this winter will bring for the ski industry, but resorts, like other water users across the West, will have to prepare for the reality of doing more with less.
This story was produced in partnership with The Water Desk at the University of Colorado Boulder Center for Environmental Journalism.
Much of the western U.S. has started 2026 in the midst of a snow drought. That might sound surprising, given the record precipitation from atmospheric rivers hitting the region in recent weeks, but those storms were actually part of the problem.
To understand this year’s snow drought – and why conditions like this are a growing concern for western water supplies – let’s look at what a snow drought is and what happened when atmospheric river storms arrived in December.
It can also create water supply problems the following summer. The West’s mountain snowpack has historically been a dependable natural reservoir of water, providing fresh water to downstream farms, orchards and cities as it slowly melts. The U.S. Geological Survey estimates that up to 75% of the region’s annual water supply depends on snowmelt.
Snowpack is typically measured by the amount of water it contains, or snow water equivalent. The numbers show each location’s snowpack compared to its average for the date. While still early, much of the West was in snow drought as 2026 began. Natural Resources Conservation Service
Snow drought is different from other types of drought because its defining characteristic is lack of water in a specific form – snow – but not necessarily the lack of water, per se. A region can be in a snow drought during times of normal or even above-normal precipitation if temperatures are warm enough that precipitation falls as rain when snow would normally be expected.
This form of snow drought – known as a warm snow drought – is becoming more prevalent as the climate warms, and it’s what parts of the West have been seeing so far this winter.
How an atmospheric river worsened the snow drought
Washington state saw the risks in early December 2025 when a major atmospheric river storm dumped record precipitation in parts of the Pacific Northwest. Up to 24 inches fell in the Cascade Mountains between Dec. 1 and Dec. 15. The Center for Western Weather and Water Extremes at Scripps Oceanographic Institute documented reports of flooding, landslides and damage to several highways that could take months to repair. Five stream gauges in the region reached record flood levels, and 16 others exceeded “major flood” status.
Yet, the storm paradoxically left the region’s water supplies worse off in its wake.
The reason was the double-whammy nature of the event: a large, mostly rainstorm occurring against the backdrop of an uncharacteristically warm autumn across the western U.S.
Vehicles were stranded as floodwater in a swollen river broke a levee in Pacific, Wash., in December 2025. Brandon Bell/Getty Images
Atmospheric rivers act like a conveyor belt, carrying water from warm, tropical regions. The December storm and the region’s warm temperatures conspired to produce a large rainfall event, with snow mostly limited to areas above 9,000 feet in elevation, according to data from the Center for Western Weather and Water Extremes.
The rainfall melted a significant amount of snow in mountain watersheds, which contributed to the flooding in Washington state. The melting also decreased the amount of water stored in the snowpack by about 50% in the Yakima River Basin over the course of that event.
Fortunately, it’s still early in the 2026 winter season. The West’s major snow accumulation months are generally from now until March, and the western snowpack could recover.
More snow has since fallen in the Yakima River Basin, which has made up the snow water storage it lost during the December storm, although it was still well below historical norms in early January 2026.
Scientists and water resource managers are working on ways to better predict snow drought and its effects several weeks to months ahead. Researchers are also seeking to better understand how individual storms produce rain and snow so that we can improve snowpack forecasting – a theme of recent work by my research group.
As temperatures warm and snow droughts become more common, this research will be essential to help water resources managers, winter sports industries and everyone else who relies on snow to prepare for the future.
U.S. Senators John Hickenlooper and Michael Bennet issued the following statement after President Trump vetoed their bipartisan Finish the Arkansas Valley Conduit Act:
“Nothing says ‘Make America Great Again’ like denying 50,000 rural Coloradans access to clean, affordable drinking water. President Trump’s first veto of his second term blocks a bipartisan bill that both the House and Senate passed unanimously, costs taxpayers nothing, and delivers safe, reliable water to rural communities that overwhelmingly supported him. Trump’s attacks on Southern Colorado are politics at its worst—putting personal and political grievances ahead of Americans. Southeastern Coloradans were promised the completion of the Arkansas Valley Conduit more than 60 years ago. With this veto, President Trump broke that promise and demonstrated exactly why so many Americans are fed up with Washington. We will keep fighting to make sure rural Coloradans get the clean drinking water they were promised.”
Arkansas Valley Conduit map via the Southeastern Colorado Water Conservancy District (Chris Woodka) June 2021.
Synopsis: La Niña persists, followed by a 75% chance of a transition to ENSO-neutral during January-March 2026. ENSO-neutral is likely through at least Northern Hemisphere late spring 2026.
In December 2025, La Niña was reflected in the continuation of below-average sea surface temperatures (SSTs) across the east-central and eastern equatorial Pacific Ocean. The latest weekly Niño-3.4 index value was -0.5°C, with the Niño-3 and Niño-1+2 indices remaining cooler at -0.8°C and -0.7°C, respectively. The equatorial subsurface temperature index (average from 180°-100°W) became slightly positive, reflecting the expansion of above-average temperatures from the western to the east-central Pacific at depth. Atmospheric anomalies across the tropical Pacific Ocean remained consistent with La Niña. For most of the month, easterly wind anomalies were present over the central equatorial Pacific, and upper-level westerly wind anomalies continued across the equatorial Pacific. Enhanced convection persisted over Indonesia and suppressed convection strengthened near the Date Line. The equatorial Southern Oscillation index was positive. Collectively, the coupled ocean-atmosphere system remains consistent with La Niña.
The IRI multi-model predictions indicate ENSO-neutral will emerge during January-March (JFM) 2026. In conjunction with the North American Multi-Model Ensemble, the team favors ENSO-neutral to develop during JFM 2026. Even after equatorial Pacific SSTs transition to ENSO-neutral, La Niña may still have some lingering influence through the early Northern Hemisphere spring 2026 (e.g., CPC’s seasonal outlooks). For longer forecast horizons, there are growing chances of El Niño, though there remains uncertainty given the lower accuracy of model forecasts through the spring. In summary, La Niña persists, followed by a 75% chance of a transition to ENSO-neutral during January-March 2026. ENSO-neutral is likely through at least Northern Hemisphere late spring 2026.
The past week featured above-normal temperatures across much of the western half of the U.S. Areas west of the Mississippi River generally experienced near- to above-normal temperatures, with portions of the northern Rocky Mountains running 15–20°F above normal for the week. These warm conditions favored rain over snow, which is critical for winter water supply in the West, and many locations continue to experience a slow start to the snow season.
In contrast, cooler-than-normal temperatures dominated the Florida Peninsula, with departures of 5–10°F below normal across southern Florida. Below-normal temperatures were also widespread from the Upper Midwest into the Northeast and Mid-Atlantic, where departures of 5°F or more below normal were common. Parts of New England were particularly cold, with temperatures 10–15°F below normal.
Outside of the West, above-normal precipitation was limited to pockets of the Southeast, Florida, and the Upper Midwest. Much of the West recorded more than 100% of normal precipitation for the week, with large portions of California receiving over 200% of normal…
Warmer-than-normal temperatures dominated the region, with departures exceeding 15°F above normal across parts of western Nebraska, western Kansas, northeast Colorado, Wyoming, and southeast Montana. Precipitation was minimal, with the greatest totals confined to northeastern North Dakota.
The continued warm and dry winter has resulted in some areas experiencing their driest start to winter on record. Abnormally dry conditions expanded across southern Nebraska and northeast Kansas, as well as southeast Kansas, where moderate drought also increased. Moderate and severe drought expanded across southeast Wyoming, western Nebraska, northeast Colorado, and southeast Colorado…
Colorado Drought Monitor one week change map ending January 6, 2026.
The largest positive temperature departures occurred in the West, with areas from central Montana into western Wyoming and northwest Colorado experiencing temperatures more than 15°F above normal. These warm conditions pushed snow to higher elevations and increased rainfall at lower elevations. While many areas received above-normal precipitation, snowpack remains critically low, and significant snow drought persists across numerous mountain ranges, including the Cascades, Oregon’s Blue Mountains, Idaho’s Bitterroot Range, and the central Rocky Mountains of Colorado.
It was a wet week for much of the region, with nearly all of California recording above-normal precipitation, along with much of Nevada and western Arizona. Above-normal precipitation also occurred across eastern Washington and Oregon, Idaho, western Utah, and Montana. Severe and extreme drought improved across northern Montana, with additional improvement to moderate drought in the southwest part of the state.
Continued wet conditions led to improvements in moderate and severe drought across Nevada, Arizona, eastern Oregon and Washington, and the Idaho Panhandle. Abnormally dry conditions expanded across northeast New Mexico, while extreme and exceptional drought expanded across central Colorado. Extreme drought was removed from southwest Wyoming, and moderate drought improved across western Wyoming. In Washington, abnormally dry conditions were adjusted to reflect recent precipitation while also accounting for persistent snow drought in the Cascades…
Nearly the entire region was dry, with only isolated precipitation observed in Mississippi and southwest Tennessee. Temperatures were above normal across most areas, with portions of the Texas and Oklahoma panhandles running more than 12°F above normal.
Drought conditions deteriorated across every state in the region. Moderate drought expanded across northern and southern Mississippi. Central and eastern Tennessee saw expansion of moderate and severe drought, while moderate drought increased in western Tennessee. Moderate and severe drought expanded across much of Louisiana and southern and western Arkansas. Severe drought expanded in northeast and northwest Arkansas and into northeast Oklahoma. Severe and extreme drought spread from southwest into central Oklahoma, while moderate drought continued to fill in across eastern Oklahoma.
Across Texas, moderate drought and abnormally dry conditions expanded over much of the Panhandle, while moderate and severe drought grew across east Texas and coastal southeast Texas. Drought conditions continued to intensify in far south Texas…
Looking Ahead
Over the next five to seven days, the pattern over the continental U.S. appears to be active with many areas showing a strong probability of precipitation. Areas from the Central Plains into the Midwest and Great Lakes areas are anticipated to receive up to an inch of precipitation. Further south, areas from Louisiana northeast into Kentucky are expected to receive the greatest amount of precipitation with several inches expected. From the Pacific Northwest into the Rocky Mountains and Southwest, widespread precipitation is anticipated. The driest areas are expected to be over the northern Great Plains, California, central and southern Texas and from the Carolinas into the Florida peninsula. Temperatures are expected to remain warmer than normal over much of the country. Only the areas along the southern tier of the U.S. will be near to below normal. The warmest departures are expected over the central to northern Plains, with some areas of Montana predicted to be 10-15 °F above normal.
The 6-10 day outlooks show that the likelihood of above-normal temperatures is projected over almost the entire U.S., with the exception of the Southeast and south Texas. The greatest chances of above-normal temperatures are over the West Coast, as well as the northern Plains and northern Rocky Mountains. The best chances of below-normal precipitation are over the Western U.S. and into the southern Plains. Above-normal chances of above-normal precipitation are anticipated over the central to northern Plains, Florida and along the coast of the Carolinas, as well as Alaska and Hawaii.
US Drought Monitor one week change map ending January 6, 2026.
Click the link to read the discussion on the CBRFC website:
The Colorado Basin River Forecast Center (CBRFC) geographic forecast area includes the Upper Colorado River Basin (UCRB), Lower Colorado River Basin (LCRB), and Eastern Great Basin (GB).
Water Supply Forecasts
January 1 water supply forecasts are generally well below normal and summarized in the figure and table below. Snowpack and soil moisture are the primary hydrologic conditions that impact the water supply outlook, while future weather is the primary source of forecast uncertainty.
January 1, 2026 seasonal water supply forecast summary.
Water Year Weather
The 2025–26 winter season has thus far featured record-setting warmth and limited precipitation, driven
by a persistent high-pressure ridge over the CBRFC area. Most of the major climate sites in and around the CBRFC area experienced their warmest (e.g. Salt Lake City, Phoenix, Tucson, Las Vegas, Pocatello) — or second warmest (e.g. Flagstaff, Grand Junction, Denver) — December on record. An active northern stream riding over the ridge has delivered above average precipitation to the northern fringes of the UCRB and GB, but given the warm maritime influence, snow accumulation has remained unimpressive.
The water year as a whole tells a different story. In October, several rounds of heavy rain tied to decaying tropical storms brought record flooding to portions of AZ, southern UT, and southwest CO — making it one of the wettest Octobers on record. November brought continued above average precipitation to the LCRB, but well below average precipitation was observed elsewhere. Water year 2026 precipitation is summarized in the figure and table below.
Water year 2026 precipitation summary.
Snowpack Conditions
UCRB January 1 snow water equivalent (SWE) conditions are highly variable and range between 35–100% of normal. Storm systems this winter have been warmer than normal with high snow levels resulting in much of the precipitation falling as rain rather than snow. SWE conditions are very poor across most of the UCRB, with numerous SNOTEL stations across western CO reporting January 1 SWE values at or near record low. The exception is the Upper Green headwaters, where SWE is near to above normal. UCRB January 1 snow covered area is around 28% of the 2001–2025 median, which is the lowest on record dating back to 2001. 1 LCRB January 1 SWE conditions are at or near record low across much of southwest UT, central AZ, and west-central NM.
GB January 1 SWE conditions are also very poor, ranging between 25–65% of normal. SWE at the majority of SNOTEL stations across UT are below the 10th percentile, with several stations reporting record low January 1 SWE. January 1 snow covered area across UT is record low at just 15% of the 2001-2025 median.1 SWE conditions are summarized in the figure and table below.
Left: January 1, 2026 SWE – NRCS SNOTEL observed (squares) and CBRFC hydrologic model. Right: CBRFC hydrologic model SWE condition summary.
Soil Moisture
CBRFC hydrologic model fall (antecedent) soil moisture conditions impact water supply forecasts and the efficiency of spring runoff. Basins with above average soil moisture conditions can be expected to experience more efficient runoff from rainfall or snowmelt while basins with below average soil moisture conditions can be expected to have lower runoff efficiency until soil moisture deficits are fulfilled. The timing and magnitude of spring runoff is impacted by snowpack conditions, spring weather, and soil moisture conditions.
Soil moisture conditions heading into the 2026 spring runoff season are below normal across most areas as a result of warmer and drier than normal weather during the 2025 water year. Water year 2025 precipitation was around 80% of average across the UCRB and GB and around 60% of average across the LCRB. The least favorable soil moisture conditions exist across central UT and the Colorado River headwaters. Soil moisture conditions across southwest CO and central AZ are exceptions, where very wet October–November weather led to improved soil moisture that is near or above average. CBRFC hydrologic model soil moisture conditions are shown in the figures below.
November 2025 CBRFC hydrologic model soil moisture conditions – as a percent of the 1991–2020 average (left) and compared to November 2024 (right).
Upcoming Weather
After a cold and somewhat snowy system sweeps through the CBRFC area this week, high pressure looks to dominate the region for the foreseeable future, which will suppress any chances for significant precipitation. The 7-day precipitation forecast and the Climate Prediction Center (CPC) 8–14 day temperature and precipitation outlooks are shown in the figures below.
7-day precipitation forecast for January 7–13, 2026.
Climate Prediction Center precipitation probability forecast for January 15–21, 2026.
Climate Prediction Center temperature probability forecast for January 15–21, 2026.
References
1. Rittger, K., Lenard, S.J.P., Palomaki, R.T., Stephenson, L. (2026). Snow Today. Boulder, Colorado USA. National Snow and Ice Data Center. Data source: MODIS/Terra/SPIRES.
Colorado air quality regulators on Thursday adopted new rules aimed at limiting emissions of methane, a potent greenhouse gas, from the state’s landfills.
Members of the Air Quality Control Commission voted 6-0 to approve the new rules, concluding a yearlong rulemaking process that resulted in a compromise plan agreed to by environmental groups and public and private landfill operators.
Food waste and other organic material dumped in landfills produces methane and other pollutants as it decomposes. Colorado’s 59 landfills emit a combined 1.3 million tons of carbon-dioxide-equivalent emissions every year, a little over 1% of the state’s overall greenhouse gas emissions.
“Today’s decision is a meaningful victory for the health of Colorado communities,” Nikita Habermehl, a pediatrician and advocate with Healthy Air & Water Colorado, said in a statement. “Methane is a powerful climate pollutant that also worsens the air quality issues driving asthma, respiratory illness, and other preventable health harms — especially for children and those living closest to landfills.”
The new rules approved Thursday will require landfill operators to take a variety of steps to limit their emissions, including increased monitoring for leaks and requirements on the amount and types of soil that can be used as landfill cover.
Under Environmental Protection Agency rules, 12 of Colorado’s largest landfills are required to maintain gas collection and control systems, which can capture the waste methane, or combust it in a flare system to convert it to carbon dioxide, a less potent greenhouse gas. The AQCC’s rule would extend those requirements to approximately 16 additional mid-sized landfills, though the state’s smallest operators would still be exempt. It also requires open flares to be phased out and replaced by more efficient enclosed alternatives by 2029.
“The rule approved by the commission is an important step forward on landfill emissions in Colorado,” said Alexandra Schluntz, an attorney with environmental group Earthjustice. “While this does not do everything we hoped to see, it will make a real difference for the health of surrounding communities.”
After the AQCC held a formal rulemaking hearing on the proposal in August, staff from the state’s Air Pollution Control Division last month submitted a series of revisions to the rule, weakening it at the request of waste industry groups and local governments that operate public landfills.
Prior to the vote, AQCC commissioner Jon Slutsky said the revised rule didn’t go far enough to meet the state’s greenhouse gas reduction goals, objecting to an increase in the emissions threshold that triggers monitoring requirements and corrective action, which he called the “heart of the regulation.” Slutsky moved to strike the revisions from the rule, but his fellow commissioners declined to discuss or second his motion.
“It’s always good to have a consensus,” said commissioner Martha Rudolph. “Not everybody likes what happens in a consensus, but I personally believe that the perfect should not be the enemy of the good.”
Elder pointed to the team’s big win against the New York Giants on Oct. 19, 2025.
“I think most of us thought the Broncos were done in that game after going scoreless for three quarters, but then they had an amazing turnaround in the fourth quarter and came back to win at the last second,” said Nathan Elder, Denver Water’s manager of water supply.
“Let’s hope Mother Nature can do the same as Bo Nix and deliver a big comeback this winter.”
Snowmaking at Keystone Ski Resort on Dec. 31, 2025. Photo credit: Denver Water.
Record low start to the snowpack
Elder said the first three months of the 2025-26 snow season, from Oct. 1 to Dec. 31, 2025, ranked as the driest on record in Denver Water’s water collection area.
The records date back to the winter of 1979-80, when SNOTEL measuring gauges started being used to measure mountain snowpack.
Denver Water’s previous year-ending, record-low snowpack on Dec. 31 occurred during the winter of 1980-81.
This year, as of Dec. 31, 2025, the snowpack in the South Platte and Colorado river basins where Denver Water collects water stood at 51% and 49% of normal, respectively, according to SNOTEL measurements.
Snowpack in the South Platte River Basin at the end of December 2025 stood at 51% of normal. Image credit: U.S.D.A., Natural Resources Conservation Service.
Snowpack in the Colorado River Basin at the end of December 2025 stood at 49% of normal. Image credit: U.S.D.A., Natural Resources Conservation Service.
The lack of powder days is not only tough on Colorado’s ski resorts, but low snowpack also raises concerns about river levels and our water supply which comes primarily from mountain snow.
A skier navigates through early season conditions at Breckenridge on Dec. 23, 2025. Photo credit: Denver Water.
“We definitely prefer a snowier start to winter over a dry one,” Elder said.
“But we still have about four months left in the snow accumulation season. We will need a lot of snow to catch up to get back to normal.”
The first three months of the snow season typically account for about 20% of the annual snowpack. The good news is that the snowiest months of March and April are still ahead.
Loveland Pass in Summit County on Dec. 24, 2025. The lack of snow is clearly visible on the higher peaks. Photo credit: Denver Water.
Elder said that along with the low snowfall, strong winds and above-normal temperatures created windy and warm weather, which led to increased sublimation of the snowpack (think of sublimation like evaporation just for snow).
“In mid-December, we actually saw a noticeable drop in the snowpack in the South Platte River Basin, which is very rare for that time of year because it’s usually too cold for snow to melt,” Elder said.
What to expect in 2026?
While unfortunately there’s no crystal ball for snow forecasting, Elder pointed to other years that experienced similarly slow starts to the snowpack for a guess as to where this season could end up.
For Denver Water, snowpack typically peaks in mid-to-late April.
The lowest peak occurred during the winter of 2001-02, when snowpack peaked at just 56% of normal. The second-lowest peak was measured during the winter of 2011-12, when mountain snowpack peaked at 58% of normal.
Both of those seasons started slow and snowfall stayed below normal levels all winter long.
In contrast to those two dismal winters, Elder said the winter of 1999-2000 offers a glimmer of hope.
“That season started slow, but snow came on strong in April and May and we ended up right around normal in terms of peak snowpack by the end of the season,” he said.
Water managers also watch for a couple of big storms that could quickly bolster a lackluster snowpack.
Taking action
Denver Water’s reservoirs are currently at 83% of capacity, which is 4% below average for this time of year.
Dillon Reservoir in Summit County had open water on Dec. 24, 2025, due to warm conditions. The reservoir’s average “ice-in” date is Dec. 24. Photo credit: Denver Water.
Elder said that while the reservoir levels are expected to be in relatively good shape heading into summer, it’s too early to say if there will be any watering restrictions.
“We live in a dry climate with increasingly variable weather patterns, which means all of us need to pitch in to help conserve the precious water supplies that we have,” Elder said.
“Now is a good time to check your faucets and toilets for leaks, and fix any you find inside your home. It’s also a good time to start planning how to remodel your yard this summer to save water outside.”
Denver Water’s website has free tips, including a step-by-step DIY Guide that can help you replace thirsty Kentucky bluegrass with water-smart plants, available at denverwater.org/Conserve.
In 2026, the utility will again be offering customers a limited number of discounts on Resource Central’s popular, water-wise Garden In A Box kits and turf removal.
It’s important to water trees and plants during dry periods in the winter months. Soaker hoses are a great way to efficiently water a tree. Photo credit: Denver Water.
The drying Rio Grande, as shown here in Albuquerque in the summer of 2025. (Laura Paskus for Source NM)
Click the link to read the article on the Source NM website (Laura Paskus):
January 6, 2026
A male house finch belts out his springtime song. Mustard greens have pushed through the loam in my backyard. The hyssop and salvia are greening up, and so are the Mexican sage and globemallow. Sunflowers and poppies are sprouting, and I slept Sunday night with the window cracked open — 38 degrees is usually my threshold for allowing cold air into the room. In the morning, there’s not even a skiff of ice on the birdbath water.
Like many of you, I’ve been walking a fine line between joy and terror this winter.
Oh, it’s so nice to be outside! And I love listening for screech owls and coyotes at night. But these balmy days and nights fill me with dread. They aren’t just omens of a hot, dry year. They also weaken ecosystems and species that rely upon winter. Including humans.
Snowpack across New Mexico is grim. (Do you really want to see the median numbers as of early January? Rio Grande Headwaters in Colorado: 52 percent. Upper Rio Grande in New Mexico: 30. San Juan River Basin: 51. Rio Chama River Basin: 57. Jemez River Basin: 17. Pecos River Basin: 34.) And we’re facing continued La Niña conditions, at least through the next three months.
Meanwhile, New Mexico doesn’t have much in its water savings account; just look at the reservoir numbers from the top of the Rio Chama to the Lower Rio Grande in New Mexico. Heron Reservoir is 7% full; El Vado, 13%; Abiquiu, 58%; Elephant Butte, 8%; and Caballo, 7%.
From this vantage point in early January — with a few decades of warming temperatures, drying rivers, burning forests and aridifying croplands already behind us — it’s clear that human-caused climate change is tightening the noose on a viable future for New Mexicans, and for the wildlife and ecosystems we are bound to, inextricably.
In 2018, the Intergovernmental Panel on Climate Change released a special report, noting that if the Earth’s temperature increased by more than 1.5 degrees Celsius, the climate consequences will be “long-lasting” and “irreversible.” Scientists wrote that human-caused emissions of carbon dioxide would need to “fall by about 45 percent from 2010 levels by 2030, reaching ‘net zero’ by 2050.”
In 2025, the Earth passed the 1.5-degree Celsius threshold. And we’re nowhere near to cutting greenhouse gas emissions by significant levels.
Nothing that’s happening right now should be a surprise — not the melting ice caps nor the drying rivers. We’ve had decades to pivot or at least prepare.
Yet, 60 years after President Lyndon Johnson’s science advisory committee warned that the carbon dioxide humans were sending into the atmosphere would cause changes that could be “deleterious from the point of view of human beings,” in 2025, U.S. Environmental Protection Agency Administrator Lee Zeldin launched the Powering the Great American Comeback Initiative, deregulating industries and “driving a dagger straight into the heart of climate change religion.”
“The Trump administration will treat climate change for what it is, a global physical phenomenon that is a side-effect of building the modern world,” Wright said. “Everything in life involves trade-off.”
The men spearheading the Trump administration’s plans know climate change threatens the lives of billions of people and ecosystems ranging from the sea’s coral reefs to Earth’s mountaintops. And their tradeoffs involve the calculated obliteration of longstanding federal environmental laws, the privatization of public lands and watersheds, and of course, the subversion of climate science. (Not to mention, the waging of illegal wars.) [ed. emphasis mine]
In just a few weeks, New Mexico state legislators will convene for a 30-day session. It’s a fast-paced budget session, which means climate and water won’t top the list of priorities, again. No matter what the mustard greens, house finches, bare mountaintops, and drastically low reservoirs show us.
This winter, temperatures will drop here and there. Some snow will fall. There will be days that feel like winter. But we’re past the point of comforting ourselves that these warm winter temperatures are an anomaly. They are our future.
Decades ago, I rented an attic bedroom in a house in western Colorado from a woman who was kind and angry and trying very hard and battling demons. Because she had taped handwritten quotes inside the kitchen cabinet next to the sink, every time I reached inside, I would read them. There’s one quote from the late Joanna Macy I think of every day.
“The point is not to save people. The point is to create the conditions for the possibility of grace.”
The point right now isn’t to save the planet — or even ourselves or the more-than-human species we rely upon or love. The point is to create the conditions for the possibility of grace. The possibility of a climate-changed future in which all the best and most beautiful things about this Earth haven’t been traded away. [ed. emphasis mine]
Bedrock Energy’s drilling rig digs a 1,000-foot borehole as part of a geothermal network that’ll keep energy costs low for companies that move into a new Hayden business park. (Alison F. Takemura/Canary Media)
For decades, Dallas Robinson’s family excavation company developed coal mines and power plants in the rugged, fossil-fuel-rich region of northwest Colorado. It was a good business to be in, one that helped hamlets like Hayden grow from outposts to bustling mountain towns — and kept families like Robinson’s rooted in place for generations.
“This area, with the exception of agriculture, was built on oil and gas and coal,” said Robinson, a former town councilor for Hayden.
But that era is coming to a close. Across the United States, bad economics and even worse environmental impacts are driving coal companies out of business. The 441-megawatt coal-burning power plant just outside Hayden is no exception: It’s shutting down by the end of 2028. The Twentymile mine that feeds it is expected to follow.
Coal closures can gut communities like Hayden, a town of about 2,000 people. That story has been playing out for decades, particularly in Appalachia, where coal regions with depressed economies have seen populations decline as people strike out for better opportunities elsewhere. Robinson, a friendly, gregarious guy, fears the same could happen in Hayden.
“I grew up here, so I know everyone,” he said. “It’s hard to see people lose their jobs and have to move away. … These are families that sweat and bled and been through the good and the bad times in small towns like this.”
Struggling American coal towns need an economic rebirth as the fossil-fuel industry fades. Hayden has a vision that, at first, doesn’t sound all that unusual. The town is developing a 58-acre business and industrial park to attract a diverse array of new employers.
The innovative part: companies that move in will get cheap energy bills at a time of surging utility costs. The town is installing tech that’s still uncommon but gaining traction — a geothermal heating-and-cooling system, which will draw energy from 1,000 feet underground.
In short, Hayden is tapping abundant renewable energy to help invigorate its economy. That’s a playbook that could serve other communities looking to rise from the coal dust.
At an all-day event hosted by geothermal drilling startup Bedrock Energy this summer, I saw the ambitious project in progress. Under a blazing sun, a Bedrock drilling rig chewed methodically into the region’s ochre dirt. Once it finished this borehole — one of about 150 — it would feed in a massive spool of black pipe to transfer heat.
Bedrock will complete the project, providing 2 megawatts of thermal energy, in phases, with roughly half the district done in 2026 and the whole job finished by 2028. Along the way, constructed buildings will be able to connect with portions of the district as they’re ready.
“We see it as a long-term bet,” Mathew Mendisco, city manager of Hayden, later told me, describing the town as full of grit and good people. Geothermal energy “is literally so sustainable — like, you could generate those megawatts forever. You’re never going to have to be reliant on the delivery of coal or natural gas. … You drill it on-site, the heat comes out.”
“We disagree on the urgency of addressing climate change, [but] this is something that Chris Wright and I agree on,” Colorado Senator John Hickenlooper (D), a trained geologist, told a packed conference-room crowd on the day of the event. “Geothermal energy has … unbelievable potential to, at scale, create clean energy.”
Charting a post-coal economy
The eventual closure of the Hayden Station coal plant, which has operated for more than half a century, has loomed over the town since Xcel Energy announced an early shutdown in 2021.
The power plant and the mine employ about 240 people. Property taxes from those businesses have historically provided more than half the funding for the town’s fire management and school districts — though that fraction is shrinking thanks to recent efforts to diversify Hayden’s economy, Mendisco said.
Taking into account the other businesses that serve the coal industry and its workers, according to Mendisco, the economic fallout from the closures is projected to be a whopping $319 million per year.
“Really, the highest-paying jobs, the most stable jobs, with the best benefits [and] the best retirement, are in coal and coal-fired power plants,” Robinson said.
Hayden aims for its business park to help the town weather this transition. With 15 lots to be available for purchase, the development is designed to provide more than 70 jobs and help offset a portion of the tax losses from Hayden Station’s closure, according to Mendisco.
“We are not going to sit on our hands and wait for something to come save us,” Mayor Ryan Banks told me at the event.
Companies that move into the business park won’t have a gas bill. They’ll be insulated from fossil-fuel price spikes, like those that occurred in December 2022, when gas prices leapt in the West and customers’ bills skyrocketed by 75% on average from December 2021.
In the Hayden development, businesses will be charged for their energy use by the electric utility and by a geothermal municipal utility that Hayden is forming to oversee the thermal energy network. Rather than forcing customers to pay for the infrastructure upfront, the town will spread out those costs on energy bills over time — like investor-owned utilities do. Unlike a private utility, though, Hayden will take no profit. Mendisco said he expects the geothermal district to cut energy costs by roughly 40%, compared with other heating systems.
Municipally owned geothermal districts are rare in the U.S., but the approach has legs. Pagosa Springs, Colorado, has run its geothermal network since the early 1980s, when it scrambled to combat fuel scarcity during the 1970s oil embargo. New Haven, Connecticut, recently broke ground on a geothermal project for its train station and a new public housing complex. And Ann Arbor, Michigan, has plans to build a geothermal district to help make one neighborhood carbon-neutral.
Hayden’s infrastructure investment is already attracting business owners. An industrial painting company has bought a plot, and so has a regional alcohol distributor, Mendisco said.
One couple is particularly excited to be a part of the town’s clean energy venture. Nate and Steph Yarbrough own DIY off-grid-electrical startup Explorist.Life; renewable power is in the company’s DNA. The Yarbroughs teach people how to put solar panels and batteries on camper vans, boats, and cabins to fuel their outdoor adventures, and Explorist.Life sells the necessary gear.
“When we bought that property, it was largely because of the whole geothermal concept,” Nate Yarbrough told me. “We thought it made a whole bunch of sense with what we do.”
Reducing reliance on hydrocarbons, he noted, is “a good thing for society overall.”
Geothermal tech heats up
The geothermal network that could transform Hayden’s future is mostly invisible from aboveground. Besides the drilling rig and a trench, the most prominent features I spotted were flexible tubes jutting from the earth like bunny ears.
Those ends of buried U-shaped pipes will eventually connect to a main distribution loop for businesses to hook up to. Throughout the network, pipes will ferry a nontoxic mix of water and glycol — a heat-carrying fluid that electric heat pumps can tap to keep buildings toasty in the winter and chilled in the summer.
As part of Hayden’s geothermal network, a loop of U-shaped pipe will collect constant heat from the earth, no matter how bitter the winter. Its two ends — the only parts visible — will connect to a distribution loop. (Alison F. Takemura/Canary Media)
Despite their superior efficiency, these heat pumps are far less common than the kind that pull from the ambient air, largely due to project cost. Because you have to drill to install a ground-source heat pump, the systems are typically about twice as expensive as air-source heat pumps.
But the underground infrastructure lasts 50 years or more, and the systems pay for themselves in fuel-cost savings more quickly in places that endure frostier temperatures, including Rocky Mountain municipalities like Hayden. Those long-term cost benefits were too attractive to ignore, Mendisco said.
Hayden’s project “is 100% replicable today,” Mendisco told attendees at the event, which included leaders of other mountain towns. Geothermal tech is ready; the money is out there, he added: “You can do this.”
Colorado certainly believes that — and it’s giving first-mover communities a boost.
In October, the state energy office announced $7.3 million in merit-based tax-credit awards for four geothermal projects. Vail is getting nearly $1.8 million for a network, into which the ice arena can dump heat and the library can soak it up. Colorado Springs will use its $5 million award to keep a downtown high school comfortable year-round. Steamboat Springs and a Denver neighborhood will share the rest of the funding.
At least one other northwest Colorado coal community is also getting on board with geothermal. In the prior round of state awards, the energy office granted $58,000 to the town of Craig’s Memorial Regional Health to explore a project for its medical campus.
With dozens of communities warming to the notion, “it’s an exciting time for geothermal in Colorado,” said Bryce Carter, geothermal program manager at the state energy office.
So far, the state has pumped $30.5 million into geothermal developments — with over $27 million going toward heating-and-cooling projects specifically — through its grant and tax-credit programs. The larger tax-credit incentive still has about $13.8 million left in its coffers.
Hayden, for its part, is also taking advantage of the federal tax credits to save up to 50% on the cost of its geothermal district. That includes a 10% bonus credit that the community qualifies for because of its coal legacy. After also accounting for a bonanza of state incentives, the $14-million project will only be $2.2 million, Mendisco said.
Tech innovation could further improve geothermal’s prospects, even in areas with less generous inducements than Colorado’s. Bedrock Energy, for one, aims to drive down costs by using advanced sensing technology that allows it to see the subsurface and make computationally guided decisions while drilling.
“In Hayden, we have gone from about 25 hours for a 1,000-foot bore to about nine hours for a 1,000-foot bore — in just the last couple of months,” Joselyn Lai, Bedrock’s co-founder and CEO, told me at the event. Overall, the firm’s subsurface construction costs from the first quarter of 2025 to the second quarter fell by about 16%, she noted.
When drilling, Bedrock Energy harnesses a constant stream of data to navigate underground obstacles from boulders to fractures. (Alison F. Takemura/Canary Media)
Hayden is likely just at the start of its geothermal journey. If all goes well with the business park, the town aims to retrofit its municipal buildings with these systems to comply with the state’s climate-pollution limits on big buildings, Mendisco said. Hayden’s community center could be the first to get a geothermal makeover starting in 2027, he added.
Robinson, despite coal’s salience in the region and his family’s legacy in its extraction, believes in Hayden’s vision: Geothermal could be a winner in a post-coal economy. In fact, he’s interested in investing in the geothermal industry and installing a system in a new house he’s building, he said.
“I’ve lived a lot of my life making a living by exploiting natural resources. I understand the value of that — as well as lessening our impact and being able to find new and better,” Robinson said. “This is the next step, right?”
This article was originally published by Canary Media and is republished here as part of Covering Climate Now, a global effort to boost coverage of climate change.
The coal-fired Tri-State Generation and Transmission plant in Craig provides much of the power used in Western Colorado, including in Aspen and Pitkin County. Will Toor, executive director of the Colorado Energy Office has a plan to move the state’s electric grid to 100 percent renewable energy by 2040. Photo credit: Brent Gardner-Smith/Aspen Journalism
Platte River Power Authority’s general manager says he disagrees with a federal order requiring one of the coal plants it owns a stake in to remain open past its scheduled retirement and is waiting to learn what it might cost Fort Collins’ wholesale electricity provider…PRPA is a joint owner of the plant with PacifiCorp, Xcel Energy, Salt River Project and Tri-State Generation and Transmission, which operates the facility. PRPA owns 18% of the Craig 1 and 2 coal units…
The Department of Energy’s emergency order contends there is a shortage of electric energy and facilities in the Western Electricity Coordinating Council Northwest assessment area, which includes Colorado, Idaho, Montana, Oregon, Utah, Washington and Wyoming. The order, signed by Secretary of Energy Chris Wright, states that peak demand in the area is expected to grow 8.5% in the next decade, while many coal plants in the region have been retired, with more retirements planned…Wright cites supply chain issues with building battery storage systems to help replace the energy from those retirements. The emergency order also cited two executive orders from President Donald Trump. One declared a national energy emergency due to “insufficient energy production, transportation, refining, and generation.” The other declares the United States is experiencing an unprecedented surge in electricity demand driven by rapid technological advancements, like the expansion of AI data centers and domestic manufacturing…
But PRPA General Manager and CEO Jason Frisbie says PRPA does not need the Craig 1 unit because it has already replaced the energy that came from it.
“We have planned for the retirement of Craig Unit 1 for nearly a decade and have proactively replaced the capacity and energy from new sources,” Frisbie said in a statement provided to the Coloradoan.
A recent study by Colorado Parks and Wildlife and a Colorado Springs Tribune article by Jonathan Ingraham have raised concerns about the adverse effects certain whitewater parks might have on local fish populations – but local CPW officials said they are pleased to report Salida and Buena Vista’s parks aren’t among them. For Salida’s Scout Wave, CPW collaborated with Mike Harvey’s company to design the fish passage part of the wave, CPW aquatic biologist Alex Townsend said. “It definitely took some forethought.” Though there are examples of whitewater parks that are not built with fish welfare in mind, Townsend said the parks in Salida and Buena Vista are built that way, and other whitewater park designers need to be sure to work with biologists and wildlife experts…
When building the fish passage, they have a gradient that extends a little further than the wave itself, with planned drops and pools below those drops. They also created rough elements, which create vortices for the fish to have flow refuge, he explained, resulting in the fish passage being nowhere near the same velocity as the wave…
Mike Harvey, project manager of Recreation and Engineering Planning, who constructed the Scout Wave and fish passage, said, “We’ve been working with CPW over 15 years. This is not something that is new to us.” In regards to the Tribune article, he said, “It’s a little surprising that this is coming up again,” he said…
Building the fish passage did not require any extra labor on their part, nor was it difficult, he said. “You’re going to set rocks anyway, so you just set them in the configuration that they need.”
Karen Budd-Falen, the No. 3 at the Interior Department, didn’t disclose a $3.5 million water-rights contract between her husband and the developers of a Nevada mine, records show.
A high-ranking official in the Interior Department is drawing scrutiny from ethics experts because she failed to disclose her family’s financial interest in the nation’s largest lithium mine that had been approved by her agency, according to state and federal records. In 2018 Frank Falen sold water from a family ranch in northern Nevada to Lithium Nevada Corp., a subsidiary of Lithium Americas, for $3.5 million. The company was planning a $2.2 billion lithium mine nearby called Thacker Pass, and lithium mining requires significant amounts of water. The mine needed a permit from the Interior Department, where Mr. Falen’s wife, Karen Budd-Falen, worked as the deputy solicitor responsible for wildlife from 2018 until 2021. She returned to the agency last year and is now the associate deputy secretary, the third highest-ranking position. Mr. Falen’s sale of his water rights also depended on the mine getting a permit from the Interior Department. Without it, Lithium Nevada Corp. could have terminated its deal with him…In November 2019, about two years before the agency approved the mine, Ms. Budd-Falen met with Lithium Americas executives over lunch in the cafeteria at the Interior Department.
Tim Crowley, a spokesman for Lithium Americas, said executives did not discuss the mine or pending environmental reviews with Ms. Budd-Falen. “We haven’t worked directly with Karen Budd-Falen related to Lithium Americas,” he said in an email, “nor have we ever met with her in a formal capacity regarding our project.”
Ms. Budd-Falen did not respond to questions for this article. Her husband, who was not at the lunch, characterized it in a telephone interview as a social occasion, not a work meeting. He said his wife knew few details about the water contract and may not have known that the company was seeking approval from the Interior Department.
The Western United States just had its warmest December in recorded history, and likely the warmest in many thousands of years. pic.twitter.com/QrY4KKLsJ7
A Yale Climate Connections analysis of electricity prices has found that data centers and other commercial electricity users are consuming more kilowatts than ever, but the price they pay for that electricity has risen only a little. And industrial users of electricity are actually paying lower prices, on average, than they were two years ago.
But between 2020 and 2024, residential electricity prices in the U.S. increased by 25%. In other words, people using their toasters, laptops, and electric heating and cooking at home are paying ever-increasing prices, while the data centers that are driving rapid growth in electricity demand are scoring handsome discounts.
A word of warning: this analysis might make you mad, but hopefully in a productive way.
Since 2008, residential bills have been rising more than in other sectors
Electricity customers are sorted into use types: residential for homes, commercialfor businesses and data centers, and industrial for facilities like factories or refineries. The graph below shows how the prices paid by these three sectors have shifted over time.
Data analysis and image by Karin Kirk for Yale Climate Connections
From 1997 through 2007, electricity prices for all three categories of users rose and fell at a similar pace.
In 2008, that trend stopped. That year, electricity prices went up for residences but down for businesses and industries.
Over the next decade, home uses of electricity became more expensive, while electricity prices for businesses stayed nearly flat.
In 2021, the trend shifted again. Electricity prices for all three sectors began to rise steeply, but unequally. The gap between home energy use and business/industrial energy use became even larger. In the last two years, these differences became especially stark, as shown in the chart below.
Data analysis and image by Karin Kirk for Yale Climate Connections
In just two years, starting in 2022, residential electricity prices rose by 10%, while commercial prices increased by only 3%, and industrial electricity prices fell by 2%.
This is an example of the “K-shaped economy,” where things improve for some groups while getting worse for others. The lines on a K-shaped graph head off in different directions, illustrating an ever-larger gap between those benefiting and those left out.
Recent increases in electricity demand are mostly due to the commercial sector, which includes data centers
If any one sector is driving the growth in electricity usage, it would make sense for that sector to foot the bill for the power plants and power lines needed to serve their demand. So let’s look at how electricity use is growing in each sector.
The chart below shows how the amount of electricity used by each sector has changed since 1997. Industrial use has stayed relatively flat, while commercial and residential use both grew at fairly similar rates and are now consuming about 40% more power than they were in 1997.
Data analysis and image by Karin Kirk for Yale Climate Connections
But a new pattern emerged in the last three years, as seen in the chart below. Commercial demand for electricity rose sharply and steadily, using 9% more power over just a three-year span.
Glenn McGrath, an electricity data analyst at the U.S. Energy Information Administration, wrote in an email that the growing energy needs of data centers “are likely a significant factor” behind increasing electricity use in the commercial sector.
Data analysis and image by Karin Kirk for Yale Climate Connections
To sum up the situation in recent years, household electricity use has grown the least of the three sectors, but that’s where prices have gone up the most.
The data illustrates how residential users are subsidizing the energy bills of A.I. and data centers, a perspective backed up by other recent analyses. A report by the Harvard Law School Environmental and Energy Law Program, Extracting Profits from the Public, lays out some of the reasons why Big Tech is able to off-load its costs onto the public and outlines specific steps policymakers can take to restore balance.
A big part of the problem is that the three sectors of electricity users are far from equal when it comes to their leverage. The report explains that companies that use large amounts of electricity can often negotiate lower pricing with energy suppliers, and in some cases, these contracts are secret. Complex rules and rate structures make it hard for the public – as well as regulators – to follow or engage with the process. Furthermore, policymakers have an incentive to attract new economic development in their state as technology companies shop around for the best pricing.
But for individual consumers, the situation is the opposite. In many states, people have no choice in their energy provider or their energy prices, and they can’t look elsewhere for a better deal. In the parlance of the energy industry, everyday people are often called “captive ratepayers” because we have little choice but to be the ever-faithful customers of a monopoly utility.
Expensive electricity can make life harder
Rising electricity bills can trigger a host of negative consequences. High energy costs may prevent people from adequately heating or cooling their homes, which can contribute to both physical and mental health problems. Expensive energy can also lead people to forego necessities in other areas of their lives in order to keep up with rising bills and avoid having their service shut off. These burdens fall disproportionately on low-income, Black, Hispanic, and disadvantaged households, who spend a large portion of their income on energy bills.
Higher electricity prices could also slow the adoption of modern, climate-friendly technology such as electric vehicles, heat pumps, and induction stoves that rely on electricity. That said, electric cars and appliances are more efficient than their fossil-fuel counterparts, so the trade-off is often still worth it.
And in some cases, expensive electricity can spur faster adoption of climate solutions. Home solar panels pay for themselves more quickly, and energy conservation measures make even more financial sense than before.
A stressed system that’s become fundamentally unfair
The electricity system in the U.S. is undergoing multiple stresses at once. Data centers seem to have an unquenchable thirst for energy, as extreme weather – often made worse by our warming climate – destabilizes the grid and causes spikes in electricity demand. At the same time, electricity generation is slowly transitioning from large, centralized power plants to numerous, distributed forms of electricity generation.
But at the root of it all, the data suggests that everyday people are footing the bill while companies that consume ever more power are paying less. At a time when corporations seem to enjoy many structural advantages over consumers, from lower tax rates to relaxed pollution requirements, the burden of rising energy bills can make one feel powerless. And yes, the pun was intentional.
Ratepayers do have a voice
Decisions about electricity rates are made by public utility commissions, which don’t usually get much attention – but that may be changing. In the November 2025 elections in Georgia, two incumbent public utility commissioners were resoundingly defeatedafter residential electricity prices climbed by 41% in just four years. Commissions are increasingly criticized for rubber-stamping price hikes and not protecting ratepayers who are caught inside a monopolistic system.
If you’re interested in learning more about the electricity decision-making process near you, here’s a directory of public utility commissions in every state, and Canary Media wrote a user-friendly guide to engaging with your electricity regulators. The deck may feel stacked against the common person, but that might just be all the more reason to get involved.
Click the link to read the article on the Sky-Hi News website (Ryan Spencer). Here’s an excerpt:
January 5, 2026
Across Colorado, this past December was among the hottest ever recorded. Both Denver and Grand Junction recorded their second-hottest December on record, according to the National Weather Service. Steamboat Springs, where the period of record dates to 1893, had its hottest December ever, averaging about 30 degrees through the month.
Dillon townsite prior to construction of Dillon Reservoir via Denver Water
In Dillon, where the period of record dates back to 1910, this past December was also the second-warmest on record, with a monthly average temperature about 28 degrees, about one degree cooler than 1980, which was the hottest December…At one weather station in Vail, temperatures averaged about 26 degrees Fahrenheit last month, making the hottest December recorded in the period of record that dates back to 1985. In Aspen, the average monthly temperature in December was 30 degrees, compared to the normal average monthly temperature of about 22 degrees for that month…
Westwide SNOTEL basin-filled map January 4, 2026.
Across the state, the snowpack was also at or near record lows in several river basins, including those where popular ski resorts are located. Statewide, the sat at 59% of the 30-year median as of Friday, ranking in at the 5th percentile, meaning that 95% of years on record had more snow at this time. The Roaring Fork Basin and the Yampa River Basin both ranked in at the 3rd percentile. Meanwhile, the Eagle River Basin and the Colorado-Kremmling to Glenwood Springs Basin both came in at the zeroth percentile, meaning that the snowpack is the worst on record.
Colorado Drought Monitor map December 30, 2025.
With low amounts of precipitation and hot weather, drought conditions continue to sweep over the Western Slope, according to the most recent U.S. Drought Monitor map. Substantial portions of Eagle and Pitkin counties are now facing exceptional and extreme drought. Extreme drought has also pushed into Grand County, while the rest of Northwestern Colorado is facing moderate to severe drought.
A mayfly loving trout — speckled, shiny and perfectly hand-sized for that Instagram hero shot. A five-foot-long torpedo of a predator, capable of powering through floodwaters and migrating hundreds of miles. A three-inch minnow, living only a couple of years and content with life in a small pool in an ephemeral creek. Which fish is the true Colorado native?
The answer is all of them. A state with waterways as diverse as Colorado’s has naturally produced a diverse assortment of native fish to match. We have cutthroat trout, lovers of pristine, high-elevation streams on both sides of the Continental Divide. Large, long-lived species like Colorado pikeminnow and humpback chub fight their way through the whitewater of the Western Slope. Tiny brassy minnows and redbelly dace ply the shallow, sandy creeks of the Eastern Plains. Each is adapted to its own ecological niche, body and behavior tailored to its particular home waters and the other aquatic creatures that evolved alongside it.
Humans have dramatically altered this delicate balance in a very short time span. While some native populations still thrive, many others struggle as their habitats and predators have changed. Starting a couple of hundred years ago, mining pollution, overfishing, and haphazard stocking of non-native fish led some Colorado species to plummet, or even go extinct. Today, native fish still grapple with climate change, dams, water diversions, and competition with invasive species. But humans are also working to turn back the clock and restore these native species. Follow along on this tour of Colorado’s waterways, meeting our home-state fish — and learning what it takes to help them endure.
Headwaters
On the Yampa River Core Trail during my bicycle commute to the Colorado Water Congress’ 2025 Summer Conference August 21, 2025.
The headwaters region is the realm of the cutthroat trout. Credit: Water Education Colorado
Let’s begin where the rivers do: high in the Rocky Mountains, where clean, cold streams form and flow downhill, eventually feeding the state’s largest rivers. This is the realm of Colorado’s poster fish, the cutthroat trout. Colorful, beautiful and beloved by anglers, cutthroats — recognizable by the iconic red slash markings under the jaw that give the species its name — live in the headwaters of almost every river basin in the state. Cutthroat trout are at home where there’s oxygenated water, gravelly bars for spawning, and good vegetative cover on stream banks.
“Cutthroat trout” isn’t just one type of fish in Colorado, but rather, six. There’s the greenback cutthroat trout, originally from the South Platte River Basin on the east side of the Divide. The yellowfin cutthroat came from the Arkansas River Basin, but is now considered extinct. Moving southwest, the Rio Grande cutthroat rose from the Rio Grande Basin. Then, on the Western Slope, the Colorado River cutthroat is further divided into three lineages: the Green River lineage, found in the Green, White and Yampa rivers; the Uncompahgre lineage, of the Dolores, Gunnison and Upper Colorado rivers; and the San Juan lineage, of the San Juan River Basin.
That’s not to say the average angler — or indeed, the average fish biologist — can tell the cutthroats apart just by looking at them. Nor can they be identified based on where they’re caught these days. Humans, from regular people trying to create new fishing opportunities to professional fisheries managers, spent much of the last couple of centuries moving cutthroats around the state with little understanding of the differences between subspecies. “It’s really hard to put the genie back in the bottle once that happens,” says Jim White, southwest senior aquatic biologist for Colorado Parks and Wildlife (CPW). “One of the great mysteries in cutthroat trout distributions was, what went where? What did these river basins look like before we started widespread stocking of cutthroats and non-natives?”
Biologists didn’t know the answer until 2012, when a landmark study led by University of Colorado Boulder researchers conducted DNA analysis on museum fish specimens gathered at the beginning of European contact with the West. Those results confirmed the existence of the six genetically distinct types of cutthroat — five previously known to science, and one brand-new one, the San Juan lineage trout. The study speculated that San Juan cutthroats had also gone extinct, but CPW biologists had to be sure. “We beat the bushes, surveyed all the populations, and conducted molecular tests on fin clips from all known cutthroat trout populations in the San Juan Basin,” says Kevin Rogers, CPW aquatic research scientist and co-author on the 2012 genetic study. “Indeed, there were about a half-dozen populations that [matched] the fish that had been collected in the mid- to late 1800s.”
One thing all five remaining Colorado cutthroat varieties have in common is a reduction in the amount of habitat they occupy. The state’s cutthroats are now relegated to just 12% of their historical habitat on the high end, down to half a percent on the low end, says Boyd Wright, native aquatic species coordinator with CPW. “Most of the lower elevations have been invaded by non-native trout, so cutthroats are persisting only in the headwaters,” Rogers says. Greenback cutthroats are federally listed as threatened, and Rio Grande and Colorado River cutthroats (occupying just 12% and 11% of their historic habitat, respectively) are state species of special concern. The culprits? What began with pollution, overharvesting and the stocking of non-native fish in the era of Western colonization continues today.
Non-native fish pose a major threat to native cutthroats, particularly the brown, brook and rainbow trout that have been stocked statewide and now thrive in Colorado’s waters. “To sum it up, there’s hybridization, there’s predation, and there’s competition,” White says. “All of those three things can interact to disadvantage our native fish populations.” Rainbow and cutthroat trout can breed, resulting in the hybrid cutbow. Non-native trout sometimes even eat the natives. They also compete with cutthroats for food, and often win. Brook and brown trout spawn in the fall and hatch in the spring — so when the cutthroat fry hatch in late summer, their non-native rivals have already had several months to grow bigger.
Climate change isn’t helping. “We have the two ugly stepchildren that come along with a changing climate: drought and wildfire,” Rogers notes. “The toll wildfire can take on cutthroat is substantial. The debris flows that invariably happen afterward can wipe out populations.” Drought can also lower or dry up streams, further contracting ranges.
But CPW and partner organizations like the U.S. Fish and Wildlife Service are actively working to conserve Colorado’s native cutthroats. Biologists raise the trout in hatcheries for stocking back in their native streams, but there’s a lot more to it than that. First, managers must prep the waterways by removing non-native trout, often by poisoning with natural fish toxicants, a process that can take years. Any present pathogens, like whirling disease, must be eradicated. Managers also have to make sure non-native fish can’t reinvade the stream, usually by building a barrier, like a waterfall. Despite the difficulty and expense, the state is actively working on recovery projects for all five cutthroat varieties. “That’s what we’re about, trying to preserve diversity for future generations to enjoy,” Rogers says.
Desert Rivers
The Yampa River winds through towering cliffs on its journey west to meet the Green River in Dinosaur National Monument. Photo Credit: Dave Showalter
Credit: Water Education Colorado
As the mountain streams follow gravity into the western lowlands, they flow into larger networks: Rivers like the Yampa, White and Animas feed the desert arteries of the Green and San Juan, and these, together with the Gunnison, Dolores and others join the Colorado. The entire basin touches seven states, from Wyoming and Colorado up north to Arizona and California in the southwest.
The cold swift headwaters give way to rivers that historically swung between huge springtime floods and slow, turbid flatwater. And the trout give way to large, long-lived fish with bodies suited to big water and wild rapids.
Just over a dozen fish species evolved with the chops to survive in the larger rivers within the Colorado River system. Three of them, called just “the three species” by biologists, are the flannelmouth sucker, bluehead sucker, and roundtail chub. These omnivorous swimmers persist in today’s rivers, though managers keep a close eye on conserving their populations so that they don’t go the way of four other native species.
These four — all federally listed as endangered or threatened — have struggled in the face of drastic, human-caused changes to their habitats. The bonytail, a large-finned, skinny-tailed omnivore, is the worst off, with no sustainable wild populations left. Its relative, the humpback chub, sports a pronounced bump behind its head, all the better to stabilize the fish in whitewater. Its populations have stayed stable over the past few years, with most of them found near the Grand Canyon, and the species was downlisted from endangered to threatened in 2021. The Colorado pikeminnow, a powerful swimmer shaped like a missile, is the largest minnow in North America. It can migrate 200 miles annually and lives 40 years or more. Its numbers are slowly increasing in the Upper Colorado and San Juan subbasins, but are declining in the Green River. And the razorback sucker, a bug- and plankton-eater, features a similar keel behind its head that helps it maneuver through high flows.
All four populations have crashed in response to human water use and reduced water availability resulting from drought and climate change, which has altered the habitats they once inhabited. “We have cross-basin diversions that feed water from the Western Slope over to the Front Range,” says Jenn Logan, native aquatic species manager for CPW. “We don’t have the volume of water that we used to see in the spring. With dams and water going into ditches and filling reservoirs, runoff is nowhere near where it used to be. We don’t have sandbars formed in the way that we used to, and these systems relied on sediment to form complex habitats.” Not only that, but dams change water temperature, with released water alternately cooling or warming the river downstream depending on where in the reservoir it comes from. And of course, they form a physical barrier for fish that evolved migrating through a huge, interconnected river system.
Then there’s the non-native interlopers — primarily smallmouth bass, northern pike, walleye, and green sunfish — all introduced, either purposely or accidentally, by humans looking for expanded angling opportunities. “They’re predatory species — they get in the river and can really compete with and consume the native fish in the Colorado River,” says Josh Nehring, deputy assistant director, aquatic branch, of the CPW fish management team. All have found happy homes in the modern Colorado River Basin with its dams, reservoirs and warmer waters.
But just as in the mountain streams, fisheries managers on the Western Slope are working aggressively to protect the natives. The Upper Colorado River Endangered Fish Recovery Program and the San Juan River Basin Recovery Implementation Program oversee the recovery of the four fish species listed as threatened or endangered. The recovery programs are coalitions of water users, federal, state and tribal agencies, plus nonprofits and energy organizations. They take steps like installing nets at the edge of reservoirs to keep non-natives contained and stocking sterile non-native fish in reservoirs to keep them from establishing a population if they do get out. Other work looks like electrofishing stretches of river — that is, introducing a current that stuns fish in the water — and physically removing the non-natives, leaving the native fish to recover and swim another day; and gillnetting northern pike in their springtime spawning habitats. Water managers go so far as to recontour river channels on the upper Yampa to cut off access to northern pike’s spawning wetlands.
Dam management is another useful tool for both helping native fish and disadvantaging the non-natives. The Upper Colorado River Endangered Fish Recovery Program works with the U.S. Bureau of Reclamation at Utah’s Flaming Gorge Dam on the Green River on timed releases — releasing water when biologists detect the year’s razorback sucker larvae “to attempt to move them down to their wetland habitats,” Logan says. They’ll release water to disrupt smallmouth bass nesting, when possible. And in the Lower Basin downstream of Lake Powell, managers have begun releasing cooler water specifically to make the Colorado River there less hospitable to smallmouth bass. As long-term drought has dropped water levels in Lake Powell, “We’ve been seeing increases in water temperature releases coming through the dam,” says Ryan Mann, aquatic research program manager for the Arizona Game and Fish Department. Some smallmouth bass made their way into the river below the dam in years past, but the water had been cold enough to keep them from reproducing. But in 2022, biologists found baby bass. Last summer’s cold-water releases prevented widespread spawning, and managers may continue them into the future.
Today’s Colorado River Basin is a radically different place than in centuries past, and, “Unless there’s some amazing technology that comes along to remove all non-native fish or a way to return flows to historic conditions we’re not going to be able to move [major river systems] back to native fish,” Nehring says. But that doesn’t mean those species are doomed. CPW and its partners are actively raising threatened species in hatcheries and reintroducing them to targeted habitats. “We’re really focusing on the tributaries, to keep the natives alive in enough areas where we know they’ll persist,” Nehring says.
Eastern Plains
Here at the confluence of the Big Thompson and South Platte rivers near Greeley, a new conservation effort is underway. It restores wetlands and creates mitigation credits that developers can buy to meet their obligations under the federal Clean Water Act to offset any damage to rivers and wetlands they have caused. Credit: Westervelt Ecological Services
Credit: Water Education Colorado
As alpine streams flow east, they meander through Front Range cities, then spread across the arid plains. The water warms, rocky beds grow sandy, and habitats shrink as creeks dry up seasonally. Waters dominated by a single species explode with different fish. “We’ve got this melting pot of biological diversity along the transition zone,” says Wright. “You go from historically a one-species profile in the mountains to more than 28 as you go farther east. These [plains] are very harsh, unpredictable environments.”
The fish that evolved to thrive on the plains, from the region’s western edges in Colorado out into Kansas, Oklahoma and Nebraska, are largely the opposite of the big, long-lived species on the Western Slope. They’re a few inches long, live just a couple of years, and reproduce early. These fish are used to biding their time in small pools until rain or spring runoff reconnects the intermittent creeks, finally allowing them a change of scenery.
But the Eastern Plains haven’t escaped the challenges affecting Colorado’s other rivers — its native fish are struggling, too. “Most of our plains fishes are declining or locally extinct because of habitat modification or loss,” says Ashley Ficke, fisheries ecologist with engineering firm GEI Consultants. Humans have diverted water to farms and municipalities, redirected streams into straight channels lacking habitat complexity, and even drained some waters completely. That hits fish like the plains minnow particularly hard, as its semi-buoyant eggs float vast distances between spawning grounds and ideal nursery habitat. “It needs vast portions of unfragmented stream habitat,” Wright says. “We’ve really lost that in Colorado, and that’s a big reason why they’re very rare.”
As elsewhere in the state, though, fish managers are working to replenish the swimmers of the plains. At a hatchery in Alamosa, CPW breeds 12 rare native fish, half of them eastern species: plains minnow, suckermouth minnow, northern and southern redbelly dace, Arkansas darter, and common shiner. “We’re working with private landowners that have streams or ponds that would be suitable for these native fish, working with them to maintain or improve that habitat, and stocking those waters with the native fish,” Nehring says. By preserving and restoring enough of the plains’ stream habitats, managers hope to give back sufficient waters for these little fish to persist.
High winds toppled a train in December 2025 near Cheyenne. (Lacey Beck)
Click the link to read the article on the WyoFile website (Dustin Bleizeffer):
December 30, 2025
It was a balmy, gusty Christmas for much of Wyoming, where only high elevations in the western portion of the state saw fresh snow. It rained in Jackson Hole while lower elevations in central Wyoming saw temperatures in the 60s with 60-plus mile-per-hour winds, according to reports.
The holiday was a continuation of a theme in which weird and wild weather defined much of December as high-pressure systems lingered over the region for the better part of three weeks, the National Weather Service in Riverton said. Residents and travelers alike battled sustained high winds from border to border, and a Dec. 19 blast measured 144 miles per hour — Category 4 hurricane speed — at Mount Coffin in western Wyoming. Another wind blast the same day tossed a train off the tracks near Cheyenne, BNSF Railway confirmed.
At least nine Wyoming locations broke average temperature highs for a portion of December 2025. (National Weather Service, Riverton office)
Wyoming Highway Patrol responded to 39 blow-over accidents in just three days in December, according to state officials.
As the wind wreaked havoc, nine Wyoming locations saw unseasonably high temperatures averaging 13 to 22 degrees Fahrenheit above normal from Dec. 13 through Dec. 27, according to the National Weather Service. Both Lander and Casper are on track to notch their warmest Decembers since 1892 and 1948, respectively, NWS Riverton meteorologist Adam Dziewaltowski said. Casper, as of Monday, had marked 10 record-breaking daily highs, while Lander saw a record high of 65 degrees on Christmas Eve.
Wyoming snowpack January 4, 2026.
Yet for all the bluster and heat, meteorologists caution against reading too much into what it might portend for the remainder of winter. Cold and snow returned over the weekend, and the state frequently receives most of its snow in early spring, sources say.
Currently, Wyoming’s “snow-water equivalent” is above average for most of western Wyoming, while areas on the east side of the state lag behind late December norms. Central-east and southeast Wyoming are the driest, with the southeast measuring just 5% of its typical snow-water equivalent, according to a U.S. Department of Agriculture report on Monday.
A fisherman wades into Twin Buttes Lake in December 2025, days after it was frozen over. (Eric Wiltse)
But even in some areas of the state, like Jackson, where precipitation is above average, a portion of the wet stuff has come in the form of rain instead of snow.
“Right now, [Jackson is] almost two inches above normal for precipitation — liquid-wise,” Dziewaltowski said. “They’ve definitely gotten precipitation, but it’s been so warm that it hasn’t fallen as snow.”
Some high elevations have seen rain-on-snow events, which can create adverse conditions for slides, Dziewaltowski added.
Though the weather took a turn after Christmas, swinging from the balmy 60s to below zero in just 48 hours in some areas, the forecast calls for more unseasonably warm temperatures later this week, according to the Weather Service.
December’s wild and warm conditions made for odd outdoor experiences.
Laramie angler Eric Wiltse posted his December fishing outings to Facebook and confirmed with WyoFile several “alarming” seasonal observations. Early this month, he waded into Twin Buttes Lake, which had been frozen just days before. He saw rain at 7,200 feet of elevation, and while fishing in Curt Gowdy State Park on Christmas Eve, he shared the open water with other outdoor enthusiasts who typically don’t appear in the winter.
“Crazy to be fly fishing on Christmas Eve at 7,500 feet in Wyoming,” Wiltse posted. “Even crazier to see a paddleboard on the lake.”
In May of 2023, the Supreme Court handed down a decision that significantly limited the scope of the Clean Water Act, undoing protections that safeguarded the nation’s waters for over 50 years. Specifically, it erased critical protections for tens of millions of acres of wetlands, threatening the clean drinking water sources for millions of Americans.
While the Biden administration amended rules to comply with the Supreme Court ruling, the Trump administration recently released a new draft rule that would go further than even the Supreme Court in limiting what waters can be protected.
Nooksack River, Washington | Brett Baunton
The Clean Water Act’s definition of “Waters of the United States” (WOTUS) is core to defining what waters are protected and which aren’t. Unfortunately, the Trump Administration’s newly proposed WOTUS rule would roll back protections for vast areas of wetlands and river tributaries. It’s estimated that close to 80% of America’s remaining wetlands would lose Clean Water Act protections. As written, the rule would leave many waterways vulnerable to pollution, degradation, and destruction, threatening water quality and community resilience across the country.
Blanca Wetlands, Colorado BLM-managed ACEC Blanca Wetlands is a network of lakes, ponds, marshes and wet meadows designated for its recreation and wetland values. The BLM Colorado and its partners have made strides in preserving, restoring and managing the area to provide rich and diverse habitats for wildlife and the public. To visit or get more information, see: http://www.blm.gov/co/st/en/fo/slvfo/blanca_wetlands.html. By Bureau of Land Management – Blanca Wetlands Area of Critical Environmental Concern, Colorado, Public Domain, https://commons.wikimedia.org/w/index.php?curid=42089248
Here are our top four concerns with the new WOTUS proposal
1. The rule requires streams and wetlands to have surface water “at least during the wet season” in order to qualify for protection. But it never defines what the wet season actually is.
What this means for rivers: Wet seasons vary dramatically from region to region, and without a clear, science-based definition, many healthy and ecologically important streams risk being excluded.
2. Narrow definitions and expanded exemptions shrink the scope of protected waters.
What this means for rivers: By redefining “tributary” to include only streams with year-round or steady “wet-season” flow, and expanding exemptions for wastewater and waste-treatment systems, the new rule would eliminate protections for many intermittent streams and man-made infrastructure that function like natural streams, opening the door to more unregulated pollution. Many rivers in the Southwest only flow for part of the year. This updated definition would put many of these rivers at risk.
3. The rule suggests any artificial or natural break in flow cuts off upstream protection.
What this means for rivers: Under the proposed rule, a culvert, pipe, stormwater channel, or short dry stretch can sever jurisdiction. This means upstream waters that feed larger rivers may no longer be protected, allowing pollution to still flow into nominally protected rivers and streams.
4. The rule significantly eliminates wetland protections by requiring “wetlands” to physically touch a protected water and maintain surface water through the wet season.
What this means for rivers: The new definition excludes many wetlands, which naturally store floodwater, filter pollutants, and safeguard communities. This puts the drinking water for millions at risk and increases the risks of flooding for many communities.
The health of our rivers depends on the small streams and wetlands that feed them. By discarding science, narrowing long‑standing definitions, and creating confusing jurisdictional tests, the Trump Administration’s proposed WOTUS rule risks undoing decades of progress toward cleaner, safer water. America’s rivers—and the communities that depend on them—deserve better.
These rollbacks will put our waterways and the life that depends on them in jeopardy. The public comment period to speak up and defend clean water protections is open until January 5. Please take action today and send a letter to the EPA urging them to keep the current definition of Waters of the United States in place!
Ephemeral streams are streams that do not always flow. They are above the groundwater reservoir and appear after precipitation in the area. Via Socratic.org