#Drought news: Degradations or persistence of ongoing drought was common in parts of the #Midwest, #GreatPlains, and #West that received little or no precipitation this week

Click on a thumbnail graphic to view a gallery of drought data from the US Drought Monitor.

Click here to go to the US Drought Monitor website. Here’s an excerpt:

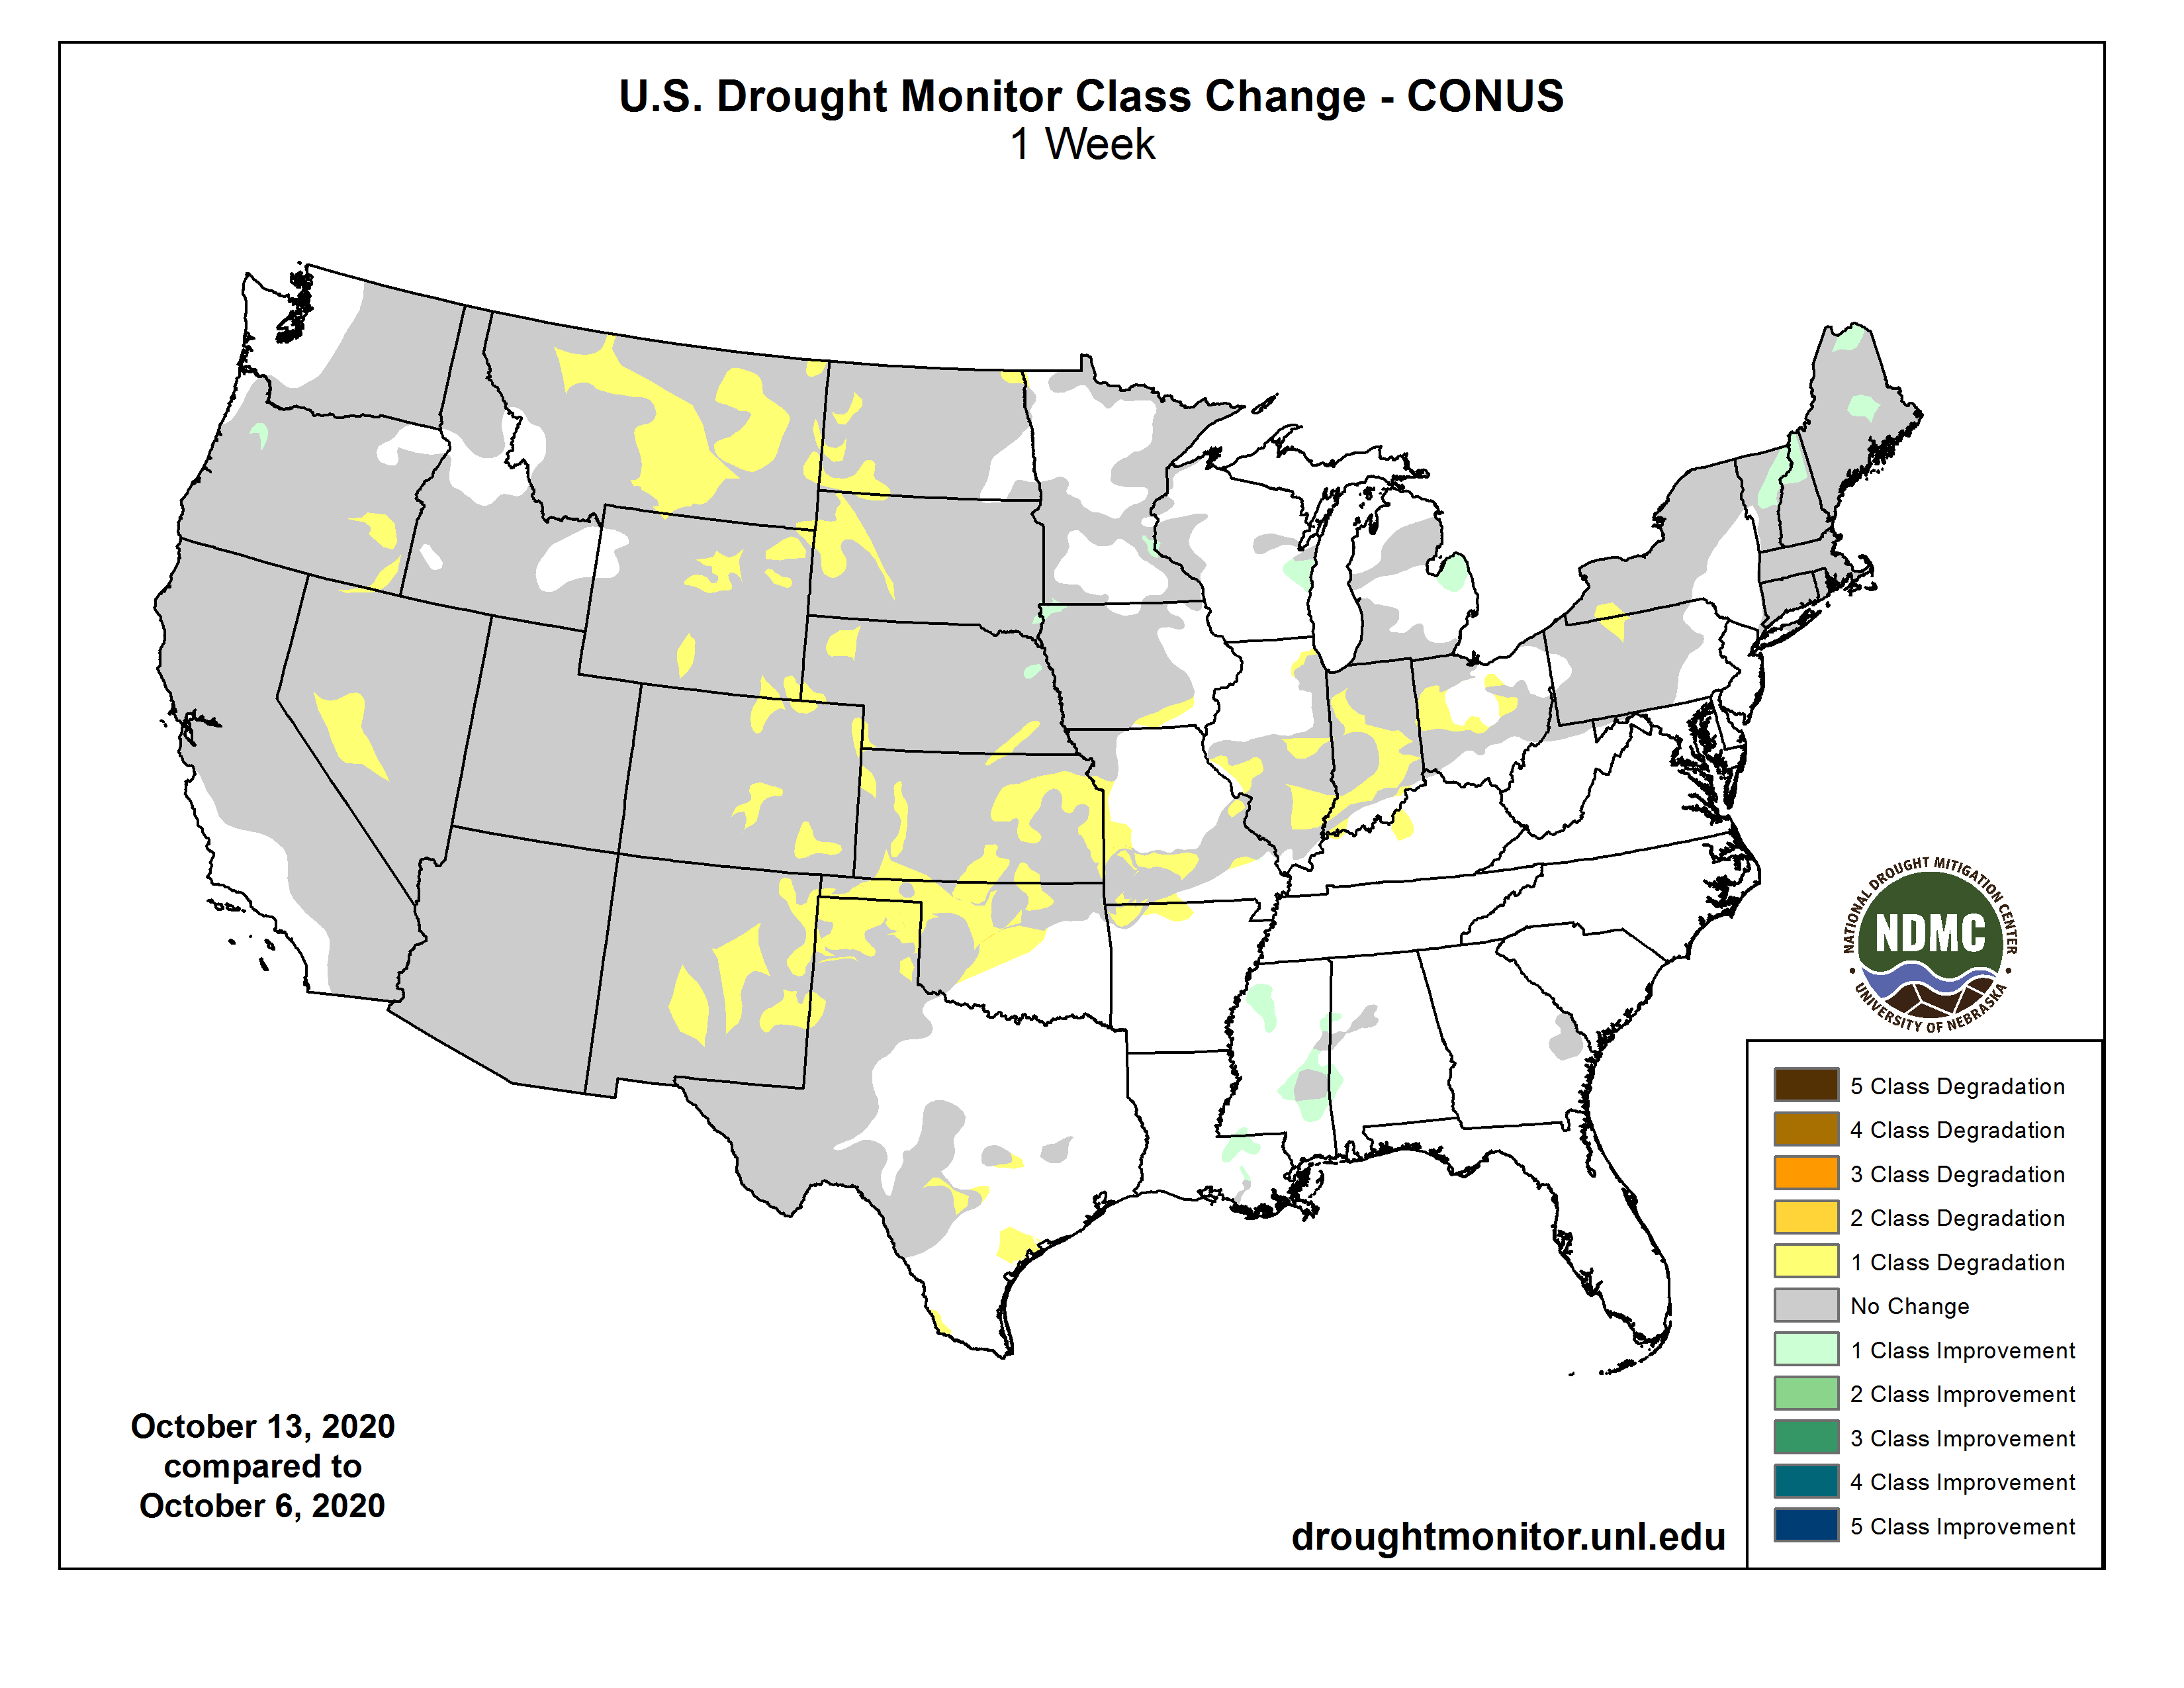
This Week’s Drought Summary

A dry pattern continued this past week over large portions of the continental United States, with a few exceptions being areas impacted by Hurricane Delta or its remnants, parts of the Upper Midwest and middle Missouri River Valley, and parts of the Northeast. In areas of the Northeast that received an inch or two of rain, some improvements were made in the ongoing drought areas there. As a storm system and associated cold front brought showers and thunderstorms to parts of the Middle and Upper Missouri River Valley and to the Upper Midwest, some improvements were made to ongoing drought there. Abnormal dryness abated in a few areas of Louisiana and Mississippi, which received copious rainfall from Hurricane Delta. Degradations or persistence of ongoing drought was common in parts of the Midwest, Great Plains, and West that received little or no precipitation this week. Temperatures this week were warmer than normal across most of the Lower 48. The central Great Plains and middle Missouri River Valley were the warmest compared to normal, with temperatures from 9 to 12 degrees above normal common. New England experienced milder conditions this week, with a few below-normal readings taking place in northern Vermont, New Hampshire, and Maine…

West

The West generally experienced warmer than normal temperatures again this week, with most areas coming in between 3 and 9 degrees above normal for the week. Generally, the southern half of the region stayed dry, while some precipitation occurred over the north, particularly in far northwest California, western Washington and Oregon, western Wyoming, and western portions of Montana and Idaho. Due to recent precipitation, extreme drought in western Oregon reduced in coverage. In southwest Oregon, where short- and long-term precipitation deficits were worsening, severe and extreme drought increased in coverage. Extreme drought also increased its foothold in west-central Nevada, where soil moisture profiles continued to worsen along with short- and long-term precipitation deficits…

High Plains

Drier than normal conditions continued across much of the High Plains region, where temperatures were also generally 6 to 12 degrees warmer than normal. Consequently, as short- and long-term precipitation deficits grew amid warmer than normal weather, and near surface moisture and agricultural impacts worsened, widespread degradation in drought conditions occurred. Moderate, severe, and extreme drought coverage increased across most of the region, with the exception of northeast Nebraska and adjacent portions of Iowa and South Dakota, where a storm system brought locally high amounts of rain. In the areas with highest rainfall, short-term precipitation deficits improved enough such that extreme and severe drought decreased in coverage…

South

Category two Hurricane Delta and its remnants delivered above-normal rainfall from far east Texas through most of Mississippi, southeast Arkansas, and southern Tennessee, leading to the reduction of abnormally dry areas in Louisiana and Mississippi. Elsewhere, dry conditions occurred, and existing areas of drought expanded. Short-term drought continued to plague the southern high plains regions of Oklahoma and Texas, where moderate, severe, and extreme drought continued to spread amid worsening short-term precipitation deficits, decreasing soil moisture, and drying vegetation. Temperatures in the region were also mostly warmer than normal, with the warmest areas (compared to normal) being found in the Oklahoma and Texas panhandles, where temperatures were 9 to 12 degrees warmer than normal…

Looking Ahead

A series of cold fronts over the next week are forecast to bring a higher chance of cooler than normal temperatures to the north-central continental United States. With the exception of the northern tier of states, much of the West is forecast to be dry through the evening of October 19. Farther east, higher rainfall amounts of a half an inch or more are possible from the Mid-Atlantic coast north, while lighter precipitation is forecast in the Midwest. Glancing ahead to the October 20-24 period, cooler than normal conditions are more likely to be widespread from the Pacific Northwest to the western Great Lakes, while in the eastern United States, warmer than normal temperatures are favored in this period. Widespread increased chances for above-normal precipitation are forecast in the northern Rockies and much of the Great Plains, Midwest, and East, while below-normal or near-normal precipitation is favored elsewhere in the Lower 48.

US Drought Monitor one week change map ending October 13, 2020.

Earth just had its hottest September on record — @NOAA

From NOAA (John Bateman):

With 3 months left, 2020 could rank among three-warmest years on record for globe

Unprecedented heat around the world vaulted September 2020 to the hottest September since 1880, according to scientists at NOAA’s National Centers for Environmental Information.

The month’s warmth also contributed to 2020’s trend as a remarkably hot year, with the year-to-date global temperatures running second highest in the 141-year climate record.

Below are more facts and stats from NOAA’s latest monthly global climate report:

Climate by the numbers
September 2020

The average global temperature in September was 1.75 degrees F — 0.97 of a degree C — above the 20th-century average of 59.0 degrees F (15.0 degrees C).

This surpasses the average global temperatures for both September 2015 and 2016 by 0.04 of a degree F (0.02 of a degree C), which previously tied for the hottest Septembers on record.

The 10-warmest Septembers have all occurred since 2005, with the seven-warmest Septembers occurring in the last seven years.

The year to date | January through September 2020
The year-to-date (YTD) average global temperature was the second hottest on record at 1.84 degrees F (1.02 degrees C) above the 20th-century average. This is only 0.07 of a degree F (0.04 of a degree C) shy of the record set for the same YTD in 2016.

The Northern Hemisphere’s YTD temperature tied with 2016 as the hottest on record, while the Southern Hemisphere saw its fourth hottest YTD.

According to a statistical analysis done by NCEI scientists, 2020 will very likely rank among the three-warmest years on record.

A map of the world plotted with some of the most significant weather and climate events that occurred during September 2020. For more details, see the bullets below in this story and more from the NCEI report at http://bit.ly/Global092020.

More notable climate facts and stats

  • Arctic sea ice was at near-record lows: Average Arctic sea ice coverage (extent) for September ranked second smallest on record. On September 15, sea ice covered just 1.44 million square miles of the Arctic, the second-smallest minimum extent on record behind September 17, 2012. The 14 smallest minimum annual extents have occurred in the last 14 years.
  • A record-hot YTD so far for some: Europe, Asia and the Gulf of Mexico had their warmest January-through-September period on record; South America and the Caribbean region had their second highest. No land or ocean areas had record-cold YTD temperatures.
  • @ColoradoDNR Announces New Initiative to Reduce Deaths and Accidents Around #Colorado Low Head Dams

    Photo credit: Colorado Department of Natural Resources

    Here’s the release from the Colorado Department of Natural Resources (Chris Arend):

    The Colorado Department of Natural Resources (DNR) announced today a new initiative to increase public safety around low head dams which have caused a number of accidents and fatalities on Colorado rivers in recent years. The effort includes new and planned signage around targeted low head dam sites, emergency responder education, public outreach and partnerships with private and non-profit organizations, local municipalities, and landowners and the launch of a new interactive map and webpage on DNR’s website: https://dnr.colorado.gov/colorado-low-head-dams

    “DNR’s low head dam initiative is a positive step to increase public safety and awareness around low head dams across Colorado,” said Dan Gibbs, Executive Director, Colorado Department of Natural Resources. “Colorado has seen an increase in outdoor recreation in recent years, particularly on our rivers and streams, but this has also led to tragic fatalities on some of our low head dam structures. These fatal accidents are avoidable and are a strong motivation for our Department to increase our public outreach and education initiatives. While some of our efforts are already underway, we know we need to do more to educate Coloradans to reduce these unfortunate accidents and ensure all Coloradans can safely recreate in our great outdoors.”

    Low head dams are engineered structures built into and across Colorado’s stream and river channels for a variety of purposes, including to divert water from streams for agricultural purposes, protect stream channels from degradation and provide recreational amenities.

    Low head dams, sometimes referred to as the quintessential “drowning machines,” can be dangerous because water flowing over dams produces recirculating currents that can trap recreators. Rafters, kayakers and those floating our rivers for recreation are often unaware of these structures and the dangers resulting from them.

    Low head dams can be difficult to detect by river users approaching from upstream due to their height, and the fact that the relatively tranquil pool they create provides no indication of the dangers just beyond the visual horizon created by the dam and ponded water. This can limit reaction time and boaters’ ability to exit the river upstream of the dam.

    General currents upstream and downstream from a low-head dam. Graphic via Bruce a. Tschantz

    “I appreciate the work being done by the Department of Natural Resources to address public safety at low head dams. Colorado rivers and streams are an enormous amenity for both water enthusiasts and fishermen,” said Ruth Wright, former Colorado legislator, public safety advocate and founder of Wright Family Foundation. “The low head dam initiative will provide valuable information to the public to help to prevent tragic and needless harm from the dangerous hydraulics of low head dams.”

    Several high profile incidents in Colorado in recent years, including 4 fatalities, and 13 since 1986 point to the need for increased education and outreach efforts as well as closer coordination with local emergency responders. The average ages of those involved with low head dam-related incidents are between 13 and 30 years of age. DNR and a private ditch company recently installed warning signs at a low head diversion dam on the South Platte River adjacent to the Jean K. Tool State Wildlife Area. This diversion dam between Ft Morgan and Brush is the site of unfortunate drowning fatalities in 2016 and 2019.

    “The Ditch and Reservoir Company Alliance (DARCA) is proud to work alongside the Department of Natural Resources and the water community at large through this initiative,” remarked Amber Weber, DARCA Executive Director. “Some of DARCA’s members have been touched by the loss of life due to a low head dam structure, and irrigators know the dangers a low head dam has. DARCA is glad to take part in this effort as agriculturalists join with recreationalists to make our waters safe to traverse.”

    In response to these incidents, the DNR formed the Colorado Low Head Dam Safety Steering Committee to address safety issues around low head dams. The team of experts included; Colorado Water Conservation Board, Division of Water Resources – Dam Safety Branch, and Colorado Parks and Wildlife, Colorado Division of Homeland Security and Emergency Management (DHSEM), Colorado Office of Outdoor Recreation, the Mile High Flood District, and Wright Water Engineers. The Steering Committee oversaw the inventory study of Colorado low head dam sites, which identified and digitized the locations of diversion, grade control, and recreational structures across Colorado.

    The Low Head Dam webpage on DNR’s website includes an interactive map produced from the inventory study enabling Coloradans to research and locate potential low head dam structures before embarking on trips down their favorite river or stream. The webpage includes additional resources on low head dams, links to partner organizations, and a feedback form for Coloradans to help identify missed features on Colorado Rivers which could be included on the interactive low head dam map.

    “American Whitewater has been pleased to partner with DNR on this low head dam inventory project. Safe enjoyment of our nation’s rivers is central to our mission,” said Hattie Johnson, Southern Rockies Stewardship Director, American Whitewater. “We hope to integrate the data into our web based national whitewater inventory to help river users plan for and avoid these hazards. We are hoping to help crowdsource information to prioritize low head structures and to find solutions to improve their safety.”

    DNR’s low head dam outreach initiative is funded in part from a $31,250 Colorado Water Conservation Board, Colorado Water Plan grant, matched with $20,000 from FEMA’s National Dam Safety Program state assistance grant and $15,000 of in-kind services from Wright Water Engineers, and a generous $20,000 donation from the Wright Family Foundation for additional signage. These donations will help future efforts including ongoing public education, increased outreach during spring months, when the Colorado recreation water season is in full swing, installation of warning signage both above and below highly visited low head dam structures, and additional outreach and education for emergency responders.

    Check out DNR’s Low Head Dam Webpage

    October 2020 La Niña update — @NOAA #ENSO

    From NOAA (Emily Becker):

    La Niña’s reign continues in the tropical Pacific, with an approximately 85% chance of lasting through the winter. Forecasters currently think this La Niña will be on the stronger side.

    Let’s check in with the tropical Pacific
    The temperature of the ocean surface in the Niño3.4 region was about 0.8°C cooler than the 1986–2015 average, according to the ERSSTv5 dataset. We monitor the Niño3.4 index with a few different temperature datasets—more on that here—but they are all comfortably below the La Niña threshold of -0.5°C. The three-month-average Niño3.4 index, called the Oceanic Niño Index (remember this for later!) was -0.6°C. The Oceanic Niño Index is our primary metric for the El Niño/Southern Oscillation, aka ENSO, the whole El Niño/La Niña ocean/atmosphere system.

    September 2020 sea surface temperature departure from the 1981-2010 average. Lots of cool water at the equator in the Pacific. Image from Data Snapshots on Climate.gov.

    The atmosphere is responding to La Niña’s cooler-than-average ocean surface. A strengthened Walker circulation is what we expect with La Niña conditions, and it’s what we have: air rising vigorously over the very warm western Pacific, traveling eastward high up in the atmosphere, sinking over the cooler central-eastern Pacific, and traveling back westward near the surface.

    Generalized Walker Circulation (December-February) anomaly during La Niña events, overlaid on map of average sea surface temperature anomalies. Anomalous ocean cooling (blue-green) in the central and eastern Pacific Ocean and warming over the western Pacific Ocean enhance the rising branch of the Walker circulation over the Maritime Continent and the sinking branch over the eastern Pacific Ocean. Enhanced rising motion is also observed over northern South America, while anomalous sinking motion is found over eastern Africa. NOAA Climate.gov drawing by Fiona Martin.

    Near-surface winds along the tropical Pacific (the trade winds) were stronger than average through the month of September and into early October, as were upper-level winds over the east-central Pacific. The two indexes we use to measure the change in sea-level pressure between the western and eastern Pacific, the Southern Oscillation Index and the Equatorial Southern Oscillation Index were positive, indicating the presence of more rising air (lower surface pressure) over the west and more sinking air (higher surface pressure) over the east—more evidence of an enhanced Walker circulation.

    What’s on deck
    Most of the dynamical computer model forecasts predict that La Niña will last through the winter and diminish in the spring. Also, there remains a substantial amount of cooler-than-average water under the surface of the central-eastern Pacific. This will provide a source of cooler water for the surface, giving confidence to the forecast that La Niña will continue.

    Difference from average (1981-2010) temperatures in the upper 300 meters (980 feet) of the tropical Pacific Ocean for the 5-day period centered on September 30, 2020. The vertical axis is depth below the surface (meters) and the horizontal axis is longitude, from the western to eastern tropical Pacific. This cross-section is right along the equator. Climate.gov figure from CPC data.

    Several computer models are predicting the Oceanic Niño Index will be, at its peak in November–January, more than 1.0°C cooler than the long-term average. We don’t have specific strength definitions for ENSO, but generally, a deviation of more than 1.0°C (1.8°F) from the long-term mean is considered a moderate-to-strong event. Stronger ENSO events don’t necessarily increase the strength of global weather and climate impacts, but they do increase the likelihood that those impacts will occur.

    Speaking of impacts…
    The altered atmospheric circulation of ENSO affects global weather (here’s how that works in general and La Niña in specific). Since ENSO can be predicted months ahead of time, a lot of research has gone into understanding the patterns of ENSO’s global weather impacts. The idea is that if we can predict ENSO, we can get an early picture of what global weather could look like months into the future.

    A recent study by some of our colleagues at the International Research Institute for Climate and Society (IRI), led by Nathan Lenssen, carefully re-assessed global precipitation (rain, snow, etc.) patterns during ENSO events. They looked at La Niña and El Niño impacts separately, because the impacts are not always opposite. Meaning, although El Niño may be related to a wet winter in one location, La Niña doesn’t necessarily mean a dry winter in that location.

    Their study included every ENSO event from 1951–2016 where the peak strength, represented by the Oceanic Niño Index, was at least 1.0°C (for El Niño) or -1.0°C (for La Niña). This excludes weak or borderline ENSO events, when the atmospheric changes are not as consistent.

    La Niña conditions in the tropical Pacific are known to shift rainfall patterns in many different parts of the world. The regions and seasons shown on this map indicate typical but not guaranteed impacts of La Niña. For further information, consult the probabilistic information that the map is based on. Image from the International Research Institute for Climate and Society (IRI).

    Nathan’s team assembled this map, which may look familiar to ENSO Blog readers. While maps like these are very important for an overview of La Niña’s impacts, some people may need more information about how often the impacts occurred during past La Niña events. Fortunately, the IRI team has made this information available. You can select the three-month period, El Niño or La Niña, and above/below average precipitation, and the map will show you how often this impact has occurred. For example, 70% of past La Niña winters in Florida were drier than average. Warning—that maproom can be quite a time sink!

    Turning impacts maps—either the one shown above, or probabilistic ones like on the IRI site—into an actual forecast can be a complicated process. (The second half of the IRI study assessed the accuracy of a few different forecasts based on ENSO impacts maps.) Official climate outlooks, like those from the Climate Prediction Center, take into consideration ENSO impacts, computer model forecasts, and knowledge of other climate patterns.

    One thing you can be sure about is that we’ll be right here, keeping you posted on La Niña 2020/21 as it evolves! Well, I might be in the IRI maproom.

    The October 2020 newsletter is hot off the presses from the #ColoradoRiver District #COriver #aridification

    Click here to read the newsletter. Here’s an excerpt:

    The Colorado River District works across • The Lower Gunnison Project near Montrose,
    the West Slope to improve infrastructure and restore rivers as part of its work to protect water supplies for all stakeholders.

    During the District’s Annual Water Seminar: Zooming in on West Slope Water on Sept. 22, speakers highlighted three projects that with the help of many partners, advance the District’s mission to protect Western Colorado’s water security.

    • The Elkhead Reservoir expansion near Hayden and Craig, completed in 2006, provides water for irrigators and the power industry while ensuring water is available to maintain river flow for endangered fish in the lower Yampa River.

    • The Lower Gunnison Project near Montrose Delta and Hotchkiss, is a multi-benefit project spearheaded by the District to modernize irrigation delivery systems.

    • The Windy Gap Bypass Channel Project in Grand County, still on the drawing board, will modify Windy Gap Reservoir to re- create a Colorado River channel and nearby flood plain.

    A recording of the webinar and presentation slides can be found at http://www.coloradoriverdistrict.org/annual-seminars/