Spring runoff in Colorado is usually marked by swelling muddy waterways, but this season things may look a little different.
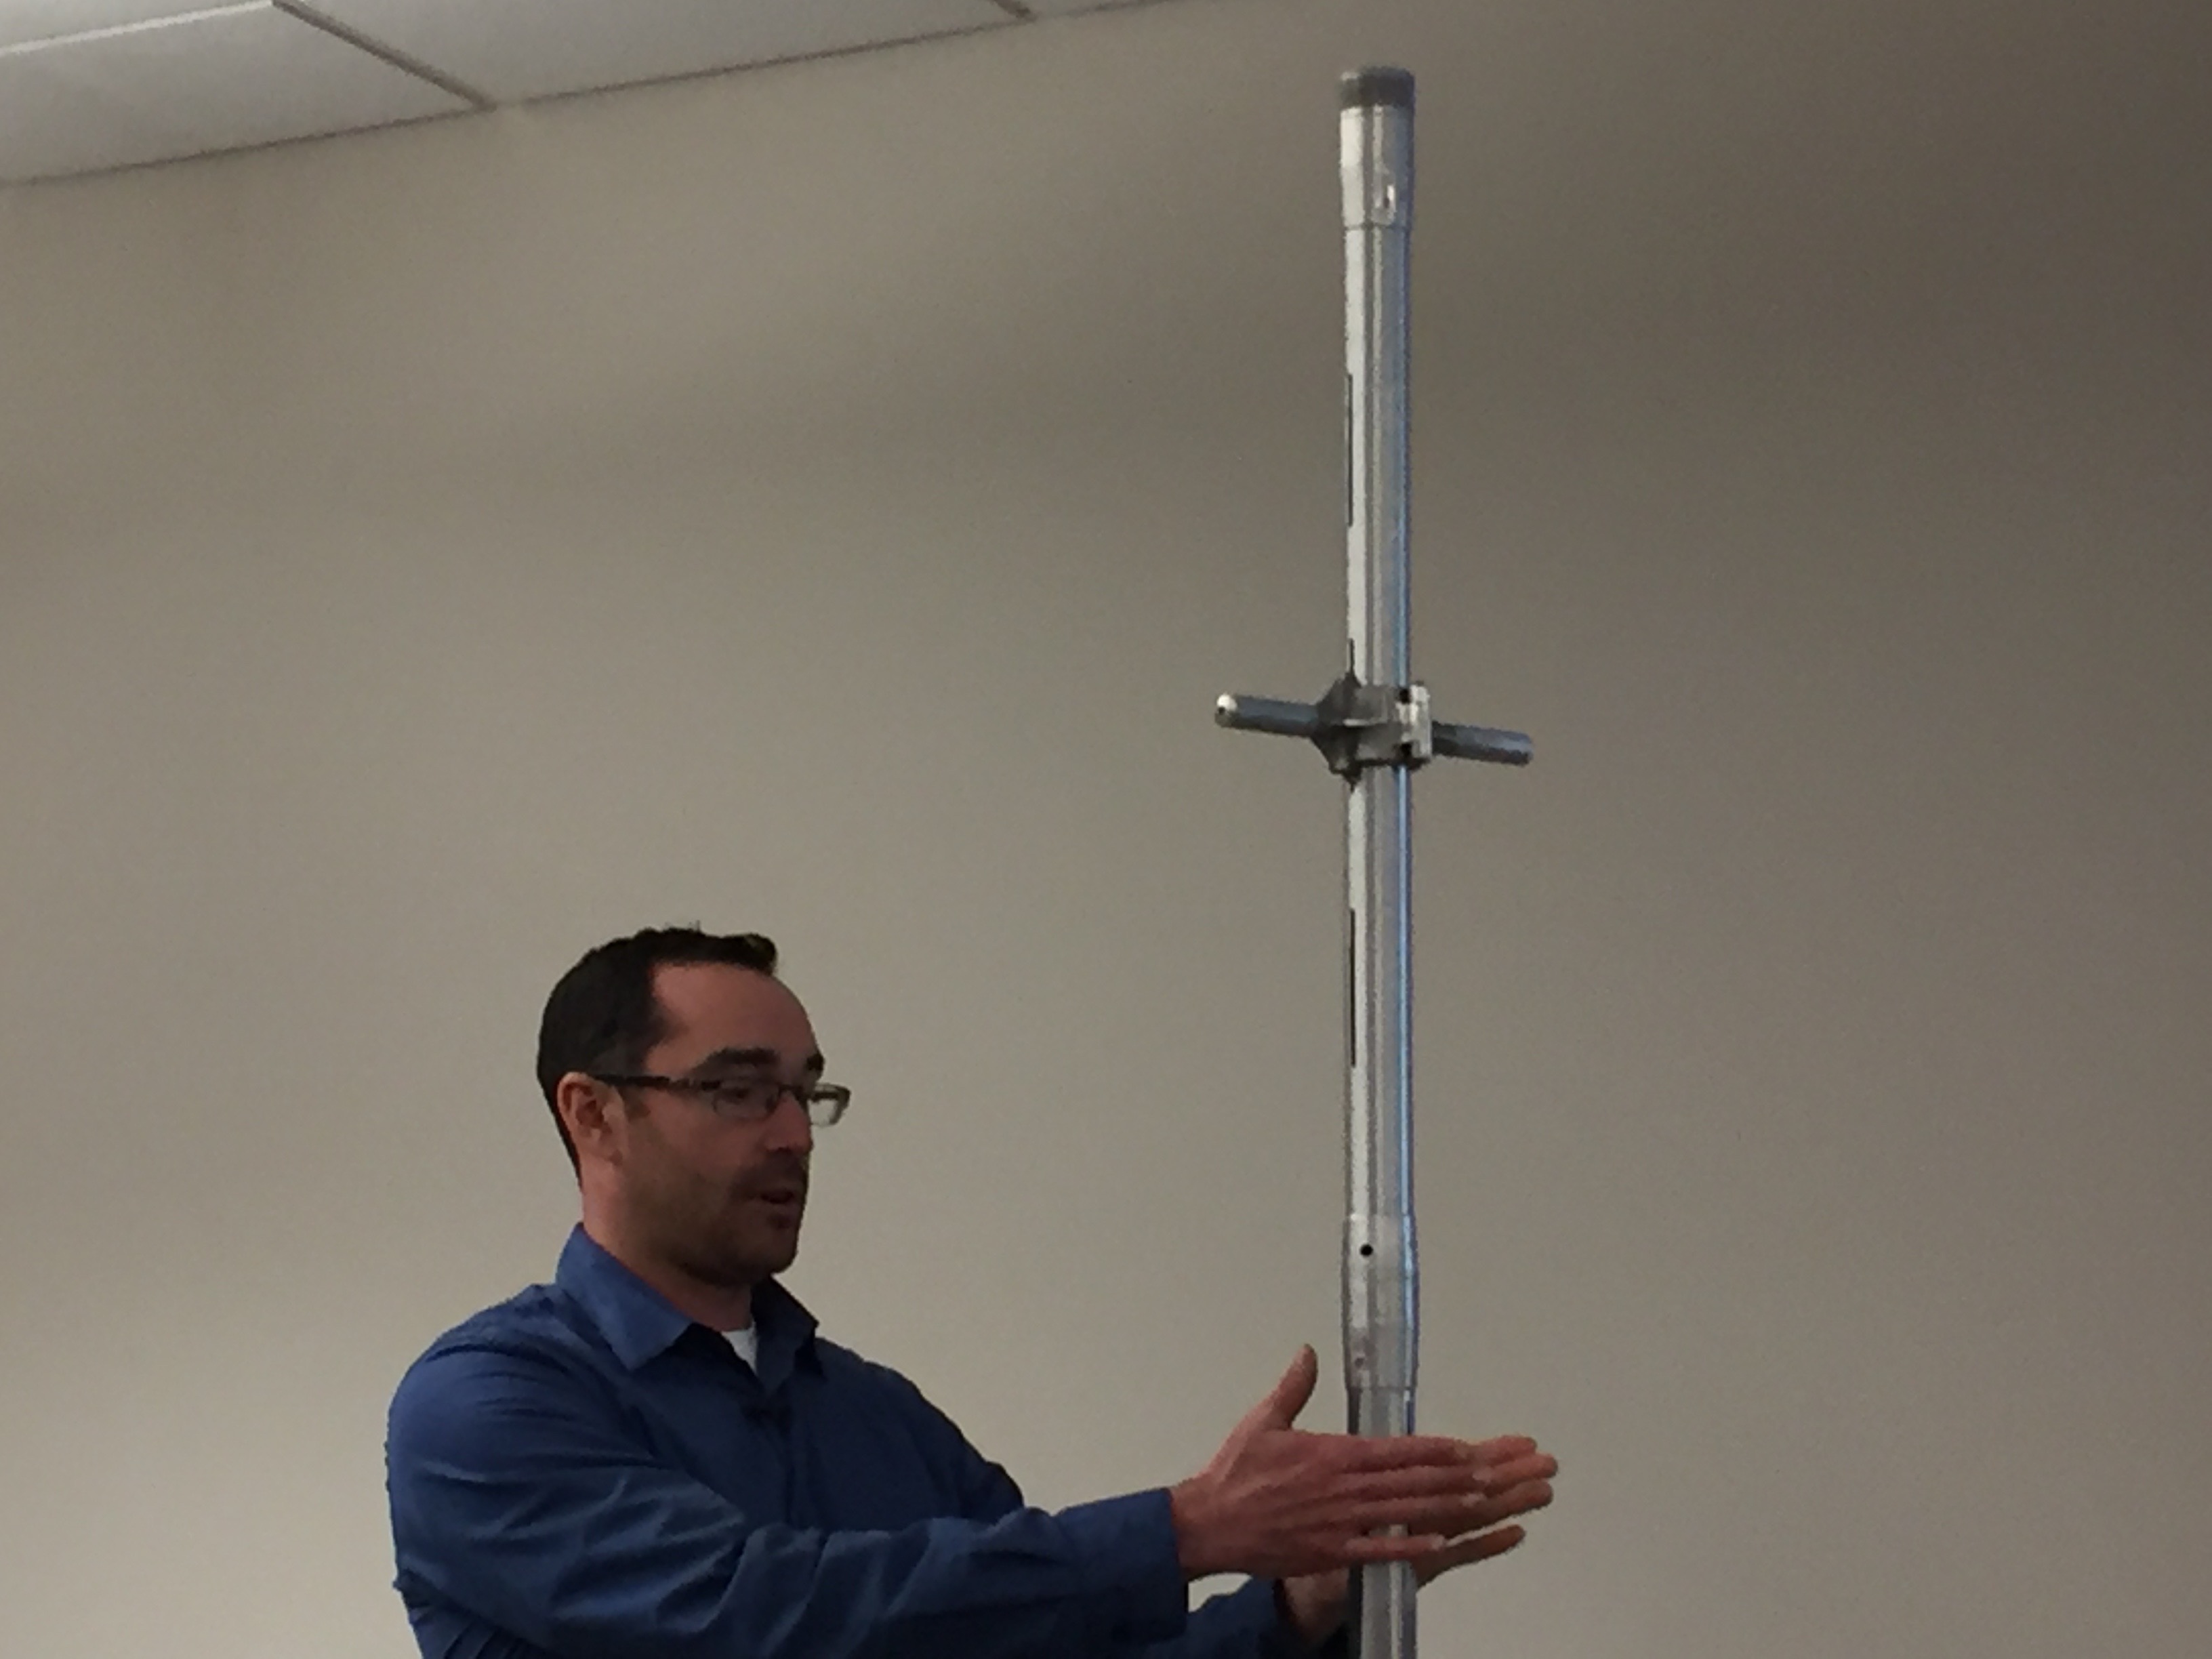
“We know the soils under the snowpack are so dry that it basically has to absorb so much of that, like a sponge, before it transmits it through to a river channel,” said Karl Wetlaufer, Assistant Supervisor for the USDA-NRCS Colorado Snow Survey.
Karl Wetlaufer (NRCS), explaining the use of a Federal Snow Sampler, SnowEx, February 17, 2017.
On [April 7, 2021], Wetlaufer and fellow hydrologist Mike Ardisan made the trek up to Berthoud Pass, one of Colorado’s 115 SNOTEL sites, to look at snowpack data.
“When you look at our data, our annual precipitation will commonly be different than our snowpack, that’s because we start officially measuring this on Oct. 1. In this year, it was a really dry October so there’s an even bigger difference between the snowpack and precipitation value.”
[…]
At Berthoud Pass, one of the highest SNOTEL sites and where Grand County and Clear Creek County meet, the snow depth measured just over 50 inches in most spots. The calculations determined that was equal to about 16 inches of water.
“We’re definitely anticipating significantly lower stream flow runoff, especially compared to our observed snowpack and were actually seeing a net decrease in snowpack even over the last week since April 1.”
[…]
The data plays an important role when it comes to our water resources. Coming off a dry summer followed by a dry winter, the melting snow that normally floods our waterways will head straight for the dry soil, impacting reservoirs and recreation.
“With those dry soils, streamflow runoff could be … 20% less compared to percent of normal,” said Wetlaufer.
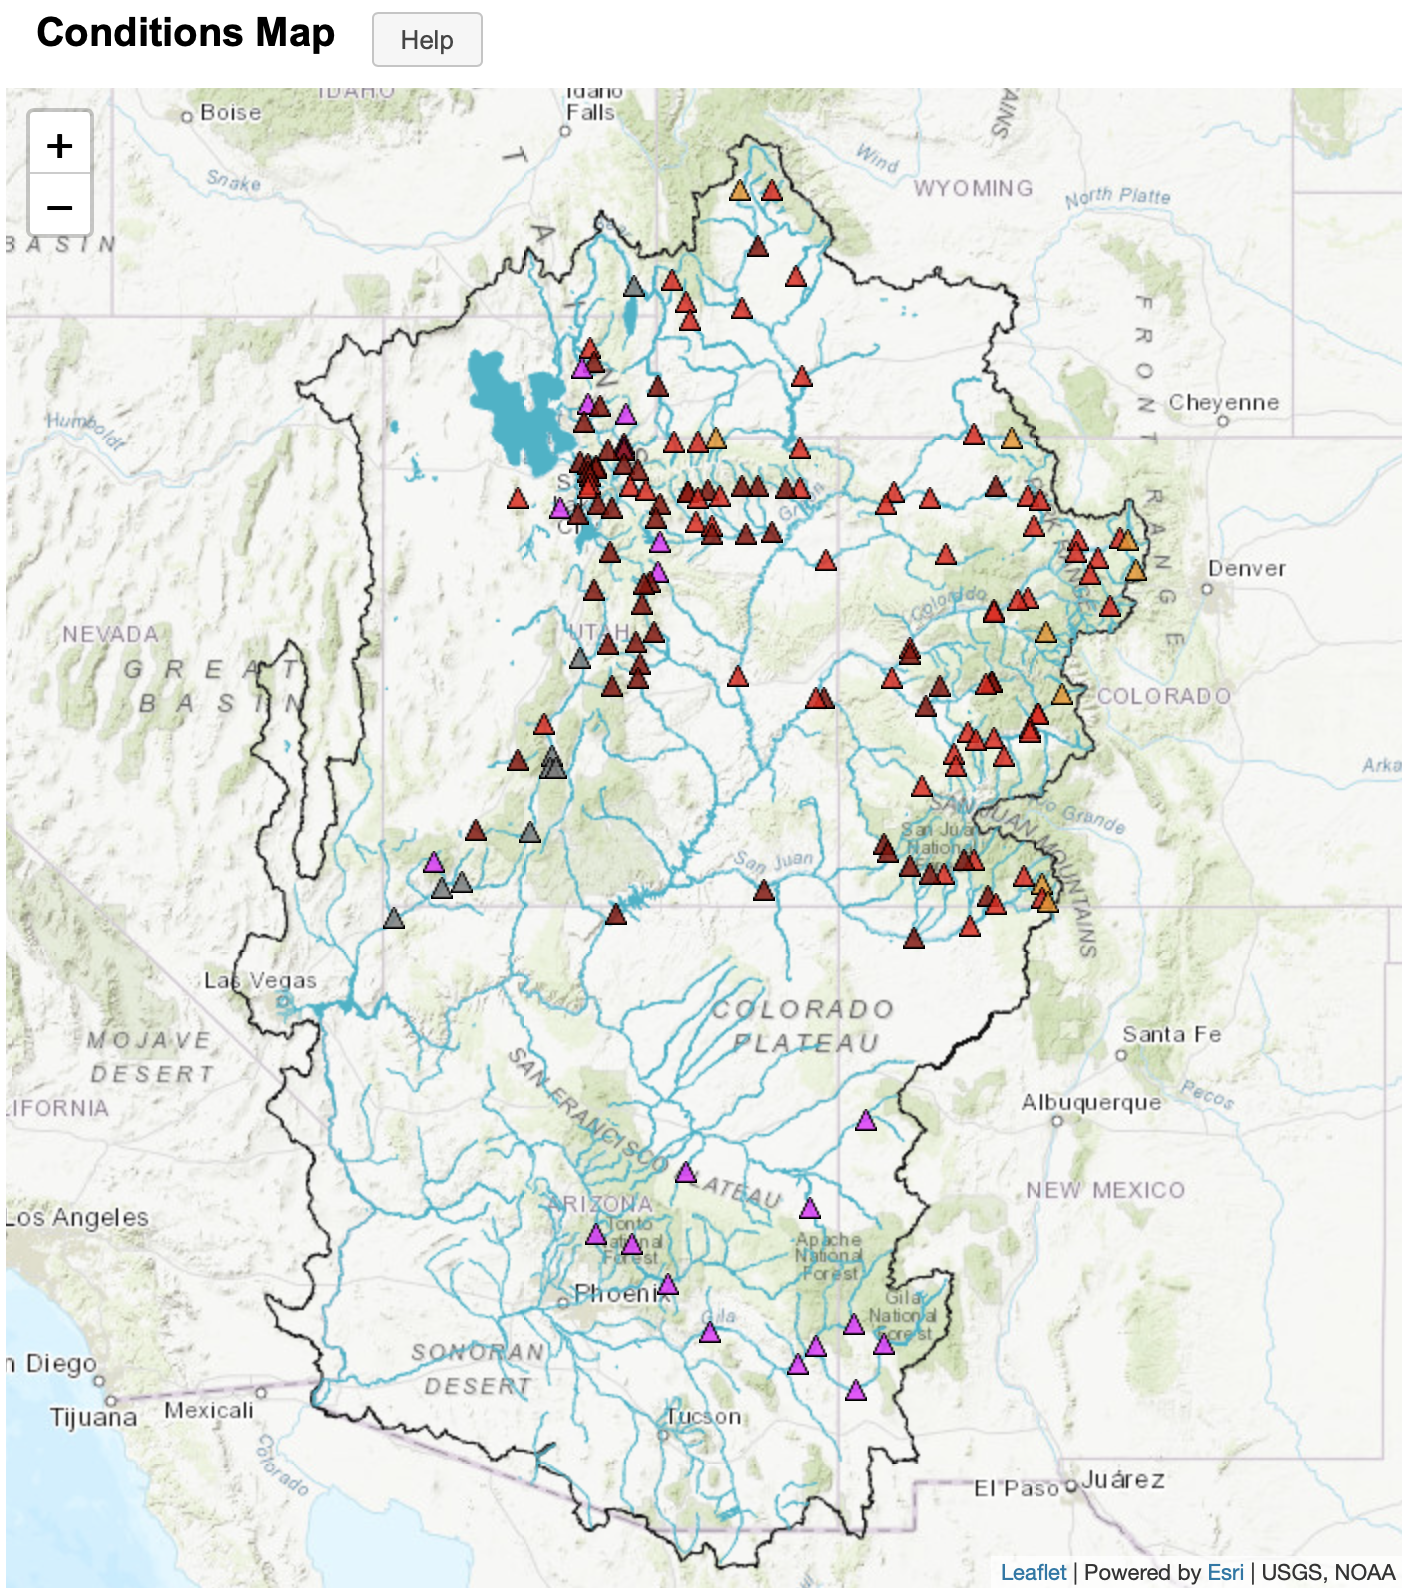
The latest streamflow forecast ranges from 40-50% below normal (average) in southwest Colorado, to just 10-15% below normal in the South Platte and Arkansas Basins.
Experts predict many areas will face water restrictions this summer.
Westwide SNOTEL basin-filled map April 9, 2021 via the NRCS.
When we talk about snowpack, we’re talking about the snow that’s been gradually accumulating in the mountains near the headwaters of our major river systems.
The water in that snow would ideally melt off slowly during the spring months so we have water in our reservoirs for the summer. It also alleviates wildfire danger.
But at this point, there are three concerning issues with our current snowpack.
Early Peak
For one, it appears that the snowpack peaked almost a week early. April 7 is the average date for the snowpack to reach its peak and start the runoff season. The data shows that it reached its highest point around April 1st. Usually, the earlier it peaks, the earlier it melts.
Low Snowpack
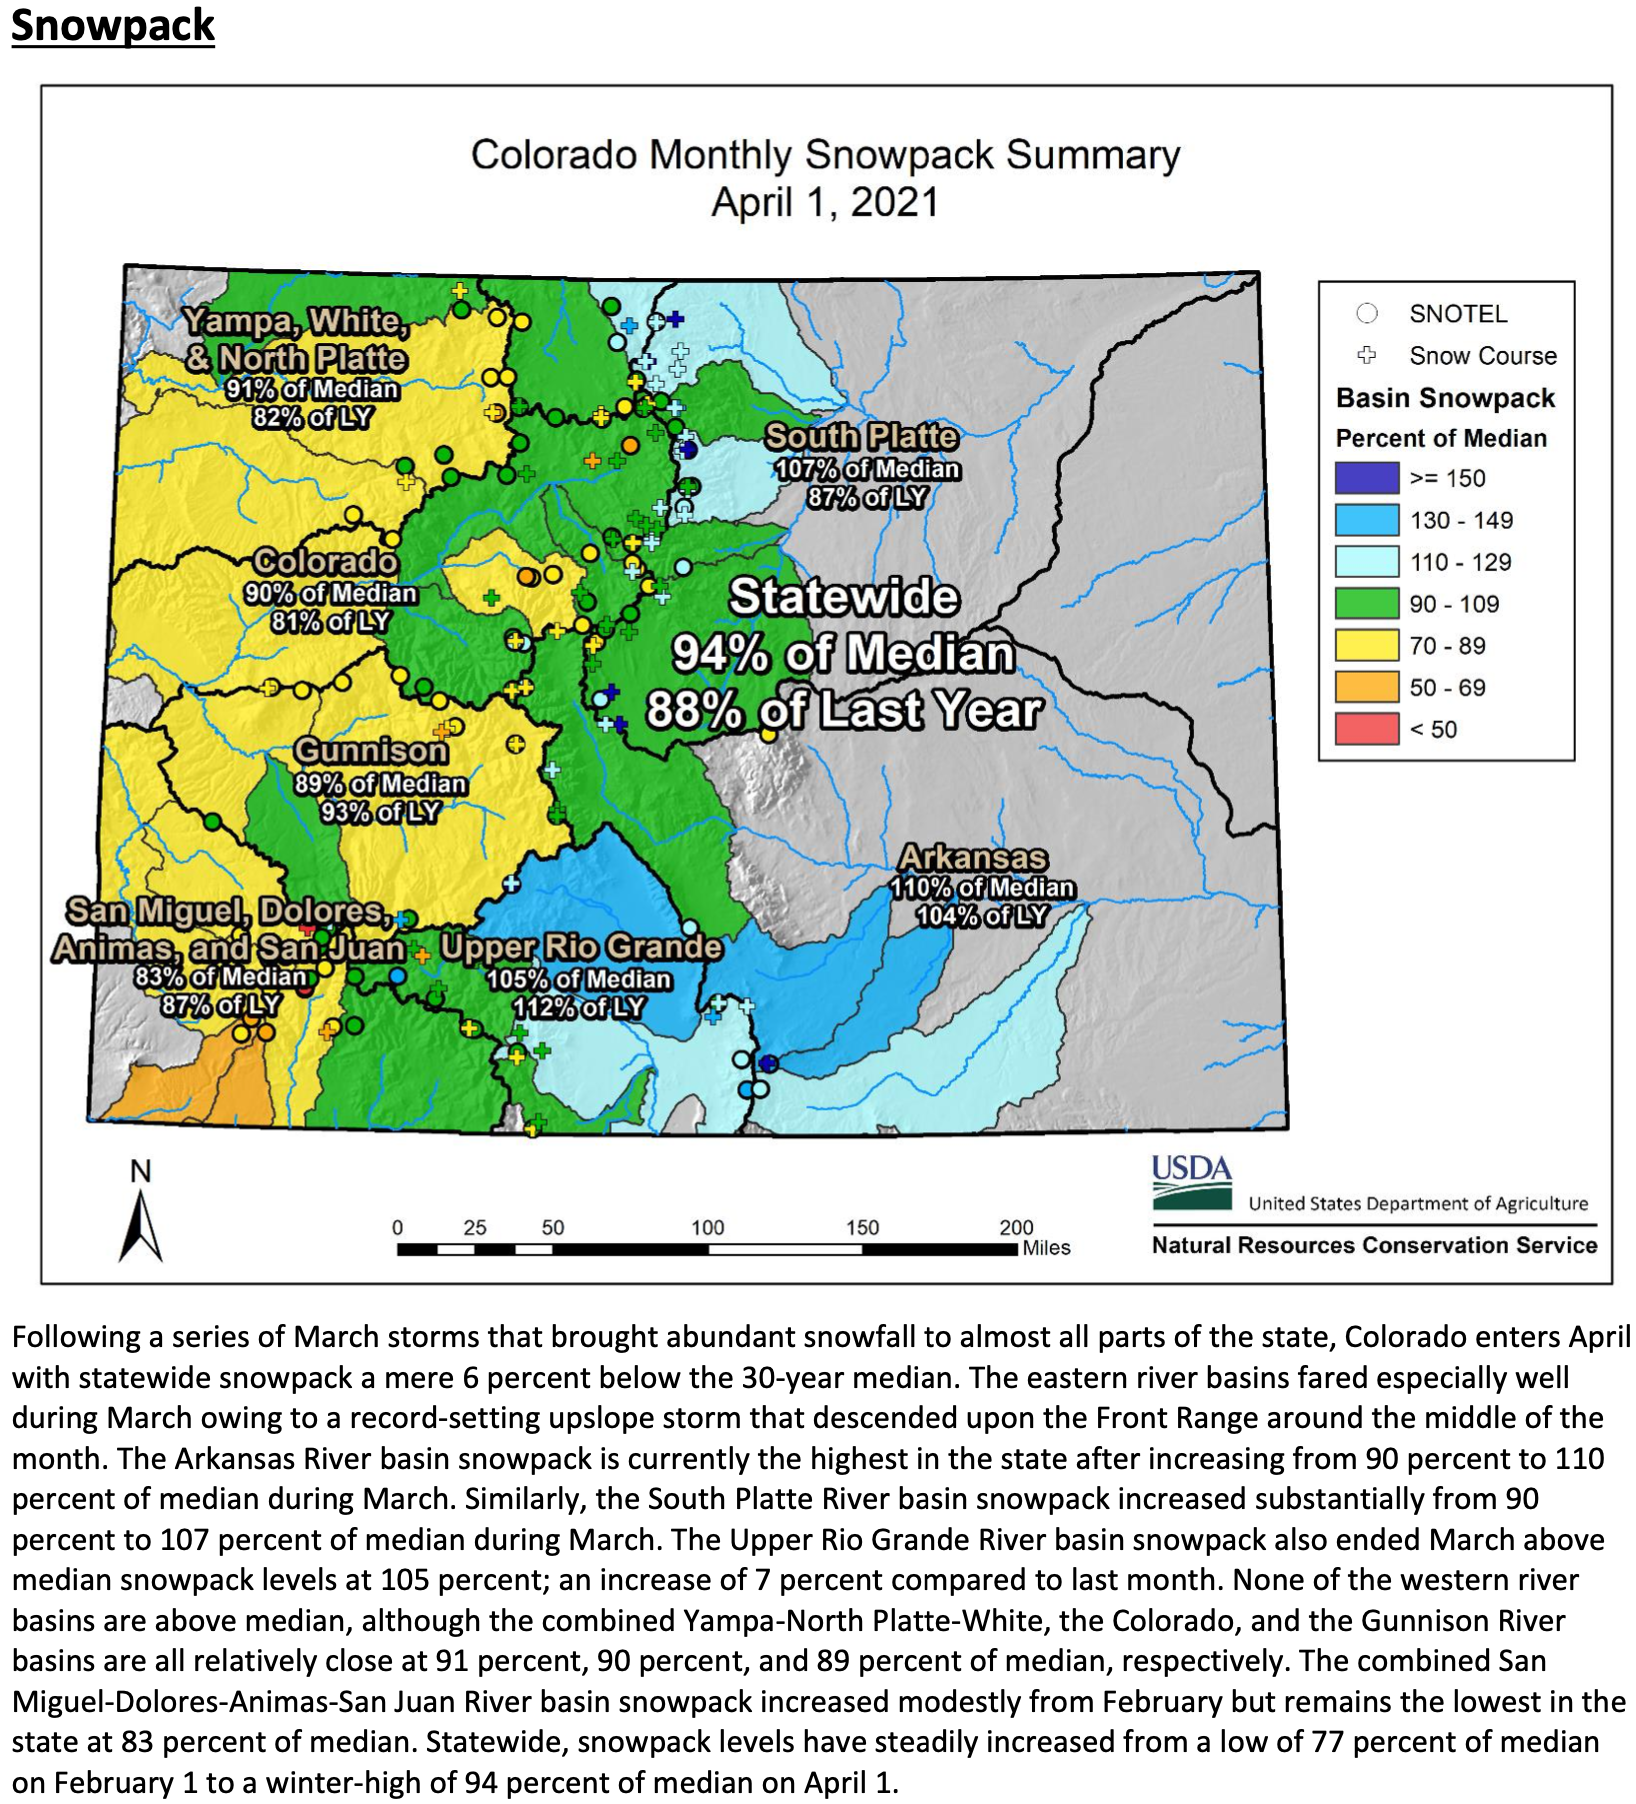
The second concern is the amount of snowpack. At its peak on April 1, statewide snowpack was 6% below average. Last year it was 7% above average. That’s 13% less snow this season.
Fast Melting
And the third concern is how fast its already melting. The snowpack is now down to 20% below average just 7 days after peaking. It didn’t get down that low last year until the final week of April.
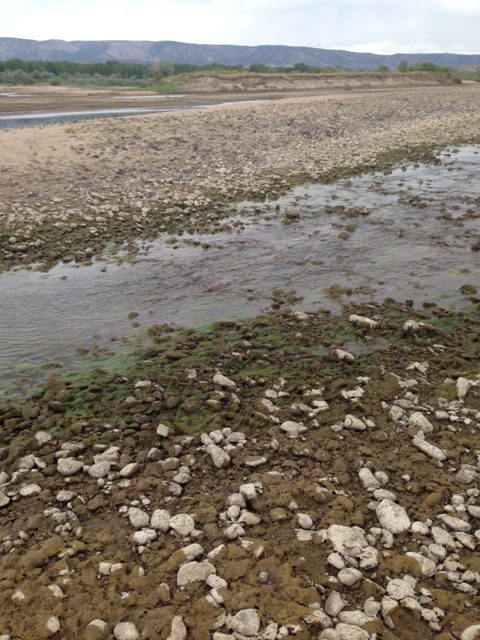
The Yampa River near the entrance to Dinosaur National Monument in the summer of 2018, the first year a call was administered on the Yampa River downstream from Steamboat Springs. Photo/Erin Light
The amount of water in the snow throughout the Yampa River watershed has started declining, indicating that snowmelt is well underway and potentially foreshadowing a summer of low flows in the river.
This measurement, called snow water equivalent inches, generally starts increasing in October and continues to grow until April when the snow starts melting. This point is often referred to as a peak, but it is too early to tell if the snowpack has peaked yet this season.
Last Saturday, this measurement reached 16.5 inches, the highest it has been all season, but has since declined to 14.5 inches on Wednesday, according to data from the Natural Resources Conservation Service. If 16.5 inches ends up being the peak for this season, it will have peaked seven days earlier and with about 3.4 inches less water than the 30-year median peak…
It’s too early to consider this the peak because it could still snow more, which has happened in previous years. In 2018, snow water equivalency appeared to peak on April 1 at 17 inches, but a snowstorm days later resulted in that year’s peak being 19.7 inches, just shy of the 20.1-inch 30-year median…
Brian Domonkos, snow survey supervisor for the Natural Resources Conservation Service, said he wouldn’t say it is a concern at this point but is definitely something to keep an eye on.
It is relatively normal to see things starting to melt at this time of year, he said. What remains to be seen for Domonkos is how much precipitation will come this spring and early summer…
There have been worse years. In 2012, snow equivalency peaked in early March at just 14.3 inches. Still, Romero-Heaney said these low snow years seem to be happening with more frequency…
The river is warmer simply because there is less water to be heated up. When heat from the sun is more concentrated in less water, it can have severe affects on the river’s aquatic life. The city is already working with partners to be able to release more water into the river this summer, something they have started to do nearly every year…
Getting moisture in mid-May to mid-June would be particularly fruitful for producers and set them up for a productive season, especially because most of the grasses that grow in this region are cool-season grasses, Hagenbuch said. These grasses will keep growing if they have water, but when that dries up, so will the grass.
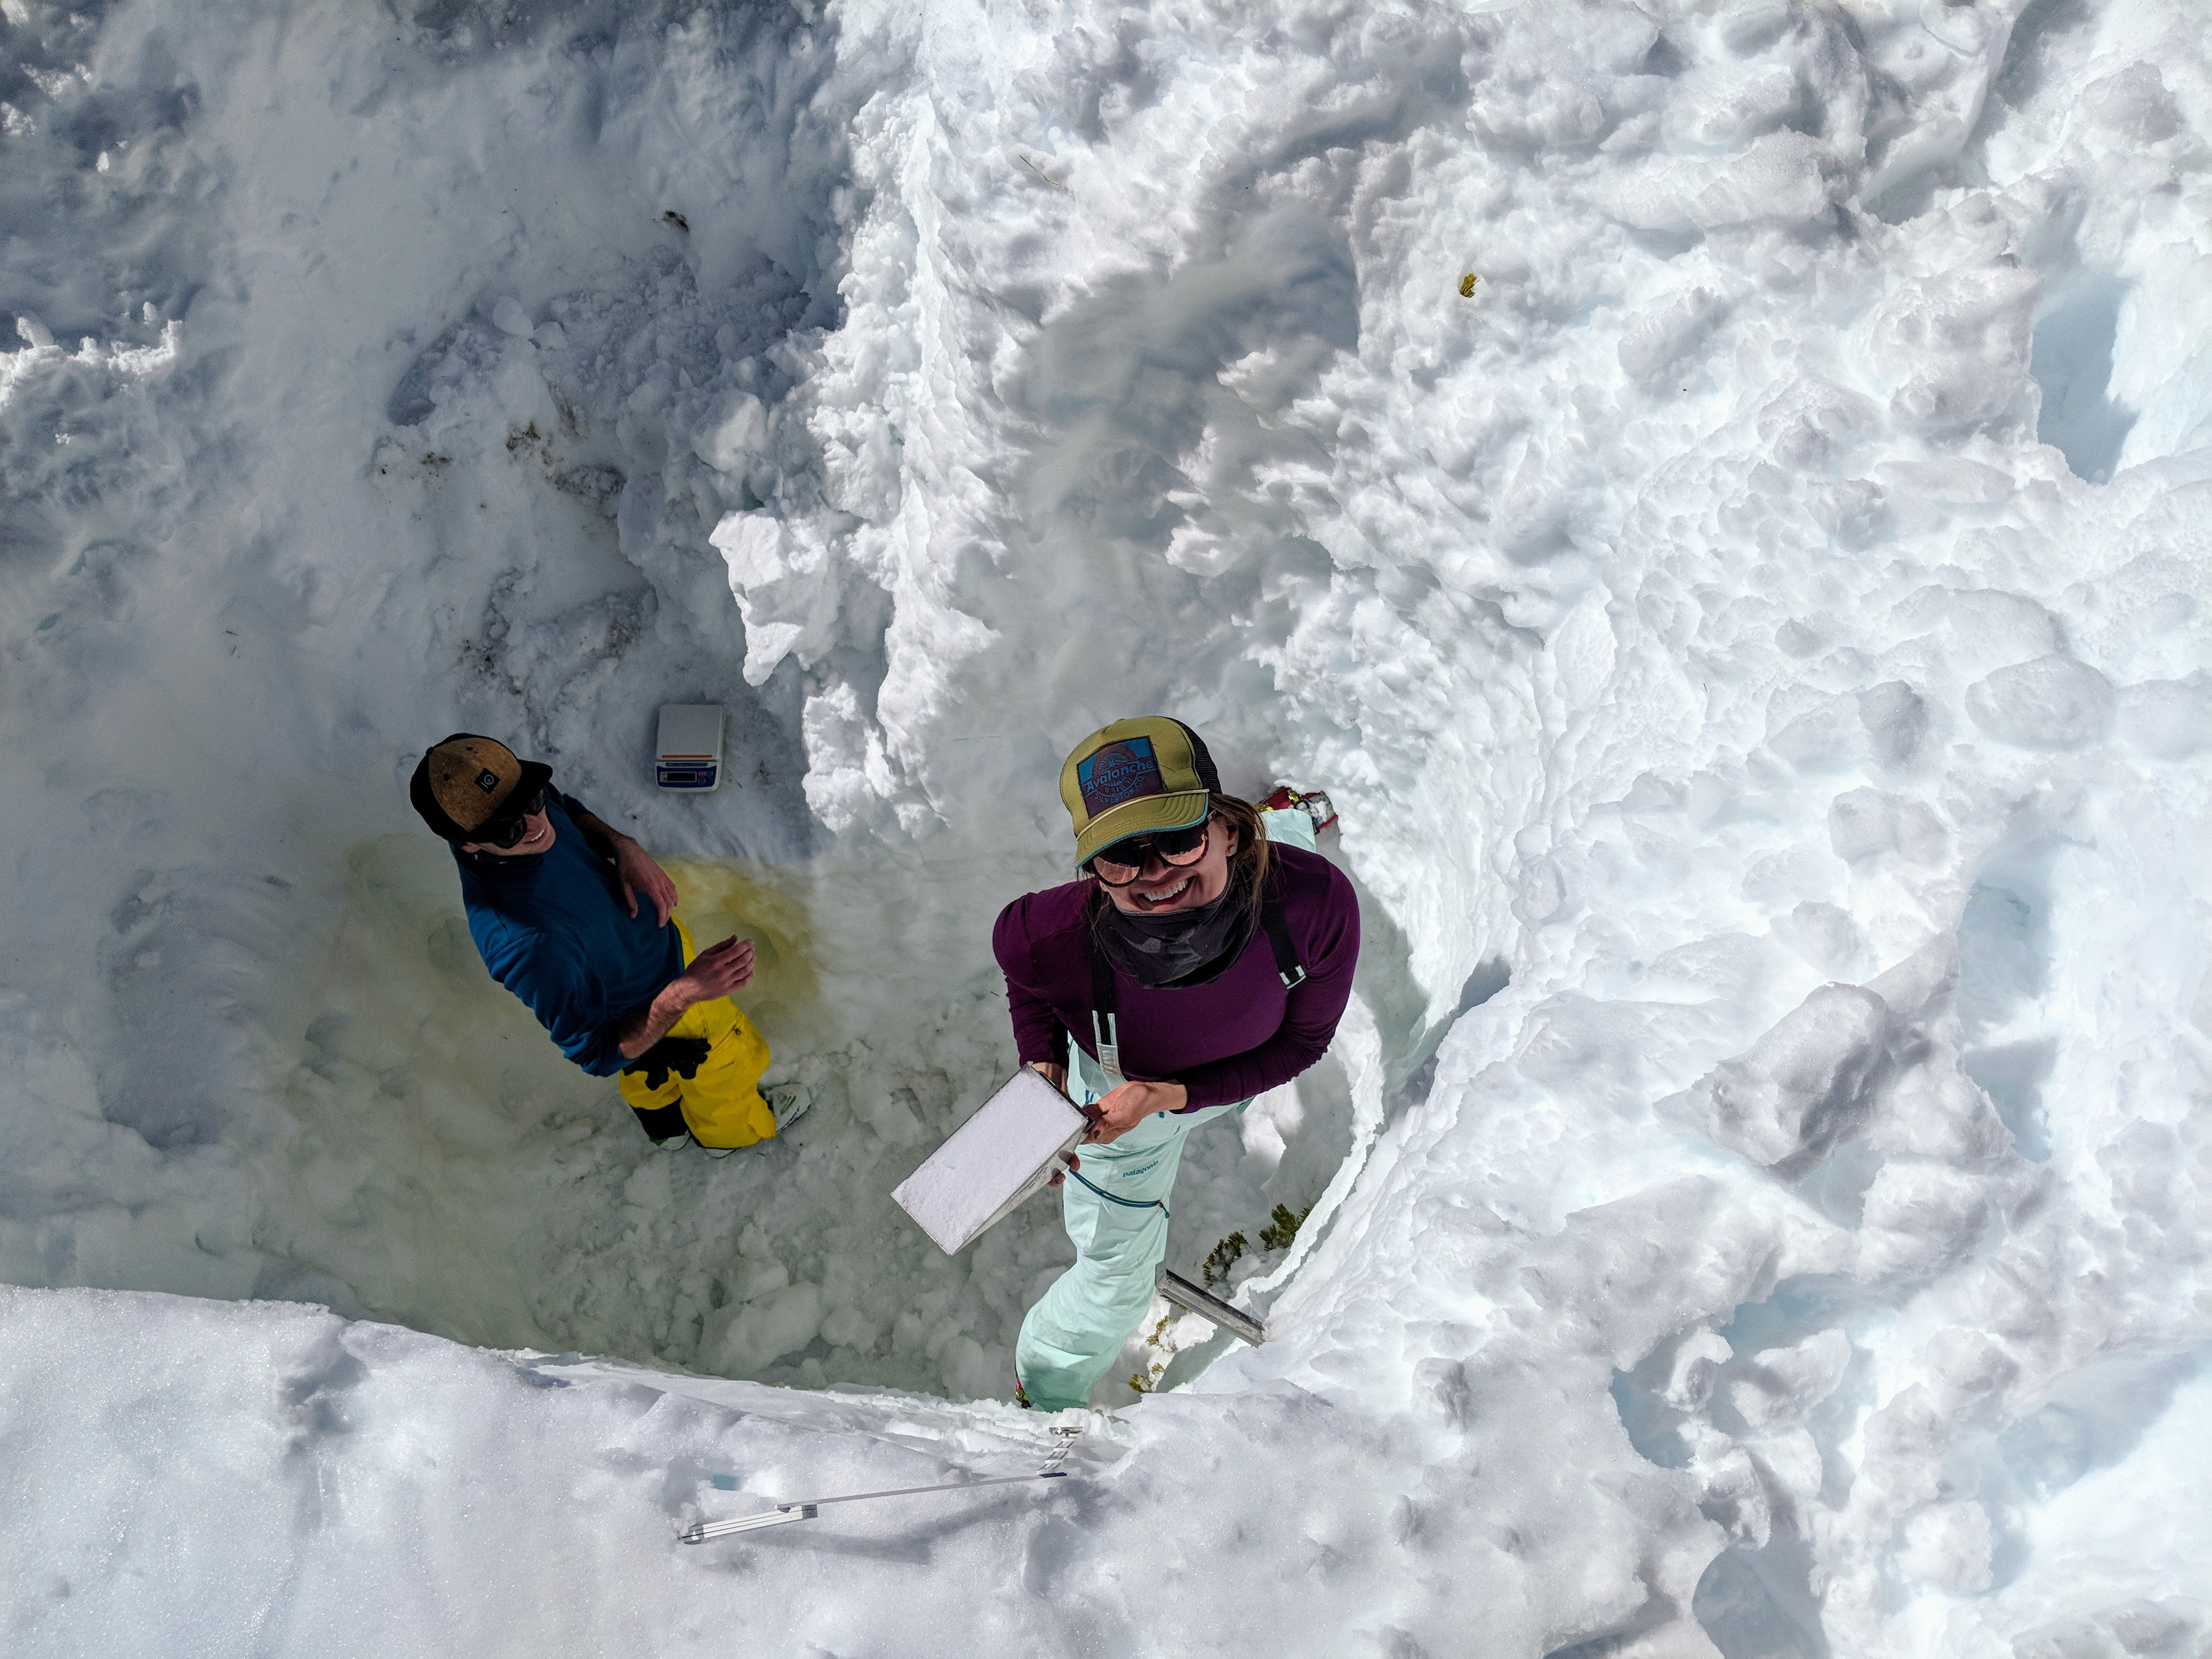
PHOTO CREDIT: McKenzie Skiles McKenzie Skiles (right) measures snow density, which is used to estimate the amount of water in the snowpack.
FromInside Climate News (Bob Berwyn and Judy Fahys):
Critical April 1 snowpack readings once again spell trouble, and new studies show the warming climate is lengthening dry spells and shrinking the snowpack, even in winter.
Lack of monsoon rainfall last summer and spotty snowfall this winter combined to worsen the Western drought dramatically in the past year, and spring snowmelt won’t bring much relief. Critical April 1 measurements of snow accumulations from mountain ranges across the region show that most streams and rivers will once again flow well below average levels this year, stressing ecosystems and farms and depleting key reservoirs that are already at dangerously low levels.
As the climate warms, it’s likely that drought conditions will worsen and persist across much of the West. Dry spells between downpours and blizzards are getting longer, and snowpack in the mountains is starting to melt during winter, new research shows. The warming atmosphere may also be suppressing critical summer rains from the western monsoon.
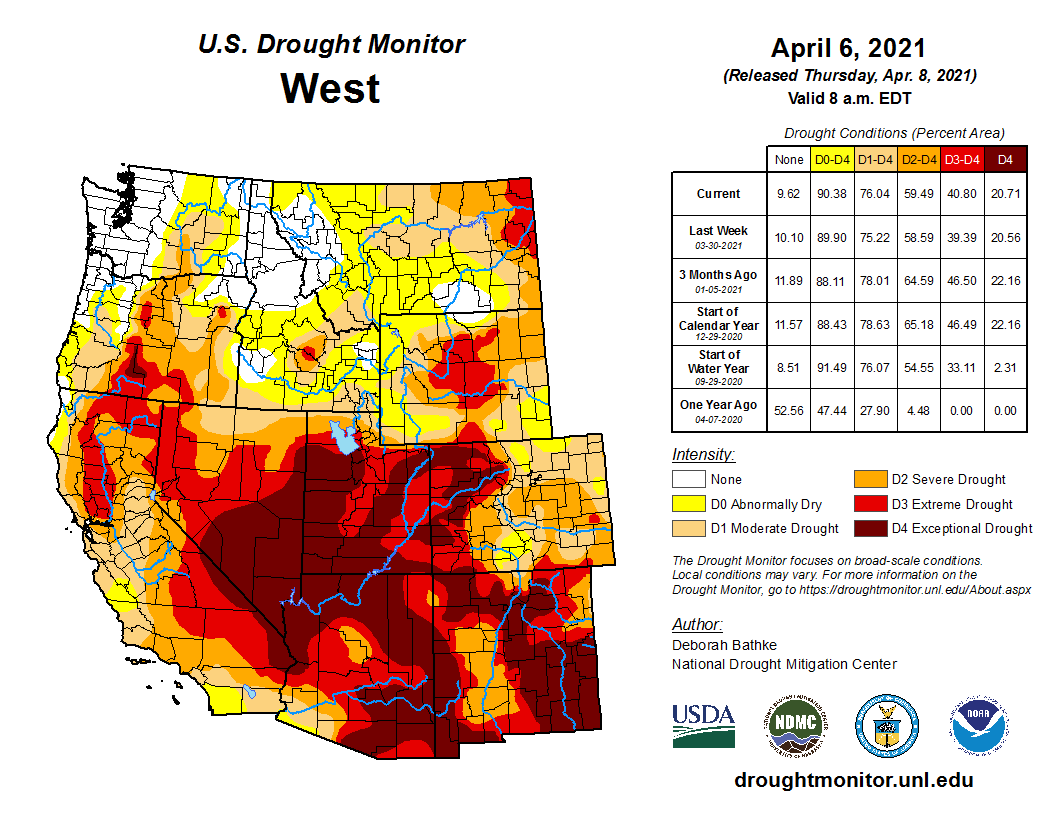
West Drought Monitor April 6, 2021.
A year ago, when California and Colorado experienced their worst fire seasons on record, drought conditions spanned about half the West, and no areas experienced “extreme” or “exceptional” conditions. But going into this year’s dry season, about 90 percent of the region is now in drought, with 40 percent in those two most severe categories.
At the end of last month, the U.S. Drought Monitor showed exceptional drought spreading across roughly half of Nevada, Arizona, Utah and New Mexico, and extending up to northern Colorado. Utah was persistently dry from January 2020 through January of this year, with some welcome snow piling up in just the last few weeks, but too little and too late to stop the state’s steady drying. California’s snowpack is about half of average, according to that state’s April 1 snow survey…
April 1, 2021 streamflow forecast Colorado Basin River Forecast Center.
Forecasters expect this year’s annual flow into Lake Powell, a key Colorado River reservoir that helps distribute water to 40 million people and vast croplands, will only be around 45 percent of normal.
Other forecasters see little chance for drought-busting storms in April, the last full month of the western wet season. Off the West Coast, a bulge of warm and dry air known as the “Ridiculously Resilient Ridge” that shifts storms northward is forming in the same general area where it contributed to the extreme drought California experienced from 2012 to 2016. As a result, the outlook for the rest of the month in the state is trending toward “extremely dry.”
This year’s parched conditions aren’t surprising to climate scientists who study the region. Nearly all recent research suggests that the West is experiencing what climatologists call aridification—decades of drying with rare relief from occasional wet years.
Research published this week by the American Geophysical Union analyzed daily temperature and precipitation readings collected between 1976 and 2019 from 337 weather stations spread from North Dakota and Texas to the West Coast.
The analysis showed that, across the West, the longest dry spells between measurable precipitation are increasing by 2.4 days per decade, while precipitation is declining about 0.09 inches and temperatures are increasing at 0.36 degrees Fahrenheit every 10 years.
Hardest hit is the Desert Southwest, where average dry spells increased by 50 percent—from 31 to 48 days—during the 45-year study period, and total annual precipitation declined by 0.75 inches per decade.
Bill K. Smith, an author of the study from the University of Arizona who studies how drought in the Southwest affects plants, said those trends have accelerated since 2000. The new study and other research shows that changes in the timing and intensity of rainfall are likely to disrupt plant communities, he said. Species that grow quickly after an intense downpour and can survive dry spells in dormancy are likely to replace those needing a steadier supply of moisture…
More Winter Snowmelt Could Disrupt Ecosystems and Water Management
One reason that less moisture is trickling down from mountains to arid landscapes below is that more snow is melting during winter, when it should be piling up, as shown in another recent study published in Nature Climate Change. That research, led by Keith Musselman, a climate scientist at the University of Colorado Boulder, is the first to compile a long-term data record from 1,065 automated weather stations in the Western United States and Canada.
One-third of those stations showed that snowmelt is increasing throughout the winter, but especially in November and March. This year, the winter snowpack in Colorado was already in steep decline on April 6, when it’s typically at its peak.
The findings show that the Western snowpack is more sensitive to warming than suggested by the commonly used measurement of the snow’s water content, Musselman said, and more winter snowmelt will complicate water resource planning. Water managers around the West have historically relied on the April 1 snowpack measurements to decide how much water to store or release from reservoirs, and how much will be available for seasonal irrigation.
The findings bolster projections that global warming will disrupt the water cycle that’s been relatively stable for at least the past few hundred years, said snow scientist Jeff Deems, part of the research team at the Western Water Assessment.
“At a basic level, this study helps quantify something you suspected, anecdotally,” he said. “We’ve grown up in a world in which snowpack has been a reliable reservoir, but it’s not that way anymore.”
The research shows that the widely used measurements from snow-sensing stations and manual surveys don’t tell the whole story of how global warming is changing the snowpack, he added.
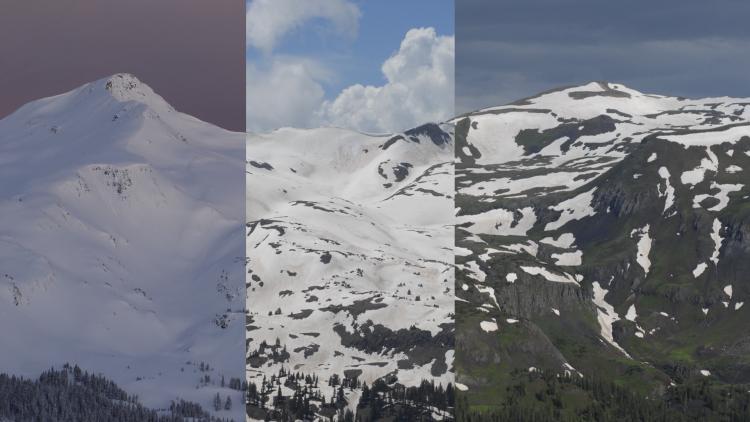
Combined photos of the Senator Beck basin in the Colorado San Juan mountains during increasingly warmer months. (Credit: Jeffrey Deems/CIRES and Matthew Kennedy/CU Boulder Extreme Ice Survey)
“We can’t rely on history anymore to tell us what is up there,” said Deems, cofounder of a company that does aerial snow measurements. Keeping up with the rapid changes warming is making to the water cycle requires more emphasis on broad-scale measurements of snow from planes and satellites, he said.
The April 1 snowpack readings worked well in the past, Musselman said, but when you add in new and rapidly changing factors like winter snowmelt, “you’re eroding your predictive capacity.”
Big Impacts Trickle Down From Winter Melting
Early snowmelt can raise winter soil moisture, which could “prime the pump for an extreme response, something like a rain-on-snow flood event,” Musselman said. Wetter cold season soils may also emit more carbon dioxide, and increasing winter runoff can wash more pollution into rivers, worsening water quality, he added.
In Yosemite National Park’s Tuolumne Meadows, Jessica Lundquist, with the Mountain Hydrology Research Group at the University of Washington, found that 2017 storms that delivered record-setting snowfall to California’s Sierra Nevada mountains also brought rain and extreme cold temperatures, which formed ice layers within the snowpack that left a “bathtub ring of damage” to trees encased by the ice. Similar frozen layers in the snowpack can also make it harder for animals like bighorn sheep to find food.
Here’s the release from the Environmental Protection Agency:
[On April 8, 2021] the U.S. Environmental Protection Agency (EPA) [release] an updated toxicity assessment for perfluorobutane sulfonic acid (PFBS), a member of a larger group of per- and polyfluoroalkyl substances (PFAS). Today’s PFBS assessment is part of EPA’s commitment to restore scientific integrity to all of the agency’s actions and increase the amount of research and information available to the public on PFAS chemicals.
“This PFBS assessment reflects the best available science, involved extensive federal, state, and public engagement, and is critical to EPA efforts to help communities impacted by PFAS,” said senior career scientist Dr. Jennifer Orme-Zavaleta, Acting Assistant Administrator for the Office of Research and Development and the agency’s Science Advisor. “The assessment posted today fixes the errors in the version issued earlier this year, was developed by EPA career scientists, and upholds the values of scientific integrity. I’m proud to release such an important assessment that will help EPA and communities take action to address PFAS and protect public health.”
EPA, federal agencies, states, tribes, and local communities can use the PFBS toxicity assessment, along with specific exposure and other relevant information, to determine if and when it is necessary to take action to address potential health risks associated with human exposures to PFBS under appropriate regulations and statutes.
The assessment released today has gone through all appropriate reviews, includes input EPA received from external peer review, upholds the tenants of scientific integrity, was authored by expert career scientists in EPA’s Office of Research and Development, and has not been compromised by political staff – these were all issues with a version of the assessment that was posted during the previous administration. The release of today’s PFBS assessment upholds the integrity of EPA’s science, which EPA, states, tribes, and more rely on to make decisions that protect the health of their communities.
From The Department of Interior (Deb Haaland and Tom Vilsack):
In response to worsening drought conditions in the West, including in areas like the Klamath River Basin, Secretary of the Interior Deb Haaland and Secretary of Agriculture Tom Vilsack released the following statement:
“Water is a sacred resource essential to feeding families, growing crops, sustaining wildlife and the environment, and powering agricultural businesses. Unfortunately, drought conditions in the West continue to worsen, including in areas like the Klamath River Basin, leading to the potential for historically low water allocations. The Departments of the Interior and Agriculture recognize the urgency of this crisis and its impacts on farmers, Tribes, and communities, and are committed to an all-hands-on-deck approach that both minimizes the impacts of the drought and develops a long-term plan to facilitate conservation and economic growth. Our agencies are actively working with Oregon, California and other western states to coordinate resources and identify immediate financial and technical assistance for impacted irrigators and Tribes. We are also committed to robust and continued engagement with state, local, and Tribal governments to develop longer term measures to respond to climate change and improve water security.”
It’s become so common, perhaps you’ve stopped noticing how often your local weather forecast is “above normal.” It’s noted during extreme heat in the summer, when mild temperatures persist through the winter, or when nights don’t cool down like they used to.
But on May 4, the hotter Earth will officially become the new normal.
That’s when the National Oceanic and Atmospheric Administration (NOAA) releases its once-a-decade update to “climate normals.” They are the 30-year averages for temperature and precipitation that local meteorologists rely on as the baseline for their forecasts. To be sure, some updates will be minuscule. But the fastest-warming places will see a real bump in their averages that could make some forecasts seem confusing and pose a challenge to meteorologists…
The current “normals” are from 1981-2010, based on data collected by thousands of monitoring stations around the country operated by the National Weather Service. The NOAA update will shift the time frame for those averages later, to the period from 1991 to 2020. The decade from 2011-2020 is one of the hottest on record in the U.S.
“It was a very substantial upward trend in temperature, especially along the West Coast, in the South and along the East Coast,” says Mike Palecki, with NOAA’s National Centers for Environmental Information.
There were exceptions; some places in the North Central part of the U.S. actually cooled a bit. But globally, the decade ending in 2020 was the hottest decade recorded since 1880…
Since the mid-20th century, Earth has warmed about 2 degrees Fahrenheit, and the pace of that warming has picked up in recent decades. Scientists warn that humans must keep global temperatures from rising more than about 3 degrees Fahrenheit in order to avoid the most catastrophic effects of climate change…
This year, to help businesses better prepare, NOAA for the first time will also put out 15-year averages using more recent temperature and precipitation data. It’s one of many ways the agency is helping people keep pace with a climate “normal” that just keeps changing.
The Cold Wave that occurred across the central United States in mid-February has preliminary damage losses in excess of $10 billion. Texas experienced the majority of these losses, with costly impacts occurring in more than a dozen additional states. This event is the most costly winter storm event on record for the U.S., surpassing losses associated with the Superstorm of 1993.
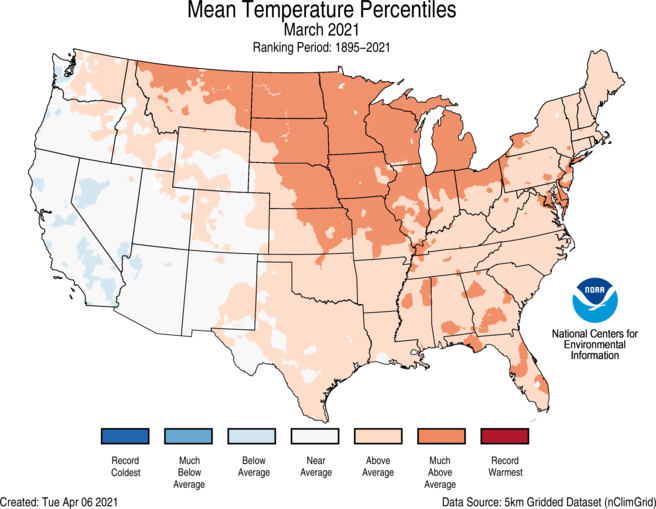
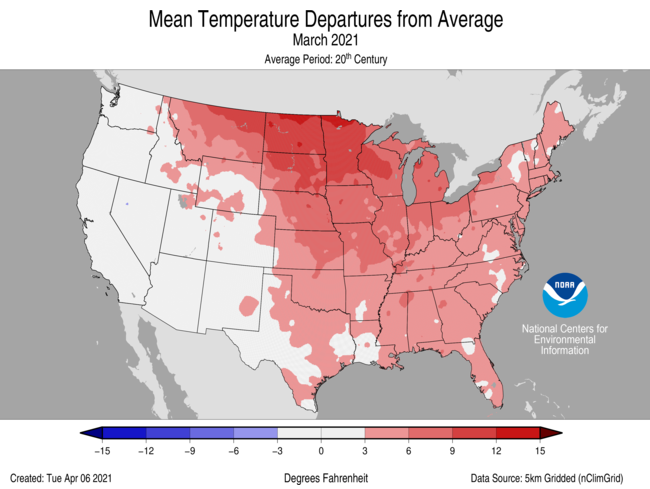
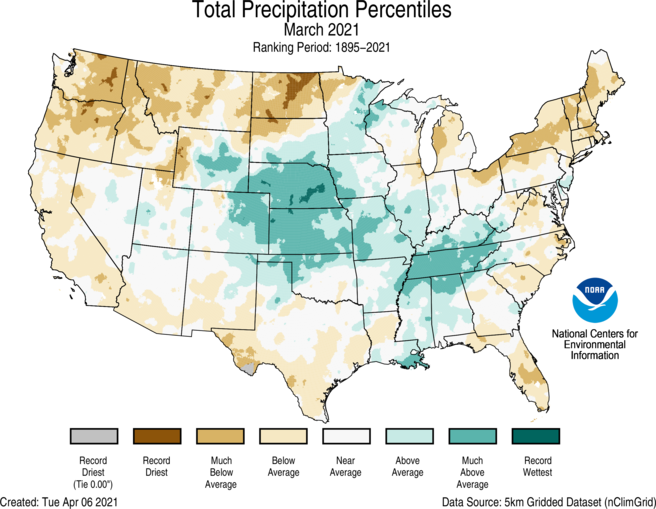
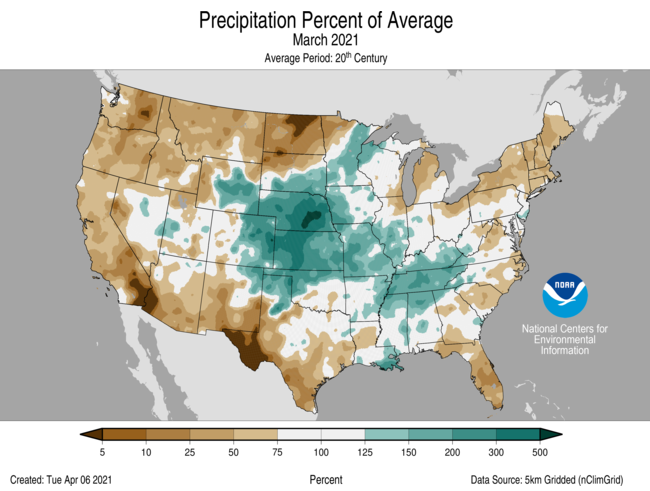
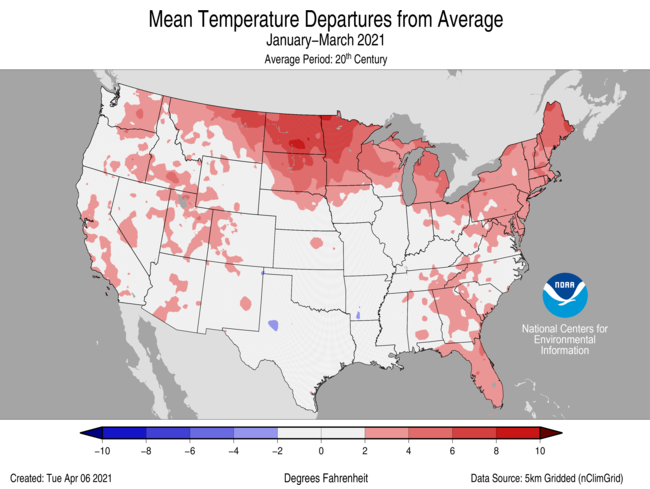
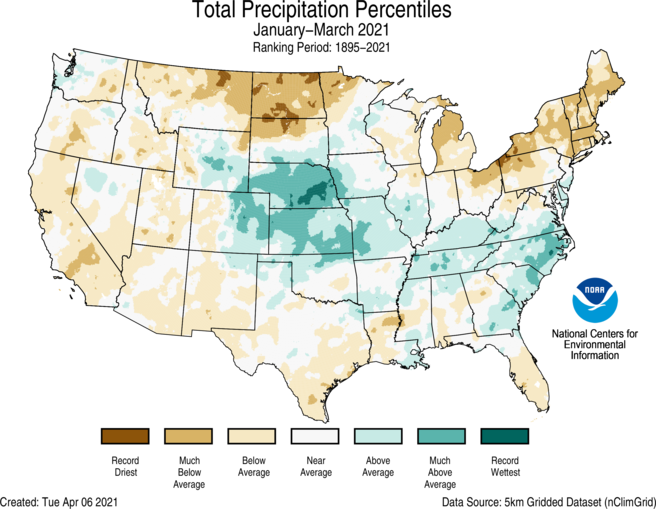
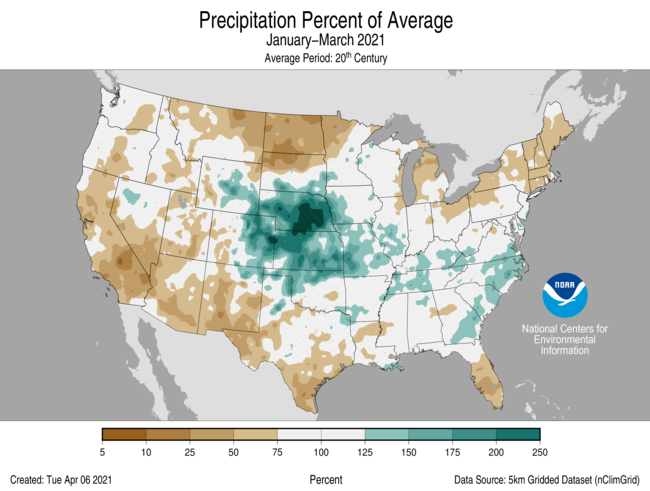
During March, the average contiguous U.S. temperature was 45.5°F, 4.0°F above the 20th-century average. This ranked in the warmest third of the 127-year period of record. The year-to-date (January-March) average contiguous U.S. temperature was 36.9°F, 1.8°F above average, also ranking in the warmest third of the record. The March precipitation total for the contiguous U.S. was 2.45 inches, 0.06 inch below average, and ranked in the middle third of the 127-year period of record. The year-to-date precipitation total was 6.55 inches, 0.41 inch above average, ranking in the middle third of the January-March record.
This monthly summary from NOAA National Centers for Environmental Information is part of the suite of climate services NOAA provides to government, business, academia and the public to support informed decision-making.
March
Temperature
Above-average temperatures were observed from the Northwest to the Great Lakes to the Gulf of Mexico and into the Northeast. Temperatures across North Dakota were fourth warmest on record. Below-average temperatures were present across parts of the West Coast during March.
The Alaska March temperature was 7.2°F, 3.6°F below the long-term average. This ranked in the coldest third of the 97-year period of record for the state and was the coldest March since 2017. On average, the coldest departures from average occurred across south-central Alaska while much of the North Slope was near average. Bering Sea ice extent was 81 percent of average for March, which contributed to above-average temperatures across the Aleutians.
Precipitation
Above-average precipitation was observed from the central U.S. to the Tennessee Valley and Gulf Coast in March. Nebraska precipitation ranked second wettest for the month. Below-average precipitation occurred across the Northwest, northern Plains, Northeast, as well as portions of the Southeast, Deep South and West. Montana and North Dakota ranked second driest on record for the month.
Precipitation across Alaska during March was much above average across western and northwestern Alaska as well as south of the Brooks Range. Juneau reported its snowiest March since 2007.
According to the March 30 U.S. Drought Monitor report, nearly 44 percent of the contiguous U.S. was in drought, down from 46.6 percent at the beginning of March. Drought conditions intensified and expanded across portions of the Northeast, Texas, northern Plains and California. Drought intensity and/or coverage lessened across parts of the central Rockies and central Plains as well as across Puerto Rico and was eliminated in Hawaii.
Year-to-date (January-March)
Temperature
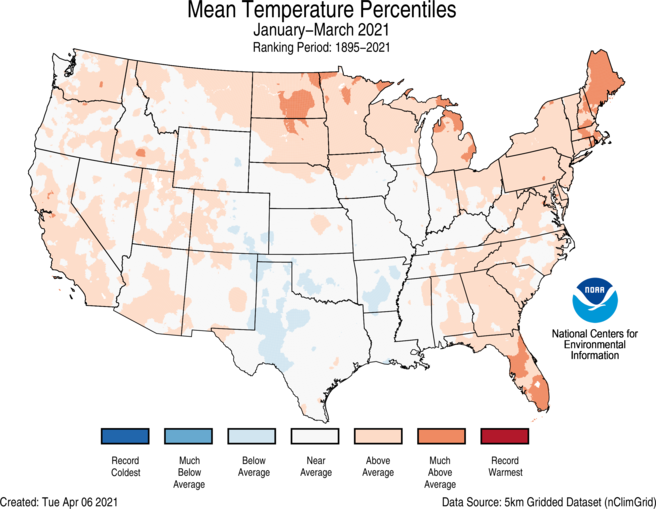
Above-average temperatures were present across the Northern Tier and Northeast as well as portions of the West and Southeast. Despite the broad extent of warmth seen during March across the Lower 48, temperatures over the first three months of the year were near average across a wide portion of the U.S. This was in large part due to the cold weather experienced during February. Below-average temperatures occurred across portions of the South.
The Alaska January-March temperature was 6.3°F, 0.4°F above the long-term average, ranking in the middle third of the record for the state. Above-average temperatures occurred across Bristol Bay and the Aleutians during the first three months of 2021 with the remainder of the state experiencing near-average conditions.
Precipitation
Above-average precipitation stretched from the central Plains to the East Coast during January-March. Nebraska ranked second wettest on record. Dry conditions were present across much of the West, northern Plains, Great Lakes, Northeast and parts of the South and Southeast. North Dakota ranked driest on record for this three-month period.
For more detailed climate information, check out our comprehensive March 2021 U.S. Climate report scheduled for release on April 13, 2021.
Here’s the release from the NRCS Colorado (Brian Domonkos):
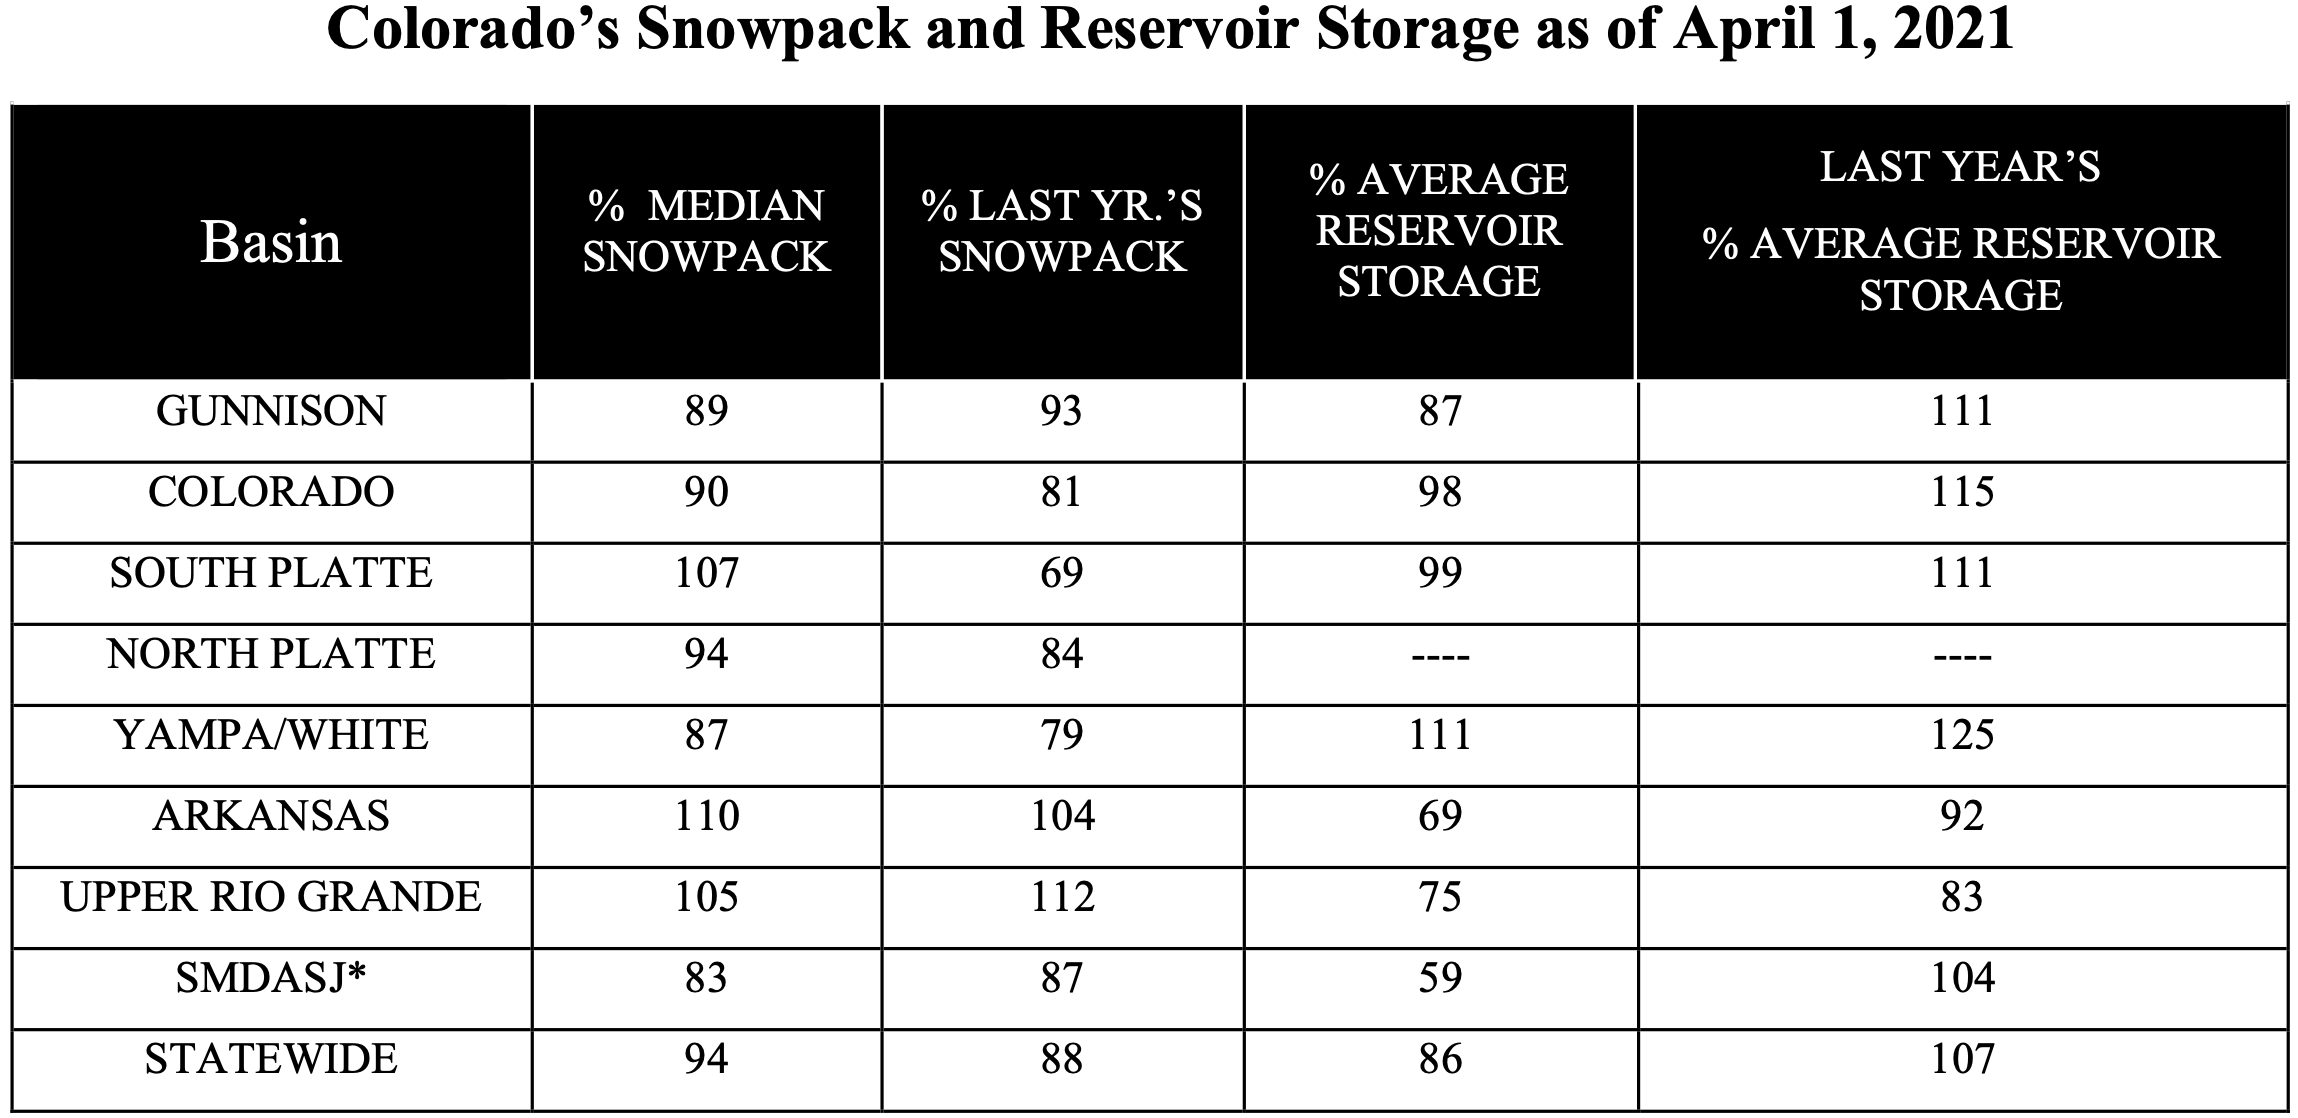
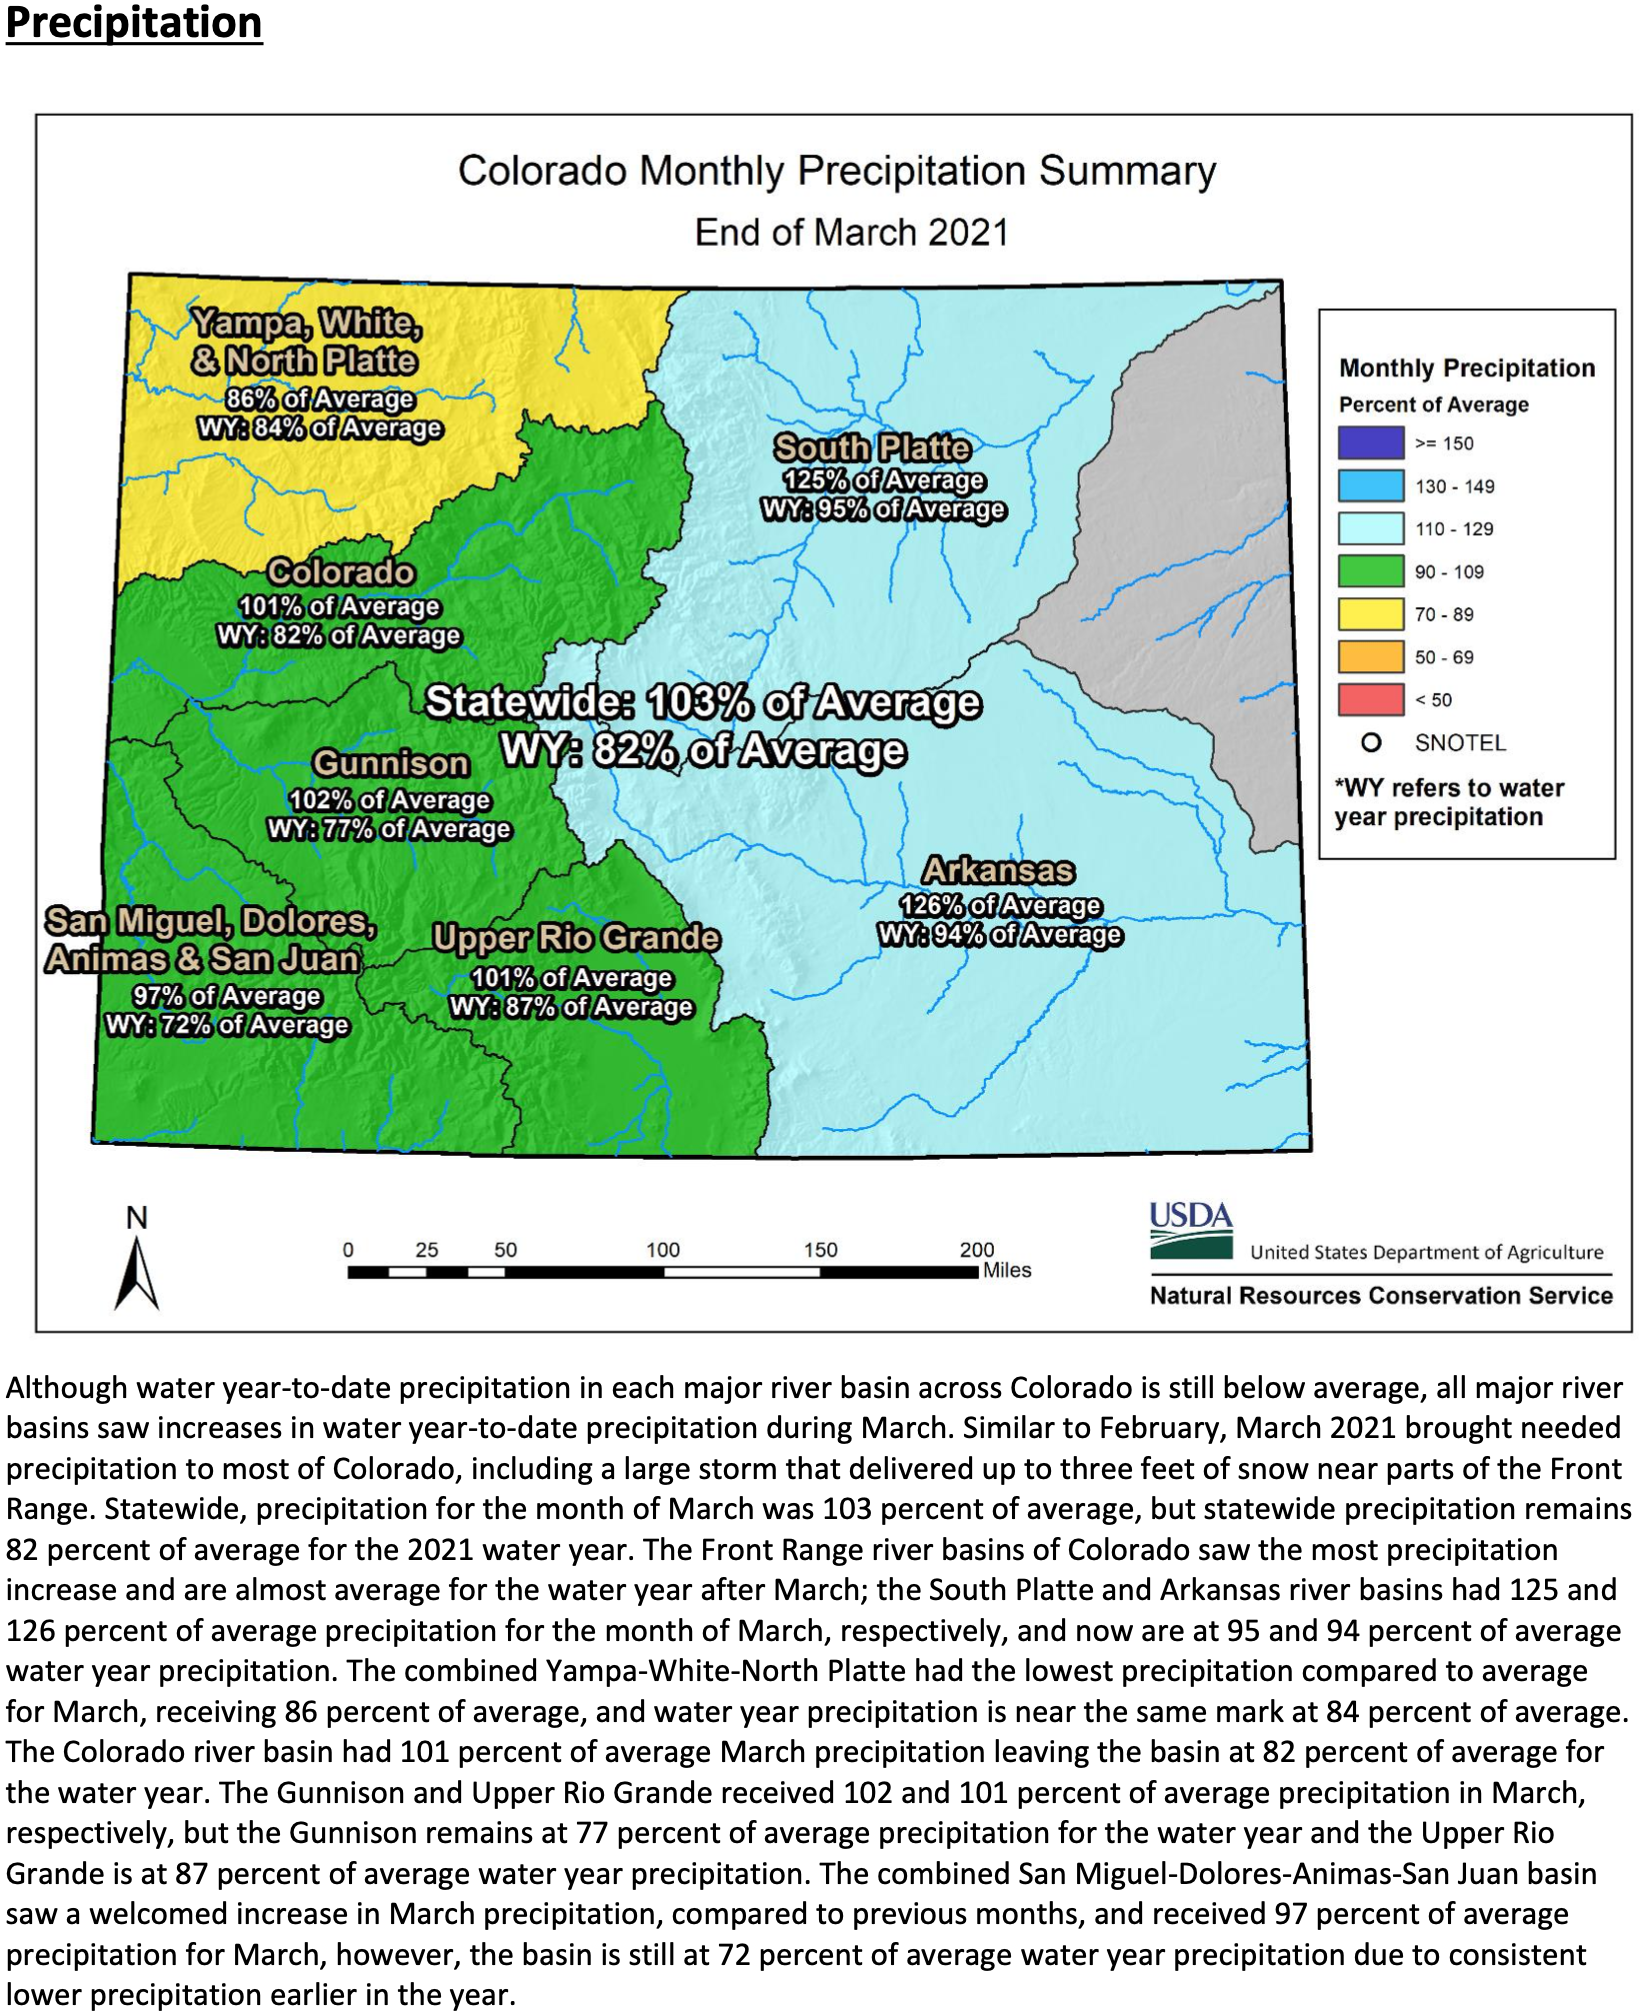
Several low-pressure systems moved across the state bringing heavy snow accumulations to the eastern slopes of the Colorado Rockies during March. Precipitation in March ranged from a high of 126 percent of average in the South Platte River Basin to as low of 86 percent of average in the combined Yampa-White-North Platte River Basins. NRCS Hydrologist Joel Atwood notes, “Generally storms in March improved snowpack across the state with the greatest gains in eastern river basins. Despite these storms, warmer temperature in the mountains have already begun melting the snowpack.” Snowpack as of April 8th ranges from a low of 71 percent of median in the combined San Miguel-Dolores-Animas-San Juan river basin to a high of 92 percent of median in the South Platte River Basin.
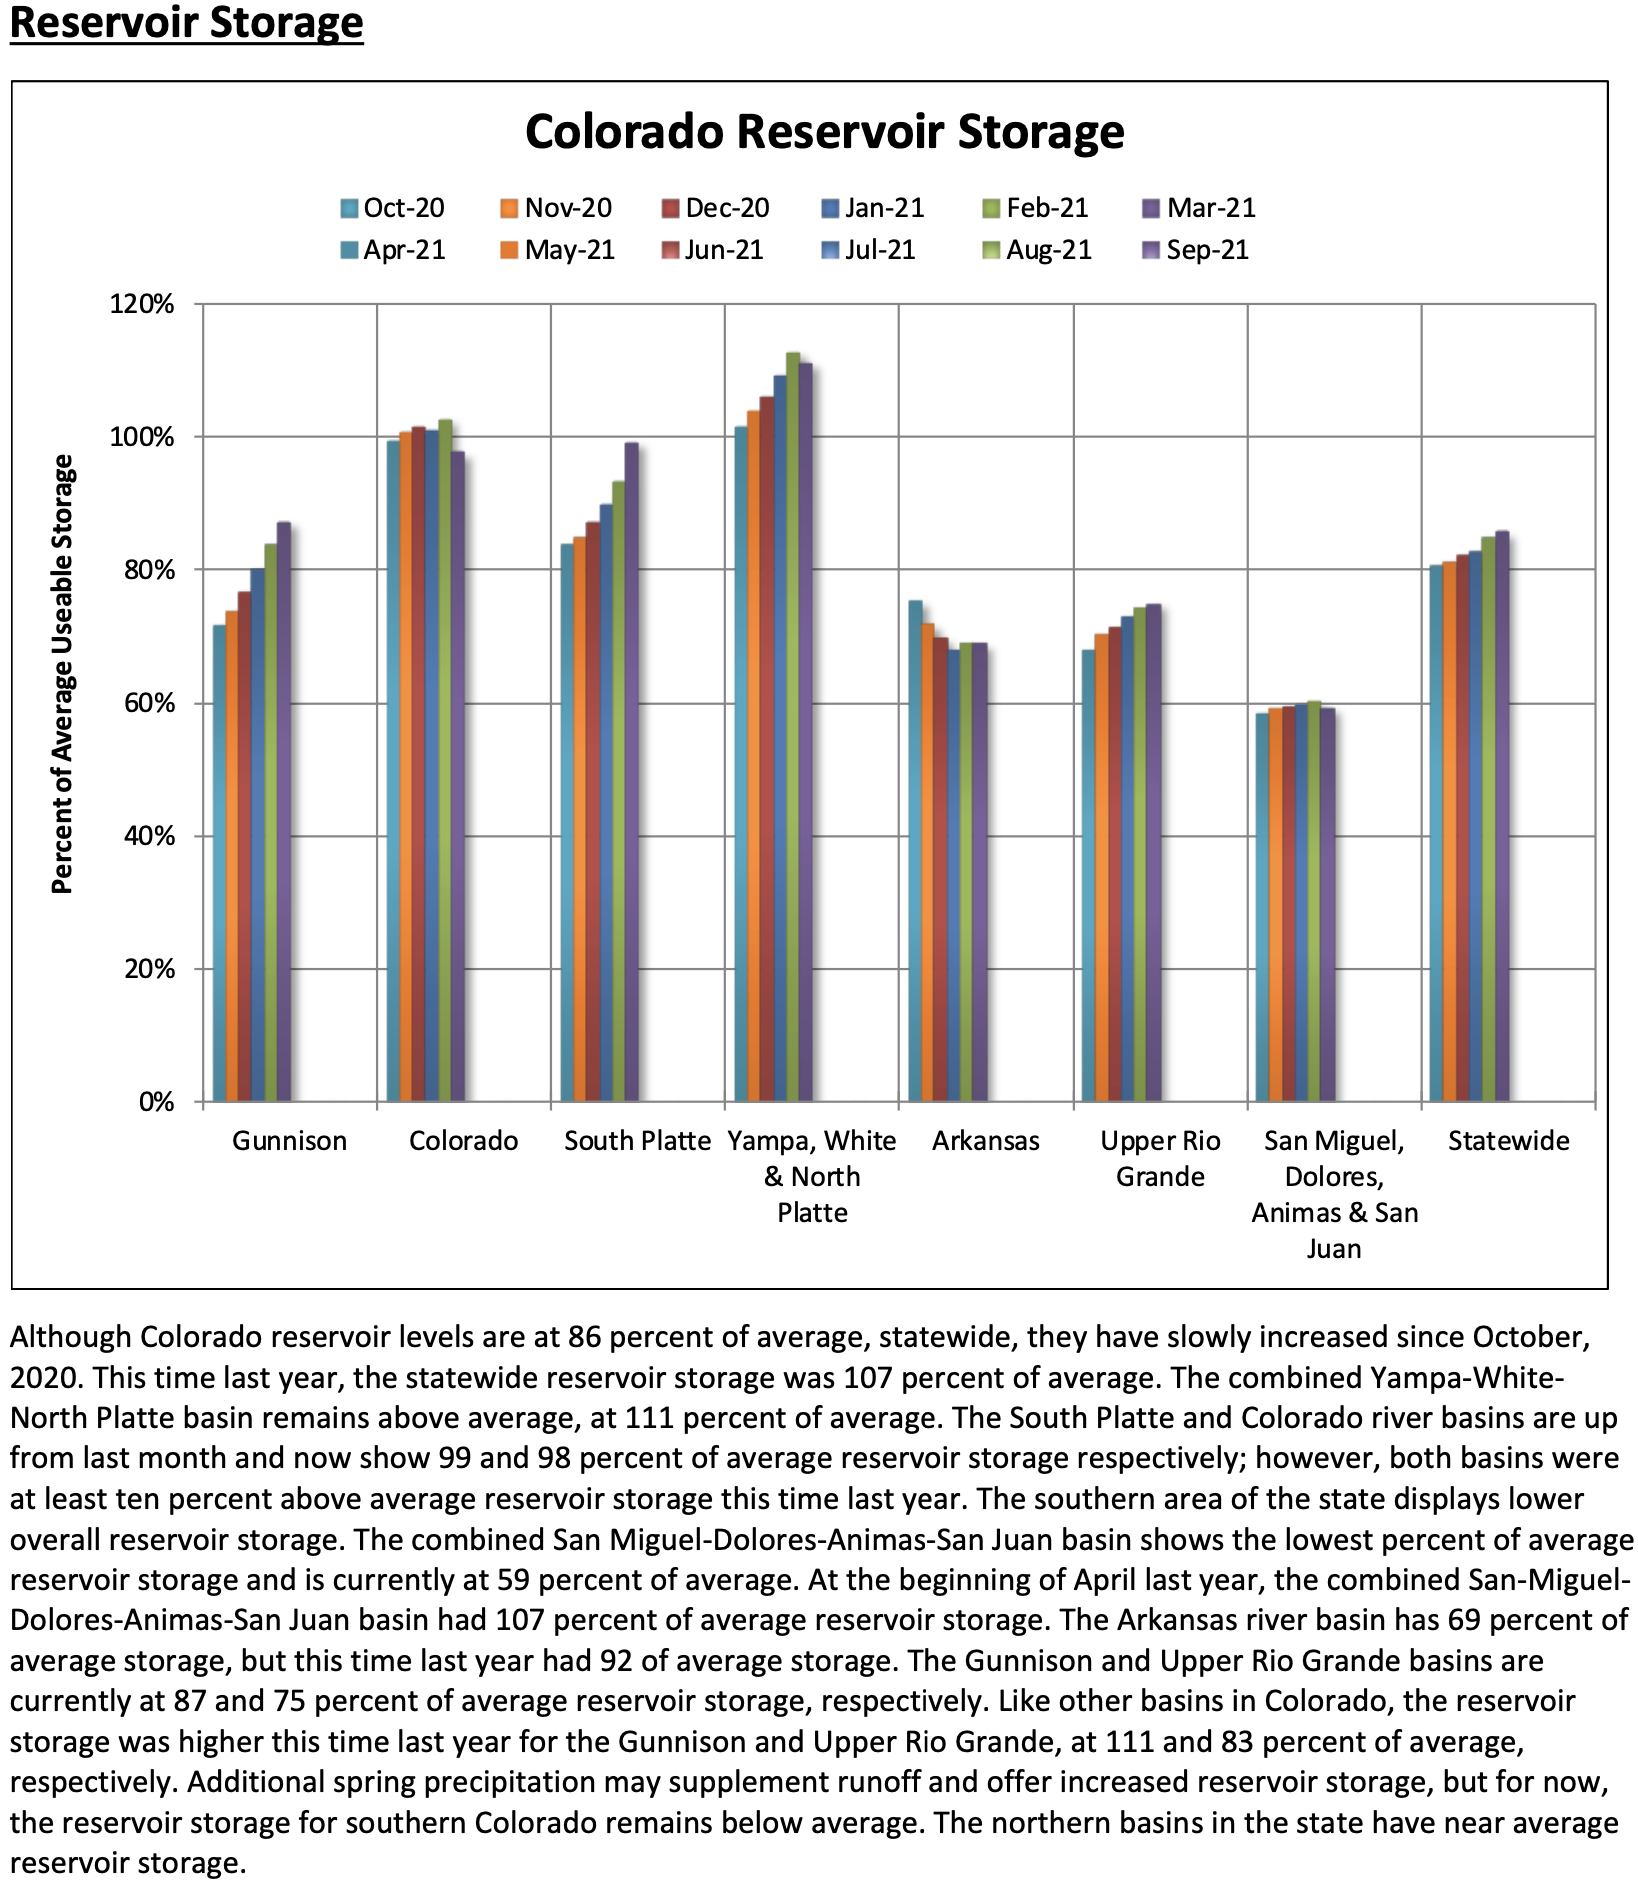
Statewide reservoir storage only increased by a percentage point over last month. Currently, the only river basin in the state holding above average reservoir storage is the combined Yampa-White river basins. On the low end, the combined San Miguel-Dolores-Animas-San Juan and the Arkansas river basins have 59 and 69 percent of average reservoir storage, respectively.
A drought that was well in place as the snowpack began to accumulate has had little relief with recent precipitation as all basins in the state continue to maintain below average water year-to-date precipitation. Before the water year, an exceptionally warm and dry summer and fall has resulted in extremely dry soils. NRCS Hydrologist Atwood continued to comment that “A combination of dry soils and below normal water year-to-date precipitation will likely moderate the runoff produced from snowmelt, producing lower volumes than would commonly be observed with a similar snowpack.”
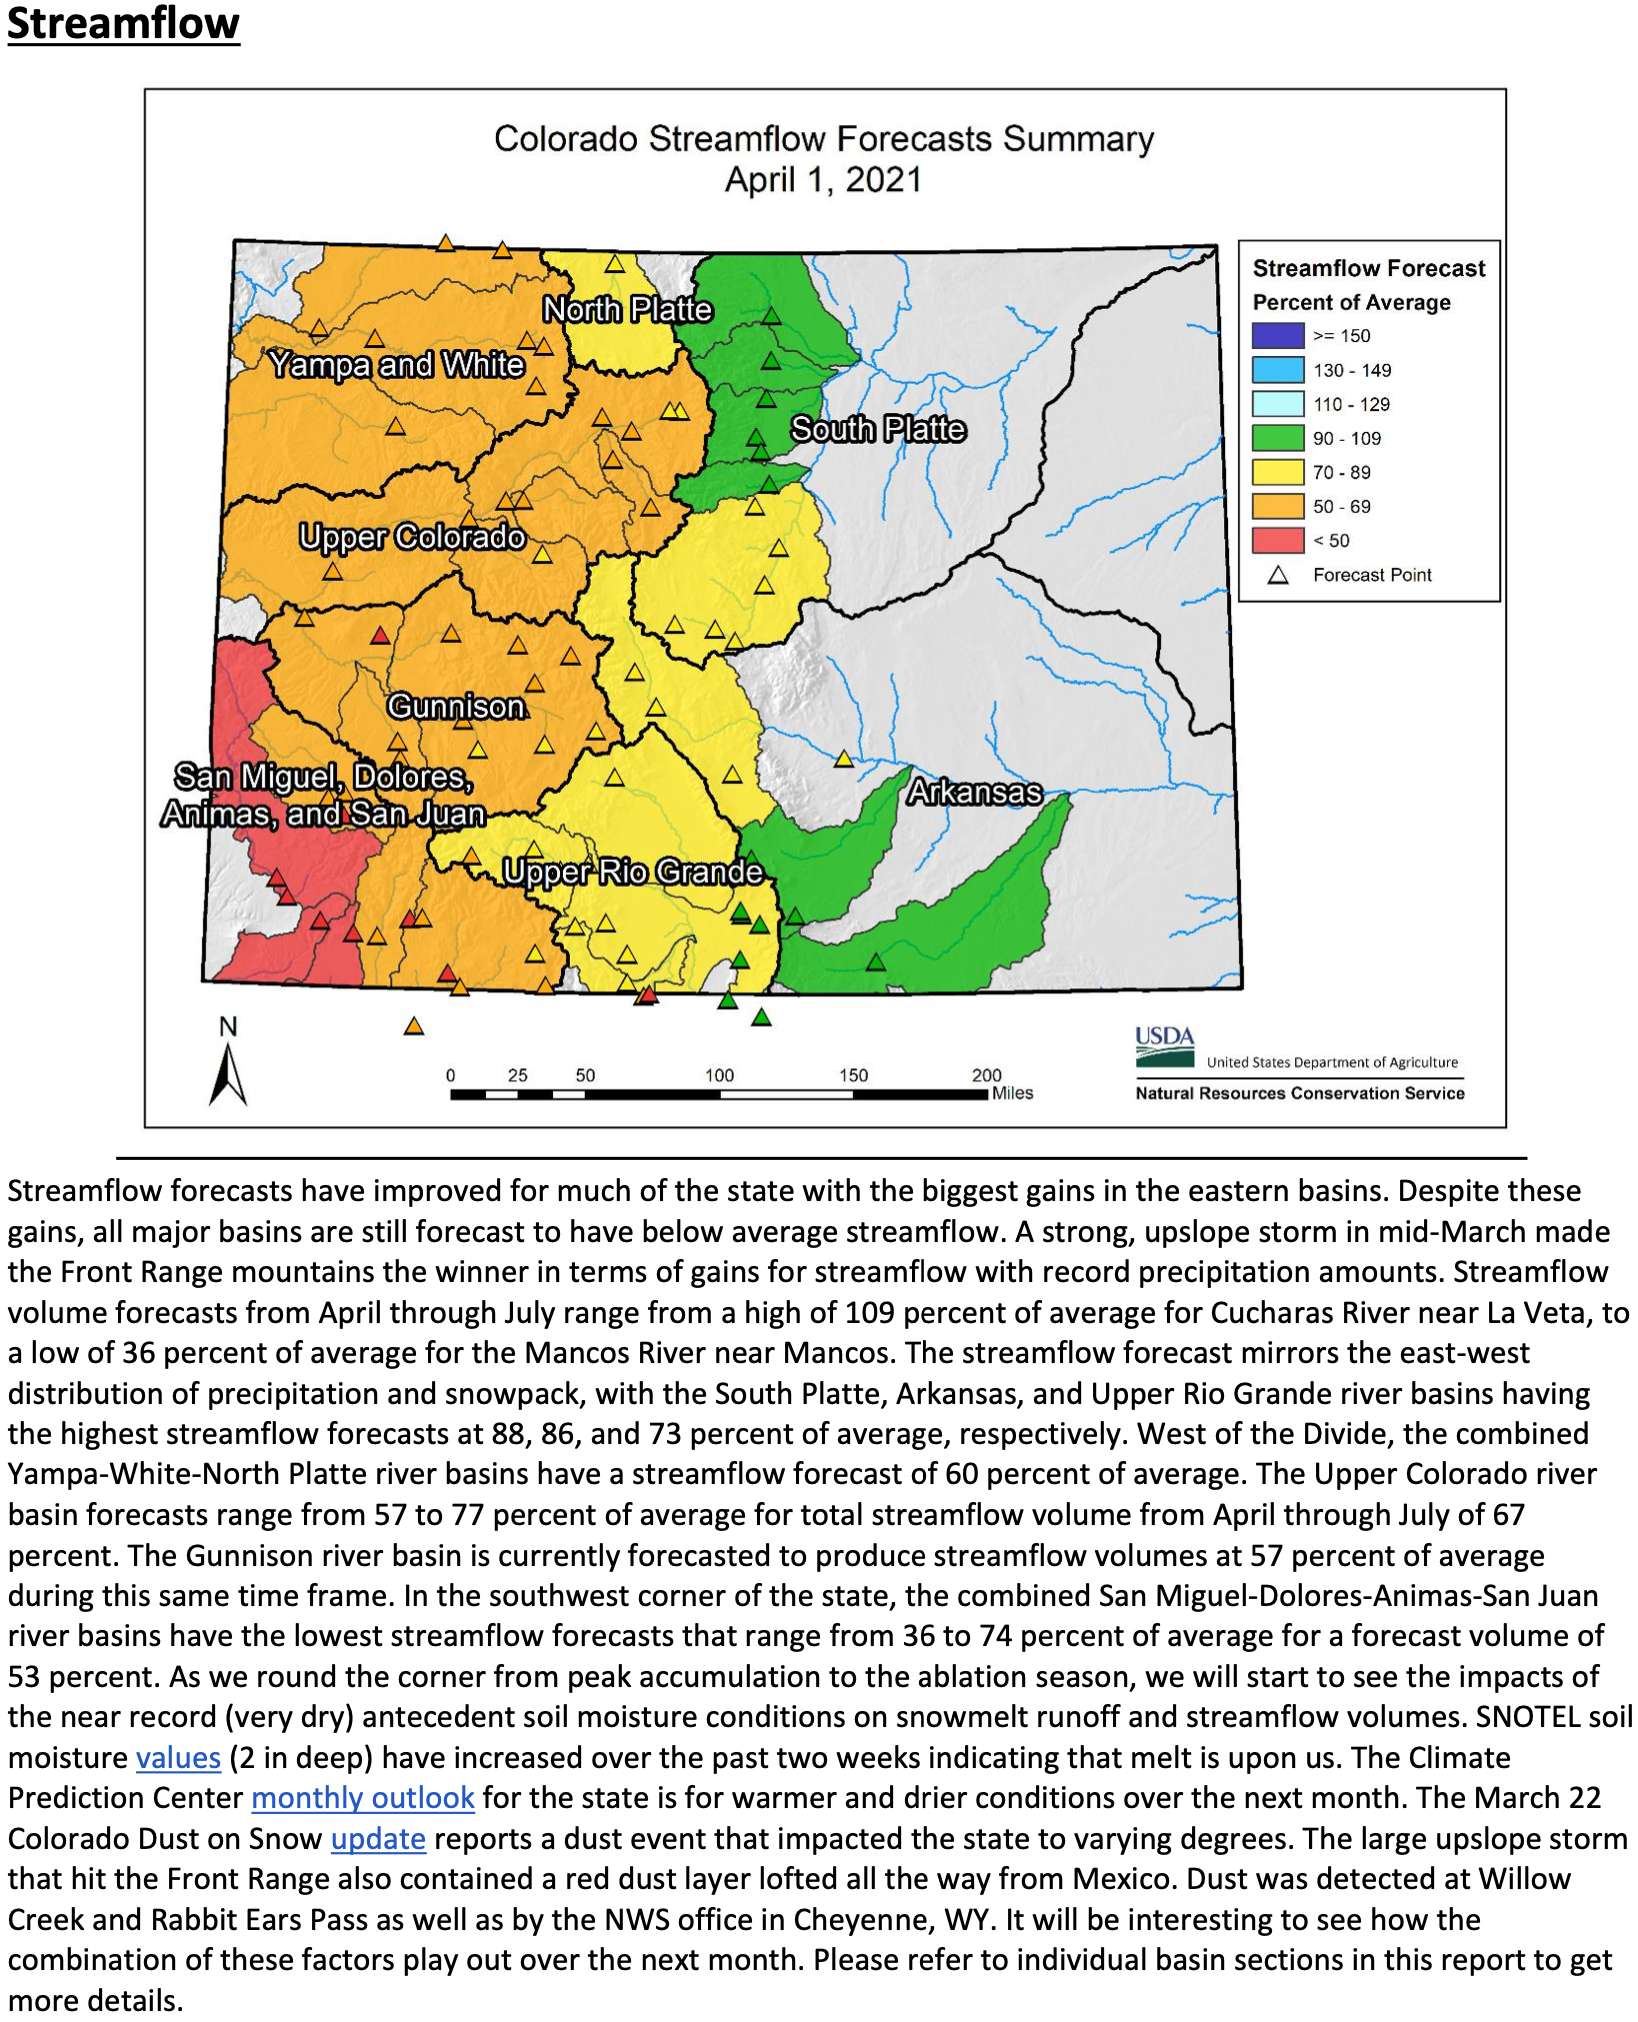
The lowest streamflow forecasts in the state are rivers draining the Southern San Juan Mountains and the Gunnison River Basin. The average streamflow volume forecasts in these basins range from 36 to 77 percent of average. With recent storms, the Arkansas River Basin now has the best water supply outlook in the state, where streamflow volume forecasts range from 83 to 109 percent of average.
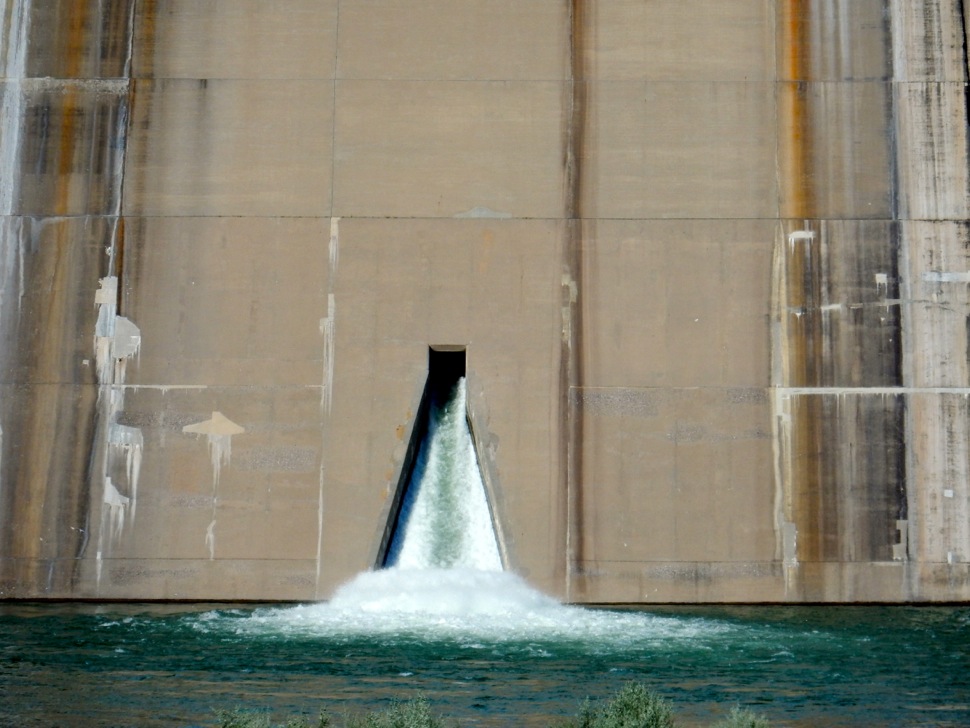
The outflow at the bottom of Navajo Dam in New Mexico. Photo: Brent Gardner-Smith/Aspen Journalism
From email from Reclamation (Susan Novak Behery):
In response to decreasing flows in the critical habitat reach, the Bureau of Reclamation has scheduled an increase in the release from Navajo Dam from 400 cubic feet per second (cfs) to 500 cfs on Friday, April 9th, starting at 4:00 AM. Releases are made for the authorized purposes of the Navajo Unit, and to attempt to maintain a target base flow through the endangered fish critical habitat reach of the San Juan River (Farmington to Lake Powell).
The San Juan River Basin Recovery Implementation Program recommends a target base flow of between 500 cfs and 1,000 cfs through the critical habitat area. The target base flow is calculated as the weekly average of gaged flows throughout the critical habitat area from Farmington to Lake Powell.