In squeezing natural gas from the built environment, Colorado is unlikely to adopt hard mandates, as have been enacted by local governments in California and a few other states. But can Colorado figure out a gentler approach that achieves the same results?
Members of the Colorado Public Utilities Commission didn’t get any simple instructions along the lines of “just-add-water” during a meeting on May 20 with experts from the Environmental Defense Fund and the Regulatory Assistance Project, two national organizations engaged in the transition from natural gas.
”I am sorry I am not giving you a simple answer,” they were told at one point by Meghan Anderson of the Washington state-based Regulatory Assistance Project. “There are lot of things coming together.”
That was in response to a question from Commissioner John Gavan. He had alluded to SB21-200, the bill submitted by Sen. Faith Winter and others that would give the state’s Air Quality Control Commission more authority to achieve greenhouse gas reductions through new regulations.
Environmental groups have insisted that Colorado needs to move more rapidly in wringing out greenhouse gas emissions from the state’s economy. A 2019 law specified targets of 50% by 2030 and 90% by mid-century.
Gov. Jared Polis has vowed to veto the bill if it lands on his desk. Despite running on a platform of 100% renewables, Polis argues for an approach that is not seen as heavy handed regulation. He’s not against prodding the market, as was evident in a legislative hearing on the same day as the PUC meeting. Will Toor, the director of the state energy office, testified in support of a bill that would steer state funding toward building materials with lower carbon emissions embedded in their production or extraction.
“We have this raging battle going on in Colorado on that issue, do we do it through mandates or market forces?” Gavan said at the PUC session. “What do you see from around the country and the world?”
Colorado most certainly needs both mandates and market forces, Christie Hicks, the lead counsel for energy markets and utility regulation with the Environmental Defense Fund, said in response to the question by Gavan. She emphasized the importance of transparency and accountability in a stakeholder processes with utilities and others.
In Washington state, demand for natural gas has actually dropped, the result of improved energy efficiency, more stringent building codes, and deliberate efforts to displace fossil fuels in buildings with electricity.
This house in Candelas, a development in Arvada, is among the 40,000 a year being constructed in Colorado, very nearly all of them connected to natural gas lines. Photo/Allen Best
Colorado’s largest gas-distribution utility, Xcel Energy, said in a PUC filing that it expects a 1% annual growth in demand for natural gas for building use. Xcel, in a November position paper titled “Transitioning Natural Gas for a Low-Carbon Future,” also argued against too aggressively transitioning from natural gas to electricity, even though it will sell more electricity.
For Colorado to meet its decarbonization targets, it must shut down coal plants and aggressively electrify transportation. More difficult yet will be the weaning of buildings from their dependence on natural gas—and, in some places, propane—for space heating, warming of water and appliances such as kitchen stoves.
The PUC commissioners were told that natural gas combustion in buildings causes 10% of total U.S. greenhouse gas emissions.
Eric Blank, the PUC chairman, asked the same question in a different way. Even before joining the PUC, he has been talking about the 40,000 to 50,000 housing units being built each year in Colorado along with perhaps 5,000 to 10,000 commercial units, virtually all with natural gas hookups.
Even beyond what the PUC can do, he asked, do you have any advice about what Colorado can do as we begin shifting toward all-electric, particularly with deployment of incentives?
Colorado very definitely is not California, he said, a reference to the natural gas bans in new construction by local governments in California, led by Berkeley beginning in 2019.
“It’s just not how Colorado operates,” said Blank.
Education will be foundational, answered Natalie Karas, also of the Environmental Defense Fund. She pointed to a website-based planning device created by a utility in New York that can instantly spit out the emissions associated with fuel decisions.
And can the natural gas lines be repurposed, say to hydrogen? “We have a 50- or 60-year gas system, and to keep that system safe requires hundreds of millions of dollars of ongoing investment in coming months and years,” Blank pointed out. “Is there any clean energy value in those assets going forward in terms of using it for hydrogen or other clean energy molecules?”
Blank got an indirect answer. “It’s all about meeting end uses,” said Megan Anderson of the Regulatory Assistance Project. The question, she said, is whether it’s good idea to make upgrades or are there better ways to meet customer needs.
This is from Big Pivots, an e-journal that tracks the energy and water transitions in Colorado and beyond. To subscribe, go to http://BigPivots.com.
PUC Commissioner Megan Gilman, who assembled the session, asked a central question about motivations and accountability. Current models used in Colorado and elsewhere reward investor-owned utilities with returns based on investments they make in energy generation and distribution. That gives utilities incentives to make investments that don’t necessarily align with climate goals. “That’s a fundamental problem,” she said.
Hicks said the best example of using regulation to achieve broad societal goals can be found in the electric sector, where states have been nudging utilities firmly to abandon coal-fired generation in favor of those that cause less pollution.
One technique is called performance-based ratemaking. Rates the privately-owned utilities are allowed to charge customers depend upon utilities achieving social goals. In this case, the allowed utility revenues would be tied to reductions of greenhouse gas emissions.
Hicks also urged a wholistic view of energy systems, seeing natural gas along with electric—which, in a way, is exactly what the Xcel position document issued in November urged.
The EDF’s Karas talked about the need for “rigorous analysis” of “every new piece of gas infrastructure being put into the ground. The experts all talked about the importance of planning.
The future of energy illustrated by Basalt Vista October 19, 2019
Also explored during the session was the question that Blank described as the “economic rock.” In short, how does this transition from natural gas in buildings occur across all economic sectors, not just among the well-heeled or, for that matter, not just in new homes and buildings?
The Xcel paper in November also drew attention to this problem. The scenario is what if only those of most modest means, unable to retrofit their homes, are left holding the bag of the stranded asset and hence required to pay much higher cost.
If there are no easy answers, the best equity will be borne of both well-crafted.
Mount Werner Water and Sanitation District is currently seeking funding for $6.5 million in improvement projects set for completion in 2022 and 2023 at the Fish Creek Water Treatment Plant that processes drinking water for Steamboat Springs.
The district received the final Water Treatment Facility Master Plan report in April from Carollo Engineering, which outlines 20 years of recommended work in four implementation phases at a substantial cost of $53 million, said Frank Alfone, general manager at Mount Werner Water.
The first phase of improvements addresses operational needs and updated regulatory requirements issued within the past five years from the U.S. Environmental Protection Agency and Colorado Department of Public Health and Environment related to copper and lead rules, as well as measurement of residual chlorine in the water, Alfone said…
The district is working with the financing arm of Carollo to investigate funding options, such as loans, grants and possible customer rate hikes. The district board will decide this fall if the necessary work will lead to future rate increases for customers of the district, which serves the city south of Fish Creek. Alfone said the district rates will not increase in 2021, also noting that current rates are, on average, lower than the statewide average.
Following the required regulatory improvements, the next phase in the master plan would be $6.5 million for work in 2028 to boost efficiencies in water filtering and processing capabilities for sediment and taste and odor issues from increased debris flow in the case of wildfire in the Fish Creek Watershed, Alfone said.
Fire experts say the Fish Creek Watershed represents one of the highest wildfire risks in Routt County due to the topography and fuel types…
The topography upstream from the water treatment plant includes the forested Fish Creek drainage that is a steep canyon several hundred feet deep. The canyon normally stays very wet, but during dry years, a fire in the canyon could be very destructive. The box canyon could function as a powerful funnel for flames during wildfires, said Drew Langel, a local forester with the Colorado State Forest Service.
Alfalfa growers ideally need 30 inches of irrigation water per acre, per season, for their crops. This season, some farmers in the county are only getting a fraction of an inch from their reservoirs. As a result, farmers have to adjust, by selling cattle, limiting acreage or shutting down completely. And some of the sacrifices they’re forced to make can be really hard on their mental health, Nolan said.
“Sometimes you look in the mirror and you’re like, ‘Should I be doing this?’” [Mike] Nolan said. “‘Like, does this make any sense?’ That stuff just builds. And it’s in seasons like this, it can crack. And that’s the scary part.”
Nolan is not the only one noticing the mental health effects that drought is having on farmers.
According to data compiled by Celebrating Healthy Communities, a Colorado-based suicide-prevention group, farmers and ag workers are the second-highest at-risk population in Montezuma County, where Nolan farms. That means they’re more likely to die by suicide than almost any other occupational group.
And the data show another concerning correlation.
Researchers also compared the state of Colorado’s drought data for the past decade with the state’s suicide data for the same period. When drought conditions worsened, so did the suicide rate among farmers.
JC Carrica, the CEO of Southeast Health based in La Junta, Colorado isn’t surprised by those findings. He specializes in behavioral health care in rural communities.
“There’s seasonality,” Carrica said. “There’s peaks of anxiety, peaks of depression. It’s ever flowing, because it’s weather-related or market volatility.”
He also says that drought can be especially devastating.
“When you see the wind come through and shear off whatever little bit of grass you had from a quarter inch of rain a couple of days prior,” he said. “It’s kind of the carrot and the stick, and sometimes there’s just not enough carrot to keep people’s hopes high.”
Many mental health issues in the agricultural community can be compounded by a lack of services. The answer, Carrica said, is to make more of an effort to get mental health care to farmers, on their level.
Kate Greenberg is the Commissioner of Agriculture for the state of Colorado.
“As we see financial stress increase, as we’ve seen, in the last decade or so,” Greenberg said. “We also see spikes in suicide rates among agricultural communities.”
Greenberg says her department is working with local partners across the state to get more resources to rural areas. What works in a city might not translate to agricultural communities. So, she says, resources like online training manuals or public service announcements should be written with that in mind. Colorado also maintains a crisis hotline — a free and confidential mental health resource that’s available 24/7.
But as climate change continues to heat up and dry out the West’s farmland, Greenberg said the stress that comes with water scarcity will remain a challenge in keeping agriculture viable, and those who do it mentally well.
Back in the Mancos Valley, Mike Nolan said this year’s lack of water is changing his operation in a fundamental way.
“The big one was laying off everybody, which was a real bummer,” he said. “Never had to do that. It was really hard to do.”
But Nolan says off-and-on therapy has really helped.
Last year one of my students in a history of science class commented that “no one knows which doctors to trust because they are politicizing the pandemic, just like politicians are.” The interactions between science and politics are now so complex, so numerous and often so opaque that, as my student noted, it’s not clear anymore whom to trust.
People often assume that the objectivity of science requires it to be isolated from governmental politics. However, scientists have always gotten involved in politics as advisers and through shaping public opinion. And science itself – how scientists are funded and how they choose their research priorities – is a political affair.
In this context, it is understandable that many people began to doubt whether they should trust science at all. As a historian of science, I know that the question is not whether science and politics ought to be involved – they are already. Rather, it is important for people to understand how this relationship can produce either good or bad outcomes for scientific progress and society.
The historical relationship of science and politics
Sputnik, the first human-made object in space and a model of which is seen here, was launched by the Soviet Union and marked the beginning of the space race between the U.S. and the Soviet Union. NSSDC/NASA/WikimediaCommons
Geopolitical objectives drive a large part of scientific research. For example, the Apollo space program from 1961 to 1972 was driven more by the competition between superpowers in the Cold War than by science. In this case, government’s funding contributed to scientific progress.
In contrast, in the early days of the Soviet Union, the government’s involvement in biology had a stifling effect on science. Trofim Lysenko was a biologist under Stalin who denounced modern genetics. As he became head of top scientific institutions, his opponents were arrested or executed. Lysenkoism – despite being dead wrong – became the accepted orthodoxy in the academies and universities of communist Europe until the mid-1960s.
As the Lysenko story demonstrates, when political powers decide the questions that scientists should work on – and, more importantly, what kind of answers science should find – it can harm both scientific progress and society.
Two political parties, two scientific realities
The relationship between science and politics has always been dynamic, but the rise of social media has changed it in an important way. Because it’s more difficult to discern between true and false content online, it’s now easier than ever before to spread politically motivated fake news.
In the U.S., social media has massively accelerated a long–growing political divide in scientific trust. Starting with Ronald Reagan, Republican leaders have turned science into a partisan field. The ideology of limited government is one of the main reasons for this attitude. Republican lawmakers often ignore environmental issues despite scientific consensus on the causes and dangerous effects these issues lead to.
President Trump brought the suspicion of science to another level by treating science as essentially just another political opinion. He argued that scientists and institutions who contradicted his views were motivated by their political agendas – and, by extension, that the science itself was false. By contrast, President Biden has put science at the top of his priorities.
As a result, the divide between scientific and anti-scientific positions – at least in the U.S. – is now often partisan. People of different political views, even when they are educated, are sometimes not able to agree on facts. For instance, among U.S. citizens with a high level of scientific knowledge, 89% of Democrats say that human activity contributes a great deal to climate change, as compared with only 17% of Republicans. Democrats are not immune to this either, as seen by the strong Democratic support for labeling genetically modified foods. This is despite scientific consensus on the safety of these foods. But overall, Republicans tend to be much more anti-science than Democrats.
The pandemic has shown the risks of this political divide. People who identify as Republican are much more likely to be resistant to mask-wearing and vaccination.
Disagreements in science are necessary for scientific progress. But if each party has its own definition of science, scientific truths become a matter of opinion rather than objective facts of how the world works.
Where is the relationship going?
Because trust in science was so degraded during Trump’s presidency, several leading peer-reviewed journals endorsed Biden as a presidential candidate. This was perhaps the first time in history that such a large number of scientific journals and magazines took clear stances for a U.S. presidential election.
The fact that the acceptance or rejection of science is increasingly determined by political affiliations threatens the autonomy of scientists. Once a theory is labeled “conservative” or “liberal” it becomes difficult for scientists to challenge it. Thus, some scientists are less prone to question hypotheses for fear of political and socialpressures.
In my opinion, science cannot thrive under an administration that ignores scientific expertise as a whole; but neither can it thrive if scientists are told which political and moral values they must embrace. This could slow down or even prevent the emergence of new scientific hypotheses. Indeed, when scientists align themselves with or against political power, science can easily lose its most important asset: the ability to encourage disagreement and to raise new hypotheses that may go against common sense.
As the Colorado River Basin enters yet another year of drought, global companies are worsening the water crisis.
DRIVING INTO SOUTHERN California’s Palo Verde Valley from the Arizona border, fields of vibrant green appear out of the desert like a mirage. Near the town of Blythe, water from the Colorado River turns the dry earth into verdant farmland, much of it to grow a single crop — alfalfa, a type of plant used mainly to feed dairy cows.
For decades, a significant portion of alfalfa grown here and elsewhere in the western United States — as much as 17 percent in 2017 — has been loaded onto trucks, driven hundreds of miles to ports on the west coast, and shipped around the world, mainly to China, Japan, and Saudi Arabia. A little over five years ago, one company decided it made more sense to own the land, and the water that came with it, outright.
The company, a Saudi Arabian dairy firm called Almarai, purchased 1,790 acres in the Palo Verde Valley to secure a supply of alfalfa for its dairy cows. Soon after, Saudi Arabia began phasing out domestic alfalfa production to preserve its water supplies, which were dwindling after years of overuse for agriculture. The purchase made headlines as critics including local politicians and environmentalists questioned whether it was fair for a foreign entity to use up valuable groundwater resources for products that wouldn’t ultimately benefit Americans.
The farms of the Palo Verde Valley draw water from the Colorado River. Visual: Dicklyon / Wikimedia Commons
But the company is far from alone. Foreign corporations are increasingly purchasing land in the U.S.; in the Southwest, thanks to longstanding laws on water rights, these purchases often come with unlimited access to the valuable water underneath the soil. Combined with nearly year-round sunshine, this has made the area a magnet for companies looking to grow water-intensive crops and raise livestock. Over the last 20 years, foreign companies have purchased more than 250,000 acres of land in six Southwestern states to raise cattle and pigs, as well as to grow everything from almonds to alfalfa, according to an analysis of purchase data that Undark obtained from the U.S. Department of Agriculture.
On its face, foreign ownership of farmland hasn’t proved significantly different from American ownership for large-scale production of crops like alfalfa. Domestic farmers have long shipped food overseas, and companies like Almarai, as well as independent researchers, have suggested the outsized focus on foreign companies may be xenophobic. American farmers and companies also control millions of acres overseas, mainly in Africa, Asia, and South America. But with their implications for food and water security — that ultimately, the U.S. is not in control of its own farmland — the purchases are drawing attention to the larger trend of industrial agriculture in the U.S. and the problems that come with it.
Corporate farms, researchers and policymakers warn, drain aquifers and threaten access to water for drinking and future crop production. The export of crops and the water used to grow them, known as virtual water, has been accelerating for decades, despite concerns that in drought-stricken areas such as the Southwest, this system is unsustainable in the long term. Although virtual water itself is not inherently problematic — and can even reduce water usage in some cases — its extraction from water-stressed communities is sounding the alarm as water crises become more urgent. Even as the Colorado River Basin enters its 21st year of sustained drought and climate change threatens to further exacerbate water scarcity, virtual water trading is expected to triple globally by 2100, with a large share moving from the U.S. to other countries.
“It’s basically exporting water in the form of alfalfa to countries that are water scarce,” said Alida Cantor, an assistant professor at Portland State University in Oregon who researches water management and sustainability. “But it’s exporting it from a region that is also water scarce.”
Norwood – four horse stage used on Placerville-Norwood route, east of Norwood, Colorado. Credit: Denver Public Library Special Collections, creator Beam, George L. (George Lytle), 1868-1935. Date: 1910?
Norwood Public Works Director Lippert has said the water situation is questionable this year, as many people already know. On Monday, he told The Norwood Post that it didn’t look good.
“We are in extreme drought, and it’s serious,” he said. “It could change in a heartbeat, but today it’s pretty serious. It’s going to affect a lot of people in a lot of ways, from ag to those who want to move here.”
At the town board meeting two weeks ago, Lippert gave an update on the raw water status. Last Monday, the raw water system was turned on, and tap holders who have rights to water lawns and gardens are now able to do so. Raw water is projected to run for 30 days at this point, though Lippert said that may change depending on the weather.
Monsoons, which typically bring summer rains to the Wright’s Mesa area, could help the situation, though the last few years the monsoon season has not produced much precipitation, which is disappointing for raw water customers (and of course those who work as farmers and ranchers.)…
And, Norwood’s first water education day is June 5 from 10 a.m. to 2 p.m. Organized by town trustee Candy Meehan, the event aims to educate the locals about the water situation currently, but also teach the history too.
Many water organizations will come together, including Farmers Water, the Norwood Water Commission, the Lone Cone Ditch Company and others.
Meehan hopes the water day is informative for the public, but also helps with being proactive, rather than reactive, regarding the water issue in Norwood.
While western Colorado continues to suffer under extreme and exceptional drought, the eastern plains have been rapidly improving to nearly drought-free conditions according to the latest report from the National Drought Mitigation Center.
Thanks to recent spring storms, two pockets of moderate drought impacting portions of El Paso, Elbert, Lincoln, Kit Carson, Kiowa, Bent and Prowers counties have now retreated to abnormally dry conditions.
Along the southern border with New Mexico, moderate drought retreated from Huerfano and Costilla counties. Nearby, severe drought moved to moderate conditions for southern Las Animas and southwest Baca counties.
Colorado Drought Monitor map May 25, 2021.
Drought-free conditions grew further into the San Luis Valley as well as the southeast plains.
Western Colorado has remained largely unchanged for weeks and is mostly covered with extreme and exceptional drought.
Over the past week, storms have produced as much as three inches of rain – with isolated areas receiving more – on the eastern plains. Hail and tornadoes have accompanied may of the thunderstorms.
Improvements in eastern Colorado began in mid-March as significant snow set the initial stage for relief to the area. During May, thunderstorms have continued to bring rain to the state’s eastern plains, resulting in drought-free conditions for most northeast counties by last week. A remaining strip of abnormally dry conditions in northern Sedgwick County became drought-free with recent rains.
The first drought-free area in Colorado since mid-2020 appeared in late April.
Colorado Drought Monitor one week change map ending May 25, 2021.
Recent rounds of precipitation have improved pasture conditions to northeast counties, as well as better wheat condition in the east central area. Reports from the USDA also showed better pasture conditions in the southeast portion of Colorado.
Overall, 34 percent of the state is drought-free, up from 23 percent last week, with an additional 20 percent in abnormally dry conditions, down from 25 percent in the previous week. Moderate drought covered 11 percent of Colorado, down from 13 percent, while severe drought dropped from 10 to six percent. Extreme and exceptional drought were unchanged at 13 and 16 percent, respectively.
The controversial Gila River diversion project has entered a “closeout” phase.
With no discussion, the New Mexico Interstate Stream Commission on Wednesday approved several line item transfers within the New Mexico Entity of the Central Arizona Project’s 2021 budget, as well as a closing budget for the 2022 fiscal year to pay for a final annual financial audit of the group.
The N.M. CAP Entity’s executive director, Anthony Gutierrez, addressed the ISC before it voted unanimously to approve the two items.
“I know this has been a long process,” he said. “Our members and myself were disappointed with not being able to develop AWSA water, but we certainly respect the decisions that the commission has made in the past few months.”
Gutierrez acknowledged that one of those decisions “was to discontinue the budget for the New Mexico CAP Entity,” which paid for, among other things, his salary. It also covered Entity attorney Pete Domenici’s fees, for which $139,500 was originally budgeted this fiscal year.
Blue Mesa [Reservoir] is at about 345,000 acre feet and sits at 42% full, based on May data, which predict the reservoir will only hit just above 50-percent full — “not very good,” as Bureau of Reclamation hydrologist Erik Knight put it.
“We’re lower than we were at any time in 2020. In 2018, we were below 250,000 acre feet by the end. We’re not projecting to go that low yet, but we’re heading in that direction, that’s for sure,” Knight said Friday.
“The reservoir is pretty low. Runoff hasn’t really kicked into gear, although I think that is starting now,” he added.
Although the Uncompahgre River is a bit bouncier and swelling with some snowmelt, Montrose County and the western side of the state remain locked in drought.
Colorado Drought Monitor map May 25, 2021.
Conditions in the county range from extreme drought to exceptional — the two worst levels — according to US Drought Monitor data.
So far, the Uncompahgre Valley Water Users Association, which serves about 3,500 shareholders, has been able to fill its contracts at 70%. The association’s storage “account” at Taylor Park Reservoir — which with Blue Mesa and other reservoirs is part of the BuRec-managed Aspinall Unit — is full, UVWUA manager Steve Anderson said. (Taylor itself is not expected to fill at 100%, but UVWUA anticipates it will receive the full amount to which it is entitled from the reservoir.)
Taylor Park Reservoir
“I expect our account at Taylor to refill,” Anderson added. “We are storing second-fill water in Taylor right now and my expectation is for us to wind up the season with a full reservoir at Taylor. That means a lot to us, but that’s 100,000 acre feet and we need 600,000 acre feet to run the project. But that’s a good start.”
Ridgway Dam via the USBR
The storage account at Ridgway Reservoir is close to full, Anderson also said — of 21,000 acre feet of association water, a bit more than 300 acre feet have been used…
The water picture for the Grand Mesa and North Fork is worse than it is for Montrose, he said, and also pointed to the south, to the Dolores River.
Mcphee Reservoir
McPhee Reservoir, which the river feeds, is well below average and, the Cortez Journal reported Wednesday, irrigators with contracts for its water have been told to expect between 5 and 10% of their ordinary fulfillments.
“The Dolores is just horrible,” Anderson said. Only one-sixth of the water would ordinarily be delivered from McPhee is coming to users, he said. “That’s pretty sad. We’re fortunate in that respect, that we’re not in those kind of dire straits.”
[…]
Lake Powell is seen in a November 2019 aerial photo from the nonprofit EcoFlight. Keeping enough water in the reservoir to support downstream users in Arizona, Nevada and California is complicated by climate change, as well as projections that the upper basin states of Colorado, Utah, Wyoming and New Mexico will use as much as 40% more water than current demand. A recent white paper from a lineup of river experts calls those use projections into question. CREDIT: ECOFLIGHT via Aspen Journalism
[Lake] Powell’s levels are within a whisker or two of being too low to sustain hydropower generation. If Powell drops below 3,490 feet elevation, that’s the danger zone, Anderson said in January. As of May 14, Powell was projected to end the water year at 3,543 feet, according to the Bureau of Reclamation, although the agency also noted “significant uncertainty” at the time…
Flaming Gorge Reservoir July 2020. Photo credit: Utah DWR
Flaming Gorge has enough storage right now that it can bail out Powell in an absolute emergency, as it could release 2 million acre feet, Anderson said…
Back at home, the Aspinall Unit also has drought contingency plans that kick in as needed to maintain baseflows and satisfy the requirements of legal records of decision.
In dry years, flow targets are dropped and that helps keep Blue Mesa and the other reservoirs in the unit from running dry, Knight said.
Crews have started installing a 42-inch welded steel pipeline through portions of northern Colorado with the goal of bringing clean water to Thornton through 2065.
However, even though Thornton legally purchased the water rights from the Cache la Poudre River northwest of Fort Collins in the 1980s, the counties it needs to pump water through are preventing the pipeline from becoming a full reality, for now.
“We got the water in 1985. That is all done. We have the permission to move the water, we just need the facilities to move it,” said Mark Koleber, Water Supply Director for Thornton…
Thornton needs to install more than 80 miles worth of pipes from the river near Ted’s Place all the way to the Denver suburb. However, in Larimer County, they have come across issues getting permits to install the pipeline along roadways…
While Thornton navigates the next steps of building their pipeline through unincorporated Weld and Larimer counties, they have been given permission to start construction through towns like Timnath, Windsor and Johnstown.
Timnath and Windsor have seen a dramatic spike in residents in the past few years, and many homes are being built along WCR-13 in Windsor, right where Thornton planned to build their pipeline…
To avoid the stresses of more disruption, Thornton was granted permission to install their pipeline along the roadway before the neighborhoods were completed.
“We can do that so we can get ahead of the development,” Koleber said. “That is really important for us, to make sure we don’t impact the communities any more than we have to.”
[…]
More than seven miles worth of pipeline have been installed through Windsor and Johnstown. Some of that stretch has already been installed, reclaimed and built over.
The Raindance Community in Windsor has already built homes along the now-hidden pipeline, with sidewalks and landscaping covering where the construction was completed.
Following the state’s orders, Thornton had to develop a plan to cross over two rivers in Northern Colorado without disturbing them.
Koleber’s team dug massive holes on each end of the Poudre and Big Thompson rivers. Then machinery was lowered into the holes. The machinery then dug itself under the rivers, sending back carts full of mud as it continued to burrow. The pipes were then lowered into the holes and slid through the makeshift tunnels, leaving the Poudre and Big Thompson unscathed.
“That will allow us to move the water under the Poudre without disturbing the Poudre at all. We can cross it without touching the Poudre,” Koleber said.
Thornton has engaged in legal action against Larimer County, hoping the courts can help them claim what they legally purchased decades ago. The city has not ruled out taking similar action in Weld County if common ground cannot be reached in a timely manner.
CBS4 contacted Larimer County commissioners for comment on this article. However, multiple commissioners wrote back saying they could not comment on the story due to ongoing litigation.
A) Cross-validated reconstruction skill (R2) using tree-ring records that extend to 800 and 1700 CE (green contour: R2 ≥ 0.5; gray: reconstruction does not extend to 800 CE; yellow box: SWNA). (B) Time-resolved cross-validated R2 of the SWNA regional reconstruction. The inset shows observations versus cross-validated reconstructions during the 1901–1983 calibration interval using tree-ring records extending back to 800 and 1700 CE. (C) Time series of reconstructed (red) and observed (blue) 19-year running-mean standardized SWNA soil moisture (gray: 95% reconstruction confidence interval; blue horizontal line: 2000–2018 mean; pink and green shading: the five drought and pluvial periods with the most-negative and most-positive 19-year soil-moisture anomalies, respectively). (D) Maps of the local rank of the most negative 19-year anomaly to occur during each of the five drought events highlighted in (C). In the maps, the aqua color indicates no negative 19-year anomaly, and numbers in the top left corners indicate the rank of the most negative regionally averaged 19-year anomaly during each drought event.
Click here to access the paper (A. Park Williams, Edward R. Cook, Jason E. Smerdon, Benjamin I. Cook, John T. Abatzoglou, Kasey Bolles, Seung H. Baek, Andrew M. Badger, Ben Livneh):
Here’s the abstract:
Severe and persistent 21st-century drought in southwestern North America (SWNA) motivates comparisons to medieval megadroughts and questions about the role of anthropogenic climate change. We use hydrological modeling and new 1200-year tree-ring reconstructions of summer soil moisture to demonstrate that the 2000–2018 SWNA drought was the second driest 19-year period since 800 CE, exceeded only by a late-1500s megadrought. The megadrought-like trajectory of 2000–2018 soil moisture was driven by natural variability superimposed on drying due to anthropogenic warming. Anthropogenic trends in temperature, relative humidity, and precipitation estimated from 31 climate models account for 46% (model interquartiles of 34 to 103%) of the 2000–2018 drought severity, pushing an otherwise moderate drought onto a trajectory comparable to the worst SWNA megadroughts since 800 CE.
The slag pile left over from a 1900s smelting operation on a wetlands property subject to a unique conservation play that is working its way through various agencies. An analysis by the Colorado Department of Public Health and Environment found that the material does not post a significant health risk if it is fenced off. CREDIT: CURTIS WACKERLE/ASPEN JOURNALISM
You wouldn’t want to put it in your granola, in the words of Crystal Valley Environmental Protection Association President John Armstrong, but a heap of waste material left over from a 1900s smelting operation near the banks of the Crystal River in Marble does not appear to pose enough of an environmental hazard to prevent the donation of 55 acres of otherwise stunning, mostly wetlands terrain to a land conservation organization.
But the road to reach this point has been long for the private owner of the now three contiguous parcels across the river that the owner has been trying since 2016 to see donated and permanently preserved in its natural state. In that time, concerns about potential liabilities associated with the slag pile have held up the initiative.
But support from CVEPA, which agreed to put $1,000 toward an analysis of the material, plus a discussion with the Pitkin County Health Rivers and Streams board about a grant, gave momentum to the effort last year. This spring, the Colorado Department of Public Health and Environment (CDPHE) completed its analysis of the site and determined that contaminant levels in the material are within the range considered to be non-threatening to human health for a day-use recreation site.
In the end, the analysis work was completed pro bono, and proponents hope that funds pledged can be used for materials to fence off the slag heap and put up some interpretive signage explaining the history of the smelter and the slag left behind. This would complement an eventual management framework in which a land-conservation agency holds title to the property and allows passive, non-motorized public access along an existing route following the river.
Blocks of marble, likely connected to a historic railroad line running to a quarry, were artistically stacked by a previous owner along what one Marble resident referred to as “The Trail With No Name.” CREDIT: CURTIS WACKERLE/ASPEN JOURNALISM
That would adhere to long-held use patterns on the land, where private owners have allowed the public to hike, bike or Nordic ski. The biodiverse area straddling the river and the wooded hillside, referred to by Marble history museum curator Alex Menard as the Trail With No Name, has been the site of nature walks hosted by the Roaring Fork Conservancy to observe the beaver dams dotting the wetlands. A portion of it near the slag heap is also marked by giant slabs of marble — probably left over from a railroad that used to run through the site to a marble quarry on Treasure Mountain — that a previous owner artistically stacked just off the trail. The trail itself leads to scenic waterfalls on Yule Creek, although the falls are just over the property line on an adjacent parcel controlled by a separate owner.
“This is really a wildlife refuge,” said Menard, who was instrumental in bringing the project to the attention of the CVEPA. “It’s a place where you can see an eagle taking a trout out of water with its talons, then half a mile farther up, there is a moose; walk a little more, there’s a bear, a blue heron. It’s a wild place.”
As noted by Armstrong, it could also be a desirable spot for a “McMansion,” if not for the benevolence of the private donor — an out-of-state woman who also donated the land in town that is becoming Marble Children’s Park. That land is now owned by Aspen Valley Land Trust, which is working with the town and obtaining additional grant funding to spruce up the site.
AVLT is critical to the conservation effort on the wetlands parcel, as well. AVLT staff is completing survey and title work on the property and will soon be proposing action to the land trust’s board. However, the exact shape of that action is still to be determined, according to AVLT director Suzanne Stephens.
“(We) have talked with our lands committee about potentially accepting fee ownership, but we are also investigating potential partnerships and other options for the property, so it’s not a foregone conclusion that we’ll end up with it,” Stephens wrote in an email. “However, we are committed to seeing it protected one way or another.”
Potential partners include Colorado Parks and Wildlife, CVEPA, Pitkin County and other entities, Stephens said.
A beaver dam along the Crystal River as it runs through a property that a private owner is seeking to donate for conservation purposes. Also visible in this photo is a Canada goose island nesting site with a large beaver lodge. CREDIT: COURTESY PHOTO BY ALEX MENARD
The site is “unquestionably one of the most important wetlands and riparian parcels in the valley,” Stephens said.
“The fact that it adjoins Beaver Lake and almost the entirety of its acreage is wetland and river make it extremely important from a land and water conservation perspective,” she wrote, referring to the body of water located on a CPW-owned parcel to the north. “The habitat is crucial and threatened across the west, and combined with the proximity to the town of Marble and the fact that the smelter site has historic significance and the parcel offers flat, easy access and a lovely walk make it a rare gem that deserves to be conserved for a multitude of reasons.”
The parcels outlined in yellow across the Crystal River from Marble are subject to a unique conservation effort. Beaver Lake is located on state-owned land abutting one of the parcels to the north. CREDIT: SCREENSHOT VIA GUNNISON COUNTY GIS MAPPING WEBSITE
‘Like a glass blob’
In the early days of industrialization and European settlement in the Crystal River Valley, a smelting and ore-crushing operation known as the Hoffman Smelter was erected on the site, according to Menard’s historical accounting. The site processed silver, lead, zinc and copper ore hauled by mule train from mines around Marble from roughly 1898 until 1911.
The smelter is long gone, but its shadow still hangs over the site. According to Armstrong, initial donation efforts in 2016 and 2017 ran aground on concerns about the slag heap, although proponents have long held that such concerns would ultimately be inconsequential.
A close-up view of the rock-like material that crumbles off the slag heap, left over from a 1900s smelting operation near Marble. CREDIT: CURTIS WACKERLE/ASPEN JOURNALISM
The heap in question — perhaps 50 feet long and 10 feet high and located near the edge of the trail — “looks like something volcanic,” Armstrong said.
The mostly solid mound is, however, shedding pieces the size of small rocks. But there is not a strong presence of dust or other material that could wash away in a rainstorm or become airborne in dry conditions. CVEPA’s hope has been that any toxic material is inert, locked up in the rock.
“I have a strong feeling that it shouldn’t be something that should preclude something from acquisition,” Armstrong said in December, when CVEPA was awaiting the results of a materials analysis involving a private lab and CDPHE.
CDPHE — which was reviewing the site following a grant process where projects are submitted that present a public benefit — has substantially completed its analysis, and its findings line up with Armstrong’s characterization.
“Nothing is alarming,” said Mark Rudolph, an environmental protection analyst and brownfield site coordinator with CDPHE. He referred to the slag material as “like a glass blob.”
Rudolph noted that vegetation around the slag pile is healthy and that water quality in the Crystal River, about 50 yards from the material, meets the highest standards. Lead concentrations in the material fall in the range deemed acceptable for recreation sites, he said, and most of it appears locked up in the rocklike formation.
A final report from CDPHE is pending and will include recommendations on how to manage the site for public use. Those recommendations are likely to include clearing from the road any particles that have come off the slag heap. The road was recently built using a historic easement that allows access to a neighboring property owner, who is developing a home. Other strategies could include reseeding areas around the heap and using crushed marble or some other material to cover the slag particles that are visible on the shoulder of the road.
“It’s going to be a great addition to the town if we can get it all the way through,” Menard said of the conservation effort.
Protecting continued public access to these waterfalls along Yule Creek, just over the property line from a parcel set to be donated to a land conservation agency, is an ongoing priority for the CVEPA. CREDIT: COURTESY PHOTO BY JOHN ARMSTRONG
For Armstong and CVEPA, there is further work to be done to ensure public access to the falls, which are about 1.5 miles in from the beginning of the walk through the wetlands. The falls are on the property owned by the man who recently built the road. He could not be reached for comment.
“The owner of the private property seems amenable to allowing access, as he has placed ‘no trespassing’ signs farther up the road beyond the access to the falls,” the CVEPA wrote in a winter 2020 newsletter article about the Marble wetlands donation initiative.
This story ran in the May 29 edition of The Aspen Times.
Pesticides sprayed on agricultural fields and on urban landscaping can run off into nearby streams and rivers. Here, pesticides are being sprayed on a soybean field in Iowa. (Credit: Eric Hawbaker, Blue Collar Ag, Riceville, IA)
Here’s the release from the USGS (Sarah Stackpoole):
A new USGS study of pesticides in U.S. rivers and streams reports that, on average, 17 pesticides were detected at least once at the 74 river and stream sites sampled 12 to 24 times per year during 2013–2017. Herbicides were detected much more frequently than insecticides and fungicides.
The number of pesticides detected at a site over the study mirrored the intensity of pesticide use in the region where the site was located. Pesticide use intensity was greatest in the Midwest (49 kg/km2), where 25 pesticides were detected, on average, at each site. Herbicides were heavily used in agricultural settings and were consistently detected in surface waters at concentrations >100 ng/L (nanograms per liter). In contrast, insecticides had lower agricultural-use intensities and surface-water detection frequencies at concentrations >100 ng/L were rare.
An Environmental Protection Agency (EPA) chronic aquatic-life benchmark—estimates of the concentrations below which pesticides are not expected to represent a risk to aquatic life—was exceeded at least once at more than half of the stream sites in every region—Midwest, South, Northeast, West, and Pacific. Such exceedances indicate the potential for harmful effects to aquatic life such as fish, algae, and invertebrates like aquatic insects. However, an EPA human-health benchmark was exceeded only four times (1.1% of samples).
Of the 221 pesticides measured, just 17 were responsible for the aquatic-life benchmark exceedances. Many of these 17 were herbicides, which frequently occurred at relatively high concentrations that exceeded benchmarks for fish, invertebrates, and plants. Others were insecticides, which occurred at lower concentrations, but which are much more toxic to aquatic invertebrates than herbicides.
Here’s the abstract from the study (Sarah M.Stackpoole, Megan E.Shodab, Laura Medalie, Wesley W.Stone):
Pesticides pose a threat to the environment, but because of the substantial number of compounds, a comprehensive assessment of pesticides and an evaluation of the risk that they pose to human and aquatic life is challenging. In this study, improved analytical methods were used to quantify 221 pesticide concentrations in surface waters over the time period from 2013 to 2017. Samples were collected from 74 river sites in the conterminous US (CONUS). Potential toxicity was assessed by comparing surface water pesticide concentrations to standard concentrations that are considered to have adverse effects on human health or aquatic organisms. The majority of pesticide use is related to agriculture, and agricultural production varies across the CONUS. Therefore, our results were summarized by region (Northeast, South, Midwest, West and Pacific), with the expectation that crop production differences would drive variability in pesticide use, detection frequency, and benchmark exceedance patterns. Although agricultural pesticide use was at least 2.5 times higher in the Midwest (49 kg km−2) than in any of the other four regions (Northeast, South, West, and Pacific, 3 to 21 kg km−2) and the average number of pesticides detected in the Midwest was at least 1.5 higher (n = 25) than the other four regions (n = 8 to n = 16), the potential toxicity results were more evenly distributed. At least 50% of the sites within each of the 5 regions had at least 1 chronic benchmark exceedance. Imidacloprid posed the greatest potential threat to aquatic life with a total of 245 benchmark exceedances at 60 of the 74 sites. These results show that pesticides persist in the environment beyond the site of application and expected period of use. Continued monitoring and research are needed to improve our understanding of pesticide effects on aquatic and human life.
Click here to read the newsletter. Here’s an excerpt:
RUNOFF FORECASTS DECLINE FURTHER
Each new runoff forecast for Lake Powell brings a lower number, with the May 18 Colorado Basin River Forecast Center forecast discussion predicting unregulated April – July inflows of 1.85 million acre-feet (26% of average), down 2% from the May 1 forecast. Blue Mesa Reservoir has the best runoff forecast for major upper basin reservoirs, with a forecast spring runoff of 50% of average.
At full pool, Lake Mead is the largest reservoir in the United States by volume, but two decades of drought have dramatically dropped the water level behind Hoover Dam as can be seen in this photo. (Source: U.S. Bureau of Reclamation)
On Tuesday, the water level in Lake Mead — the largest US reservoir, and fed by the Colorado River — fell below the elevation of 1,075 feet. It has hit that mark only a handful of times since the Hoover Dam was finished in the 1930s, but it always recovered shortly after. It may not this time, at least not any time soon.
The US Bureau of Reclamation (USBR) forecasts the lake’s levels to continue to decline, without any sign of recovery through at least the end of 2022. If the next major study in August from the USBR projects water levels in the lake will be below 1,075 feet on January 1, it would trigger the first-ever shortage declaration on the Colorado River, meaning some communities would begin to see their water deliveries cut significantly next year.
Lake Mead and nearby Lake Powell — the two largest reservoirs on the Colorado River — have drained at an alarming rate. Lake Mead has fallen more than 139 feet since January of 2000.
Lake Mead is currently 16 feet below where it was this time last year and the reservoir is only 37% full, while Lake Powell is down 35 feet from last year and sits at just 34% of the lake’s total capacity.
Glen Canyon Dam on the Colorado River in April 2017. The dam is 15 miles upstream from Lees Ferry, Arizona. The Colorado River, which supplies water to more than 40 million people and irrigates millions of acres of farmland, has seen its supply sapped by drought and climate change. Photo by Alexander Stephens/courtesy Bureau of Reclamation.
In addition to dwindling snowpack, which provides most of the river’s water supply, experts say dry, thirsty soils across the basin are soaking up meltwater, meaning that less makes it into the river system…
Climate change is also taking a toll on the river’s water supply. A study by US Geological Survey scientists published in 2020 found that the Colorado River’s flow has declined by about 20% over the last century, and over half of that decline can be attributed to warming temperatures across the basin.
Who would the shortage affect?
With the level of Lake Mead dipping below 1,075 feet on Tuesday and forecast to drop further, it is nearly certain that the Bureau of Reclamation will declare a Tier 1 shortage later this summer.
If a Tier 1 shortage is declared, Colorado River water deliveries would be reduced for Arizona and Nevada as soon as next year, based on the terms of the 2019 drought contingency plan signed by the lower Colorado River basin states.
The looming water cuts will have the greatest impact in Arizona.
As part of the lower basin’s drought contingency plan, the Central Arizona Project would see its water supply slashed by about one third in 2022 due to its junior rights to the river’s water.
While Arizona’s main population centers will be spared, the effects of those water cuts will be felt most acutely on farms in central Arizona, due to their lower priority status in a complex tier system used to determine who loses water first in the event of a shortage.
California’s water deliveries would not be impacted in a Tier 1 shortage, according to the drought contingency plan.
What happens if Lake Mead sinks further?
In the event of a Tier 2 shortage — which the USBR projects could happen as soon as late 2022 — the cuts would impact some cities and tribes in Arizona that receive water from the Central Arizona Project canal.
“I’m definitely concerned that the raw projections continue to go downward and that we are heading towards potentially a Tier 2 [shortage] in 2023,” said Tom Buschatzke, director of the Arizona Department of Water Resources.
Shortly after the Grizzly Creek Fire ignited in Glenwood Canyon last August, the city shut off one of its integral water intakes at No Name Creek for nearly a week as firefighting efforts commenced. During that time, the city relied upon its Roaring Fork pump station, which supplied water to its nearly 10,000 residents as the fire raged on in the canyon.
“They were slurry bombing the hillside, and we didn’t want them to accidentally hit the creek and for us to pull slurry into the intakes,” Matt Langhorst, Glenwood Springs public works director, said in an interview Thursday.
According to Langhorst, the city requires roughly 1 million gallons of water a day in the winter. During the summer, when the Grizzly Creek Fire blew up, an influx of tourists combined with irrigation efforts increases the city’s water consumption to approximately 4 million gallons a day.
As a result of the Grizzly Creek Fire, the city had to bulk up its water intakes with steel armoring to protect the critical infrastructure in the event of a debris flow.
Thanks to a grant from the Emergency Watershed Protection Program and the Natural Resources Conservation Service (NRCS), the city hired local contractor Gould Construction, which originally built most of the water infrastructure impacted by the Grizzly Creek Fire.
Click here for all the inside skinny and to register:
About this event
Persistent drought and climate change are putting increasing pressure on our limited water supplies, and stakeholders throughout Colorado are exploring solutions to address these challenges in ways that support our economy, our environment, and our way of life. Providing options to temporarily reduce agricultural water use is one potential solution, but significant knowledge gaps exist about how this can work in practice for the high-altitude perennial grasses that make up the majority of the irrigated acreage on Colorado’s Western Slope.
With support from the Colorado Water Conservation Board ,the Colorado Basin Roundtable is leading a multi-year field research project with ag producers in the Kremmling area, researchers from multiple universities, and conservation groups in directly tackling this information gap.
Results from this research project will address three key questions on how ag water conservation can work in practice: How can we accurately and cost-effectively measure water use and water savings at scale? What are the impacts of reduced irrigation on these grass fields and how do they recover under normal irrigation? What does participation in a water conservation project mean for producers’ bottom line and for the ag-based community and economy of the region?
The CBRT and CWCB invite you to join the project partners for a webinar covering results from the first year of the project and the implications for these challenging questions.
Students in Sam Ng’s Field Observation of Severe Weather class hit the road every spring to observe storm structures, like this mesocyclone in Imperial, Nebraska. Photo by Sam Ng via Metropolitan State University of Denver
Click here to access the paper (Russ S. Schumacher, Aaron J. Hill, Mark Klein, James A. Nelson, Michael J. Erickson, Sarah M. Trojniak, and Gregory R. Herman). Here’s the abstract:
Excessive rainfall is difficult to forecast, and there is a need for tools to aid Weather Prediction Center (WPC) forecasters when generating Excessive Rainfall Outlooks (EROs), which are issued for the contiguous United States at lead times of 1–3 days. To address this need, a probabilistic forecast system for excessive rainfall, known as the Colorado State University-Machine Learning Probabilities (CSU-MLP) system, was developed based on ensemble reforecasts, precipitation observations, and machine learning algorithms, specifically random forests. The CSU-MLP forecasts were designed to emulate the EROs, with the goal being a tool that forecasters can use as a “first guess” in the ERO forecast process. Resulting from close collaboration between CSU and WPC and evaluation at the Flash Flood and Intense Rainfall experiment, iterative improvements were made to the forecast system and it was transitioned into operational use at WPC. Quantitative evaluation shows that the CSU-MLP forecasts are skillful and reliable, and they are now being used as a part of the WPC forecast process. This project represents an example of a successful research-to-operations transition, and highlights the potential for machine learning and other post-processing techniques to improve operational predictions.
The Town of Paonia entered into Stage One water voluntary restrictions at the recommendation of Mayor Mary Bachran during the May 11 meeting…
The mayor hit the highlights of Resolution 2020-17 including that stage one restrictions are voluntary; does not apply to drip systems and use of hand watering containers; reduction of irrigation — no irrigating when wind gusts or sustained winds, in order to reduce evaporation; outreach on water use and fixing leaks; limited gardening-car washing, pond and pool filling.
Town Administrator Corrine Ferguson said the town would go to Stage Two if and when water demands exceed supply and they are no longer spilling excess water at the treatment plant.
Stage two restrictions would limit watering on even and odd days with no watering on Saturdays while watering of the town park/properties would be limited to trees and planters.
The Colorado River divides Glenwood Canyon slurry on the ridge from the Grizzly Creek Fire on Monday, August 24, 2020. (Kelsey Brunner/The Aspen Times via Aspen Journalism)
FromColorado Public Radio (Michael Elizabeth Sakas):
The burn scars around places like Glenwood Canyon, Estes Park and Grand Lake are now dangerous in a different way: Areas downhill and downstream from these burned regions are now highly susceptible to flash flooding.
“A third of an inch of rain in 15 minutes is all it’s going to take to start the low-end part of that flooding,” said Greg Hanson, a meteorologist with the National Weather Service in Boulder.
The Boulder office has already issued multiple flood advisories for burn areas. The Colorado Climate Center warned in a tweet that the threat of flash flooding in burn scars will be a recurring issue.
Hanson hopes there won’t be many flash flood warnings this summer, but he believes it’s inevitable…
Why are wildfire burn areas at a higher risk of flooding?
After a wildfire moves through an area, it burns up most of the plants and material that would absorb a lot of that rain, like the tree canopy and the leaves on the ground. Burned vegetation also coats soil with a wax substance that can cause soil to become hydrophobic, meaning it will repel water instead of absorbing it…
The first two years after a fire is when the worry is highest, Hanson said. But the flash flood risk often remains for much longer…
Glenwood Canyon/Colorado River. Photo credit: Allen Best/The Mountain Town News
One area to watch out for? Glenwood Canyon
The stretch of Interstate 70 through Glenwood Canyon was closed for more than a week in the aftermath of the 2020 Grizzly Creek fire. The burn scar that remains is vulnerable to a greater chance for flash floods and debris flows that rush down the canyon walls and affect the drivers and people recreating below.
CDOT is prepared for mudslides and rockfall in Glenwood Canyon, which are “very likely” if there is moderate to extreme rainfall, said agency spokesperson Elise Thatcher.
There’s a safety closure protocol in place to evacuate the canyon, Thatcher said. If there’s a certain amount of rain in the 24-hour forecast or a Flash Flood Watch, rest areas and recreation paths will be evacuated and closed.
CDOT will evacuate all traffic from the canyon if there is a Flash Flood Warning and stage crews to be on standby to clear the road of debris and assess the damage before reopening, Thatcher said.
In the 1920s, E. C. LaRue, a hydrologist at the United States Geological Survey, did an analysis of the Colorado River Basin that revealed the river could not reliably meet future water demands. No one heeded his warning. One hundred years later, water flow through the Colorado River is down by 20% and the basin’s Lake Powell and Lake Mead—the nation’s two largest reservoirs—are projected to be only 29% full by 2023. This river system, upon which 40 million North Americans in the United States and Mexico depend, is in trouble. But there is an opportunity to manage this crisis. Water allocation agreements from 2007 and 2019, designed to deal with a shrinking river, will be renegotiated over the next 4 years. Will decision-makers and politicians follow the science?
It has been said that climate change is water change. Globally, the effects on rivers vary widely, from increased risk of flooding in some places, to short-run increases in river flows in others as glaciers melt and catastrophes ensue once the glaciers are gone. The only constant is change, and our inability to rely on the way rivers used to flow. Like many snowmelt-fed rivers, for the Colorado this translates into less water for cities, farms, and the environment.
Research published over the past 5 years makes the threat clear. Run-off efficiency—the percentage of rain and snow that ends up as river water—is down, with half the decline since 2000 attributed to greenhouse-driven warming. For every 1°C of warming, researchers expect another 9% decline in the Colorado’s flow. This year’s snowpack was 80% of average but is delivering less than 30% of average river flows. Hot, dry summers bake soils, reducing flows the following year. The Colorado is not unusual. Researchers have identified similar patterns in other North American rivers, as well as in Europe, Asia, Africa, and Australia.
Colorado River water management has a long and uneasy relationship with science. LaRue’s analysis of the early 20th century was brushed aside in favor of larger, more aspirational estimates of the river’s flow made by bureaucrats who wanted to build dams. Scientists who agreed with LaRue—there were many—were ignored. This left the river overallocated and put the basin at risk.
Fortunately, there has since been progress in forging water management plans on the basis of science. For example, the US Bureau of Reclamation has been incorporating climate change into its analyses for more than a decade. Admirably, it overcame some of the political and technical challenges of incorporating the effects of climate change in the water allocation rules adopted in 2019. Models used to support decision-making were adapted to incorporate the 21st-century’s declining flows. Computer simulations showing emptying reservoirs were enough to convince decision-makers of the need to cut back. But have the modelers gone far enough?
The scientific challenges are formidable. Although the direction of change—a shift toward less river water—is clear, the details can be murky. This is a challenge for the handoff from science to the world of policy and politics. But we cannot allow that murkiness to stand in the way of taking seriously what the climate science is telling us.
As the basin’s water management community prepares for a new round of negotiations over the water allocation rules, how bad of a “worst case scenario” should be considered and who will get less water as a result? It is tempting to use today’s 20% flow decline as the new baseline—that is, modeling future reductions on the basis of what has already been observed. But only by planning for even greater declines can we manage the real economic, social, and environmental risks of running low on a critical resource upon which 40 million North Americans depend.
The United States and Mexico—not just America’s West and Southwest—can’t afford to get this wrong. There are still political challenges that harken back to the struggles of E. C. LaRue a century ago—namely, as political boosters chose overoptimistic estimates of the river’s flows to make their jobs easier. Climate science indicates that there will likely be less water in the Colorado River than many had hoped. This is inconvenient for 21st-century decision-makers, and overcoming their resistance may be the hardest challenge of all.
Colorado River Basin map via the Babbit Center for Land and Water Policy/Lincoln Institute of Land Policy
View of Denver and Rio Grande (Silverton Branch) Railroad tracks and the Animas River in San Juan County, Colorado; shows the Needle Mountains. Summer, 1911. Denver Public Library Special Collections
The American West is stricken by drought. That is not news. For the past 20 years, moisture levels have been abnormally low in the region. Shriveling crops, raging wild fires and diseased forests are just some of the fallout. Now scientists fear we may be on the verge of a megadrought – a long-lasting period of greatly reduced moisture. The last megadrought was in the 1500s and lasted some 50 years. Past megadroughts were naturally occurring. Their causes are complex and not completely understood. What scientists do understand is that the present drought has been worsened by anthropogenic (human caused) warming. That’s right, our old friend global warming has worsened our present drought by 30-50 percent. How bad could it get? The past 20 years contends with any 20-year period in the last 1,200 years for the severity of drought. That is some bad news.
The San Juan Basin drainage has been especially hard hit. The Animas River shows decreased flow not for the past 20 years, but for the past 30 years, since the early 1990s. In fact, discounting the abnormally wet 1980s, the Animas River has been steadily losing flow since the beginning of record keeping in the 1890s. The history of a single river graphed on a chart is notoriously hard to plumb for trends. Too many years buck the norm presenting a confusing welter of peaks and troughs. But dive deep enough and the evidence is there. The Animas River is not doing well.
Durango flood of 1911 river scene. Photo credit Center of Southwest Studies, Fort Lewis College.
On Oct. 5, 1911, after days of heavy rain, the Animas River came roaring out of its banks. It peaked at 25,000 cubic feet per second (cfs) which was 11 feet deep measured at the station near the power plant. The water reached the top of the arches on the Main Avenue Bridge. The monster runoff of 1911 set the record –since records have been kept – for peak run off of the Animas. Jump ahead to 1927 – a freakish combination of late snow melt and an early monsoon rain June 27, 1927, lashed the river to its second-highest historical level: 20,000 cfs and 9.65 feet…
Peak flow is flashy. It makes stunning photographs. It puts people on the river and pictures in the paper. But it’s a flighty thing, much like spring itself. Peak flow does not water crops or nurture cities. That measurement is annual discharge – which is measured in thousand acre feet, or k/a/f…from 1913-25, the average annual discharge was 750 k/a/f, that’s three-quarters of a million acre feet per year.
Our second period of increased annual discharge is 1941-1950 when the average annual discharge was 665 k/a/f. In our third period, 1979-88, average annual discharge ticked upward to 700 k/a/f, a period that has not been matched for the last 80 years.
For comparison, from 2010-19 the average annual flow of the Animas dropped to 496 k/a/f, a staggering 34 percent decline from the average flow a century ago. If scientists are correct – and we are entering another megadrought, aided and abetted by global warming – the future of the Animas appears grim.
In the past Durango survived the loss of its smelter. A present controversy over the coal-fired train continues to tear at the town. What is Durango’s future with an Animas River reduced to the size and ferocity of an irrigation ditch? How does that impact Durango’s self-image? Where then will lie the soul of el Rio de las Animas Perdidas? Along a dry river bed?
Water Education Colorado’s 2021 Water Leaders May 2021.
Here’s the release from Water Education Colorado (Jayla Poppleton):
Water Education Colorado kicks off its 15th Water Leaders Program May 27, 2021].
Sixteen up-and-coming water leaders from a diverse range of communities and water sectors across Colorado have been selected to participate in this intensive personal and professional development opportunity. They come from both private and public sector organizations, from state agencies, water districts and nongovernmental organizations.
“This is an invaluable investment that we are making, that our participants are making, to ready themselves for the incredible challenges that we as a state are facing around water,” said Jayla Poppleton, executive director for Water Education Colorado. “We are equipping leaders with the confidence and skills to effect change, to work collaboratively across interest areas, and to feel rewarded in what they do as they lead their teams to innovate and craft water solutions.”
Established in 2006, the Water Leaders Program has produced nearly 200 graduates.
Several notable alumni include current Colorado Ag Commissioner Kate Greenberg, Esther Vincent, director of environmental services at Northern Water, and Matt Lindburg, managing principal for Brown and Caldwell who is supporting the state on its 2022 update to the Colorado Water Plan.
Participants are selected based on proven commitment to Colorado water and demonstrated potential for increased leadership roles. Many class members are civically active, serving in a wide range of volunteer roles such as on boards and commissions, in addition to their day jobs.
Molson Coors is a title sponsor of the 2021 program. The company has been brewing beer using Colorado water since 1873 and invests in variety of water sustainability initiatives, ranging from improved efficiency to protection of source watersheds.
“Molson Coors is proud to sponsor the Water Leaders program and ensure a bright future for Colorado by supporting our future water leaders,” said Kayla Garcia, community affairs manager for the company.
Throughout the four-month program, which culminates with a graduation ceremony on Sept. 24, the group will undergo a variety of self-assessments as well as an external, 360-degree feedback review from peers, supervisors, and direct reports. Facilitators will challenge participants to be vulnerable with their hopes and aspirations as well as their fears and perceived limitations as they confront complex issues for Colorado water management and protection in the face of climate change, population growth, and widely diverse community values around resource protection and use across Colorado.
“We have seen individuals break out of their shell and find their calling in the water community in ways that they never even thought possible,” said Stephanie Scott, leadership programs manager for Water Education Colorado. “Seeing graduates stretch beyond their wildest dreams, both personally and professionally, is the true magic of the Water Leaders Program.”
Water Education Colorado is a 501c3 nonprofit providing policy-neutral news and informational resources, engaging learning experiences, and empowering leadership programs. We work statewide to ensure Coloradans are knowledgeable about key water issues and equipped to make smart decisions for a sustainable water future.
WEco offers a variety of digital content and also produces two print publications: Headwaters magazine and the Citizen’s Guide reference series. These publications are distributed to policy makers, water professionals, agricultural and environmental organizations, university students, business leaders, and community groups.
In addition to the Water Leaders Program, WEco runs two other leadership programs: 1) Water Fluency – a comprehensive water literacy course for decision makers without a professional water background, and 2) the Water Educator Network – an affiliate program for fellow water educators to improve their practice.
WEco also provides a variety of other educational and outreach opportunities, including tours, forums, workshops, and the annual Sustaining Colorado Watersheds conference, held in October each year in Avon, Colo.
In June 2018, WEco launched Fresh Water News, a nonprofit news initiative dedicated to providing nonpartisan news coverage of the water issues that define Colorado and the American West.
Water Leaders Program sessions are held across Colorado to highlight local water challenges and leadership lessons.
The 2019 Water Leaders Program class celebrating its graduation .
As the 2020–21 La Niña has come to an end, leaving us with neutral conditions in the tropical Pacific, we now wonder if we have seen the last of La Niña for a while or if we will see another dip into La Niña conditions by next fall. In the world of the El Niño-Southern Oscillation (ENSO), double-dipping is not a party foul—it’s actually quite common for La Niña to occur in consecutive winters (not El Niño, though). If you’re wondering why, then this is the blog post for you!
Mirror, mirror on the wall
To understand why La Niña commonly double dips, we first need some basic understanding of ENSO asymmetry. Often, we think of El Niño and La Niña as mirror opposites—for example, that the warmer-than-average east-central tropical Pacific conditions during El Niño are exactly matched by the cooler-than-average conditions of La Niña. This mirror-opposites perspective is a pretty good approximation, but it’s not perfect!
Average November – January sea surface temperature anomalies (°C) for the top 10 strongest (top) El Niño and (bottom) La Niña events since 1950 based on the November – January Niño3.4 index. Anomalies are calculated with respect to 30-year base periods updated every 5 years. NOAA Climate.gov figure with ERSSTv5 data obtained from the NOAA Physical Sciences Laboratory.
Upon closer inspection, we see some subtle but important differences between El Niño and La Niña in terms of their patterns and behavior. First, the sea surface temperature anomalies (difference from the long-term average) during El Niño tend to be centered farther east than for La Niña, especially for the stronger El Niño episodes. Second, the strongest El Niños tend to be stronger than the strongest La Niñas. We can see these differences in the maps above. The warm anomalies in the eastern Pacific for the El Niño composite are between 2.25 and 2.75 degrees Celsius (4 and 5 degrees Fahrenheit), while the cool anomalies in the east-central Pacific for the La Niña composite top out at 2.25 degrees C.
Monthly sea surface temperature anomalies in the Niño 3.4 region of the tropical Pacific for (top) all first-year El Niño and (bottom) first-year La Niña winters since 1950, starting in the March before the first-year peak. Climate.gov graph based on ERSSTv5 temperature data.
We also see notable differences in how sea surface temperatures in the Niño 3.4 region of the Pacific change over time for first-year El Niños (meaning, the previous winter did not feature El Niño) and first-year La Niñas. After the peak of El Niño, which typically occurs in late fall or winter, Niño3.4 surface temperatures usually decline rapidly to neutral conditions by the following spring. In the ensuing summer through winter, ENSO neutral conditions continue, or La Nina develops, but the occurrence of El Niño in a second consecutive winter is uncommon.
For La Niña, in contrast, the return to ENSO neutral after the late fall peak is usually more gradual, and, as Emily recently reminded us, the transition to El Niño after the first winter of La Niña rarely occurs. Instead, we generally see ENSO-neutral or a transition back into La Niña conditions by the following fall, as shown by that second dip in average Niño3.4 temperatures in the plot above. To reiterate what Emily already noted, of the 12 first-year La Niña events on record, 8 were followed by La Niña the next winter, 2 by neutral, and 2 by El Niño.
All things being unequal
Things would be simpler if El Niño and La Niña behaved similarly, so why are the transitions out of El Niño and La Niña so different? The answers lie in the processes that cause El Niño and La Niña to strengthen and weaken. Several months ago, Michelle introduced us to the essential processes for ENSO, the fun-to-say Bjerknes feedbacks. Essentially, Bjerknes feedbacks describe the reinforcing interactions (positive feedbacks) between the ocean and atmosphere that cause El Niño and La Niña to grow: changes in the tropical Pacific ocean temperatures cause changes in the overlying trade winds, which then cause additional, reinforcing changes in the ocean temperature (please see Michelle’s post for more of the details!).
May–September monthly zonal (east-west direction) wind stress anomalies against the monthly sea surface temperature anomalies in the Niño 3.4 region from 1980-2016. The wind stress anomalies corresponding to La Niña conditions (blue dots) are averaged over the central tropical Pacific from 5°S – 5°N and 167°E – 153°W. The wind stress anomalies corresponding to El Niño conditions (red dots) are averaged farther east, 5°S – 5°N and 179° – 139°W. These regions have the strongest relationship with the Niño 3.4 index and are chosen following Choi et al. (2013). The steeper slope of the linear fit to the red dots relative to the linear fit to the blue dots indicates a stronger zonal wind stress response under El Niño conditions. NOAA Climate.gov figure based on MERRA Reanalysis wind stress data and ERRSSTv5 sea surface temperature data.
If all essential processes that comprise this feedback process were equal but opposite for El Niño and La Niña, then we might expect mirror opposite patterns. However, this isn’t the case. For example, the response of the trade winds to the Niño3.4 surface temperatures is unequal between warmer and cooler surface conditions. We see this above in the scatter plot of monthly May–September zonal (east-west direction) wind stress anomalies (1) in the equatorial Pacific versus the Niño3.4 surface temperature anomalies. As we expect, warmer Niño3.4 surface temperatures that are tied to El Niño conditions bring weaker trade winds and a weaker Walker circulation (positive wind stress anomalies), whereas cooler Niño3.4 conditions bring stronger trade winds (negative wind stress anomalies) connected with a stronger Walker circulation.
However, the plot also reveals that the relationship between the warm (El Niño) and cool (La Niña) sea surface temperature anomalies and the wind anomalies they generate is not equal. El Niño’s warm water anomalies generally produce wind stress anomalies that are stronger and farther east than those produced by cool La Niña anomalies of equal strength. The stronger response is demonstrated by the steeper slope of the red line versus the blue line. This difference may seem a bit subtle, but it can have big consequences for ENSO asymmetry (2).
The strength of the coupling between the winds and upper ocean matters because it not only strengthens El Niño and La Niña, but it also sets the wheels in motion for the ultimate demise of each event. The strong coupling between ocean and atmosphere and the more eastward wind stress anomalies during El Niño contributes to a robust poleward discharge of equatorial Pacific upper-ocean heat, typically by early spring, that ends the El Niño event and sets the stage for the next La Niña. The weaker coupling and more westward wind stress anomalies during La Niña means that the corresponding “recharge” of heat is also weaker, and so the ocean is not as primed for a transition to El Niño. Instead, if we experience the right sequence of tropical weather, a second winter of La Niña may return instead (3).
The scenario I have described is far from complete, as there are many other atmospheric and oceanic (and even biological!) processes that likely contribute to ENSO asymmetry and the tendency for La Niña to persist for more than one winter (4). There is still considerable debate about which processes are most important for these El Niño/La Niña differences (still so much unsettled ENSO science!).
A heads up?
Can we predict when La Niña will double-dip? Some recent studies suggest that we may be able to predict (in a probabilistic sense) more than a year in advance the likelihood of two-year La Niña based on the strength of the preceding El Niño and poleward discharge of equatorial heat (5). However, the most recent La Niña is a bit unusual because El Niño did not immediately precede it, and so it is difficult to identify any clear indicators that La Niña will return next fall at this time. Although we must await further guidance to get a better handle on the forecast, we at least can say that both history and the current ENSO forecast suggest that El Niño is unlikely to return in the near future.
Special thanks to Dr. Andrew Wittenberg for guidance and helpful comments while preparing this blog post!
Footnotes
(1) Wind stress measures the lateral force per unit area that the wind exerts on the ocean surface. A “positive zonal wind stress anomaly” corresponds to an anomalous eastward force on the ocean surface, exerted by a stronger-than-average eastward component of the winds; this weakens the normally westward force exerted by the trade winds. Conversely, negative zonal wind stress anomalies indicate a stronger westward force on the surface ocean, exerted by stronger-than-average westward trade winds.
(2) The zonal wind stress analysis of this post is modeled after Choi et al. (2013). That study provides conceptual and theoretical support for the hypothesis that the asymmetry in zonal wind stress response to tropical Pacific sea surface temperatures, like what is shown in the scatter plot of this post, is sufficient for explaining many of the asymmetries between El Niño and La Niña, including the tendency for La Niña to persist for more than one winter (see the next footnote for additional details).
Choi, K.-Y., G. A. Vecchi, and A. T. Wittenberg, 2013: ENSO transition, duration, and amplitude asymmetries: Role of the nonlinear wind stress coupling in a conceptual model. Journal of Climate, 36, 9462-9476. https://doi.org/10.1175/JCLI-D-13-00045.1
(3) For those of you who are interested in more of the scientific details about how this wind stress asymmetry between El Niño and La Niña may contribute to the tendency for La Niña to double-dip, this footnote provides additional, more technical discussion, courtesy of Dr. Andrew Wittenberg.
ENSO events are sparked by a disequilibrium between two coupled ocean/atmosphere time scales in the response to wind changes: a fast equatorial adjustment (oceanic equatorial Kelvin waves + Bjerknes feedbacks), and a slow off-equatorial adjustment (curl-induced oceanic Rossby waves and delayed negative feedbacks).
Equatorial wind anomalies that are located farther east (as during a strong El Niño) induce more transient growth, disequilibrium, and overshoot into the opposite phase, for 2 key reasons. (1) Their resulting zonal current anomalies & upwelling anomalies are located closer to the warm pool edge in the central Pacific and shallow thermocline of the east Pacific. This strengthens the transient growth via fast equatorial processes (zonal advective feedback and Ekman feedback, two of the important Bjerknes feedbacks), which amps the wind anomalies so much that they can over-discharge the equatorial thermocline several months later. (2) When the off-equatorial wind stress curl anomalies are located farther east, they’re also farther from the western boundary, and so their resulting off-equatorial oceanic Rossby wave trains have farther/longer to travel before they can reflect back onto the equator and start the turnabout of the ENSO event. This enables the equatorial disequilibrium to grow more strongly before being impeded & eventually reversed by the delayed negative feedback. Thus, the more eastward-shifted zonal wind stress anomalies during strong El Niños enable stronger transient growth & disequilibrium, increasing the over-discharging and subsequent overshoot.
In short, under the “zonal wind stress asymmetry hypothesis” of Choi et al. (2013), La Niña is more likely to double-dip because its winds stress anomaly is so far from the “sea surface temperature-ticklish” zone of the central/eastern Pacific, and so close to the western boundary “transfer station” for the off-equatorial feedbacks, that La Niña just can’t get as much of a disequilibrium going – and hence can’t over-charge the equator enough to guarantee an overshoot into El Niño.
(4) For a comprehensive review of existing hypotheses for ENSO asymmetry, I recommend An et al. (2020).
An, S.-I., E. Tziperman, Y. Okumura, and T. Li, 2020: ENSO irregularity and asymmetry. In A. Santoso, M. McPhaden & W. Cai (Eds.), El Niño Southern Oscillation in a changing climate (pp. 153– 172). John Wiley & Sons.
(5) For example, a few recent studies, including two led by Dr. Pedro DiNezio, suggest that the probability of a multi-year La Niña may be skillfully predicted 18-24 months in advance, given a preceding El Niño. The sources of skill are rooted in the strength of the El Niño and the magnitude of poleward heat discharge 6 months after the peak of El Niño.
DiNezio, P. N., C. Deser, Y. M. Okumura, and A. Karspeck, 2017a: Predictability of 2-year La Niña events in a coupled general circulation model. Climate Dyn., 49, 4237–4261, https://doi.org/10.1007/S00382-017-3575-3.
DiNezio, P. N., C. Deser, A. Karspeck, S. Yeager, Y. Okumura, G. Danabasoglu, N. Rosenbloom, J. Caron, and G. A. Meehl, 2017b: A 2 year forecast for a 60–80% chance of La Niña in 2017–2018. Geophys. Res. Lett., 44, 11 624–11 635, https://doi.org/10.1002/2017GL074904.
Wu, X., Y. K. Okumura, C. Deser, and P. N. DiNezio, 2021: Two-year dynamical predictions of ENSO event duration during 1954–2015. J. Climate, 34, 4069-4087, https://doi.org/10.1175/JCLI-D-20-0619.1.
Here’s the release from the City of Boulder (Samantha Glavin and Julie Causa):
Due to recent warm weather and increased snowmelt and runoff, Barker Reservoir is expected to start spilling later this week, as early as this Friday, May 28.
This is a normal and expected event that will increase flows in Boulder Creek throughout the city and residents are urged to take caution near the creek during the high flow period, which may last for several weeks.
Each spring as temperatures warm, stream flows increase due to runoff from melting mountain snow. Before peak stream flows occur at lower elevations (like in the city of Boulder), mountain reservoirs must first fill and start spilling.
Barker spill typically occurs between mid-May to late June, with the exact date dependent on weather, snowpack and early spring reservoir levels.
Barker Reservoir has relatively limited storage space, which means that when the reservoir is full, any excess inflow passes over the spillway and continues flowing downstream into Boulder Creek. To provide a sense of scale, the volume of water that flows through Middle Boulder Creek each spring could fill the reservoir multiple times.
FromThe Cortez Journal (Jim Mimiaga) via The Durango Herald:
Irrigators tied to McPhee Reservoir contracts will receive just 5% to 10% of their normal supply, said Ken Curtis, general manager for the Dolores Water Conservancy District.
The shortages affect full-service users in the water district in Montezuma and Dolores counties, the Ute Mountain Ute Farm and Ranch and the downstream fishery.
The water district said no supplemental irrigation supplies will be available to the senior water-rights holders.
Alfalfa farmers are consolidating acreage to try to produce one small crop…
“Financial impacts will be hard on all agriculture producers,” said Dolores Water Conservancy District board president Bruce Smart, in a news release. “The recovery for producers, the Ute Mountain Tribe and the district will take years.”
The tribe’s Farm and Ranch Enterprise reports it will limit employment and cut back on buying farm supplies.
The 7,600-acre farm will only receive 10% of its normal water supply, tribal officials said.
The tribe will limit operations to growing corn for its Bow and Arrow Brand cornmeal mill, and to protect high-value alfalfa fields, said Ute Mountain Ute Tribal Chairman Manuel Heart…
The tribe intends to work closely with the Dolores Water Conservancy District and the U.S. Bureau of Reclamation to protect the continued viability of the Ute Farm and Ranch Enterprise.
Heart notes that the tribe’s participation in the Dolores Project is a result of the Colorado Ute Indian Water Rights Settlement Act. He said the tribe will exercise the settlement rights “in the fullest to protect our Farm and Ranch Enterprise.”
The economic impact of the irrigation water shortage will be widespread, as farmers expect a significant decrease in revenue that will trickle through the local economy, water officials said.
If next year’s supply doesn’t improve “multigenerational farm families may face bankruptcy,” said Curtis.
Unirrigated alfalfa fields will dominate the landscape this summer. Farmers noted that with some rain, the fallow fields can produce enough forage for cattle grazing. Ranchers have been contacting farmers to take advantage of the option, Deremo said.
Curtailed supply for Dove Creek
The town of Dove Creek depends on McPhee Reservoir water for its domestic water supply. The water is delivered via the Dove Creek Canal and into town reservoirs and a water treatment facility. But because of a shortened irrigation season, the canal will not run all summer, as it does during more normal water years.
The water district is working closely with Dove Creek officials to keep the town’s water reservoirs adequately stocked for the winter months, Curtis said.
During normal water years, the Dove Creek Canal runs to the first week in October, allowing Dove Creek to store 100 acre-feet that lasts them until May 1 the next year. This year, the canal is expected to shut off for irrigators before the end of June.
The other large irrigation supplier in the area, Montezuma Valley Irrigation Co., also faces shortages. Customers will receive only half their normal allocation. The irrigation company has the most senior water rights on the Dolores River, and therefore the impact of the water shortage is somewhat less…
Montezuma Valley Irrigation has storage rights in McPhee Reservoir, and owns Narraguinnep and Groundhog reservoirs.
Dolores River watershed
Runoff low in Dolores River
Poor winter snowpack the past two years and no monsoonal rain for the past three years have hurt reservoir levels and depleted soil moisture.
The winter snowpack failed to deliver at historical average, peaking at only 83% of normal snowpack on April 1, then dropping to 25% after another dry, windy and warm spring. Recent rains and snowfall on the high peaks were helpful, but not enough to significantly improve water supply.
As dry conditions continue, 2021 is shaping up to be the fourth-lowest recorded runoff in the Dolores River, after 1977, 2002 and 2018.
The Dolores River, below Slickrock, and above Bedrock. Photo: Brent Gardner-Smith/Aspen Journalism.
Fish will suffer
As part of the McPhee Reservoir project, the downstream fishery is allocated 32,000 acre-feet of water during normal water years for timed releases downstream to benefit sport and native fish.
This year, the fish pool will receive 5,000 acre-feet of its normal allocation.
The Dolores River below McPhee dam will see flows of 10 cubic feet per second for a few months, then it will drop to a trickle of 5 cfs for eight months until spring.
The river below the dam faces significant trout and native fish population losses, said Jim White, aquatic biologist for Colorado Parks and Wildlife…
Flannel mouth sucker
Bluehead sucker
Roundtail chub
The low flows will also affect native fish in the lower reaches of the Dolores River – the flannelmouth sucker, the bluehead sucker and the roundtail chub. The fish, listed by CPW as species of concern, have adapted to warm water, but they still need pools and flowing water to survive.
Click on a thumbnail graphic to view a gallery of drought data from the US Drought Monitor.
US Drought Monitor map May 25, 2021.
High Plains Drought Monitor map May 25, 2021.
West Drought Monitor map May 25, 2021.
Colorado Drought Monitor map May 25, 2021.
Click here to go to the US Drought Monitor website. Here’s an excerpt:
This Week’s Drought Summary
Much of the western CONUS experienced below-normal average temperatures this week, with many areas across the Great Basin and Northern Rockies observing greater than 6°F negative departures. Above-normal precipitation in the West was limited to the high elevations of the Cascades, the Central Great Basin, Montana, and northern New Mexico. However, improvements were only warranted in western Montana and northern parts of New Mexico, where the heaviest precipitation fell. Elsewhere in the West, degradations were warranted due to declining snowpack, stream flows, and soil moisture. The Southern Plains and Gulf Coast also experienced negative 7-day average temperature departures. However, negative departures along the eastern Gulf Coast were driven by easterly to northeasterly flow early in the week whereas below-normal temperatures along the western Gulf Coast and Southern Plains were driven by above-normal precipitation (1 to 2 inches across the Southern Plains and well in excess of 3 inches through the Ark-La-Tex and along the western Gulf Coast). Heavy rains in the Southern Plains resulted in continued improvements across Texas this week, while high pressure across the Southeast exacerbated 30 to 60-day dryness in Virginia, the Carolinas, and Florida, leading to degradation of abnormally dry (D0) and moderate drought (D1) conditions. From the Central and Northern Plains eastward to the Atlantic Coast, most areas experienced temperatures 6°F to 9°F above-normal. Heavy rains fell across western portions of the High Plains Region, warranting minor improvements across the western Dakotas, while the larger improvements were observed from western Nebraska and Kansas westward to the Front Range. From the eastern High Plains Region to the Great Lakes, improvement and degradations were observed based on where the heaviest precipitation fell. In the Mid-Atlantic and Northeast, below-normal precipitation over the past couple of weeks and above-normal average temperatures this week resulted in D0 expansion from the Great Lakes to New England and into the Mid-Atlantic, with some D1 expansion in Upstate New York. Stream flows and soil moisture continue to rapidly decline across the Northeast, Mid-Atlantic, and portions of the Southeast…
In the High Plains Region, a swath of 1.5 to 3 inches (locally more) of rain fell from western North Dakota southward to eastern Colorado and northwestern Kansas. This resulted in reductions in D0 (abnormally dry) and D1 (moderate drought) coverage in western Nebraska and eastern Colorado, with additional 1-category improvements in the drought depiction across southeastern Colorado. In the Dakotas, where long-term moderate (D1) to exceptional (D4 – South Dakota) drought is entrenched, the heavy rainfall, although beneficial, was only enough for minor reductions in D1 (moderate drought) to D3 (extreme drought) coverage in the western areas. Reports indicate much of this week’s heavy rains was immediately absorbed by the severely dry soils, with no runoff into empty dugouts or ponds. However, in some locations, the rain fell so quickly that it did not allow time for infiltration into the topsoils, resulting in erosion of topsoils. Furthermore, high wind events have increased the potential for evaporative loss of this moisture from the topsoils. Currently, very little vegetative matter is available for grazing, despite some isolated areas of green-up from recent rainfall. In eastern North Dakota, some D3 reduction was warranted in areas receiving more than 1.5 inches of rainfall, diminishing long-term deficits. However, in South Dakota, where above-normal temperatures (9°F to 12°F positive anomalies) and below-normal precipitation (less than 50 percent of normal precipitation), expansion of D0 (abnormally dry), D1 (moderate drought), and D2 (severe drought) coverage were warranted as 30-day SPIs have fallen to D3 to D4 equivalence and 30-day deficits (1 to 3 inches) continue to accumulate…
Most basin snow water equivalent (SWE) percentiles across the Western Region are well below-normal for the period of record (near and below the 65th percentile), especially in the Four Corners region (below the 5th percentile in Arizona and New Mexico). Only parts of the Pacific Northwest and areas of central Montana experienced near and above-normal seasonal snowfall. However, above-normal temperatures over much of the West in recent weeks to months has resulted in rapid snowmelt and, due to dry topsoils, much of the melt water has not made it into the rivers, lakes, and reservoirs. In California, USGS 7-day average stream flows across the coastal ranges around and north of the Bay Area, and extending eastward into the Sacramento River Basin, are rapidly declining having dropped below the 2nd percentile at many locations in the coastal ranges, and below the 10th percentile eastward into the northern Central Valley. CPC soil moisture ranks below the 1st percentile (corroborated by NASA SPoRT 0-200 cm soil moisture percentiles), NASA GRACE indicates severely depleted groundwater, and vegetation indices (VegDRI and VHI) indicate severe vegetation stress. Reports of reduced pasture forage, livestock requiring supplemental feed and/or being sold off are increasing. Additionally, stock ponds are running dry and farmers have been forced to haul water in several locations. There are also reports of increased well drilling in the Sacramento River Valley and groundwater levels have fallen so low near the Sacramento and San Joaquin River deltas that there is an increased risk of salt water intrusion. Given the worsening conditions, D4 (exceptional drought) was expanded eastward into the Sacramento River Basin from the coastal ranges in and around the Bay Area. Farther east, D3 (extreme drought) was expanded into the Lake Tahoe area, as rapid snowmelt has nearly eliminated remaining snowpack, resulting in declining stream flows in that region, which have fallen to below the 10th percentile at several stations. In northeastern California, D2 (severe drought) was expanded into the lower Klamath Watershed, as USGS 7-day average stream flows have fallen below the 10th percentile and groundwater remains severely depleted (D3 to D4 equivalent, per NASA GRACE). Furthermore, the Yurok Tribe Fisheries Department reported diseased juvenile fish during an annual assessment and project a catastrophic fish kill along the Klamath River.
Elsewhere across the Western Region, targeted degradations to D2 (severe) and D3 (extreme) drought in eastern Washington and D1 (moderate) and D2 drought in northeastern Oregon were made. CPC soil moisture indicates widespread soil moisture conditions below the 5th percentile and groundwater is depleted for many areas. These degradations also correspond well with VegDRI, which indicates increased stress on vegetation. Despite the poor soil moisture conditions, 7-day average stream flows remain near and below-normal across many areas east of the Cascades due to the near to above-normal seasonal snowpack leading into the summer months. Conversely, in Montana, above-normal precipitation (7-day accumulations in excess of 2 inches liquid water equivalent) fell across the western half of the state, with locally more than 5 inches falling near Flathead National Forest (per AHPS). The heavy rainfall resulted in targeted improvements in areas experiencing abnormally dry (D0), moderate drought (D1), and severe drought (D2) conditions. However, long-term deficits remain (10 inch liquid water equivalent deficits in some of the higher elevations of western Montana)…
Heavy rainfall and flooding was the main concern for many locations in the Southern Region this week. Across eastern and southern Texas, the Ark-La-Tex, and southwestern Louisiana, many areas received in excess of 3 inches of rainfall this week, in addition to the heavy rainfall observed in recent weeks. Southeastern Texas and southwestern Louisiana were again some of the hardest hit areas, with several areas receiving 8 to 10 inches of rainfall, and more in some locations. The eastern half of Texas, although having become drought free this week, has switched to become excessively wet, with flooding ongoing in several areas. Farther west in Texas, further reductions in D0 (abnormally dry) and drought (D1-D4) coverage were warranted in areas receiving more than 2 inches of rainfall, and some green-up has been indicated across parts of western Texas in recent weeks. From northern Mississippi to central Tennessee, 30-day rainfall deficits are beginning to increase. D0 was introduced in south-central Tennessee, extending across into northwestern Alabama, as 30-day SPIs have fallen into the D0 to D1 range, despite near normal stream flows. This area also shows up well (D0 to D1 equivalent depictions) in the NASA SPoRT 0-100 cm soil moisture…
Looking Ahead
During the next 5 days (May 27 to 31), parts of the Pacific Northwest, much of the Great Plains and Corn Belt, and Mid-Atlantic are favored to remain wet. Some locations in the Central Plains could receive up to 2 to 4 inches of rainfall. Temperatures are forecast to remain below-normal for much of the period across the Central and Southern Plains, with temperatures starting out below-normal across the eastern CONUS before moderating to near-normal during the period. In the West, temperatures are expected to be much above-average, with forecast positive anomalies in excess of 20°F near the end of the 5-day period.
The CPC 6-10 day extended range outlook (valid June 1 to 5) favors enhanced odds for above-normal temperatures and below-normal precipitation across much of the West and Northern Tier to the Great Lakes, with above-normal temperature probabilities extending into the Northeast. Enhanced odds for below-normal temperatures and above-normal precipitation are favored across the Southern Plains and Lower Mississippi Valley, with odds tilting toward above-normal precipitation across the Southeast. In Alaska, above-normal temperatures are predicted across the Southwest Mainland and parts of the Alaska Peninsula, while enhanced odds for below-normal temperatures are predicted over the eastern half of the state. Above-normal precipitation is favored across much of Mainland Alaska, extending to the Panhandle.
Here’s the US Drought Monitor one week change map ending May 25, 2021.
US Drought Monitor one week change map ending May 25, 2021.
Aerial views of drought-affected Colorado farm lands 83 miles east of Denver on July 21, 2012. Green areas are irrigated, the yellow areas are dryland wheat crops. (Lance Cheung/USDA/Public Domain Mark 1.0)
A drought crisis unfolding across the West will require short-term relief and massive, long-term federal funding to help states weather the effects of climate change, state water managers and lawmakers said at a U.S. House hearing on Tuesday.
Nearly 90% of the West is now experiencing drought conditions, according to the federal U.S. Drought Monitor. The problem is particularly acute in the Southwest.
Arizona, New Mexico, Nevada and Utah just had their driest year in 126 years. Colorado had its fourth-driest year, according to the National Oceanic and Atmospheric Administration.
Snowpack is well below average this year and early snowmelt is raising serious concerns for this summer…
‘No more time to waste’
The drought conditions are part of an ongoing, concerning trend — due in part to climate change.
“Warmer dryer conditions are expected to increase in the future, leading to extended and more severe drought and fire seasons,” said Craig McLean, acting chief scientist for the National Oceanic and Atmospheric Administration.
The Colorado River Basin is experiencing its driest 21-year-period in 100 years of record-keeping, according to the Interior Department. Extreme or exceptional drought is forecast to continue this year for most of the basin.
Reservoirs that the river feeds are already dangerously low. Lake Mead is at 37% capacity and Lake Powell is at 34%, according to the Southern Nevada Water Authority.
If hydrology levels continue, Entsminger said, there is a high probability that Lake Mead could get close to the point in the next decade where the Hoover Dam could no longer deliver water downstream and power production there could come to a halt…
But [John] Entsminger said the problem needs to go beyond what they can do at a state level, with a “focused and robust” federal investment in watershed conservation, water recycling and climate change response.
Biden administration plan
President Joe Biden included drought response in his massive infrastructure proposal, the American Jobs Plan. The proposal includes investment in “nature-based infrastructure” for climate resilience and water efficiency and recycling programs to address the drought crisis.
The Interior Department has also pulled together a favorite federal response, the interagency working group, to address drought relief. The group had its first meeting earlier this month and is working to coordinate funding and programs on drought resilience, according to Klein.
Biden also announced this week he would double the amount of federal funding to help states prepare for natural disasters like hurricanes and wildfires.
East Troublesome Fire. Photo credit: Brad White via The Mountain Town News
Rep Jared Huffman, (D-Calif.), the chairman of the Water, Oceans, and Wildlife Subcommittee that hosted the hearing, last week reintroduced his drought resiliency bill, H.R. 3404.
It would direct the federal government to invest more than $1 billion for various water projects, including water storage, recycling and desalination efforts…
Idaho’s Craig Foss, state forester at the Idaho Department of Lands, told lawmakers that more aggressive management of dry forests that are prone to wildfire would be one way to help.
New plating at the Glenwood Springs water intake on Grizzly Creek was installed by the city to protect the system’s valve controls and screen before next spring’s snowmelt scours the Grizzly Creek burn zone and potentially clogs the creek with debris. (Provided by the City of Glenwood Springs)
Liz Roberts is digging into snow-soaked dirt just above the banks of Grizzly Creek in western Colorado. With bare fingers she sifts through the dark soil, looking for life amid the ruins of last summer’s devastating Grizzly Creek fire.
When she finds tiny dormant roots, she smiles and exposes more soil to show visitors that this ground, just two or three inches down, is filled with plant matter that will grow and bloom in the summer when the snow melts.
But farther along this same trail, in the White River National Forest just east of Glenwood Springs, there is thick ash beneath the snow, and few dormant roots. This means the soil was so injured by the fire, which burned for more than four months, that it has become disconnected from the mountainside, and the ash lying unrooted above it will be carried into the creek this spring as the water melts.
In unburned forests, the spring snowmelt is a glorious, annual event.
But not this year.
Roberts and other forest experts know that the spring runoff will carry an array of frightening heavy metals and ash-laden sediment generated in the burned soils, posing danger to the people of Glenwood Springs, who rely on Grizzly Creek and its neighbor just to the west, No Name Creek, for drinking water.
Unseen toxins
Raging wildfires…are easy to see. But what is rarely seen is the devastation to the natural mountain collection systems, where water starts as snow before melting in the spring and flowing down into creeks and eventually into water systems for towns and agricultural lands.
As soils burn, naturally occurring substances that would normally be locked in place are released.
“Sometimes we see lead, mercury, cadmium, possibly arsenic,” said Justin Anderson, Roberts’ colleague and a U.S. Forest Service hydrologist. “They can be dangerous, especially in high concentrations.”
Like other Western states, Colorado is in red alert mode this year, in part because these new megafires, triggered by drought and climate change, ravaged not just Glenwood Springs’ water system, but other major systems as well. Northern Water, for example, manages the Colorado Big-Thompson Project, which serves more than 1 million people and hundreds of farms on the northern Front Range and Eastern Plains. Burning at the same time as the Grizzly Creek fire, the Cameron Peak and East Troublesome fires rampaged through the project’s mountain collection system, affecting water supplies for Fort Collins, Greeley, Boulder, Broomfield and Loveland, among others.
Largest Colorado wildfires as of May 2021. Data Source: Rocky Mountain Area Coordination Center, Graphic by Chas Chamberlin
Even as communities across the state keep their eyes on a 2021 fire season expected to be as bad as that of 2020, when the state saw the largest fires in its history explode, they are racing to create high-tech water treatment programs capable of filtering out the toxins now present in their once-pristine water, and replacing the pipes, intake flumes and grates damaged beyond repair last year.
Esther Vincent, Northern Water’s director of environmental services, expects the agency to spend more than $100 million over the next three to five years, restoring hundreds of thousands of acres of forest in Rocky Mountain National Park, Grand County and along the Front Range in Boulder and Larimer counties. That is nearly triple the agency’s $40 million reserve fund.
Ravaged pipes, reservoirs
“Over half of our major watersheds were affected,” Vincent said. “In some of them 90 percent is burned. Because there is no option to bypass the runoff that is going to come into our system, it will enter our reservoirs and affect all of our infrastructure on the West Slope.”
Restoring forests is an undertaking that requires decades of work and whole new industries to execute effectively.
Mike Lester is Colorado State Forester. Thanks to Colorado’s rapid recovery from the Covid-19 budget crisis and federal relief funds expected later this year, his agency has more money than it’s ever had to help restore forests.
”We’re going to be pretty well supported this year,” Lester said. The state added $6 million this past year for restoration work and it is expecting another $8 million July 1, when the new fiscal year begins.
Colorado has some 24 million acres of forest, most of which is owned by the federal government, and to a lesser extent, private landowners. Roughly 10 percent of those acres are in need of immediate attention to protect towns and homes in the wildland urban interface, Lester said. Colorado’s wildland urban interface, also known as the WUI, has become increasingly populated, creating greater risk to lives and infrastructure and complicating forest management.
The restored floodplain of the South Fork McKenzie River in Oregon, USA after the 2020 Holiday Farm Fire. Credit: Kate Meyer, USDA Forest Service
Loggers wanted
Repairing the forests, thinning trees so the fires don’t burn with such intensity, and stabilizing hundreds of thousands of scarred mountain slopes requires skilled personnel and methods for utilizing the downed timber.
“We’re way short of resources,” Lester said. “We don’t have a huge amount of logging and professional forestry in Colorado. There is only so much money you can spend well before you run into capacity issues.”
In the short-term communities are focused on doing what they can now to keep their water systems safe.
Matt Langhorst is Glenwood Springs’ director of public works. When the Grizzly Creek fire ignited last August, he could tell almost immediately that the flames were going to engulf the water system’s intake structures in the White River National Forest high above the town at the top of Grizzly and No Name creeks.
“The second I saw the smoke coming over the hill, I knew it was right around our two watersheds. I picked up the phone and called the fire department and said, ’We’re going to have a problem.’”
Map credit: Water Education Colorado
A massive loss
Nine months later, Langhorst and his crews have reworked the high mountain intake structures and they’ve finished a complete rebuild of the town’s small water treatment plant so that it can remove the pollutants expected to contaminate its once-clear waters, and filter out massive sediment loads that are already beginning to come down into the creeks as they enter the Colorado River just east of town along I-70.
“We are expecting it to change the water quality for three to seven years, but it could be longer than that,” Langhorst said. “It is a massive loss.”
And costly. Glenwood Springs Mayor Jonathan Godes said the work needed to repair and rebuild its water system, and create a safe evacuation route if Glenwood Canyon is shut down again as it was last summer, will likely cost three times its annual operating budget of $19 million.
“It’s something we can’t afford,” Godes said. “But we can’t afford not to do it.”
In response, state agencies are rethinking how they provide emergency funds as natural disasters such as these megafires happen more frequently.
Help, please
The Colorado Water Conservation Board (CWCB), last fall, was able to offer Glenwood Springs $8 million in a matter of days so that Langhorst and his crews could get into the high country to do critical construction work before winter snows arrived.
Kirk Russell oversees the CWCB’s loan funds. He said the agency was able to move quickly because it had seen the damage done and the loan delays that occurred after the state’s catastrophic floods of 2013. Back then, federal emergency funds took months to reach devastated Front Range communities and farm irrigation systems that were blown out by powerful flood waters.
“Fast forward to the wildfires that we saw last year and we foresaw there was going to be a need to respond quickly,” Russell said.
Now the agency has new emergency rules that provide for quick approvals on three-year, no-interest loans when water systems are harmed by wildfires.
“Do we need more money and more flexibility? Absolutely,” Russell said.
The state also needs a more cohesive response to managing and restoring forests and the water systems embedded in them. Key to that effort is a two-year-old initiative called the Colorado Forest and Water Alliance, an advocacy group that includes federal and state forest officials, water utilities, logging industries and environmental groups.
Ellen Roberts, a former state lawmaker from Durango, has helped spearhead the fledgling effort and is working on other local initiatives designed to work effectively across city and county boundaries, as well as private, public and federal lands.
Colorado’s lawmakers and the federal government have pledged more than $20 million this year to quickly jumpstart the work.
“I am very encouraged by that,” Roberts said. “A good chunk of the money will need to go to immediate post-fire work, but we need to shift gears soon to put the money in at the front end [to thin the over-grown forests]. Hopefully we will be seeing both with the money that has been set aside. This is not a one-and-done investment. It has to be viewed as being chapter one of a very, very long book.”
Water comes down
Back out in the White River National Forest, the annual snowmelt above Grizzly and No Name creeks has begun.
Liz Roberts, an ecologist with the U.S. Forest Service, examining burned soils in the White River National Forest near Glenwood Springs. March 25, 2021. Credit: Dave Timko, This American Land
And Matt Langhorst is waiting, hoping that the residents of Glenwood Springs, who have enjoyed more than 115 years of clear mountain water, won’t notice any difference in how their water tastes.
He got hundreds of calls last August when the town was forced to shut off its fire-engulfed water system and use an emergency source temporarily.
Each call was roughly the same, he said.
“Everyone wanted to know, ‘What happened to my water?’”
Jerd Smith is editor of Fresh Water News. She can be reached at 720-398-6474, via email at jerd@wateredco.org or @jerd_smith.
To decarbonize grid, keep the nukes, say 2 Colorado researchers
Two Colorado researchers on renewable energy have a recommendation that might surprise some who embrace goals of 100% renewable or, at least, emission-free electricity.
Keep the existing nuclear reactors on line as long as possible, say Charles Kutscher, a fellow at the Renewable and Sustainable Energy Institute at the University of Colorado Boulder, and Jeffrey Logan, the associate director of the institute.
Writing in The Hill, the two Coloradans say that creating an emissions-free electric grid in the United States won’t be easy. 2020 was a record year for new U.S. wind and solar electricity capacity additions, but to achieve a carbon-free grid by 2035, annual installations of solar and wind must double or triple.
They also urge wringing as much efficiency out of transportation, buildings, and industrial sectors, hence lessening the amount of electricity that will be needed. But they also say it’s important to keep the existing nuclear fleet operating for as long as it’s safe to do so.
This is from Big Pivots, an e-journal that tracks the energy and water transitions in Colorado and beyond. To subscribe, go to http://BigPivots.com.
They note that many analysts see a clear path to achieving 80 to 90% renewable electricity grid.
“Addressing that last 10 to 20% will also likely require long-term storage as well as grid modernization including improved market design.”
But if there are challenges and difficulties, they say, mostly it’s a matter of doing.
“Although some observers have called for a massive R&D effort to develop innovative solutions to the climate crisis, the truth is that we already have the technologies we need to solve most of the problem, and our chief focus must be on enabling and deploying them.”
What new NREL study says about achieving 100% renewable grids
While we might all like a definitive answer on what it will take to achieve an emission-free grid, a new study produced by 17 researchers at the National Renewable Energy Laboratory and the Office of Energy Efficiency and Renewable Energy, both federal labs, offers a more squishy answer.
The study carefully works through the challenges, identifying three key ones:
1) the short-term variability problem, which has largely been solved;
2) the diurnal mismatch problem, which is partially solved, so further research is needed; and
3) the seasonal problem remains largely unsolved although some pathways have been proposed. Additional research is also needed.
Locally, yes, deep, deep penetration is possible, but getting close to achieving 100% renewables at a national scale for all hours of the year—well, there are significant unanswered questions.
“There is no simple answer to how far we can increase renewable deployment before costs rise dramatically or reliability becomes compromised,” said Paul Denholm, the principal energy analyst at NREL and lead author of the paper that was published in Joule, an energy journal.
“As far as the last few percent’ of the path to 100%, there is no consensus on a clear cost-effective pathway to address both the Balance Challenge and the Inverter Challenge at the national scale,” he said in a statement distributed by NREL.
“Studies have found no specific technical threshold at which the grid ‘breaks,’ and we can’t just extrapolate from previous cost analyses because, when it comes to the future, there are many non-linearities and unknown unknowns—things we don’t even know we don’t know yet.”
The Western U.S. appears headed for another dangerous fire season, and a new study shows that even high mountain areas once considered too wet to burn are at increasing risk as the climate warms.
In a new study published May 24, 2021, in Proceedings of the National Academy of Sciences, our team of fire andclimate scientistsand engineers found that forest fires are now reaching higher, normally wetter elevations. And they are burning there at rates unprecedented in recent fire history.
While some people focus on historical fire suppression and other forest management practices as reasons for the West’s worsening fire problem, these high-elevation forests have had little human intervention. The results provide a clear indication that climate change is enabling these normally wet forests to burn.
As wildfires creep higher up mountains, another tenth of the West’s forest area is now at risk, according to our study. That creates new hazards for mountain communities, with impacts on downstream water supplies and the plants and wildlife that call these forests home.
Forest fires advanced to higher elevations as the climate dried from 1984 to 2017. Every 200 meters equals 656 feet. Mojtaba Sadegh, CC BY-ND
Rising fire risk in the high mountains
In the new study, we analyzed records of all fires larger than 1,000 acres (405 hectares) in the mountainous regions of the contiguous Western U.S. between 1984 and 2017.
The amount of land that burned increased across all elevations during that period, but the largest increase occurred above 8,200 feet (2,500 meters). To put that elevation into perspective, Denver – the mile-high city – sits at 5,280 feet, and Aspen, Colorado, is at 8,000 feet. These high-elevation areas are largely remote mountains and forests with some small communities and ski areas.
The area burning above 8,200 feet more than tripled in 2001-2017 compared with 1984-2000.
One of Colorado’s largest wildfires, 2020’s East Troublesome Fire, crossed the Continental Divide and was burning at elevations around 9,000 feet in October, when snow normally would have been falling. AP Photo/David Zalubowski
Our results show that climate warming has diminished the high-elevation flammability barrier – the point where forests historically were too wet to burn regularly because the snow normally lingered well into summer and started falling again early in the fall. Fires advanced about 826 feet (252 meters) uphill in the Western mountains over those three decades.
The Cameron Peak Fire in Colorado in 2020 was the state’s largest fire in its history, burning over 208,000 acres (84,200 hectares) and is a prime example of a high-elevation forest fire. The fire burned in forests extending to 12,000 feet (3,650 meters) and reached the upper tree line of the Rocky Mountains.
We found that rising temperatures in the past 34 years have helped to extend the fire territory in the West to an additional 31,470 square miles (81,500 square kilometers) of high-elevation forests. That means a staggering 11% of all Western U.S. forests – an area similar in size to South Carolina – are susceptible to fire now that weren’t three decades ago.
Can’t blame fire suppression here
In lower-elevation forests, several factors contribute to fire activity, including the presence of more people in wildland areas and a history of fire suppression.
In the early 1900s, Congress commissioned the U.S. Forest Service to manage forest fires, which resulted in a focus on suppressing fires – a policy that continued through the 1970s. This caused flammable underbrush that would normally be cleared out by occasional natural blazes to accumulate. The increase in biomass in many lower elevation forests across the West has been associated with increases in high-severity fires and megafires. At the same time, climate warming has dried out forests in the Western U.S., making them more prone to large fires.
On average, fires have spread 826 feet (252 meters) higher into the mountains in recent decades, exposing an additional 31,400 square miles (81,500 square kilometers) of forests to fire. Mojtaba Sadegh, CC BY-ND
By focusing on high-elevation fires, in areas with little history of fire suppression, we can more clearly see the influence of climate change.
Most high-elevation forests haven’t been subjected to much fire suppression, logging or other human activities, and because trees at these high elevations are in wetter forests, they historically have long return intervals between fires, typically a century or more. Yet they experienced the highest rate of increase in fire activity in the past 34 years. We found that the increase is strongly correlated with the observed warming.
High mountain fires create new problems
High-elevation fires have implications for natural and human systems.
High mountains are natural water towers that normally provide a sustained source of water to millions of people in dry summer months in the Western U.S. The scars that wildfires leave behind – known as burn scars – affect how much snow can accumulate at high elevations. This can influence the timing, quality andquantity of water that reaches reservoirs and rivers downstream.
High-elevation fires also remove standing trees that act as anchor points that normally stabilize the snowpack, raising the risk of avalanches.
The loss of tree canopy also exposes mountain streams to the Sun, increasing water temperatures in the cold headwater streams. Increasing stream temperatures can harm fish and the larger wildlife and predators that rely on them.
Climate change is increasing fire risk in many regions across the globe, and studies show that this trend will continue as the planet warms. The increase in fires in the high mountains is another warning to the U.S. West and elsewhere of the risks ahead as the climate changes.
FromColorado Public Radio (Kate Perdoni) via KSUT Public Radio:
In the small Colorado village of San Francisco and its surrounding villages, the original acequias are still operational and are often maintained and used by descendants of the first settlers of present-day Colorado.
“We’re a land and water based people. I am a Chicana, I am a child of the corn. My parents were farmers,” said Junita Martinez, a parciante (water-rights holder) and irrigator on the San Francisco Acequia. Her husband, José, was born in San Francisco. José’s lineage goes back to the initial settlers of the community.
In this village, named after Saint Francis – the patron saint of animals and ecology – water is life.
“It gives us what we need to live. It grows our crops,” said Martinez.
The property’s main aceqiua, an offshoot of San Francisco Creek, begins in San Francisco canyon about four miles from their home, Martinez explained. Springs made of snow melt eventually pool into the small beginnings of the creek. This same stream widens further down the mountain, then diverts into ditches that reach into each field. An elegant system of hand, and now machine-dug waterways, feeds the whole landscape…
At over 8,000 feet in elevation, each of the nine local canyons provide a water source to surrounding Rio Culebra Watershed communities. Today, over 240 families irrigate more than 24,000 acres here, many using traditional acequia irrigation practices. These families grow traditional crops like corn, peas, potatoes, and beans adapted to the high altitude, dry climate, and short growing season…
San Pedro Acequia. The headgate of the second oldest acequia in Colorado. Photo by Devon G. Peña
Acequias require maintenance, community support and input, and increased education to maintain protections with changing times – and a changing climate. An acequia comisión is voted in by landowners each year, including a President, Treasurer, and Secretary. These elected officials work closely with the Mayordomo, or ditch rider, to keep track of water rights holders, schedule and facilitate water use, and decide how to divvy water in times of drought. Regardless of acreage, each landowner receives one vote.
“We get people from bigger cities, and they buy a huge ranch, and then they’re a little bit miffed and upset because their vote is only one vote – just like the gentleman with his little two acres,” Martinez said. “But it’s effective, and it’s survived almost 200 years. I think it’s worth saving.”
Historically, the community has ways of dealing with drought and water scarcity that envelope into part of the local tradition. When a year brings less snow, the community takes action.
“We have a very long tradition that works,” said Martinez. “We’re communal in the fact that the water has to be shared. If there’s not enough water, than our Mayordomo and our Comisión have to figure out who gets water.”
In times of drought, water might be limited to certain days per week, with each landowner receiving fewer turns.
FromThe Courthouse News Service (Samantha Hawkins):
A crippling drought — largely connected to climate change — is gripping the Western United States, affecting over 70 million people and around 40% of the U.S.
Large wildfires have already begun in Arizona, California and New Mexico. Lake Mead, a reservoir formed by the Hoover Dam, has sunk to its lowest level since it was filled, and fish disease and death rates are skyrocketing for the Yurok Tribe in the Klamath River Basin.
Farmers, scientists, tribal officials, foresters and other groups affected by the worsening drought testified at a House Natural Resources Subcommittee on Water, Oceans and Wildlife hearing on Tuesday, asking lawmakers for both short-term relief and long-term solutions from the worsening conditions.
“Unfortunately, federal investment in water infrastructure has simply not kept pace with the need,” said Democratic Representative Jared Huffman of California, chair of the subcommittee. “Over the past 40 years, the federal government’s share of water infrastructure investment has fallen from 63% of total capital spending to just 9% in recent years.”
Amy Cordalis, a representative of the Yurok Tribe, told lawmakers that within the next couple of months, hundreds of homes will be without drinking water because the streams that feed their municipal systems are expected to run dry.
The states that rely on the Colorado River for water are also expected to have a water shortage: Arizona, California, Colorado, Nevada, Utah and Wyoming.
“The past 20 years have convinced us that less and less Colorado River water will be available to distribute as temperatures continue to warm — that we must make do with less,” said John Entsminger, general manager of the Southern Nevada Water Authority.
Entsminger said that there’s an immediate need for federal assistance to create large-scale projects to recycle and reuse water on the Colorado River…
Witnesses also spoke of the need for active forest management to thin overcrowded forests to ensure that the remaining healthy trees have access to the limited water, so that forests are better able to withstand wildfires, pests and droughts…
Meanwhile, Elizabeth Klein, senior counselor to the secretary of the Department of the Interior, told lawmakers that the White House created the Drought Relief Working Group last month to identify financial and technical assistance for irrigators and tribes.
Klein also said that the U.S. Fish and Wildlife Service is working to ensure water supplies remain available, and the Interior Department’s Bureau of Reclamation has announced over $40 million in grants to develop water efficiency projects.
From the Steamboat Pilot & Today (Dylan Anderson):
There are two spots on Mount Werner that Erin Light looks at each spring to get a rough estimate about when the Yampa River may see peak stream flow.
“A lot of times, it is very close. When those two spots come together, it is probably within a day or two that it will peak,” said Light, the regional division engineer for the Colorado Division of Water Resources. “Looking at the Steamboat (stream flow) gauge, I would say we are probably done.”
Stream flows for the Elk and Yampa rivers likely have already peaked, Light said, pointing to high flow marks Friday and Sunday. It is possible this isn’t the peak, as a spring storm could bolster water levels, but Light said it seems unlikely that is the case this year…
…ranchers in the county are preparing for the worst, irrigating earlier than normal and contemplating taking measures like bringing livestock water in tanks and even selling off part of their herd, because they don’t have enough pasture land with water flowing through it to raise them all…
There is more water flowing out of Stagecoach right now than going in, which happens every year but rarely this early. There are already calls on various ditches in the Yampa Valley, and Light said she expects more.
Light is relatively confident there will be a call on the Elk River, which has happened almost every year since 2012. As for the Yampa, it could be different, as the Colorado River District has a $50,000 grant for strategic releases to hopefully avoid a call on the river. Without that, a call would almost be certain, Light said…
Yampa River flows below Stafford Ditch May 2021. Photo credit: Scott Hummer
The upper basin is particularly tough right now, said Hagenbuch, who is the director and agricultural agent for the Routt County CSU Extension Office. He said he hopes return flows from irrigation will boost water levels in the coming weeks, but he doesn’t have an optimistic outlook…
[Kelly] Romero-Heaney said there is enough water to support municipal customers in town, but the more they use, the less there is in Fish Creek, which is an important spawning stream for mountain whitefish. She said she hopes Steamboat residents minimize outdoor watering to take some pressure off the resource.
The unanimous passing of Resolution 43-21 approved a United States Department of Agriculture (USDA) Loan Resolution for a project that will update the Glacier Creek Water Pre-Treatment Plant which was built in 1970. Presently, Estes Park, acting by and through its Water Activity Enterprise, provides drinking water service to most of the Estes Valley through the Glacier Creek and Mary’s Lake water treatment plants.
In 2018, The Colorado Department of Public Health and Environment’s (CDPHE) Disinfection Outreach and Verification Evaluation (DOVE) inspection resulted in the Glacier Creek Water Treatment Plant which was built in 1970 being de-rated from a ‘conventional’ plant to a ‘direct filtration’. Meaning the plant can no longer meet drinking water regulatory requirements.
According to Utilities Director Rueben Bergsten and Town Attorney Dan Kramer, the resolution will allow for the rebuilding of the existing pretreatment process to restore the conventional plant rating and bring the plant back into compliance under all operating conditions.
The improvements consist of a new pretreatment building with a rapid mix basin, flocculation, sedimentation with plate settlers, and supporting ancillary systems. The USDA will finance the total cost of the completed project with a guaranteed $7,675,000 loan at 1.375 percent interest rate over 40 years in addition to a $2,369,000 grant.
The Centers for Disease Control and Prevention (CDC) and the Agency for Toxic Substances and Disease Registry (ATSDR) have released the initial results of exposure assessments conducted in communities near current or former military bases known to have had per- and polyfluoroalkyl substances (PFAS) in their drinking water.
Individuals who participated in the assessments provided blood and urine samples to CDC and ATSDR for analysis. The assessment focused on El Paso County near Peterson Air Force Base, in the Fountain Valley and Security-Widefield areas.
The assessments measured the levels of three specific PFAS chemicals in 346 residents’ bodies: PFOS, PFHxS, and PFOA, and found levels higher than in the general U.S. population, as measured by National Health and Nutrition Examination Survey (NHANES). Most people in the United States have been exposed to PFAS and have PFAS in their blood…
Results of the 2020 PFAS exposure assessment in El Paso County. Courtesy Centers for Disease Control and Prevention and the Agency for Toxic Substances and Disease Registry
While levels of PFOA and PFOS chemicals were only slightly higher than the general population, levels of PFHxS in El Paso County residents were higher than any other population surveyed, except the people who manufactured the chemicals in Alabama. “What we’ve been fighting for, for five years, is identifying how contaminated we are from the toxic firefighting foam, the PFHxS,” said Rosenbaum. “We are highly contaminated in El Paso County.”
The most recent results from the CDC and ATSDR were presented alongside results from the 2018 and 2019 PFAS Aware study conducted by the Colorado School of Public Health, and showed a slight decrease in PFAS levels overall. “[PFAS Aware] did a 200 person blood study and then a final 50,” said Rosenbaum. “I was in the 200 and the final 50, and my levels dropped from 19 [micrograms per liter, μg/L] to 12 [μg/L]. You can see just how high we are from 2019, and it’s dropping a little by 2020, because as we’re not drinking this water, it’s not bio-accumulating in our system. What’s been in our system is slowly filtering out as we go to the bathroom.”
Stagecoarch Reservoir outflow June 23, 2019. Photo credit: Scott Hummer
Here’s the release from Colorado Parks & Wildlife (Travis Duncan):
Due to critically low water flow caused by dry conditions and minimal snowpack levels, Colorado Parks and Wildlife (CPW) will implement a mandatory fishing closure on a 0.6-mile stretch of the Yampa River between the dam at Stagecoach State Park downstream to the lowermost park boundary.
The closure begins May 25 and will continue until further notice.
“Should the flow rate increase substantially for a continuous period of time, CPW will re-evaluate the emergency fishing closure,” said CPW Senior Aquatic Biologist Lori Martin. “But because of the current conditions, we need to take this course of action now.”
CPW works closely with the Upper Yampa Water Conservancy District (UYWCD), who owns and operates Stagecoach Reservoir, to stay informed on reservoir releases and monitor drought conditions. UYWCD is finalizing a contract with the Colorado Water Trust for environmental releases later in the year.
“Timing (environmental releases) is critical to the health of the river system,” said UYWCD General Manager Andy Rossi. “We manage the reservoir and collaborate with our partners to ensure that water is available and legal mechanisms are in place to release water when the river needs it most. Unfortunately, flows are already low, but hot and dry summer months are still to come,” said Rossi.
Water releases are currently only at 20% of average, and will be dropping to less than 15% of average for this time period. When water flows are minimal, fish become concentrated in residual pool habitat and become stressed due to increased competition for food resources. The fish become much easier targets for anglers, an added stressor that can result in increased hooking mortality.
“We are trying to be as proactive as possible to protect the outstanding catch-and-release fishery we have downstream of Stagecoach Reservoir,” said CPW Area Aquatic Biologist Bill Atkinson. “This stretch of the river receives a tremendous amount of fishing pressure, especially in the spring when other resources might not be as accessible. This emergency closure is an effort to protect the resource by giving the fish a bit of a reprieve as they can become quite stressed during these extreme low-flow conditions. This spring we have not witnessed a spike in flows, which can offer fish protection and allow them to recoup energy following the spring spawn season.”
CPW advises anglers to find alternative areas to fish until the order is rescinded. Many other local areas will become more fishable soon as runoff tapers down. Several area lakes are also opening and should be fishing well.
CPW asks for cooperation from anglers, who should be aware the mandatory fishing closure will be enforced by law with citations issued for anyone violating the order.
Wildlife officials warn when a fish population is significantly affected by low stream flows or other unfavorable environmental conditions, it could take several years for it to fully recover if not protected. Given the extreme drought conditions we are currently faced with, other stretches of river in this area may be subject to additional closures this season.
Like many rivers and streams in western Colorado, the Yampa River offers world-class fishing and attracts thousands of anglers each year, providing a source of income to local businesses that depend on outdoor recreation.
“We ask for the public’s patience and cooperation,” said Stagecoach State Park Manager Craig Preston. “It is very important that we do what we can to protect this unique fishery, not only for anglers, but for the communities that depend on the tourism these resources support.”
For more information, contact Stagecoach State Park at 970-736-2436, or CPW’s Steamboat Springs office at 970-870-2197.
Upper Yampa River Water Commissioner, Scott Hummer, sent these photos via email this morning to show the conditions above Stagecoach Reservoir. He writes, “Not much water being produced in the Yampa headwaters in South Routt County. Photo of inflow at Stagecoach Inlet yesterday = 10 CFS / 9% of the historic iflow rate! This morning [May 25, 2021] Stagecoach inflow = 7.9 CFS! The photos depict the story in the upper Yampa…”
Yampa River below Oakton Ditch above Phippsburg May 2021. Photo credit: Scott Hummer
Yampa River at Stagecoach Res Inlet 10 CFS 5-24-21 May 2021. Photo credit: Scott Hummer
Yampa River at Phippsburg May 2021. Photo credit: Scott Hummer
Yampa River flows below Stafford Ditch May 2021. Photo credit: Scott Hummer
Stafford Ditch – Check Dam May 2021. Photo credit: Scott Hummer
The eight major river basins, plus the Denver metro area, are shown on this map from the South Platte River Basin Roundtable. Each basin has its own roundtable, made up of volunteers, to address local water issues. Credit: Colorado Water Conservation Board
The state water board is encouraging all nine basin roundtables to adopt a code of conduct requiring members to communicate in a professional, respectful, truthful and courteous way. But some Western Slope roundtables are pushing back.
Over roughly the last month, Colorado Water Conservation Board Director Rebecca Mitchell has been visiting the remote roundtable meetings on Zoom, answering questions about the code of conduct and urging the roundtables to adopt it. The goal of the document is to make sure everyone feels comfortable speaking up in meetings.
Mitchell said that with important and potentially contentious discussions on the horizon for water-short Colorado, it’s important to have a set of conduct standards in place to guide those discussions.
Gunnison River Basin Roundtable member Bill Nesbitt said at the May meeting it was a “third-grade sandbox question.” Mitchell agreed.
“I think it is similar to a third-grade sandbox, but not every sandbox is fair and some kids throw sand in other kids’ eyes,” Mitchell said. “We need to make the message clear about the expectations as we move forward to some of those really difficult discussions.”
Some members of the Southwest Basin Roundtable welcomed the code of conduct.
“I support adopting a policy,” said Mely Whiting, environmental representative and legal counsel for Trout Unlimited. “I think that things do get more and more controversial as we move forward. In my experience on this roundtable, in recent times things have gotten a little bit out of hand and quite a bit more aggressive. I’ve been, myself, uncomfortable quite often.”
The Colorado legislature created the nine basin roundtables — South Platte, Metro, Arkansas, Rio Grande, San Juan/Dolores (collectively known as Southwest) Gunnison, Colorado, Yampa/White/Green and North Platte — in 2005 to encourage locally driven collaborative solutions on water issues. They represent each of the state’s eight major river basins, plus the Denver metro area, and are made up of volunteers from different water sectors like agriculture, environment, recreation and municipal.
In addition to asking members to promote an inclusive environment that treats everyone fairly, the code also lays out best practices for conducting business. According to the code, the roundtables have the responsibility for noticing meetings, adhering to federal and state laws and public health orders and performing job tasks promptly and effectively.
Members at both the Southwest and Gunnison roundtables had issues with the best practices section. Montezuma County representative Ed Millard said the best practices section seemed more relevant to employees of the Division of Water Resources, not a volunteer board.
“I just think it’s going to have to be tuned to a volunteer organization before we adopt it,” he said at the April Southwest Roundtable meeting. “We certainly do need to resolve the tension and friction, but I don’t think adoption of (an) employee code is the way to do that.”
Southwest adopted the rest of the code of conduct, minus this best practices part at its May meeting. In the Gunnison basin, a motion to adopt the code of conduct failed; the discussion has been tabled until the July meeting.
Roundtable member Michael Murphy, who represents Hinsdale County, said the group already holds their meetings with respect and that the code was unnecessary.
“We are western Colorado. We don’t like being told what to do,” he said at the May Gunnison Basin Roundtable meeting.
The Colorado Water Conservation Board is hoping the nine basin roundtables adopt their code of conduct. From left, back row: Steve Anderson, Dan Gibbs, Kevin Rein, Jim Yahn, Heather Dutton, Russell George, Curran Trick, Greg Felt; front row: Jessica Brody, Gail Schwartz, Celene Hawkins, Jaclyn Brown, Becky Mitchell. CREDIT: HEATHER SACKETT/ASPEN JOURNALISM
While the code of conduct will be the policy of the Colorado Water Conservation Board, Mitchell admitted there was little the CWCB could do to enforce it on the roundtables, and the roundtables don’t have to adopt it.
“Being perfectly honest and transparent, enforcing a code of conduct on a volunteer roundtable is difficult,” she told the Southwest Roundtable. “(Enforcement) is as much a responsibility of me as a self-policing in the way we treat each other.”
Arkansas and Yampa/White/Green roundtables are aware of the code of conduct, but have not adopted it. The Rio Grande, South Platte and Metro basin roundtables have formally adopted it. The Colorado and North Platte basin roundtables have not discussed it yet.
This story ran in the May 24 editions of The Aspen Times and the Sky-Hi News.
Created by Imgur user Fejetlenfej , a geographer and GIS analyst with a ‘lifelong passion for beautiful maps,’ it highlights the massive expanse of river basins across the country – in particular, those which feed the Mississippi River, in pink.
The Arizona Legislature wants to look into the feasibility of pumping water from the Mississippi River to Arizona.
But the U.S. Bureau of Reclamation has already studied the idea, and weighed in on the project in 2012.
The agency studied factors such as cost, legal issues, power use and the amount of time the project would take.
A report estimated the project could cost up to $14 billion; the timetable was around 30 years.
“This is not a new idea. The concept of a massive pipeline to transport water from the Midwest into the Colorado River Basin, has been proposed in the past and evaluated, and the feasibility really isn’t there,” said Kim Mitchell of Western Resource Advocates…
Arizona still owes the federal government about a billion dollars for the Central Arizona Project, which pumps water from the Colorado River to the Phoenix and Tucson areas.
Middle and high school students from around Colorado competed May 15 and 16 in the 2021 FIBArk RunOff, a series of slalom and downriver races.
“The weekend of racing was a huge success, although water levels were lower than normal,” Alli Gober, FIBArk river events coordinator, said. “It’s always exciting to see younger paddlers stepping into the competition mind-set. Some of these young paddlers may go on to race internationally in the future, and it all starts here.”
From helping farmers keep an eye on their crops to capturing video footage for business marketing, Barn Owl Drone Services is working to take flight in Southeastern Colorado.
The business launched in August 2017 when Jaron Hinkley, his sister Sarah Hinkley and her husband, Brian Stafford, felt obligated to move “back home” to the La Junta area when their grandparents needed help due to medical issues…
Barn Owl Drone Services launched its drone and robotic services for farmers with the first drone in the air during the growing season of 2018. A fleet of seven drones helps the company’s five employees monitor crops and plant conditions.
On the robotics end the service uses “owl perches” which are artificial-intelligence supported weather stations, to detect insects and disease. The stations also can measure soil moisture and soil temperatures, to “help our farmers and to help reduce the use of resources like water,” Sarah said…
With hemp farmers the company offers male plant detection and removal. Although the company focuses on farmers, other clients from gravel pits and landfills to feed lots can benefit by having the drones keep tabs on volumes and supplies.
A Colorado Water Plan Scoping Workshop focusing on innovations in on-farm irrigation technology and water management.
About this event
This will be a two-hour, virtual (zoom) session facilitated by Colorado Water Conservation Board and the Irrigation Innovation Consortium (IIC). The focus of this session will be on bringing together knowledgeable stakeholders on innovations in on-farm irrigation technology and water management. The discussion will be centered around specific actions (e.g. programming, public policies, resources, research) to be included in the Colorado Water Plan Update.
Gathered around the campfire one evening during a rafting trip many years ago, the conversation was about classroom education of river guides. I remember it well almost 40 years later because I cracked a joke that got a round of laughter.
To make the educational experience complete, I said, somebody should throw a pail of cold water over those assembled to make it like a real river trip.
That memory was provoked by a recent visit to the Headwaters River Journey, a water-focused exhibit-slash-museum that occupies the ground floor of the Headwaters Center in Winter Park. It doesn’t leave you shivering like you just fell into a cold mountain stream. It does intend for visitors to gain an appreciation for mountain water and the consequences of its loss, in the case of the Fraser Valley to the benefit of metropolitan Denver.
Colorado has 25 ditches, tunnels, and other conveyances that ferry water over and through the Continental Divide, from the Western Slope where 80% of water originates, mostly in the form of snow, to the Front Range cities and the farms beyond, where 85% of Coloradans live. No place has been dewatered so severely as the Fraser Valley, where Winter Park is located.
Diversions that began in 1936 have resulted in 60% of the water from the Fraser Valley being diverted to metropolitan Denver. That percentage will increase to more than 80% if a long-contemplated project by Denver Water gets realized.
Headwaters River Journey seeks to deliver an appreciation for the natural environment of the Fraser and other mountain valleys and the cost to these ecosystems. It does so with an abundance of hands-on experiences.
One exhibit allows a literal hands-on demonstration of depletion of Jim Creek, one of the sources of metropolitan Denver’s water, as levels rise in Moffat Tunnel pipeline. Photo/Headwaters Center via The Mountain Town News
The hands-on learning is literal in an exhibit about Denver Water’s diversion from Jim Creek. The creek originates on the flanks of James Peak, across from the Winter Park ski area, meandering through a glacial-carved valley to a confluence with the Fraser River. Or, what’s left of the creek.
The exhibit has you lay hands on an operating wheel that is used to raise or lower a headgate at a diversion point. As you crank the red wheel, as if to divert water into a diversion ditch, a screen on the left shows water levels in the creek dropping. More cranks yet reveal cobbles, a creek nearly without its water. A panel on the right shows corresponding water levels rising in the water pipe in the Moffat Tunnel used by Denver to deliver water to South Boulder Creek, just one relatively minor hump away from Denver’s suburbs.
This was not news to me. I once lived in that valley, proudly wearing a “Dam the Denver Water Board” (as the water agency was formerly called) bumper sticker on my car. Now, I live on the receiving end of that water, in the Denver suburb of Arvada. Here, 78% of water for this city/suburb of 120,000 people comes through the Moffat Tunnel from Jim Creek and myriad other creeks in the Fraser Valley. More yet comes from the adjacent but far more remote Williams Fork Valley, two more tunnels away.
The plumbing before the water arrives at my garden hose is vast, complex, and expensive. The legal system for administration of Colorado’s water may be more byzantine yet.
Headwaters doesn’t dive deep on the history, legal system, or the plumbing. It’s more like a chapter in Colorado Water 101. It is geared to someone who knows relatively little about water.
Still, someone like myself, who has written about Colorado water off and on for more than 40 years, the exhibits can fill in gaps. One of my gaps is biology. One exhibit showed the life stages of stoneflies, an important component of the aquatic ecosystem. Through an interactive exhibit, I swam along a river bottom somewhat like a trout might, looking for food.
Another interactive experience allowed me to flap my arms as if a condor, flying over the geography from Berthoud Pass northward to Longs Peak and west along the Rabbit Ears Range. If a museum can be this much fun for an older guy, I wonder what it would be like to be a 10-year-old.
My companion, Cathy, was most touched by two exhibits that triggered her memories of living for almost 30 years in a very small mountain town in a house above the confluence of a creek and river.
One was a line of the life to be found along a mountain creek, from the bugs to the four-legged critters. She says it was a lovely reminder of “all the friends that I miss” now that she lives, sometimes with regret, a citified life.
The other was a wall-sized video immersion at the beginning of the exhibit that shows the changing of the seasons from one vantage point of a mountain slope. As the snow fell, there was a whoosh of chilled air. As the snow melted, there was the sound of water drops falling.
Colorado’s population has grown rapidly since the early 20th century, as the Headwaters Center exhibit graphically points out. Photo/Allen Best
The exhibit is the creation of Bob and Suzanne Fanch, owners for the last 20 years of the 6,000-acre Devil’s Thumb Ranch, which is 7 or 8 miles down the valley —and, perhaps not incidentally, just below some of Denver Water’s diversions on Ranch Creek. It’s one of the nation’s most high-end cross-country ski destinations.
Kirk Klancke, a neighbor of the Fanches on Ranch Creek and an active member of Trout Unlimited and other water-related causes, describes himself as a technical advisor.
The Fanches, he explains, got the bug for interactive exhibits after visiting a museum in Iceland. “What a great educational tool, and the Fanches have always been interested in the future of the Fraser River,” he says.
The vision was distilled by Suzanne, he says, in a discussion. She took the message from a Trout Unlimited movie about the plight of the river that was called “Tapped Out.” A Boulder couple, Chip and Jill Isenhart, who have a company called ECOS Communications, designed the exhibits.
“We are natural history and environmental storytellers, and our team of content experts and designers has been doing this for more than 30 years in Colorado,” says Chip Isenhart.
“Our passion is partnering with mission-driven clients like the Fanches, and they have done an amazing job creating a world-class exhibit in Grand County.”
Isenhart says the primary task in creating the exhibit was to connect the dots between the Fraser River and the Front Range residential water use. To do this, he and his team needed to see the story through the eyes of the locals.
“We would go out on the river with Kirk Klancke, and folks from CPW, and meet frustrated anglers due to fishing closures at 1 p.m. due to river temperatures being so high from the lack of water,” says Isenhart. “And at the same time we also got to work closely with Front Range water interests to make sure our story was balanced. That was very, very important to ECOS and the Fanches and Trout Unlimited, as this issue is beyond complicated. It’s actually fairly easy to paint a picture that’s more sensational than accurate.”
Once ECOS had the essentials of the story figured out, they set out to create a variety of fun, changeable, and—they hoped—memorable interactive experiences to tell that story.
One of my memories is of the bathroom stall. No opportunity for educational storytelling was missed.
See Headwaters River Journey for hours and location. Photo credit: Allen Best/The Mountain Town News
The take-home message of Headwaters River Journey is about personal responsibility.
“It’s taking the knowledge you’ve learned and actually making a difference using that knowledge and being a participant, rather than a spectator,” says Klancke. “That is what this museum is designed to do.”
The ideal audience would be somebody who lives in metropolitan Denver, a beneficiary of the exported water, or more broadly somebody from the Front Range. As such, it might better be located in Golden, for example, or even along the Platte River near downtown Denver. It was located in Winter Park, at least in part, because the municipality provided the 6 acres of land. Plus, there is an additional benefit. Immediately outside the backdoor of the exhibit is an illustration of beavers, willows and a braided mountain river.
But Isenhart says the exhibit can have value for remote learning, especially for classrooms along the Front Range. “That’s hopefully one of the next steps,” he reports.
I had intended to visit the exhibit in March 2020, on the way back to Denver after a trip to Craig. I was a bit late, and hence the curtain of covid descended the next week. My trip was delayed by 13 months.
It was worth the wait, though. Headwaters River Journey exceeded my expectations. And I’d go back again for a refresher.
This is from Big Pivots, an e-journal that tracks the energy and water transitions in Colorado and beyond. To get copies, go to http://BigPivots.com.
Recent rainfall has been a boon for eastern Colorado. The Front Range has enjoyed abundant precipitation and nearly half of the state’s geographic area has shed drought conditions, according to the U.S. Drought Monitor.
But the Western Slope hasn’t been blessed with the same precipitation levels, leaving a brutal drought and a high risk for fire to worry about.
Assistant state climatologist Becky Bolinger said it’s typical for conditions on one side of the Continental Divide to differ from the other. And western Colorado usually gets more precipitation than the east because of the jet stream…
Bolinger predicts snowpack to the west will melt by the end of the month…
Outlooks from the Climate Prediction Center suggest Colorado is headed for another hot and dry summer. On average, June is the driest time of year for southwest Colorado, where relief won’t come until the onset of the summer monsoon season. Bolinger said thunderstorms can pop up anywhere, even in dry conditions, that could provide some relief.
The latest report from the National Drought Mitigation Center shows that 48 percent of Colorado has shifted to drought-free or abnormally dry conditions since the start of the year. In January, all of the state was in some level of drought, with 77 percent in extreme or exceptional drought – the two worst categories.
Improvements – at least for eastern Colorado – began in mid-March as significant snow brought the first hints of relief. During May, thunderstorms have continued to bring rain to the state’s eastern plains, resulting in drought-free conditions for most northeast counties, with much of the southeast moving to abnormally dry, a step below moderate drought.
The first drought-free area in Colorado since mid-2020 appeared in late April.
Colorado Drought Monitor map May 18, 2021.
Over the past reporting period, between one-half and three inches of rain have fallen across the region, with storms producing higher amounts in localized areas.
Western Colorado continues to be dominated by extreme and exceptional drought. Portions of Moffat, Garfield and Rio Blanco counties have even seen conditions further degrade over the past few months, moving from extreme drought into exceptional.
Over the past week, nearly all of the eastern half of the state which had not already shifted to drought-free condition showed at least one category of improvement. Portions of El Paso, Elbert and Lincoln counties remained in moderate conditions, while southern Las Animas County saw severe drought shrink, though a strip remains along the border with New Mexico.
Southern Baca County saw two levels of category improvement, moving from severe to abnormally dry conditions. Much of central Huerfano, southern Pueblo and far north Las Animas counties also shifted by two categories, moving from moderate drought to drought-free. A remaining area of extreme drought in Las Animas County moved to severe conditions.
Colorado Drought Monitor one week change map ending May 18, 2021.
Kiowa County has seen a particularly dramatic improvement since the start of the year. At that time, the bulk of the county was in extreme drought, with a persistent bullseye of exceptional conditions covering the central part of the county for months. With the most recent report, western and eastern Kiowa County are abnormally dry, with the central area in moderate drought, dropping from severe last week.
Overall, 23 percent of the state is drought-free, up from 13 percent last week, with an additional 25 percent in abnormally dry conditions, up from 12 percent in the previous week. Moderate drought covered 13 percent of Colorado, down from 32 percent, while severe drought dropped from 14 to 10 percent. Extreme and exceptional drought were unchanged at 13 and 16 percent, respectively.
La Niña conditions have ended and NOAA forecasters estimate about a 67% chance that neutral conditions will continue through the summer. The ENSO forecast for the fall is less confident, with odds of a second-year La Niña currently hovering around 50–55%.
Spring cleaning
If you’ve been paying very close attention to the surface temperature of the tropical Pacific Ocean (and really, who doesn’t?!) you may have noticed that the April 2021 Niño 3.4 Index, at 0.75°C below average, still exceeds the La Niña threshold of 0.5°C below average. This is according to ERSSTv5, our primary sea surface temperature dataset.
Monthly sea surface temperature in the Niño 3.4 region of the tropical Pacific for 2020-21 (purple line) and all other years starting from first-year La Niña winters since 1950. Graph by Emily Becker based on ERSSTv5 temperature data.
By the way, “average” is now calculated over 1991–2020. Check out the second half of this post for more on what that means for measuring ENSO, and this climate.gov post by our esteemed editor for what it means as far as US climate.
April 2021 sea surface temperature departure from the 1981-2010 average (note that this image still uses the previous averaging period). Image from Data Snapshots on Climate.gov.
However, as we know from long experience, ENSO (El Niño/Southern Oscillation) is more than just the ocean surface temperature anomaly (the difference from the long-term mean). The atmospheric component is just as important, as it serves to reinforce the surface temperature anomaly and transmit ENSO’s impacts across the globe. Over the past few weeks, atmospheric conditions over the tropical Pacific no longer resemble the strengthened Walker circulation pattern that we expect during La Niña.
That strengthened Walker circulation is characterized by reduced rain and clouds over the central Pacific and more over the far western Pacific and Indonesia. This pattern was evident for the past several months, especially the drier-than-average region over the central tropical Pacific, but has dissipated as of early April.
Outgoing long-wave radiation anomalies for the past year. Regions with more clouds and rain than average are shown in purple; areas with fewer clouds and less rain are shown in orange. Each row in this type of image is the departure from average (1974-2020) at that time. The drier-than-average signature of La Niña in the central tropical Pacific is visible as the large orange area that ends in April 2021. NOAA Climate.gov image, based on data provided by the Climate Prediction Center.
Other signifiers, such as stronger-than-average trade winds, have also diminished across most of the Pacific Ocean in the past month. The Southern Oscillation Index and Equatorial Southern Oscillation Index, both of which measure the atmospheric component of ENSO (more details here), are also indicating neutral conditions. Hence, the ENSO forecast team has concluded that La Niña is over, despite the sea surface temperature anomaly.
A sea surface temperature anomaly of -0.5°C (or, in the case of El Niño, +0.5°C) isn’t a magic switch that causes an instant atmospheric reaction, as we’ve seen many times before. For example, a couple of months preceding the last El Niño featured sea surface temperature anomalies near or slightly exceeding the thresholds, but a coherent atmospheric response didn’t kick in right away. The atmosphere-ocean system is vastly complicated, of course, and there are always many different things going on at once, so a delayed response isn’t surprising. As an atmospheric scientist, I’d actually be very surprised if the atmosphere coupling occurred immediately upon crossing the ENSO threshold!
Finally, the water below the surface of the tropical Pacific is warmer than average and a downwelling Kelvin wave is moving eastward under the surface. This means that there are limited sources of cooler-than-average water to replenish the surface over the next few months, adding some confidence that La Niña is done… for now.
Springboard
What everyone would like to know, of course, is what will happen ENSO-wise later in the year, following the neutral conditions that are likely to remain through the summer. ENSO has a strong relationship with the Atlantic hurricane season (June–November), with El Niño tending to lead to a reduced number of tropical storms and hurricanes, and La Niña tending to enhance the season. Last year’s extremely active Atlantic hurricane season was influenced by La Niña, so of course we’d like to get an idea of what’s ahead.
Let’s start with the easier case—chances that El Niño will develop are low, hovering around 8%. El Niño has developed following a first-year La Niña in the past, but we’ve only seen that happen twice since 1950, and most of the computer models give the development of El Niño similarly low odds.
Climate model forecasts for the Niño3.4 Index. Dynamical model data (black line) from the North American Multi-Model Ensemble (NMME): darker gray envelope shows the range of 68% of all model forecasts; lighter gray shows the range of 95% of all model forecasts. NOAA Climate.gov image from University of Miami data.
A substantial amount of warmer-than-average subsurface water in the spring can sometimes give an early heads-up that El Niño is on the way, but this April’s average of 0.6°C is not particularly high, ranking 12th out of the 43 years we have on record. The February–April 2021 average is just about zero. Other springs with a similar value have been followed by El Niño, La Niña, or neutral in the subsequent fall. Our guest blogger Aaron Levine discussed springtime ENSO prediction—head over there for more details. So, to sum up: small chance of El Niño.
The Warm Water Volume anomaly during February-April compared against Niño-3.4 sea surface temperature (SST) during the following November-January. The La Niña years are colored in blue, the El Niño years in red, and ENSO-Neutral years in black. Large negative values of Warm Water Volume anomalies almost always lead to a La Niña event. However, large positive Warm Water Volume anomalies do not lead to El El Niño events. For SST data, OISST is used. Warm Water Volume comes from the PMEL analysis (http://www.pmel.noaa.gov/elnino/upper-ocean-heat-content-and-enso). Figure provided by Aaron Levine and modified by Climate.gov.
The likelihood of La Niña versus neutral after the summer is less clear. Many of the computer models are suggesting that we may see a second-year La Niña, a common occurrence in the historical record (and a topic that Nat will be covering in his post later this month). However, the spring predictability barrier—forecasts made in the spring tend to be less skillful than forecasts made in other times of the year—is still in effect for May predictions, reducing the confidence in forecasts for the fall and winter.
Editor’s note from R.L.: I’ve added this image without Emily’s express permission…because it’s a cartoon, and who doesn’t like a cartoon? Illustration by Emily Greenhalgh, NOAA Climate.gov.
Currently, forecasters estimate the chance of La Niña during August-October, the heart of the hurricane season, at 42%, which is slightly lower than the 50% chance of neutral.
There are other factors at play in the hurricane season besides ENSO, including Atlantic Ocean temperatures. NOAA’s team is hard at work on the 2021 outlook, which will be released on May 20th.
Declining levels at the second-largest reservoir in the U.S. have spurred officials in Colorado, Utah, Wyoming, and New Mexico to search for ways to prop it up.
Lake Powell on the Colorado River is dropping rapidly amid one of the southwestern watershed’s driest years on record. It’s currently forecast to be at 29% of capacity by the end of September — the lowest level since the reservoir first started filling in 1963. Its sister reservoir downstream on the Colorado River, Lake Mead, is also approaching a record low this year.
The amount of water flowing to Lake Powell since October has been less than what the river delivered during the same period in 2002, the driest year on record. Total reservoir storage in the Colorado River basin is projected to be at 39% of capacity by the end of September.
Current Upper Colorado River Basin Reservoir Status May 12, 2021 via the USBR.
Federal projections for the reservoir are prompting water officials to begin strategizing ways to keep Lake Powell from declining to a level where hydroelectric power generation is not possible. In a statement, the Upper Colorado River Commission announced it will begin developing a drought response operations plan, a measure outlined in a 2019 agreement. Earlier this year the reservoir’s declining level triggered monthly calls among the Upper Basin states and mandated a wider range of modeling.
Rows of recent planted of young pine trees. Photo via the University of Michigan
Here’s the release from the University of Michigan (Jim Erickson):
Some climate activists advocate large-scale tree-planting campaigns in forests around the world to suck up heat-trapping carbon dioxide and help rein in climate change.
But in a Perspectives article scheduled for publication May 21 in the journal Science, a University of Michigan climate scientist and his University of Arizona colleague say the idea of planting trees as a substitute for the direct reduction of greenhouse gas emissions could be a pipe dream.
“We can’t plant our way out of the climate crisis,” said Arizona’s David Breshears, a top expert on tree mortality and forest die-off in the West. His co-author is Jonathan Overpeck, dean of the U-M School for Environment and Sustainability and an expert on paleoclimate and climate-vegetation interactions.
Instead of wasting money by planting lots of trees in a way that is destined to fail, it makes more sense to focus on keeping existing forests healthy so they can continue to act as carbon “sinks,” removing carbon from the atmosphere through photosynthesis and storing it in trees and soils, according to the researchers. At the same time, emissions must be reduced as much as possible, as quickly as possible.
Overpeck and Breshears say they hope the role of the world’s forests—and specifically the urgent need to protect existing forests and keep them intact—is thoroughly debated when the world’s climate action leaders gather at the COP26 climate change conference in Glasgow this November.
“Policymakers need to enable new science, policy and finance mechanisms optimized for the disturbance and vegetation change that is unstoppable, and also to ensure that the trees and forests we wish to plant or preserve for the carbon they sequester survive in the face of climate change and other human threats,” Overpeck and Breshears wrote.
“Failure to meet this challenge will mean that large terrestrial stores of carbon will be lost to the atmosphere, accelerating climate change and the impacts on vegetation that threaten many more of the ecosystem services on which humans depend.”
Keeping forests healthy will require a new approach to forest management, one that Overpeck and Breshears call managing for change. As a first step, policymakers and land managers need to acknowledge that additional large-scale vegetation changes are inevitable.
Climate change has been implicated in record-setting wildfires in the western United States, Australia and elsewhere, as well as extensive tree die-offs that are largely due to hotter, drier climate extremes. Those disturbing trends are expected to accelerate as the climate warms, according to Overpeck and Breshears.
“Even in a world where climate change is soon halted, global temperature rise will likely reach between 1.5 and 2 C above pre-industrial levels, with all the associated extreme heat waves that brings, and thus global vegetation will face up to double the climate change already experienced,” they wrote.
At the same time, deforestation continues to expand globally and is especially damaging in tropical forests, which hold vast amounts of biodiversity and sequestered carbon.
The next step toward a new managing-for-change paradigm is to manage forests proactively for the vegetation changes that can be anticipated—instead of trying to maintain forests as they were in the 20th century, Overpeck and Breshears say.
Managing for change means, for example, more aggressive thinning of forests to reduce the buildup of fuels that stoke massive wildfires. It also means selectively replacing some trees—after a wildfire, for example—that are no longer in optimal climate zones with new species that will thrive now and in coming decades.
Such activities, where needed, will inevitably increase the costs of forest management, according to the researchers. But such costs should be considered a prudent investment, one that helps preserve an underappreciated service that forests provide to humanity for free: carbon storage, also known as carbon sequestration.
Forests are already managed to preserve the natural resources and ecosystem services they provide. In addition to supplying timber, fuelwood, fiber and other products, forests clean the air, filter the water, and help control erosion and flooding. They preserve biodiversity and promote soil formation and nutrient cycling, while offering recreational opportunities such as hiking, camping, fishing and hunting.
Carbon sequestration should rank high on the list of invaluable services that forests provide, and efforts to preserve and enhance this vital function should be funded accordingly, Overpeck and Breshears say.
For example, there’s a big opportunity to improve the ability of forests to store carbon through increased use of biochar, a form of charcoal produced by exposing organic waste matter—such as wood chips, crop residue or manure—to heat in a low-oxygen environment. Large amounts of wood generated during forest thinning projects could be converted to biochar, then added to forest soils to improve their health and increase the amount of carbon that is locked away, Overpeck says.
“Thinning of forests, conversion of the removed wood to biochar and burial of the biochar in forest soils is a way to bring new jobs to forested rural areas while allowing forests to play a bigger role in keeping carbon out of the atmosphere and thus fighting climate change,” he said. “Forest carbon management could be a boon for rural areas in need of new economic engines.”
In the long run, such projects are likely to benefit forests and enhance their ability to store carbon far more than massive tree-planting campaigns conducted without appropriate management strategies, according to Overpeck and Breshears.
“Tree-planting has great appeal to some climate activists because it is easy and not that expensive,” Breshears said. “But it’s like bailing water with a big hole in the bucket: While adding more trees can help slow ongoing warming, we’re simultaneously losing trees because of that ongoing warming.”
In their Perspectives article, Overpeck and Breshears explore the implications of a new study by Ondřej Mottl et al., also scheduled for publication May 21 in Science, titled “Global acceleration in rates of vegetation change over the past 18,000 years.”
In a photo from 2020, a distinct line around the rocky shore shows how much the water level has decreased in Nevada’s Lake Mead. Mead is expected to drop 15 feet in 2021 Photo credit: Roberto (Bear) Guerra/High Country News
Opinion: The latest forecast suggests for the first time that Lake Mead could fall into a Tier 2 shortage by 2023, thrusting even deeper water cuts on Arizona.
Lake Mead’s water levels are heading the wrong way and going there alarmingly fast.
If the forecast holds, it’s now likely that we will fall into a more severe Tier 2 shortage by 2023, spreading painful cuts to even more water users in Arizona.
That nugget of bad news comes from the U.S. Bureau of Reclamation’s 24-month study, which is updated each month to predict reservoir conditions for the next two years. In April, the projection was that Lake Mead – the reservoir that provides nearly 40% of Arizona’s water – would most certainly be in a Tier 1 shortage in 2022 but would miss the Tier 2 cutoff for 2023 by three-tenths of a foot.
Now, in May, the most likely projection is that Lake Mead will end 2022 at 1,048.83 feet of elevation – more than a foot past the trigger to put us in Tier 2.
We’re hot, dry and low – a volatile mix
The good news (if you can call it that) is that the predictions didn’t change nearly as rapidly from April to May as they did from March to April. Projected lake levels for December 2022 dropped last month by about 5 feet, thanks to horribly anemic and earlier-than-expected runoff.
It’s also worth noting that if we didn’t have the Drought Contingency Plan (DCP) in place to conserve water, we would already be in this shape. That agreement didn’t solve our problems, but it has bought us time and certainty as deeper cuts play out – which is exactly what it was intended to do.
West Drought Monitor map May 18, 2021.
That said, we’re still hot and dry, with more than half of the Colorado River basin now in extreme drought, the most severe category. Unless that trajectory changes, the forecast is probably not going to get much better.
And, even worse, we’re getting down into the V-shaped part of Lake Mead, meaning it takes a loss of less water to drop lake levels than it once did. Losing smaller volumes of water can have bigger impacts.
Which is why there’s also a 1 in 4 chance that we could fall into a Tier 3 shortage by 2025 – the worst-case scenario spelled out under DCP and one that would much more heavily impact metro Phoenix cities.
How a Tier 2 shortage could play out
But a Tier 2 shortage in 2023 wouldn’t be a walk in the park. Technically, there are two levels of Tier 2 shortage for Arizona – a Tier 2a that’s triggered at 1,050 feet of elevation on Lake Mead and a Tier 2b that would occur at 1,045 feet.
It’s a small variance in elevation, but it would increase required cuts statewide, from 592,000 to 640,000 acre-feet, and decimate Central Arizona Project’s Non-Indian Agriculture (NIA) pool, which despite its name mostly supplies tribes and cities.
Luckily, Arizona’s DCP implementation plan includes water to temporarily mitigate the impact of those cuts. But the amount replenished in 2023 would fall from 75% to 50% in a Tier 2b shortage. That will still be painful, particularly for metro Phoenix cities that use NIA water to serve a few existing customers.
The May projection is already within about 3 feet of reaching a Tier 2b shortage. And let me underline that – we’re talking about the most probable projection. Not the best or worst case, but the most likely.
We’ve planned for this, but it’ll still hurt
We’re also less than 20 feet from triggering what might be called the doomsday provision within DCP.
If the lake is projected to fall below 1,030 feet any time within two years, Arizona, California and Nevada must reconvene to decide what additional steps they will take to keep Mead from falling below 1,020 feet – an elevation that many consider the crash point. The next milestone below that is “dead pool,” where no water leaves the lake.
And that provision is triggered by any part of the forecast – not just the maximum or most probable scenario, but the minimum probable scenario, too.
It’s anyone’s guess what will happen then.
But, hey, at least we’ve got plans in place to handle Tier 2 and 3 shortages. And, in even better timing, Arizona has just completed a multiyear effort to flesh out how cities and other users can begin withdrawing the millions of acre-feet of water they have stored underground.
Explaining the benefits and pitfalls of that effort is for another blog on another day, but for now, let’s just say it’s a good thing we have water stored for a (non)rainy day.
Because the outlook for Arizona’s major renewable water source is parched and bleak – and growing more so every day.
Colorado River “Beginnings”. Photo: Brent Gardner-Smith/Aspen Journalism
Click here for all the inside skinny and to register:
Topic
Colorado State of the River
Description
Join the Colorado River District for the Colorado State of the River, a webinar addressing issues across the basin.
Learn how last year’s wicked wildfire season has impacted our water supplies and how to prepare for the impacts of post-fire floods. Get information about water availability amid impending summer drought and find out more about funding available for local water projects.
If you cannot attend the webinar live, register to receive a recording of the webinar in your email inbox to watch later.
Agenda:
• Welcome – Colorado River District
• Colorado River District’s Community Funding Program – Colorado River District Director of Strategic Partnerships Amy Moyer
• Water Supply Updates and Drought in the Colorado River Basin – Division 5 Assistant Division Engineer James Heath
• Impacts of 2020 Wildfires and Fire Recovery in the Colorado River Basin – U.S. Forest Service Hydrologist Liz Schnackenberg, Joel Cochran, Grand County Director of Emergency Management, Northern Water Source Water Protection Specialist Kimberly Mihelich and Middle Colorado Watershed Council Executive Director Paula Stepp
• Learning By Doing: Updates and Fire Recovery – Learning by Doing Coordinator Kiki Sayre and Water Quality Technical Assistance Consultant for Grand County Kayli Foulk
Time
May 27, 2021 06:00 PM in Mountain Time (US and Canada)


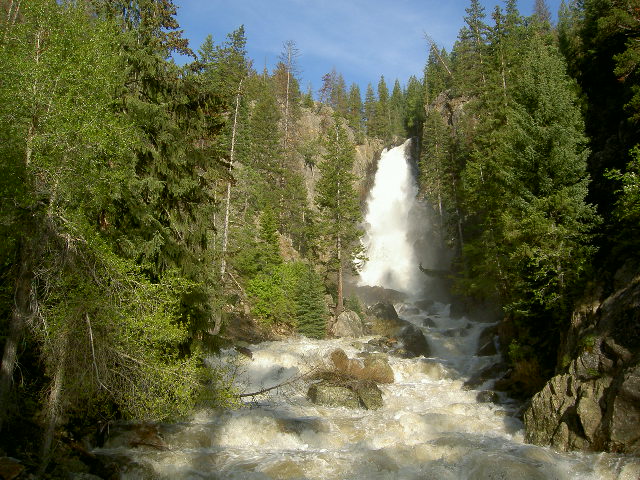


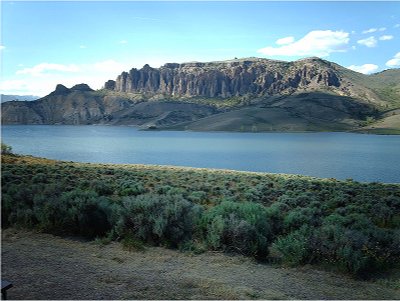


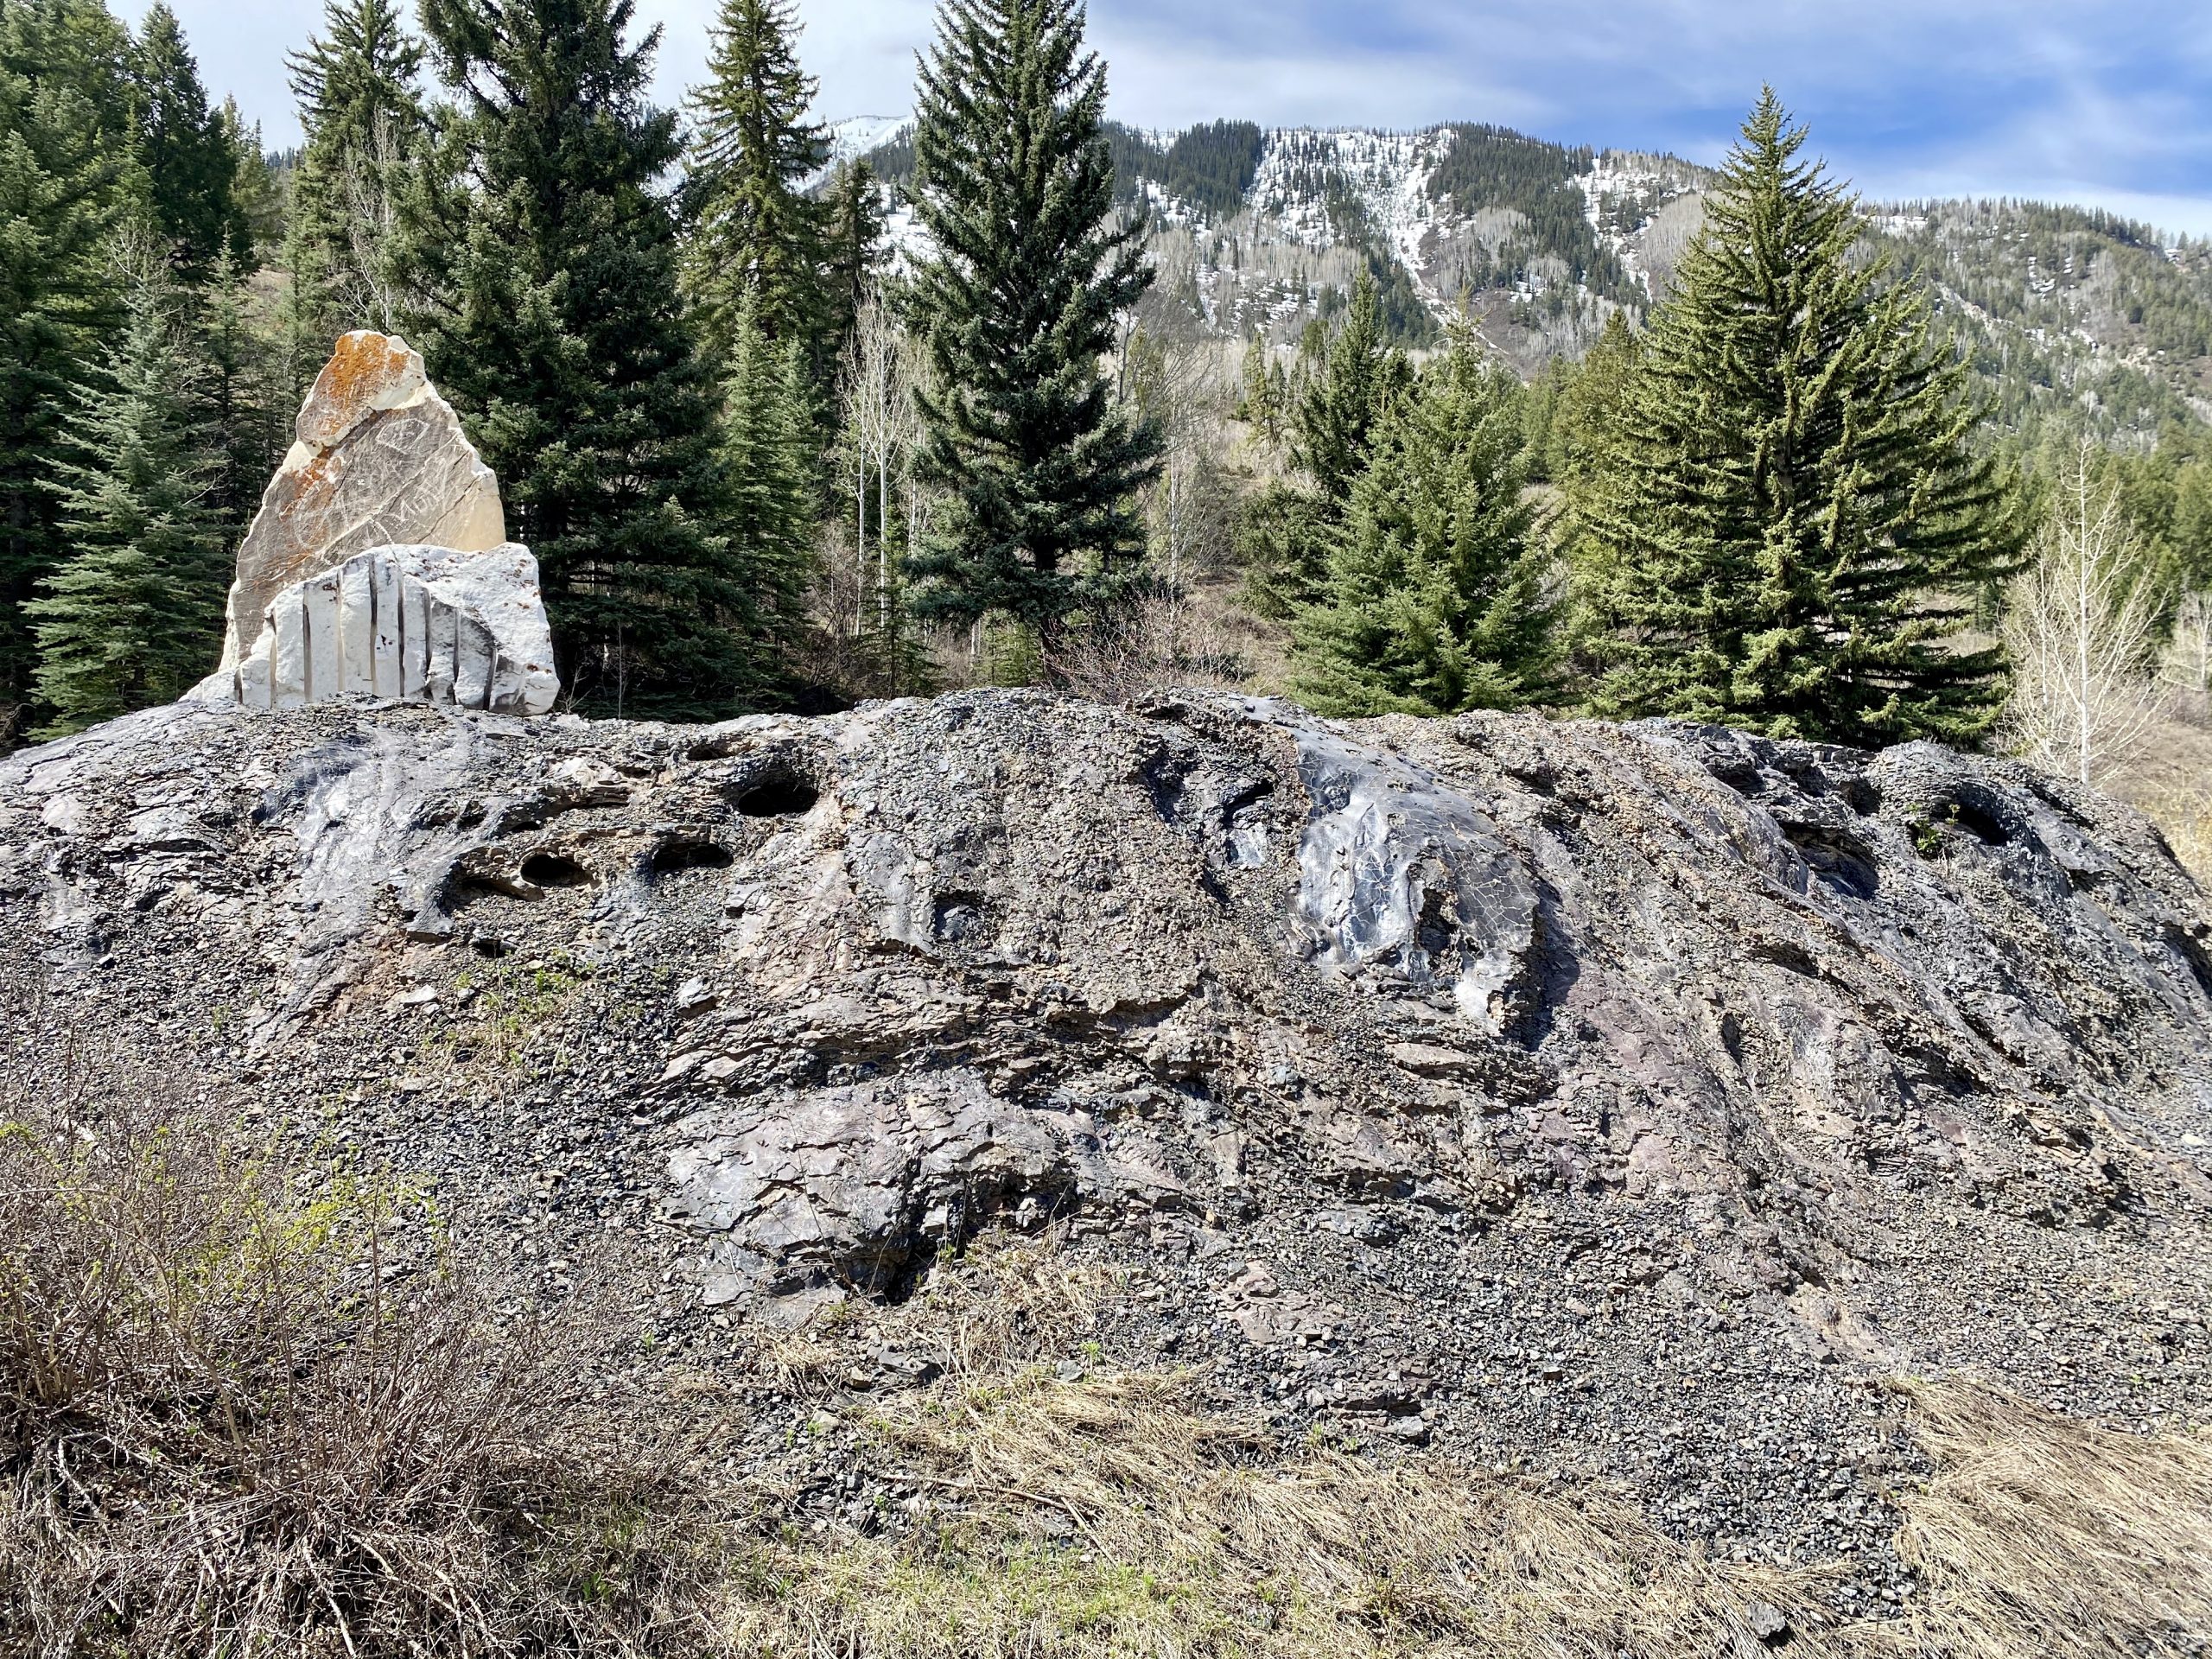

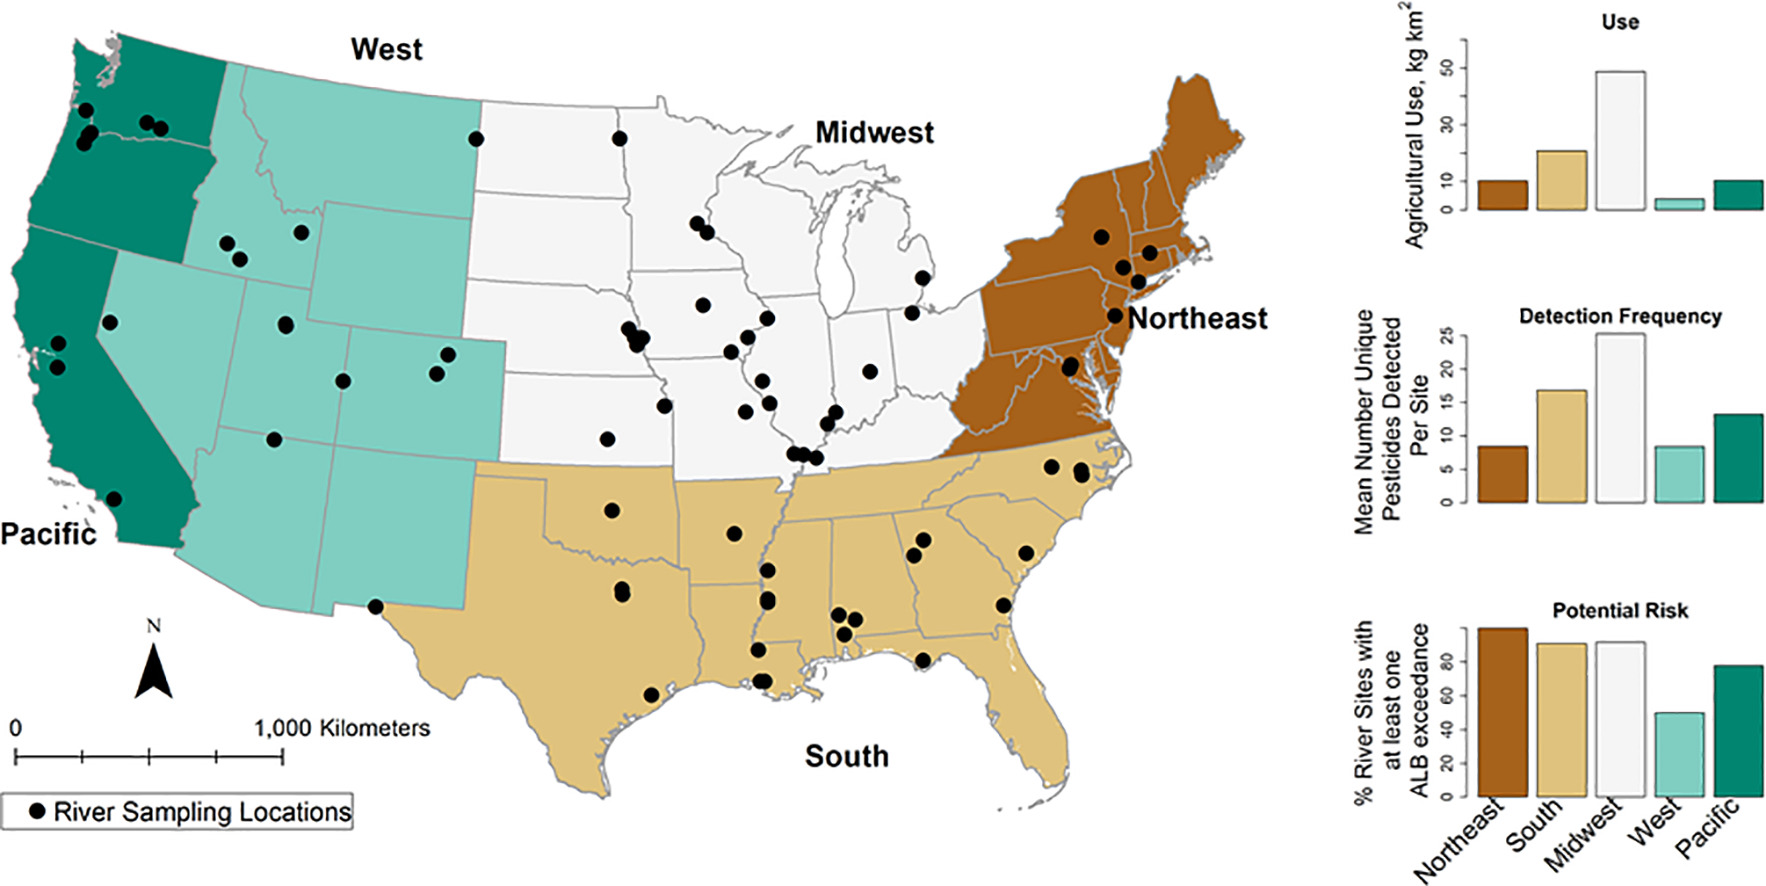
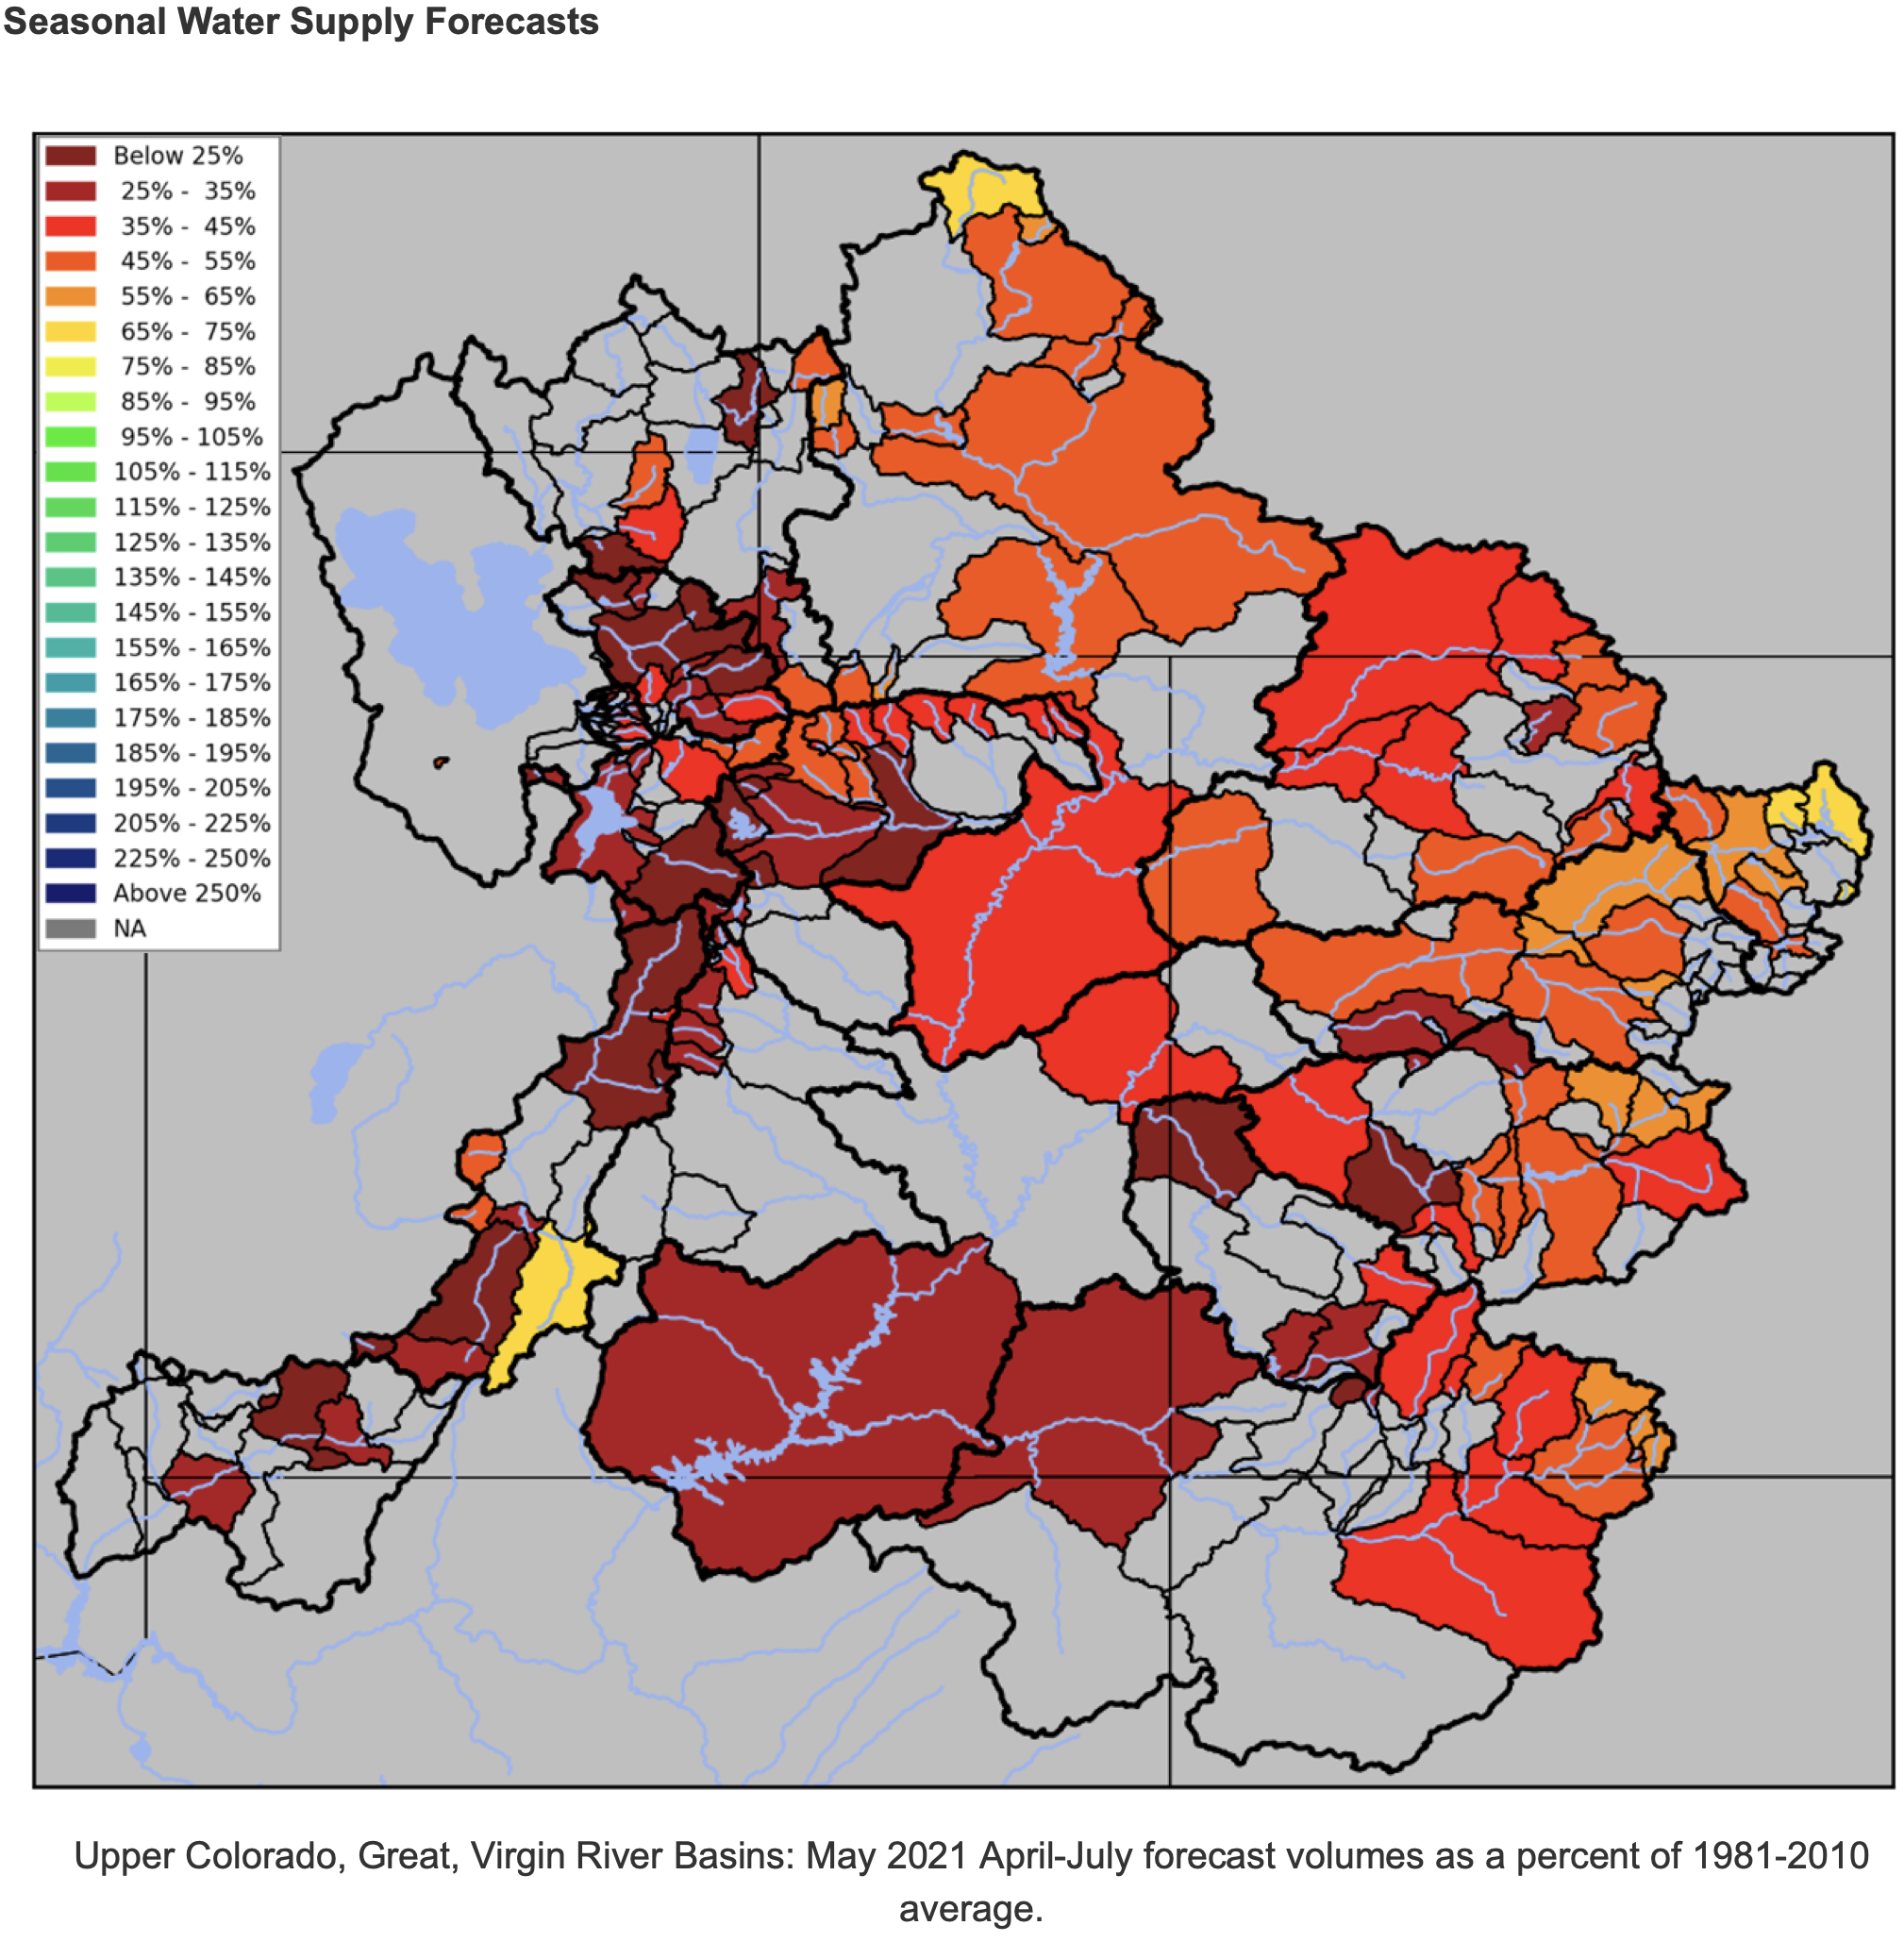
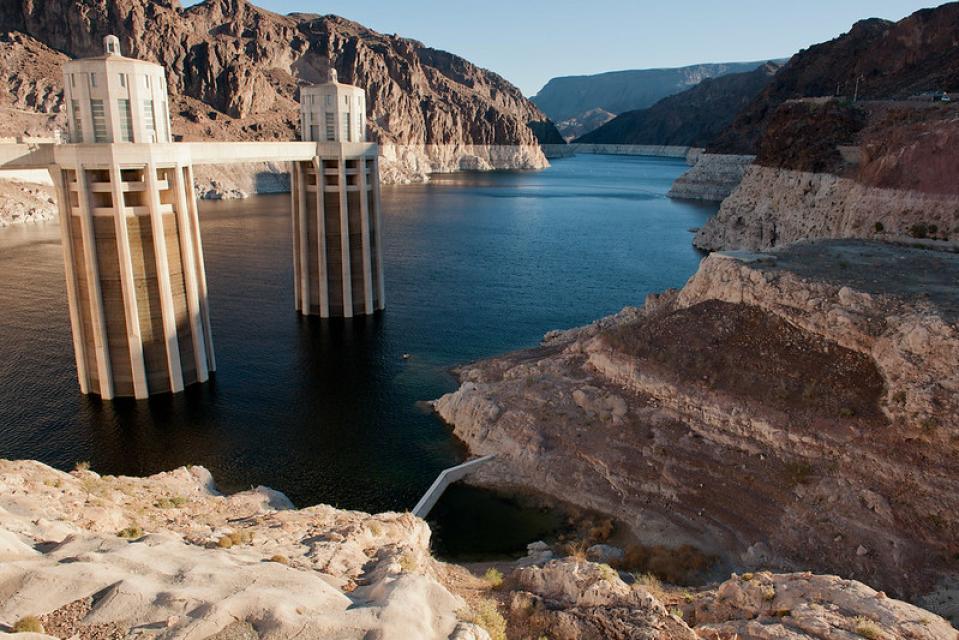
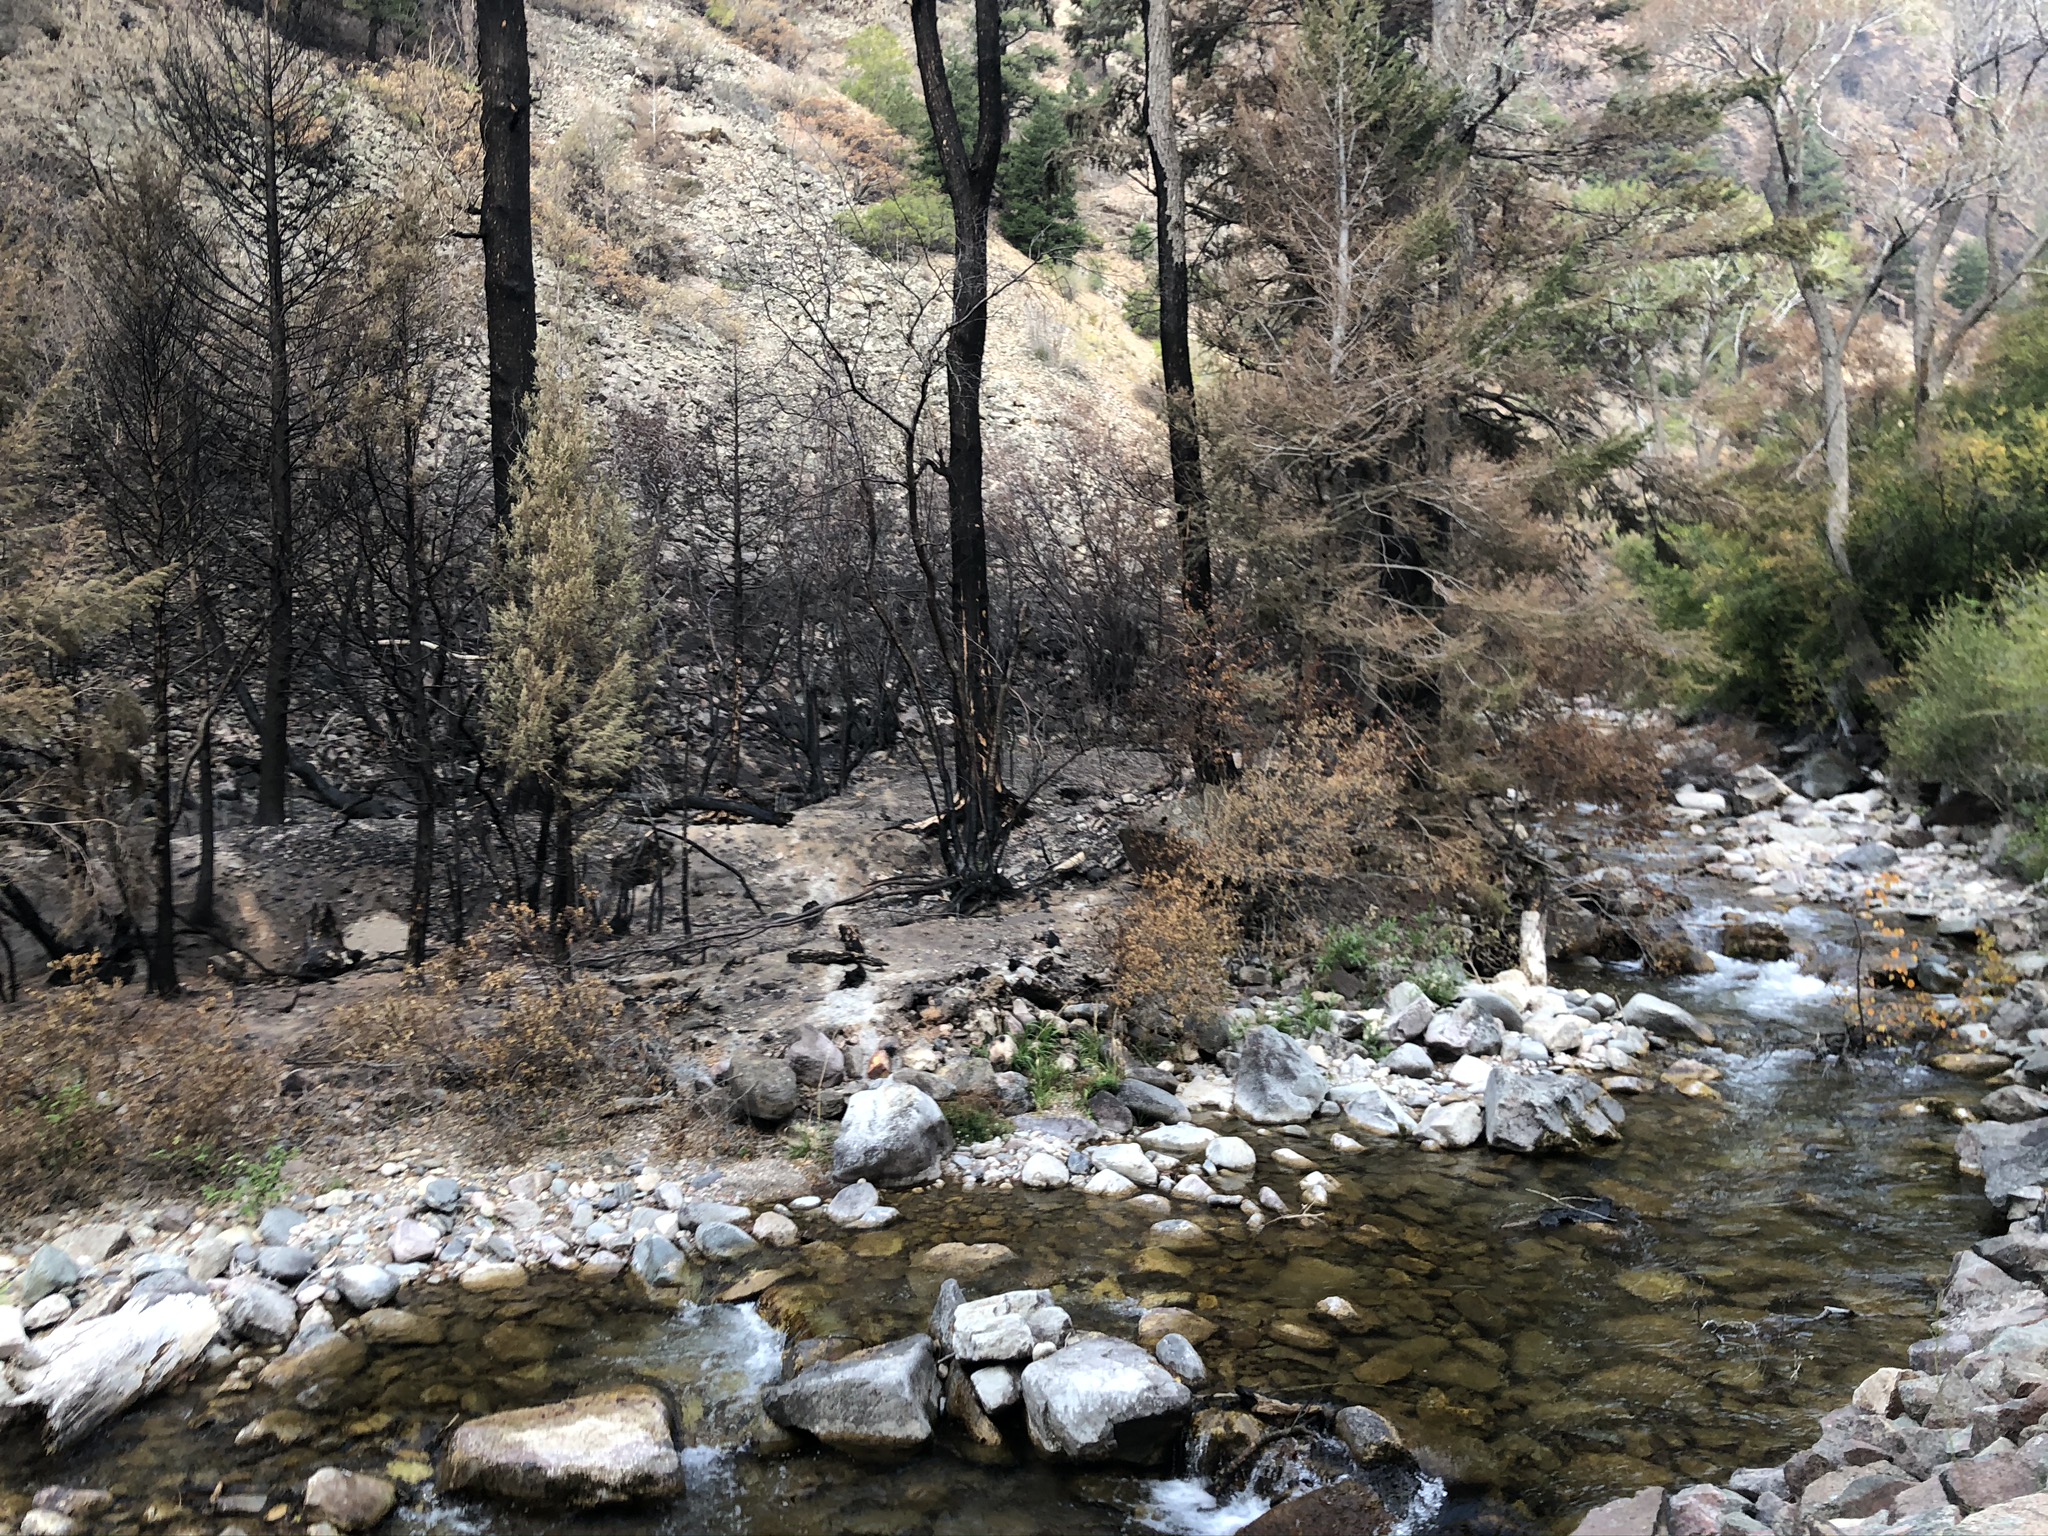
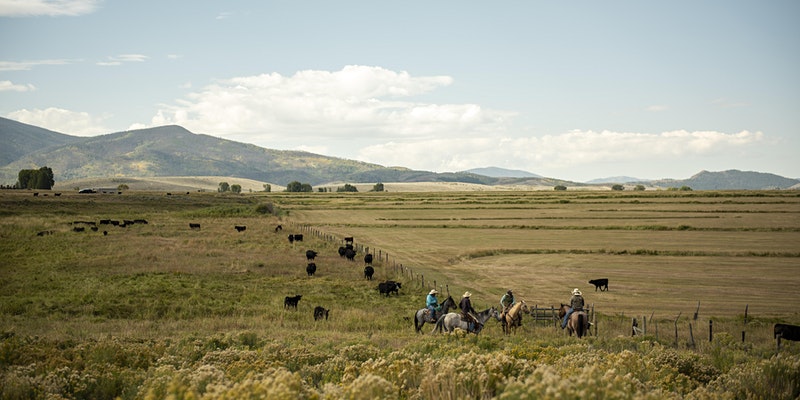

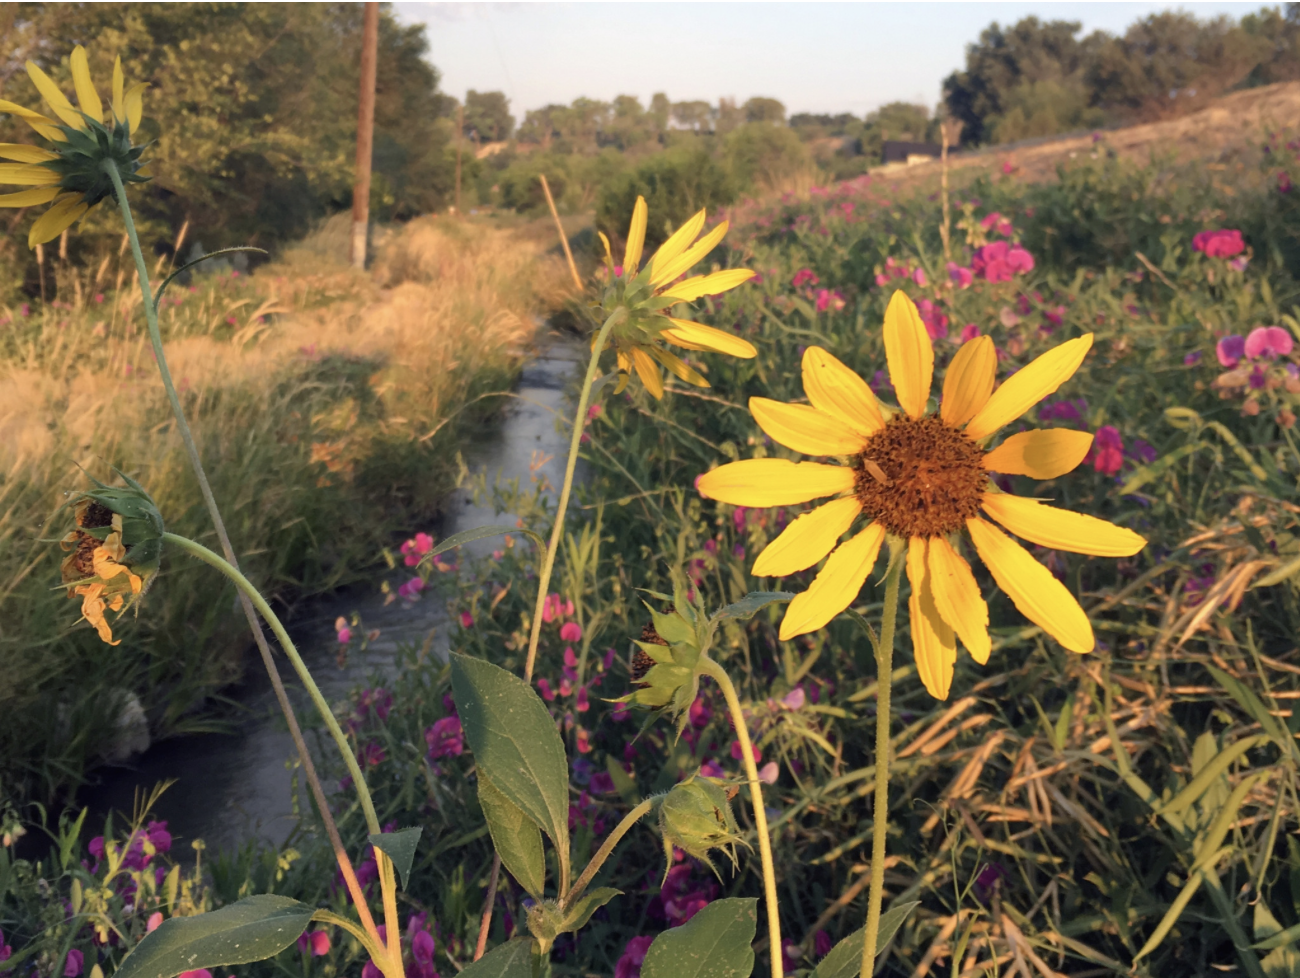
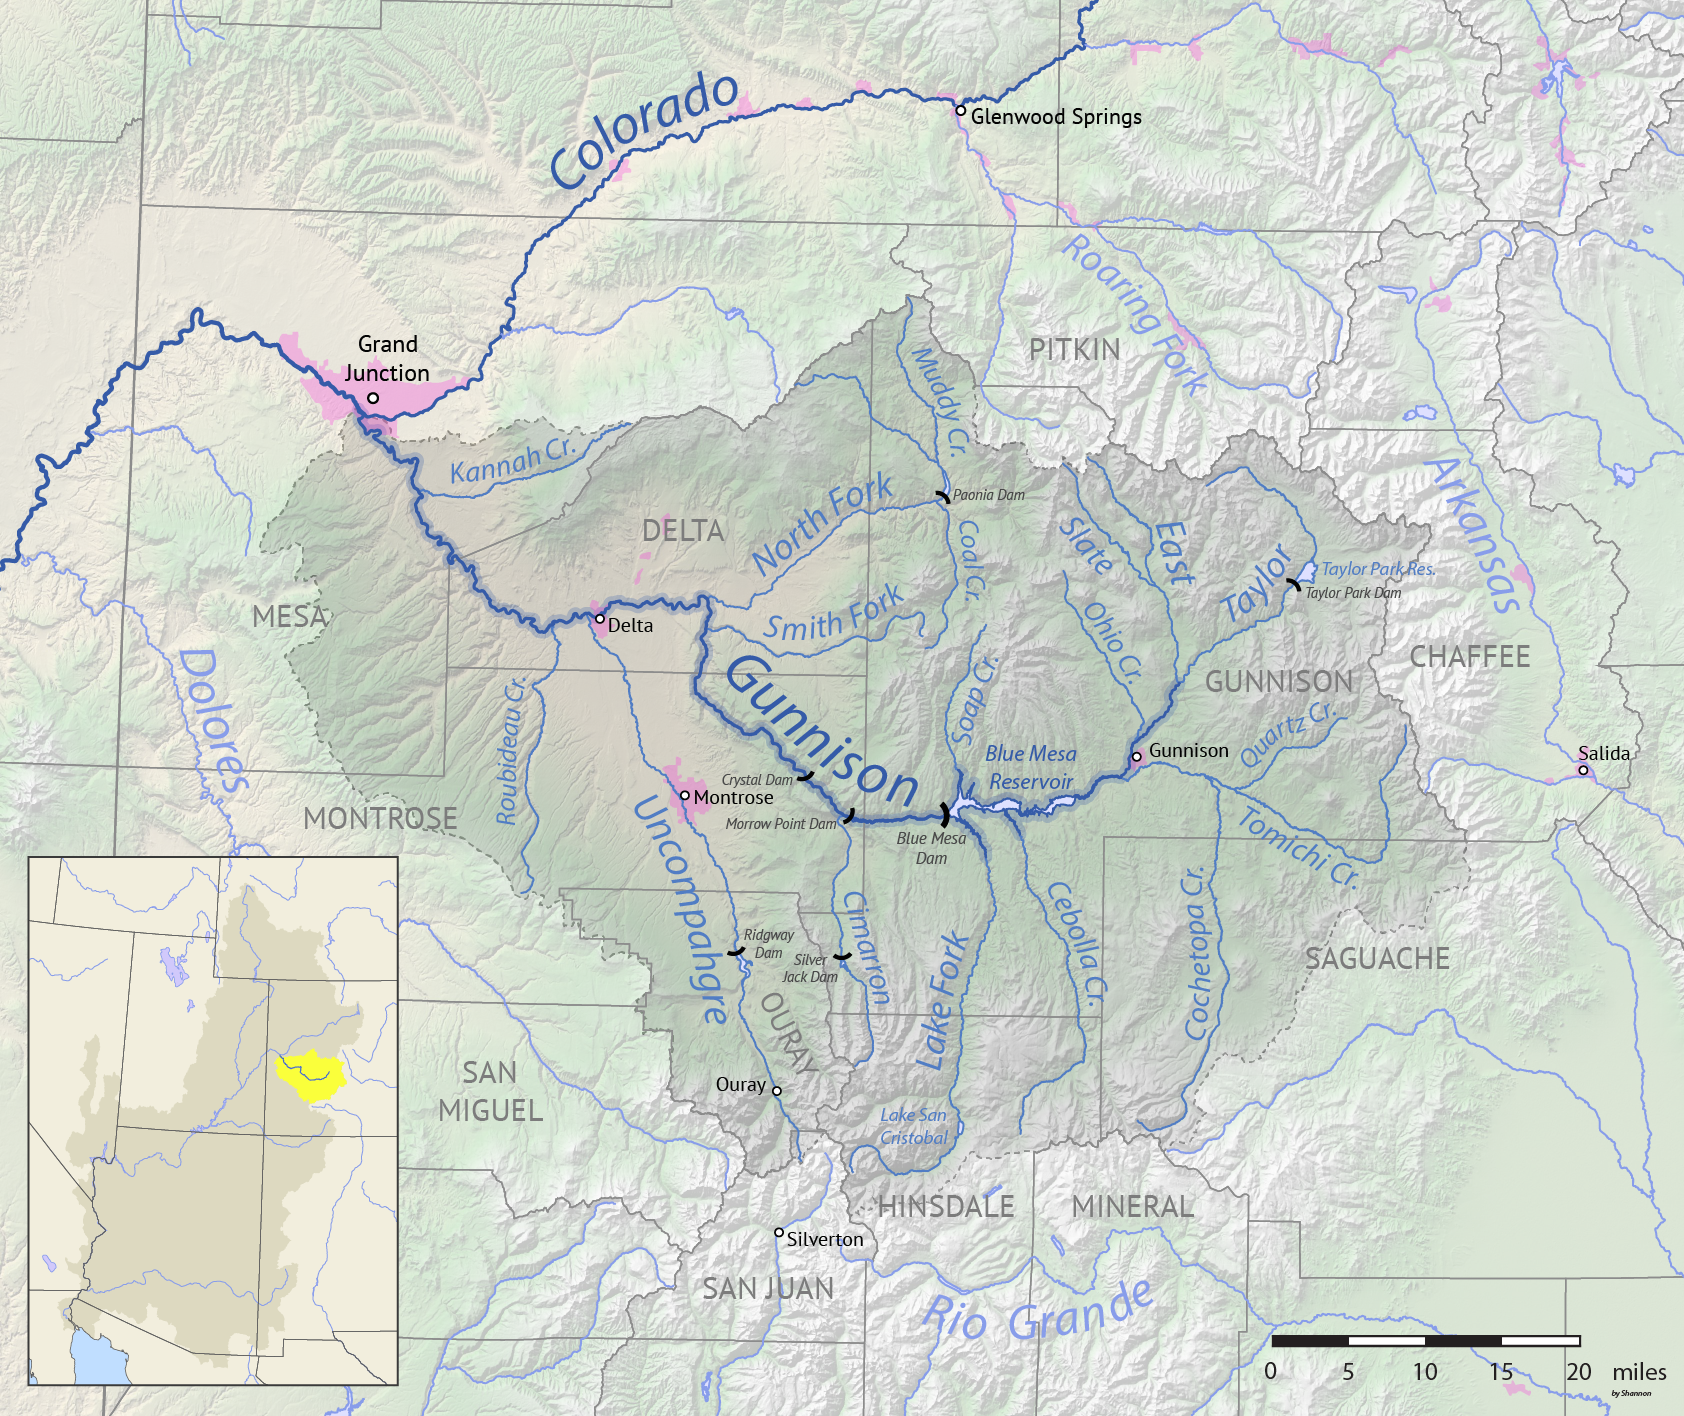
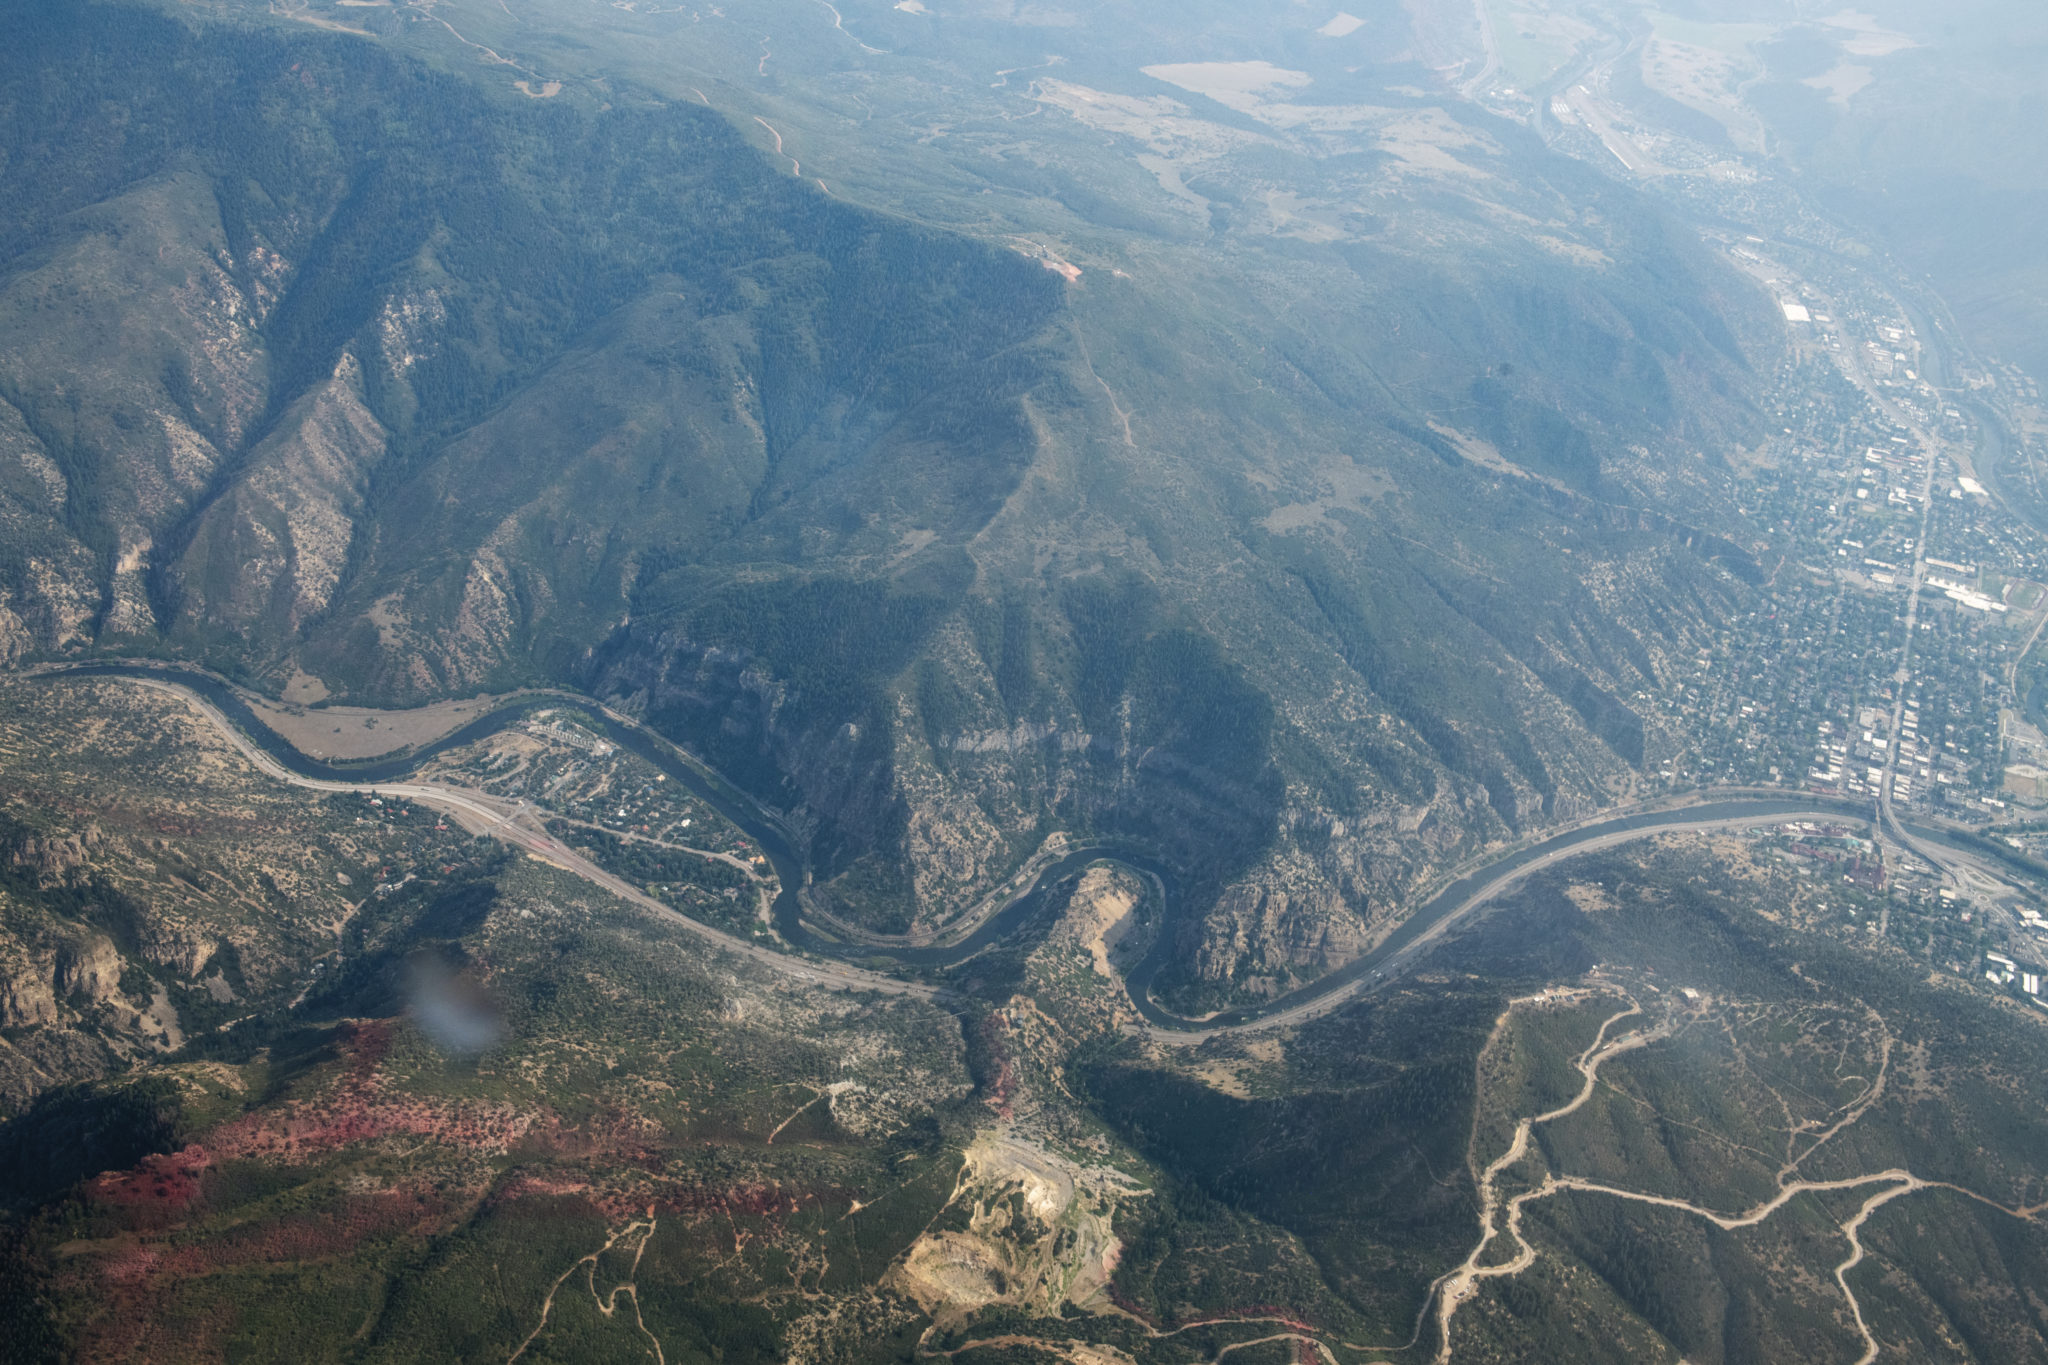
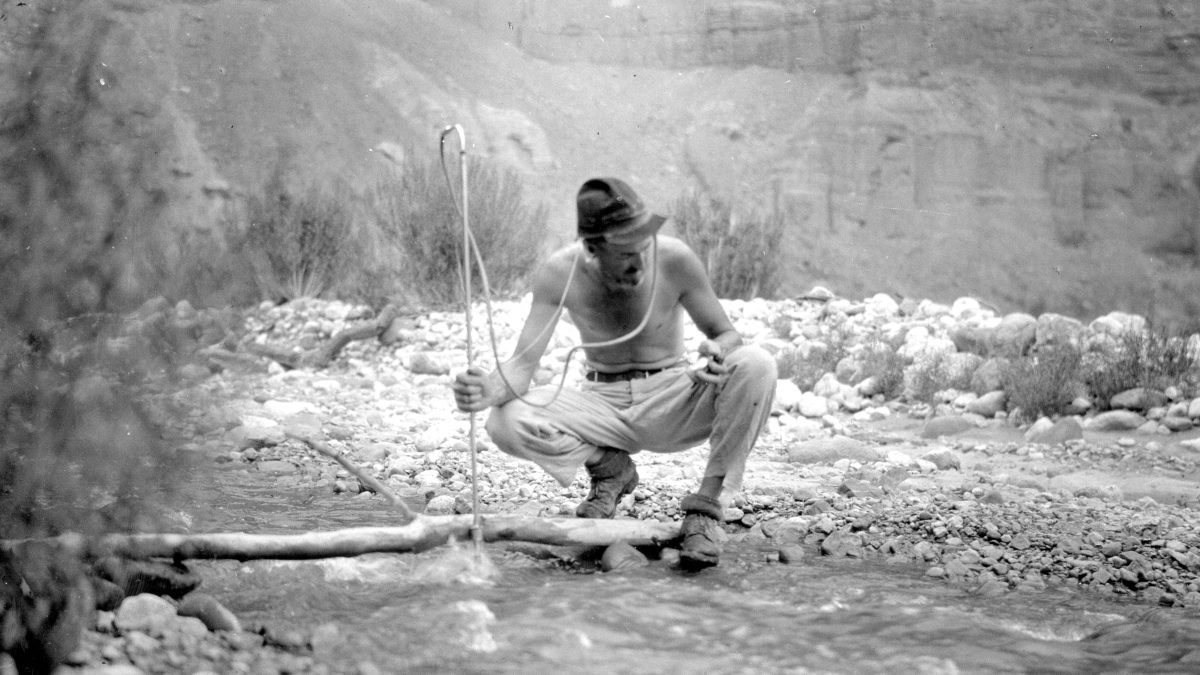
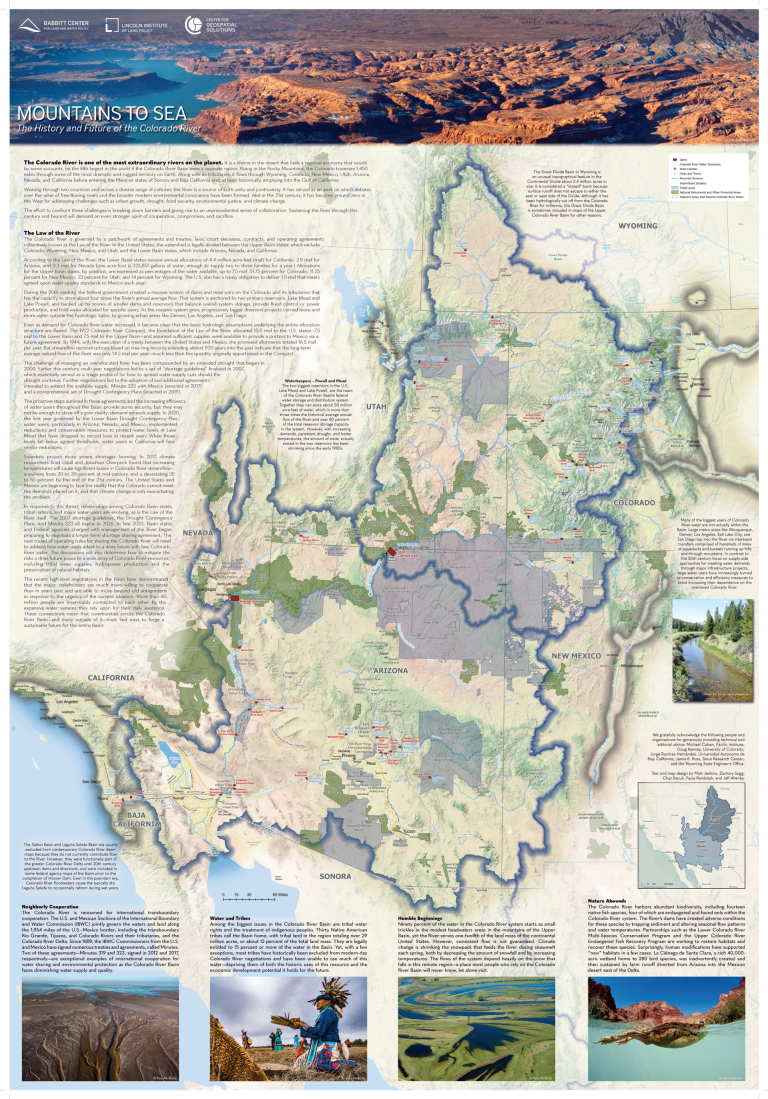
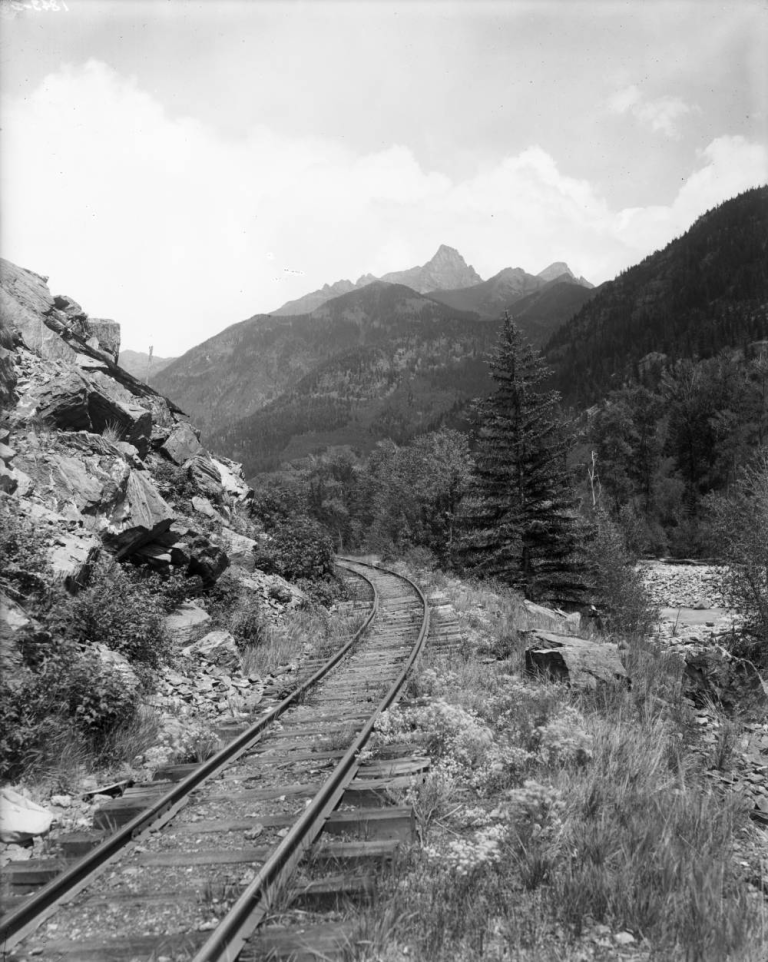
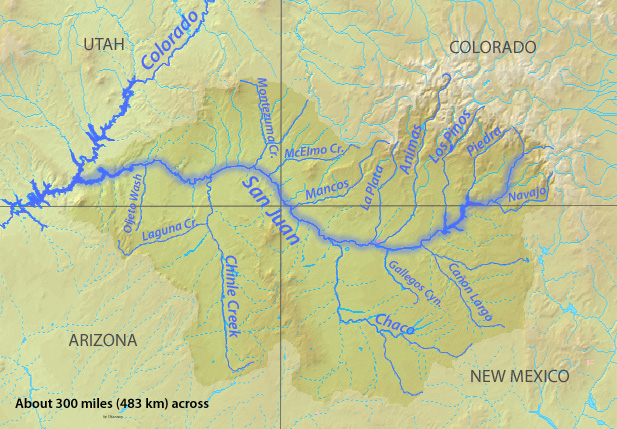
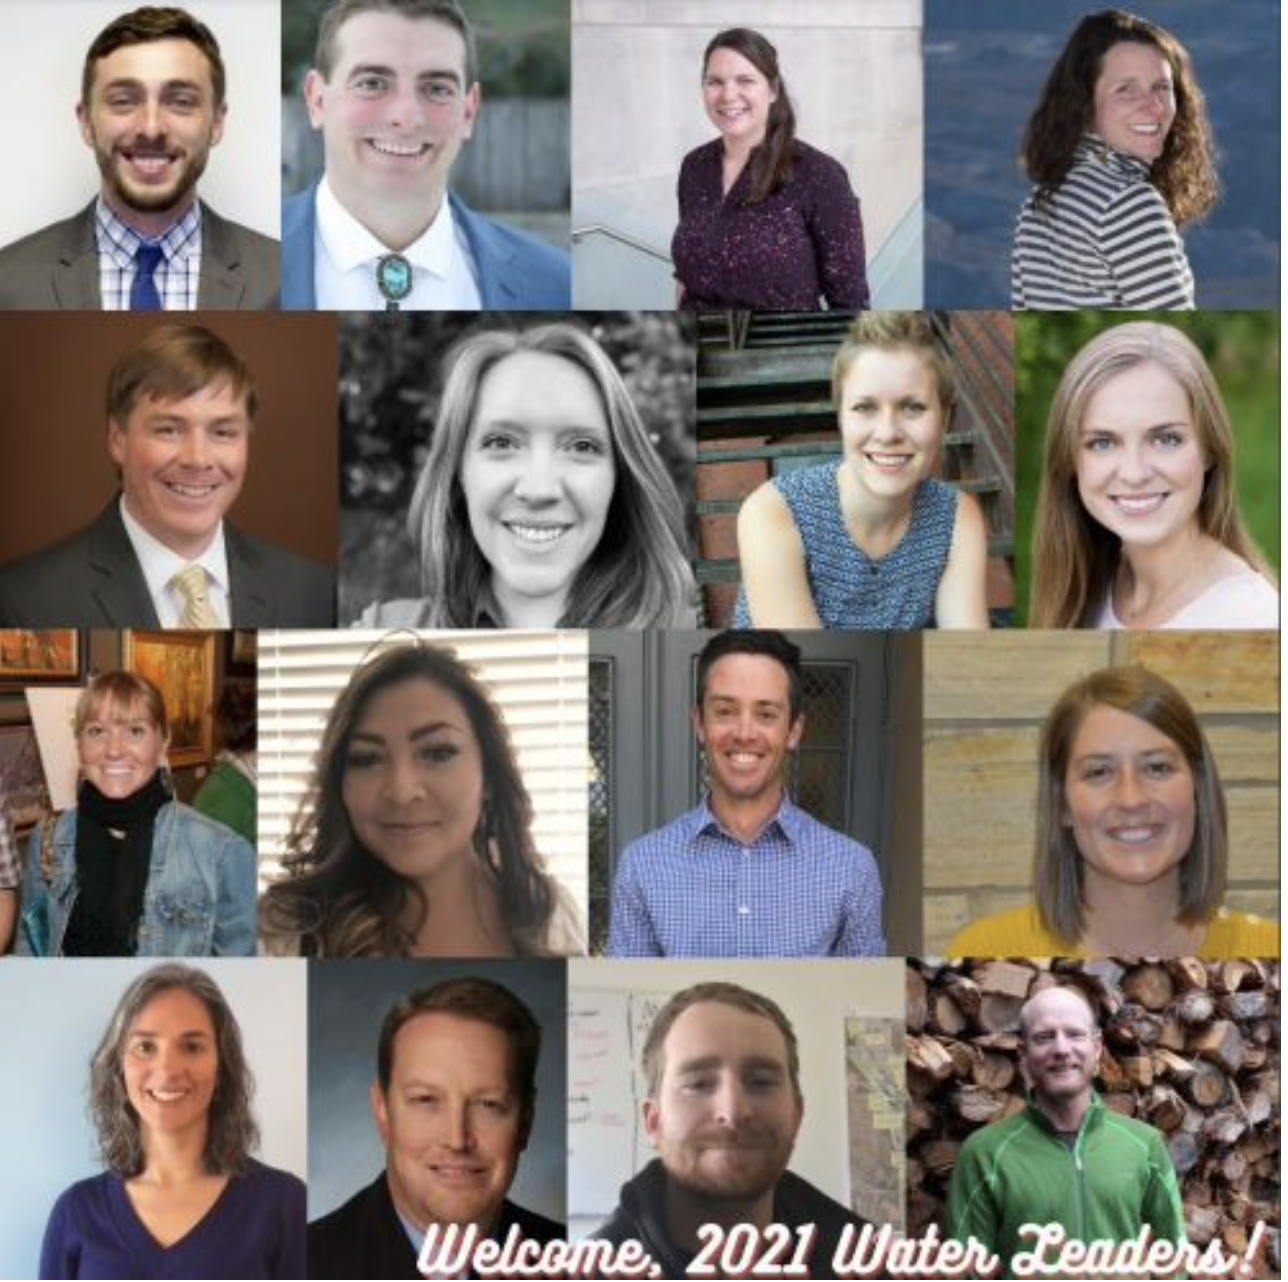


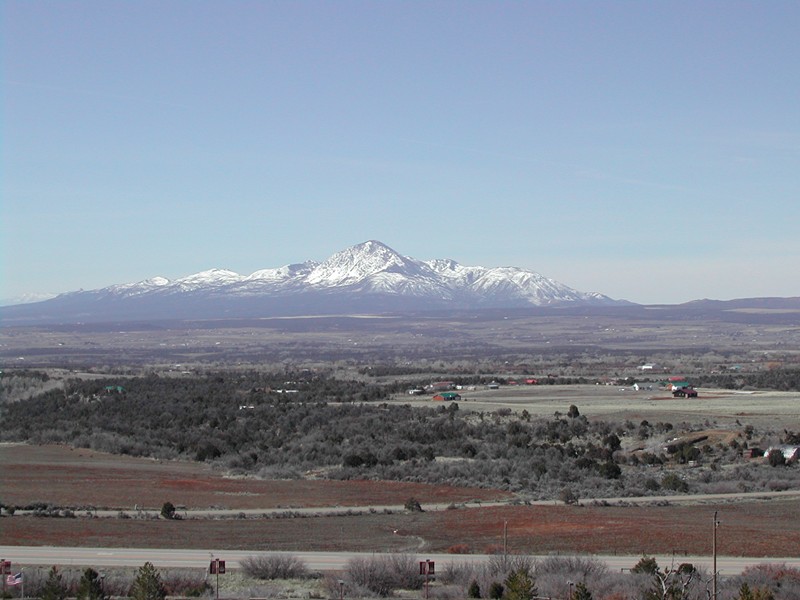
 Flannel mouth sucker
 Bluehead sucker
 Roundtail chub


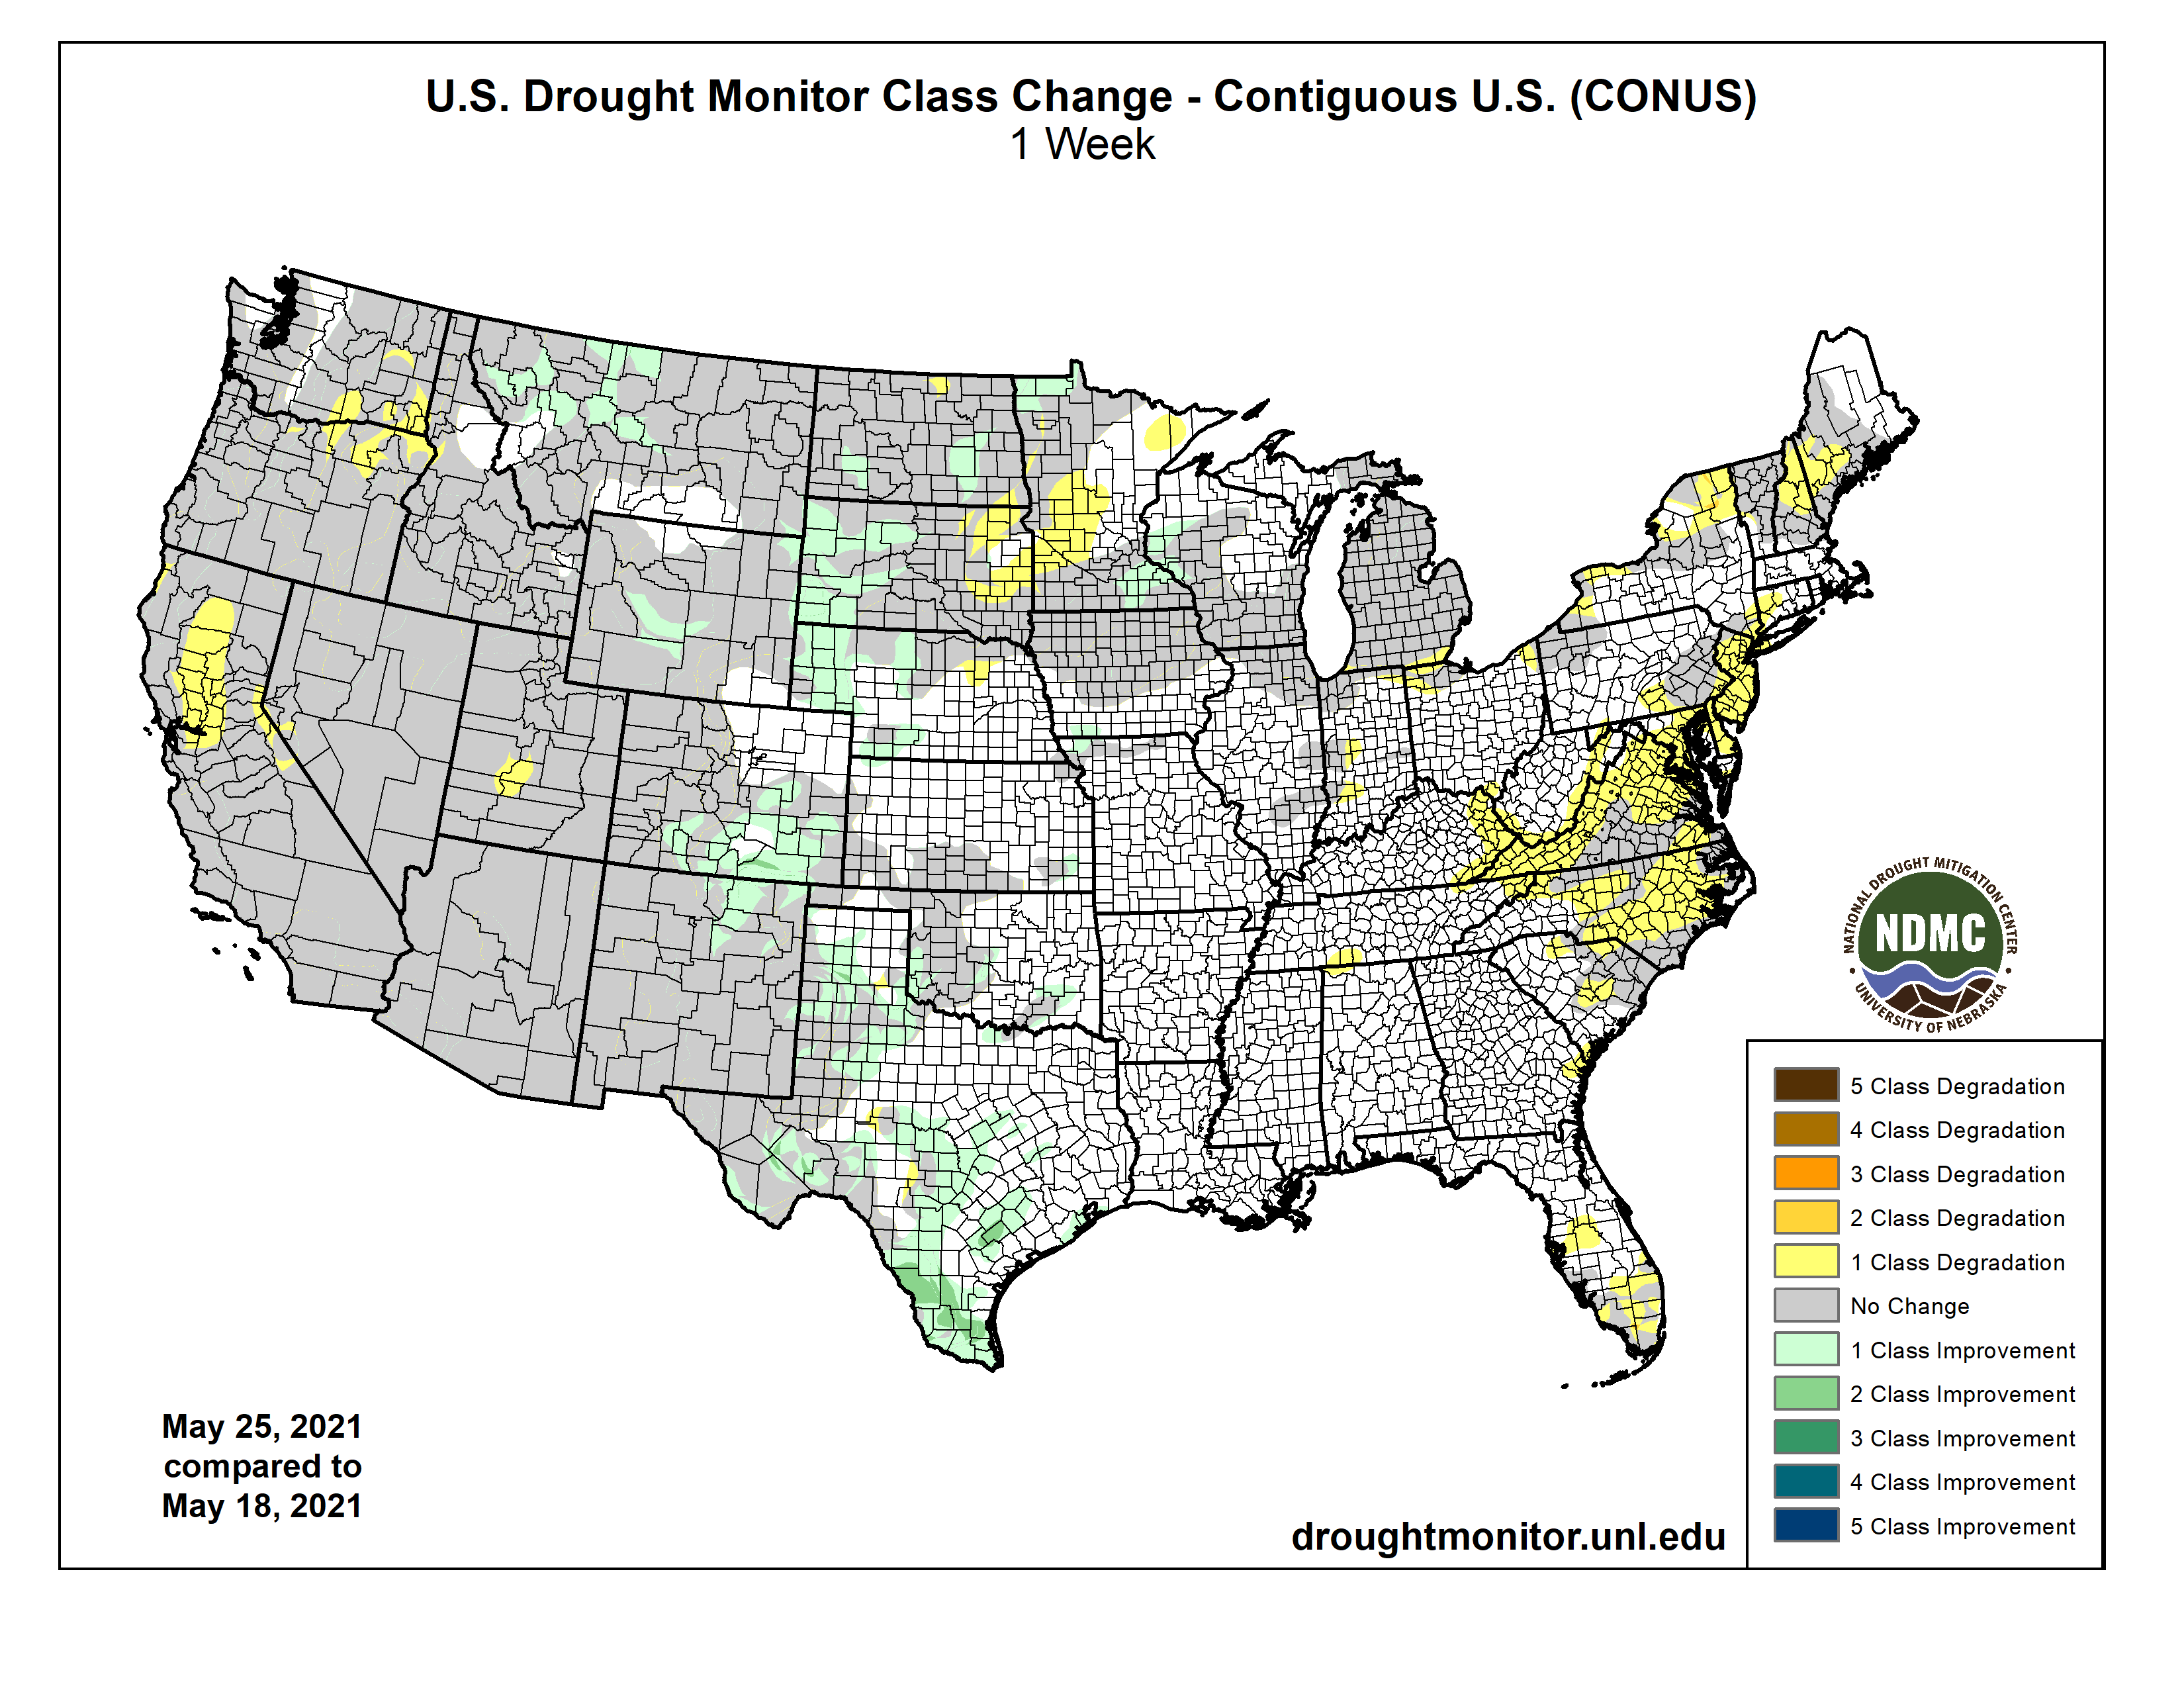


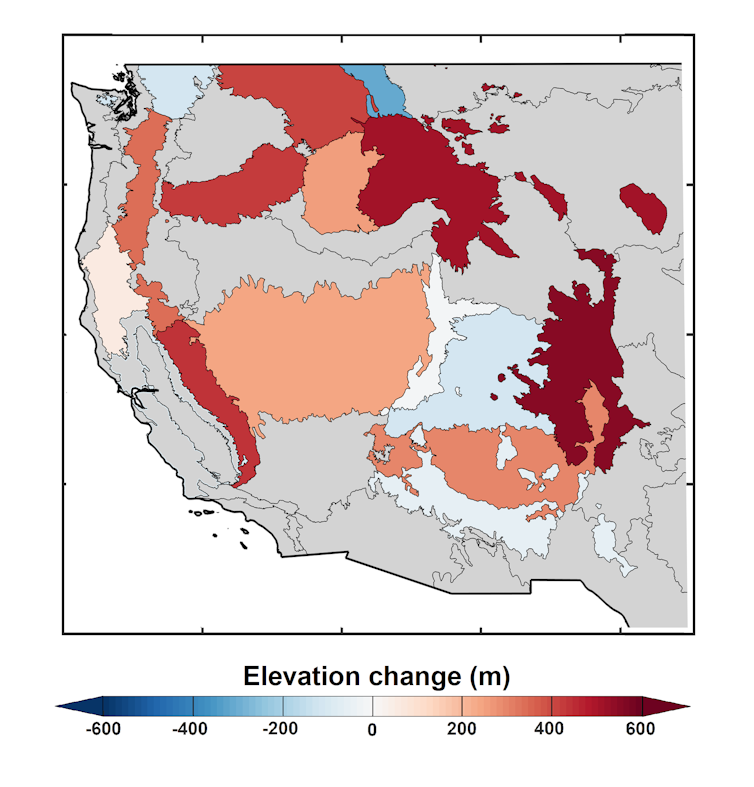
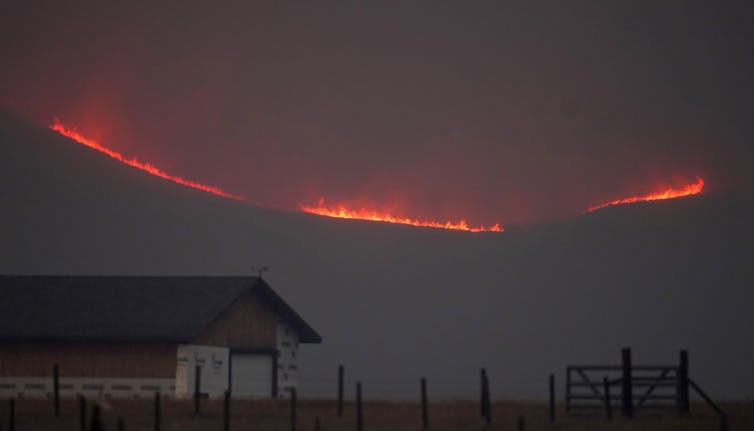
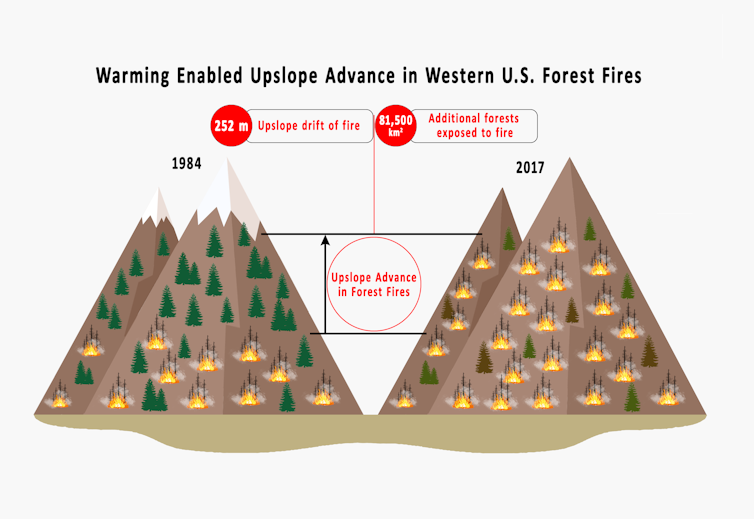
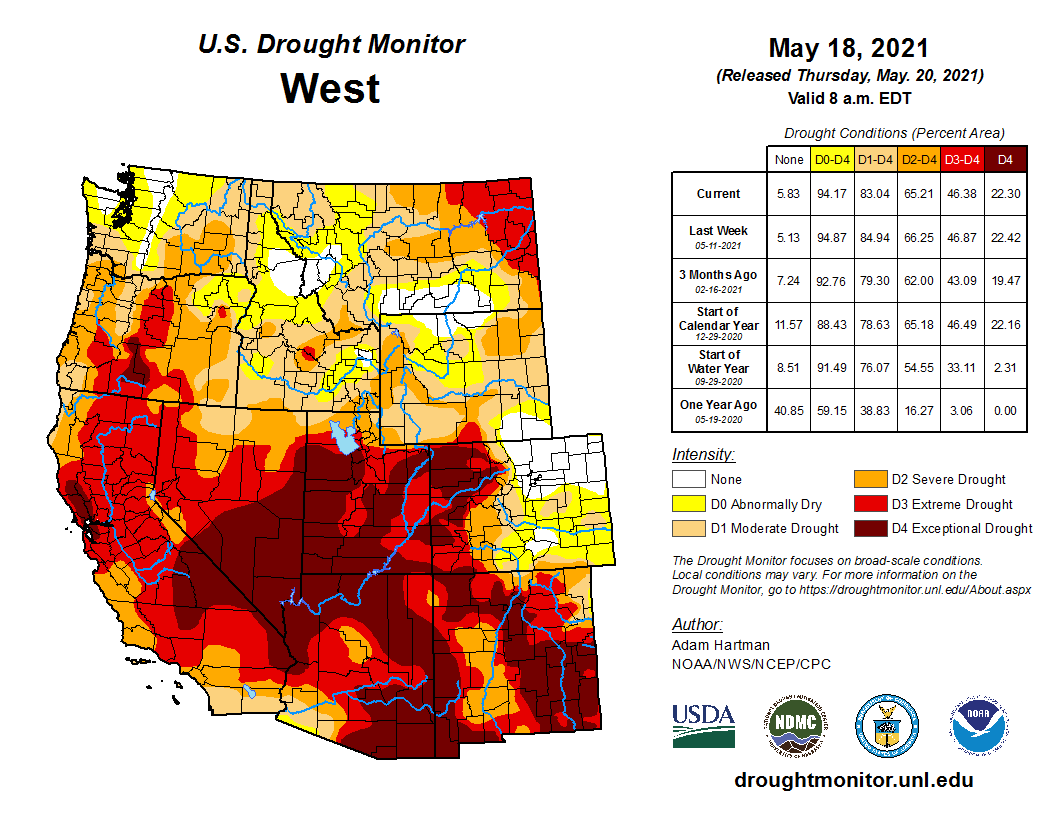
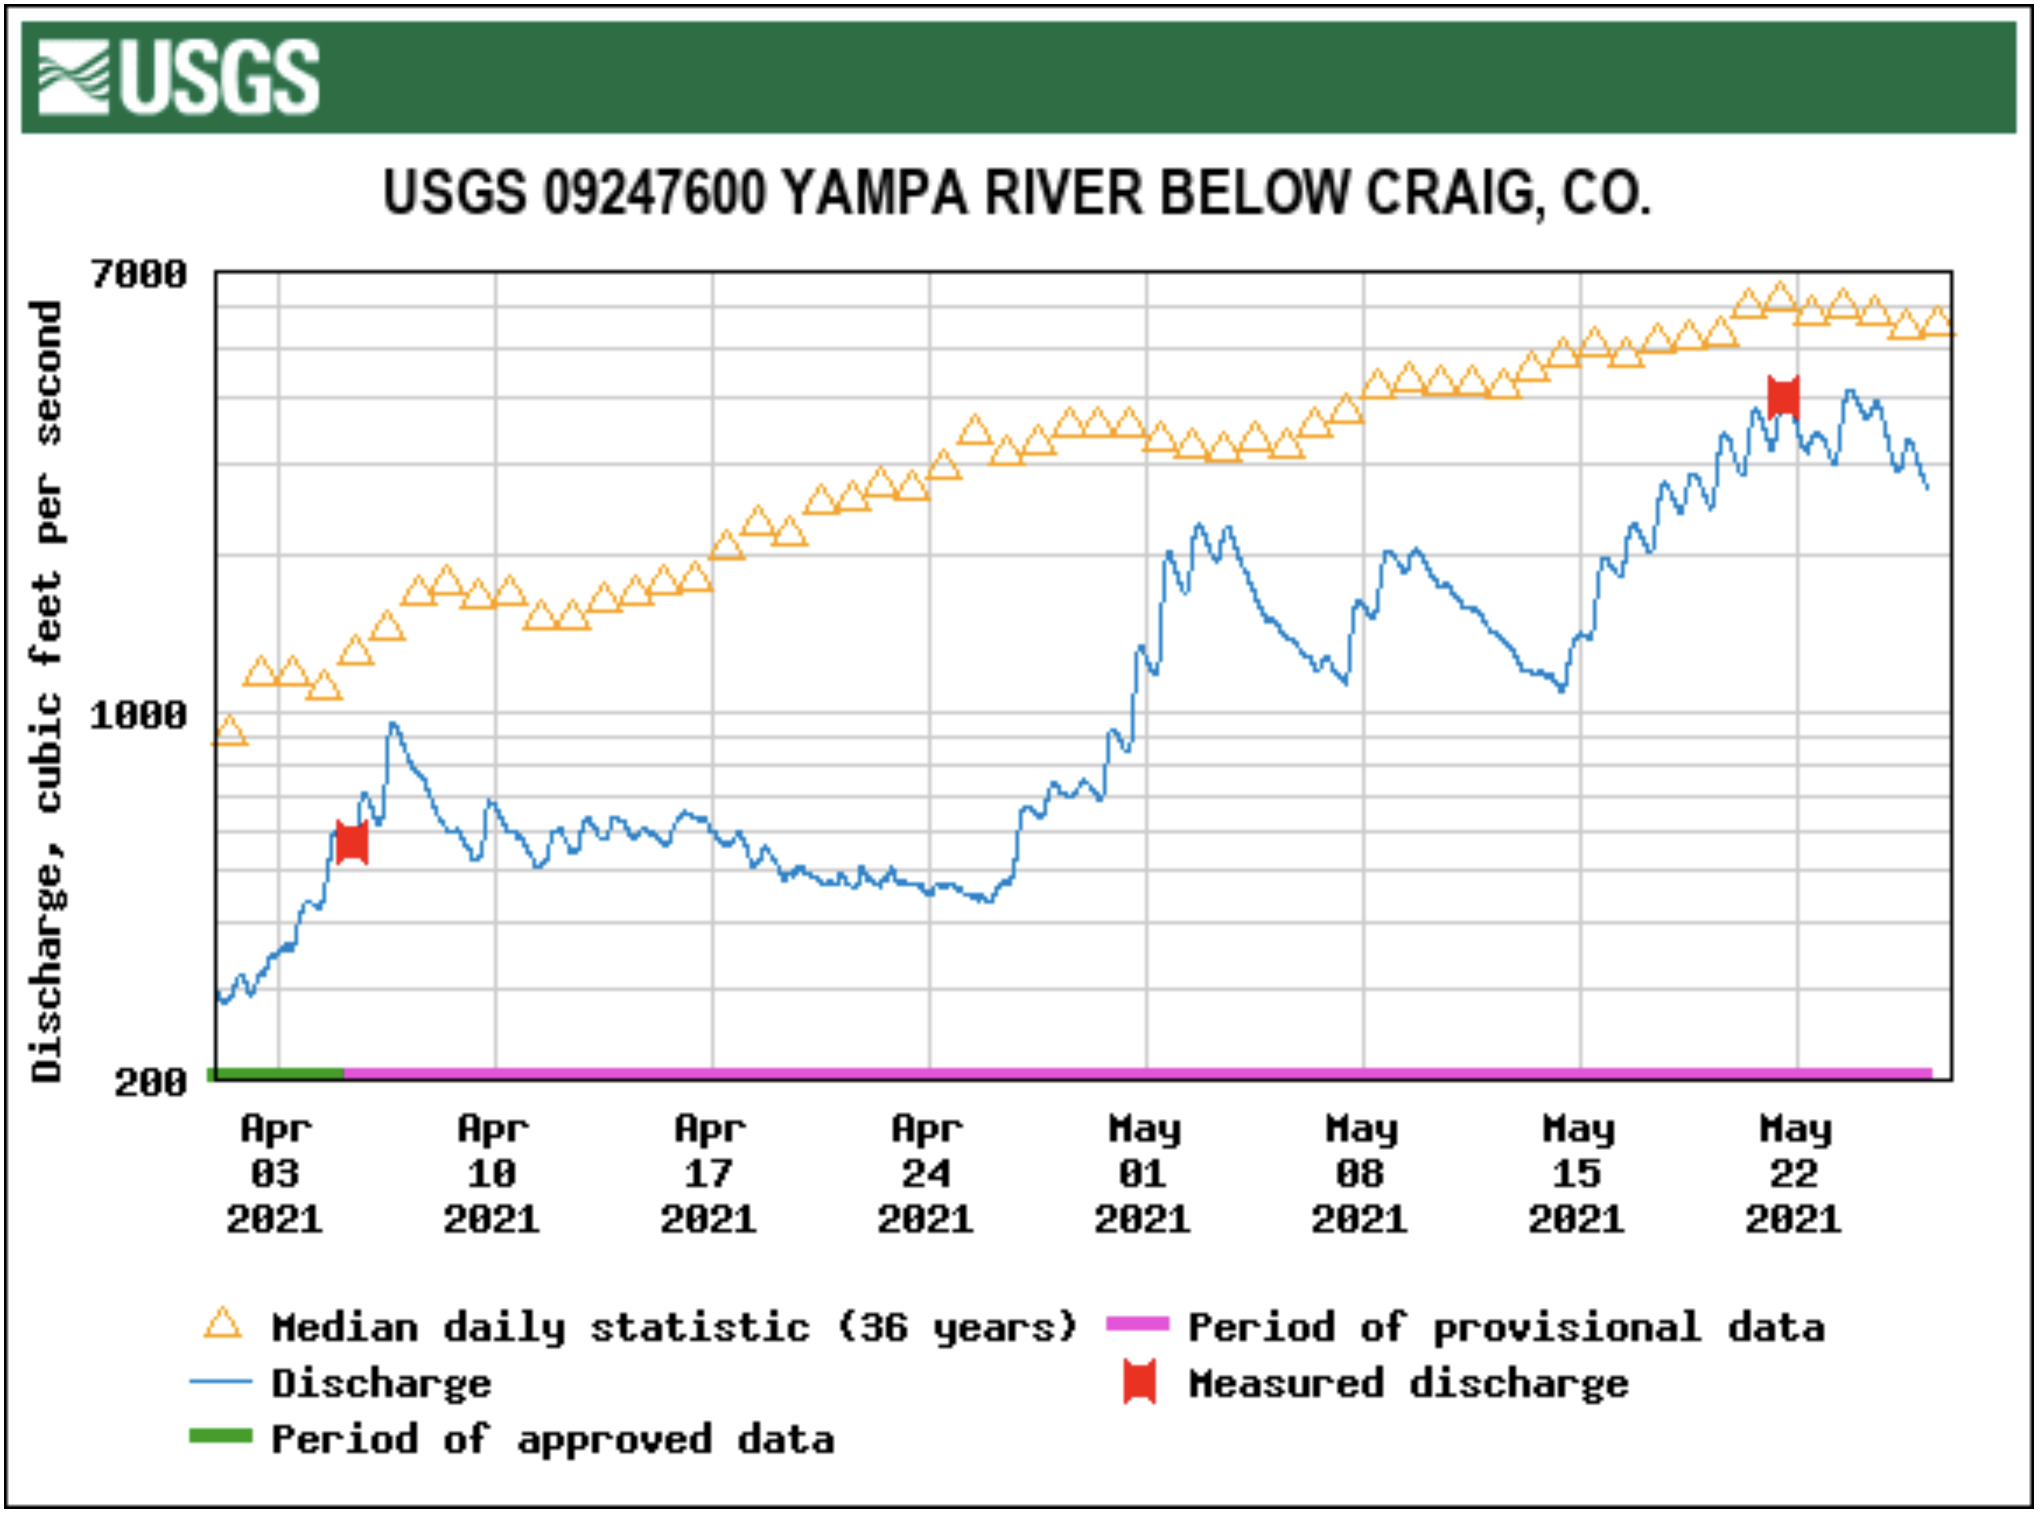
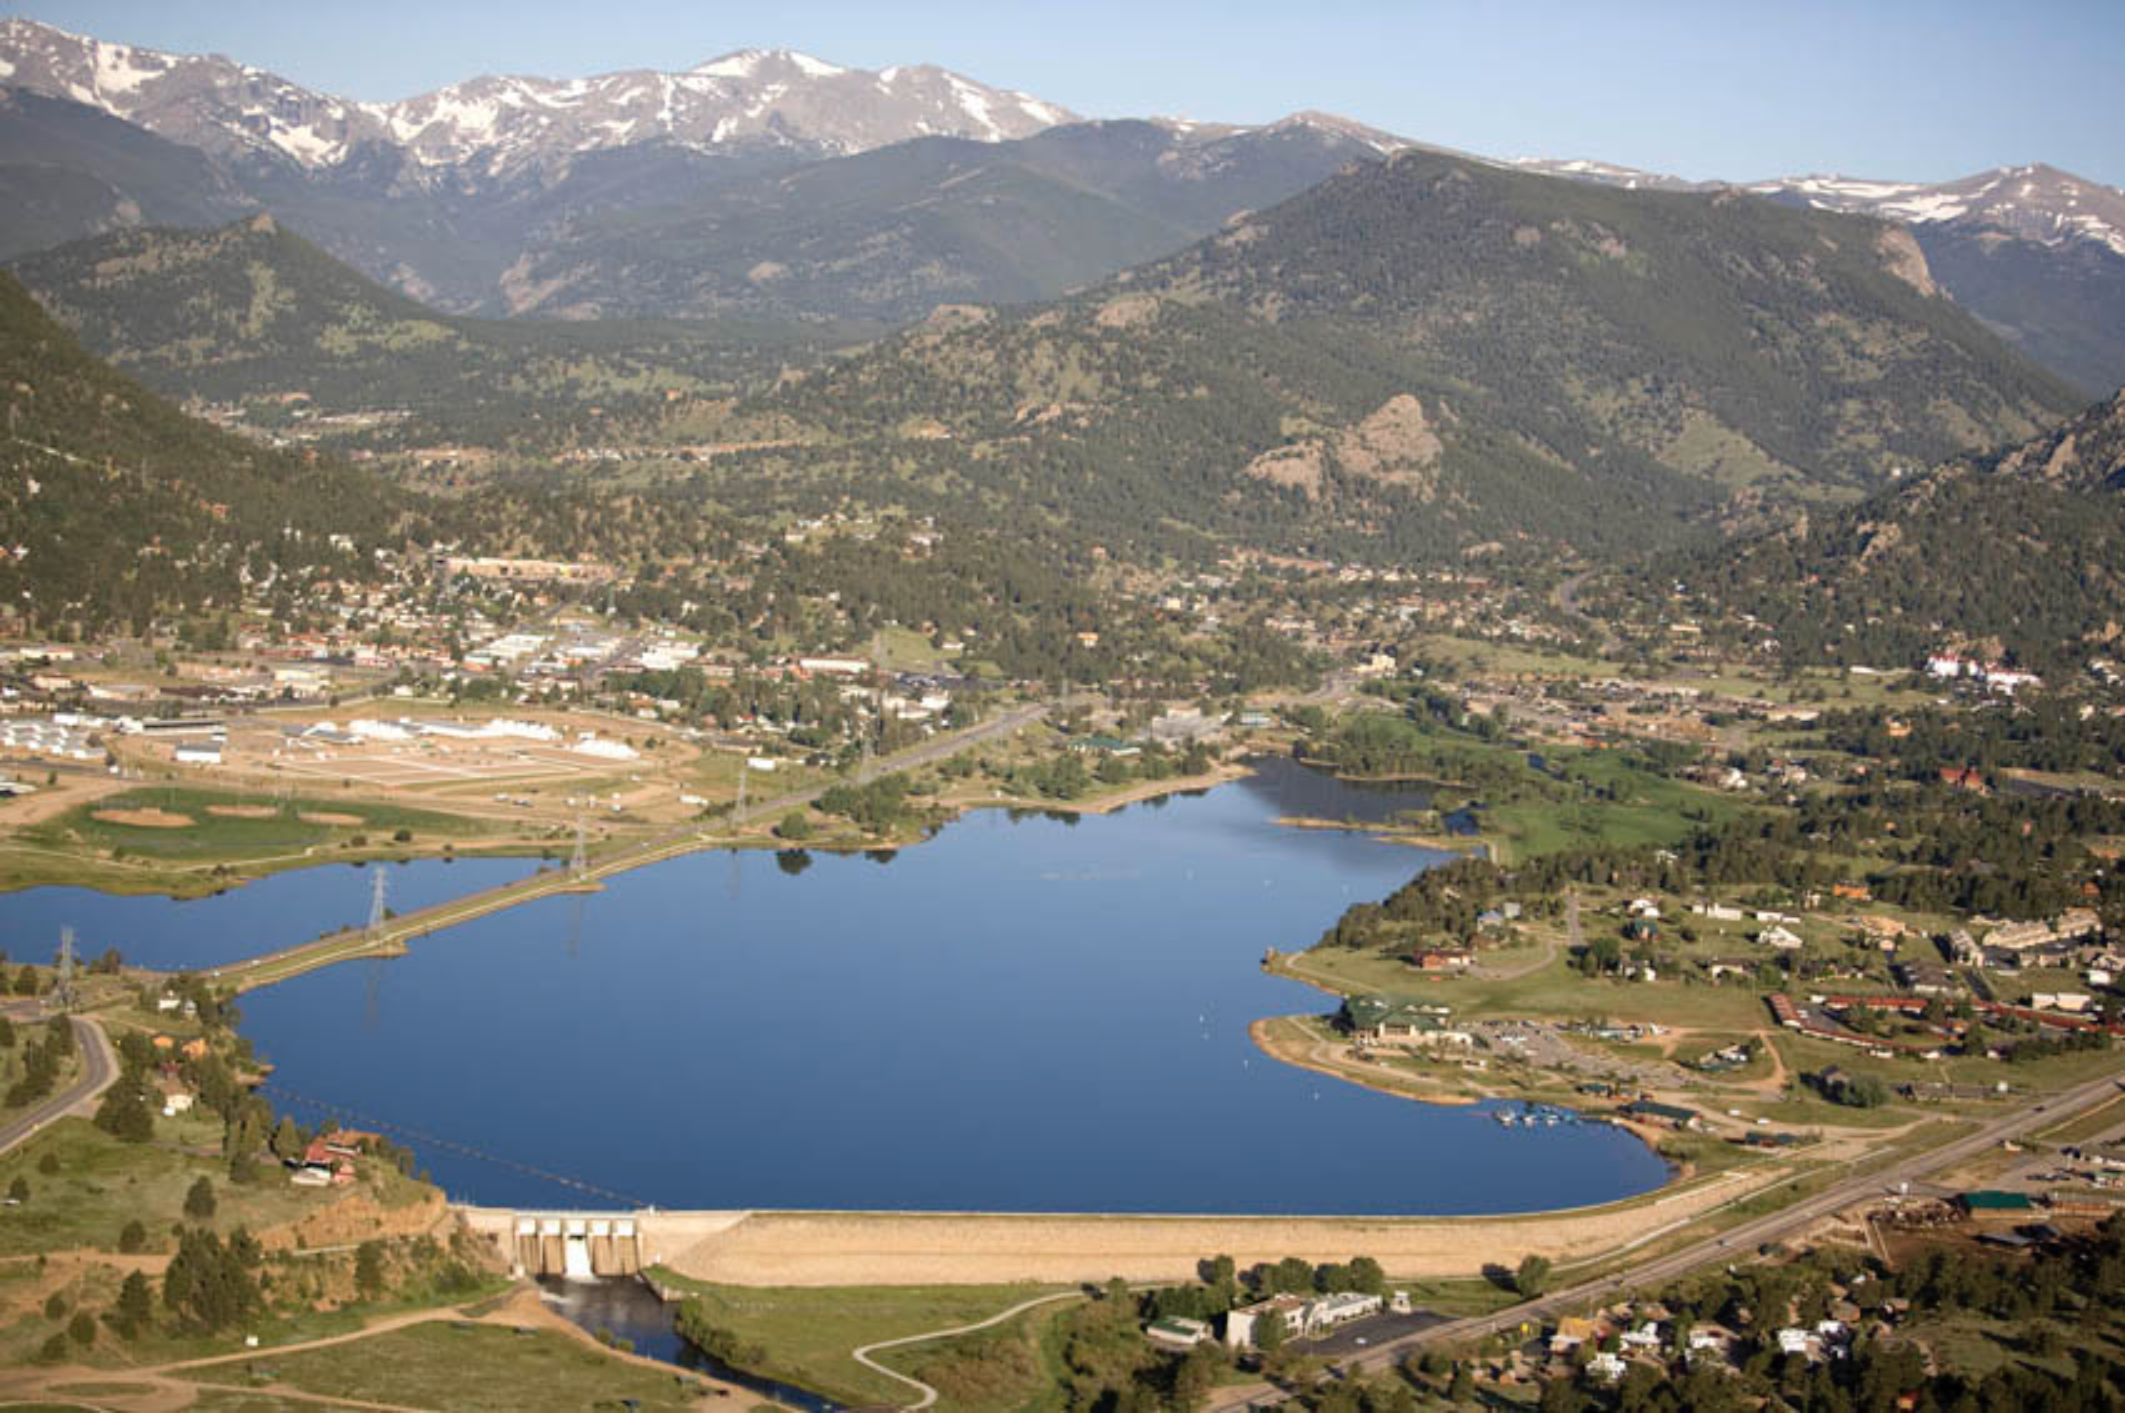

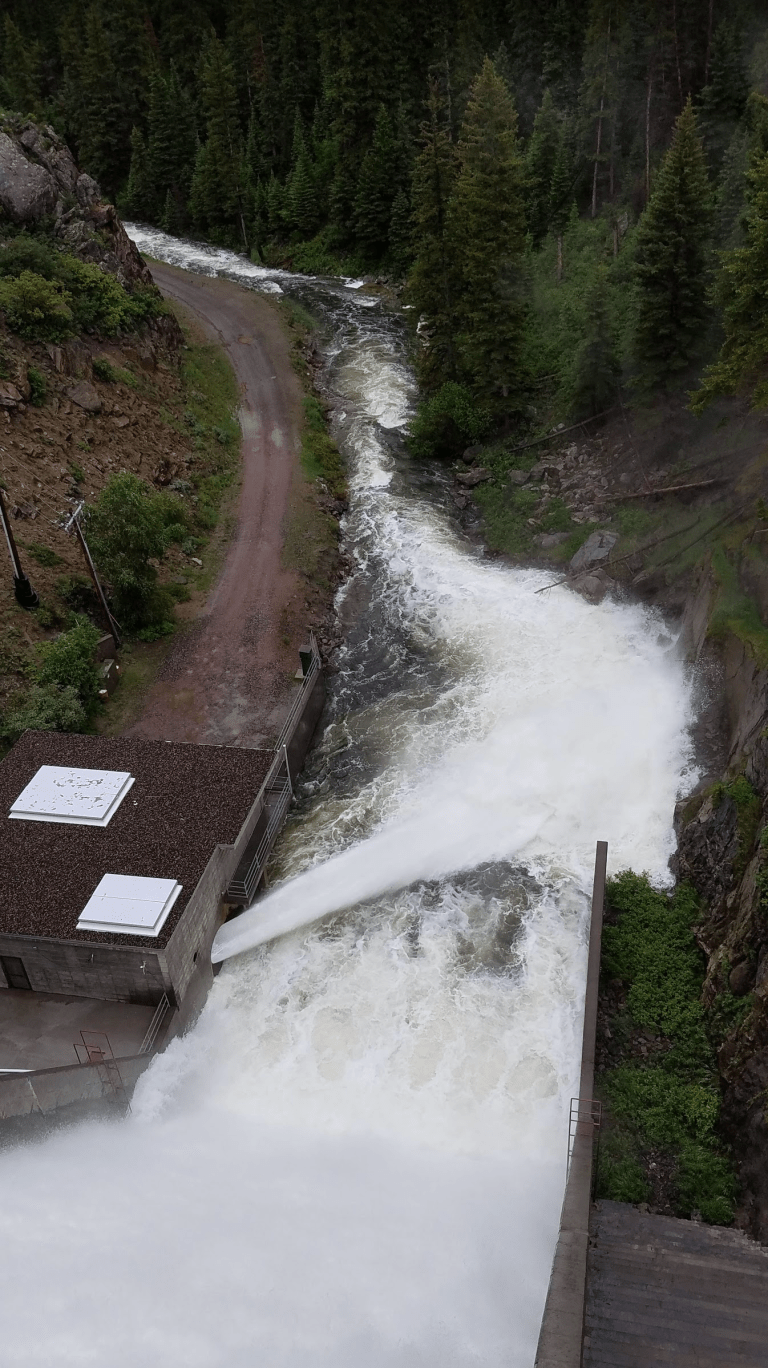


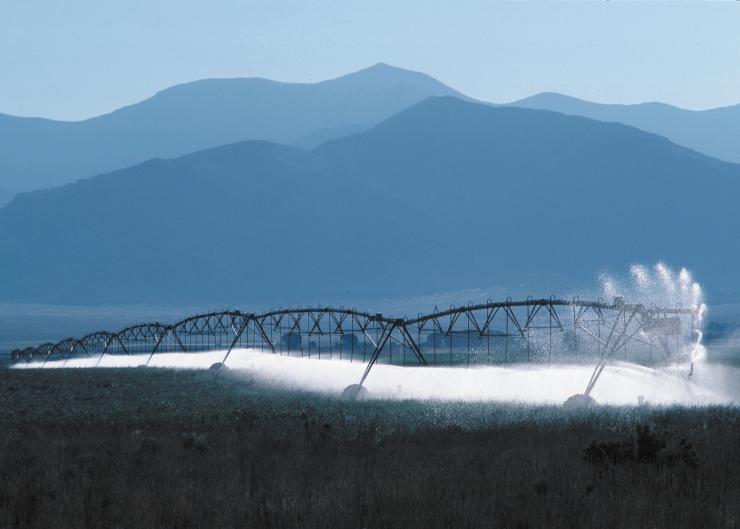


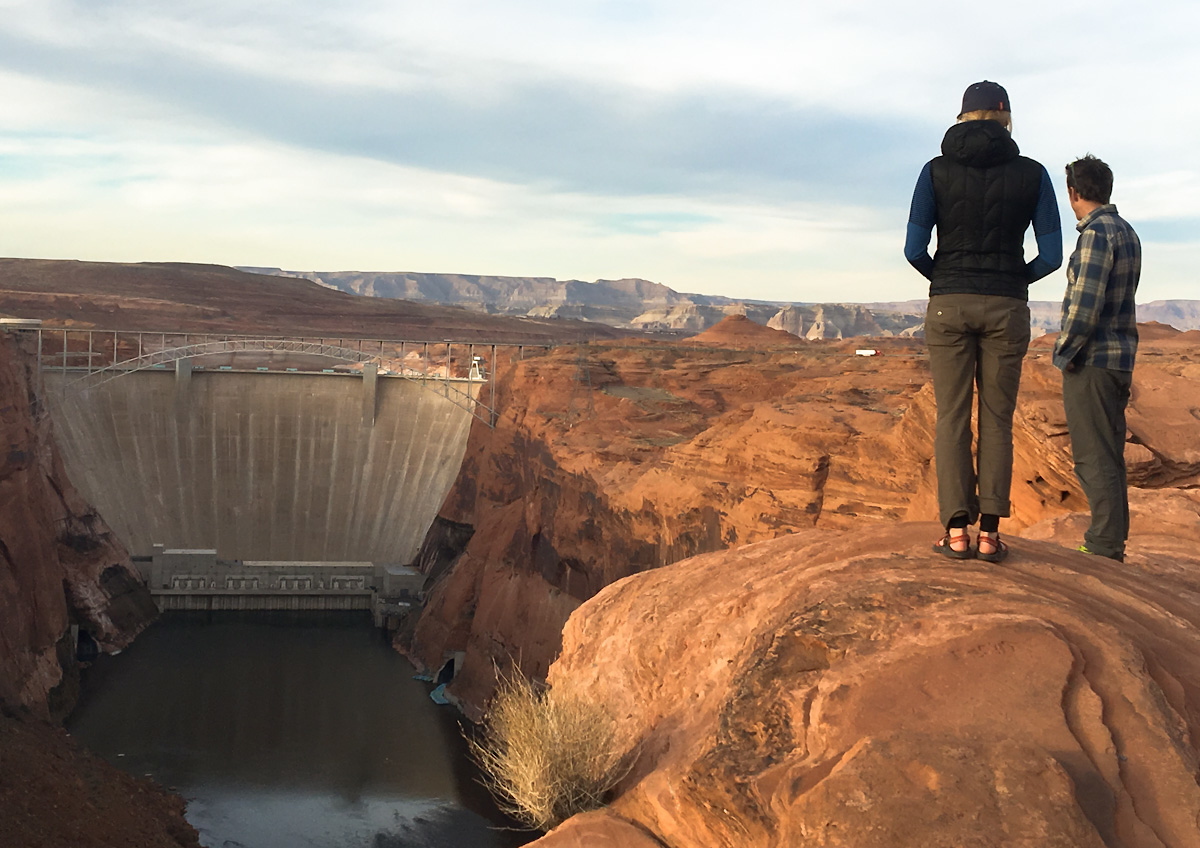


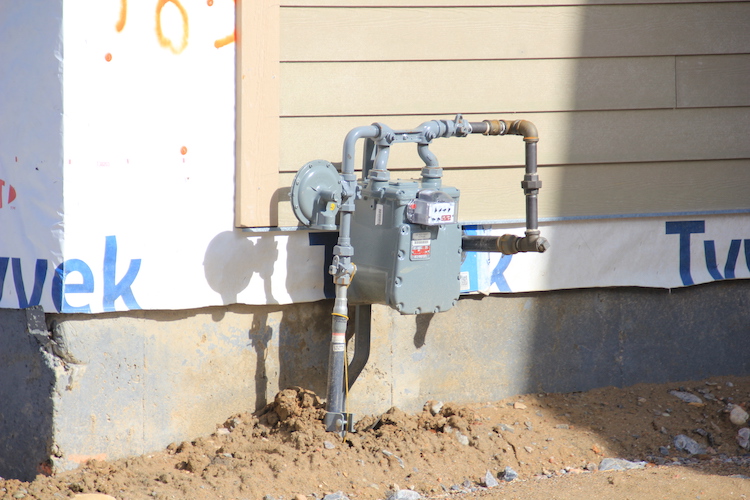
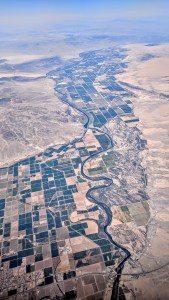
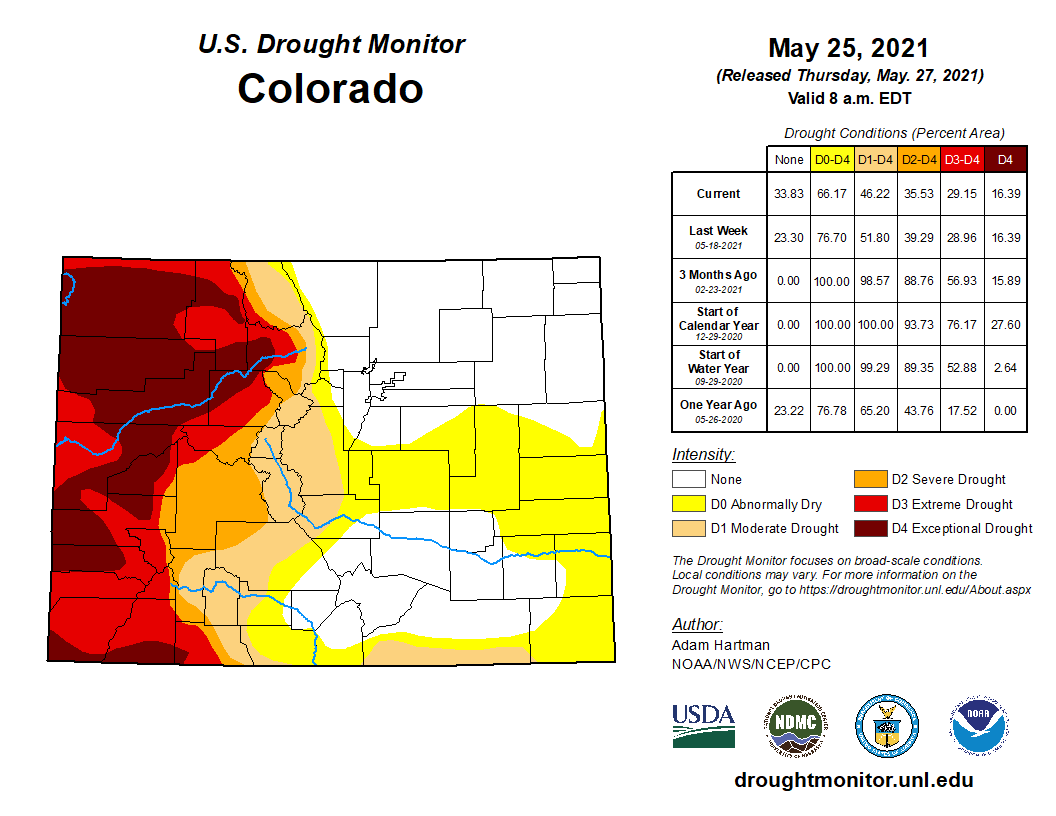
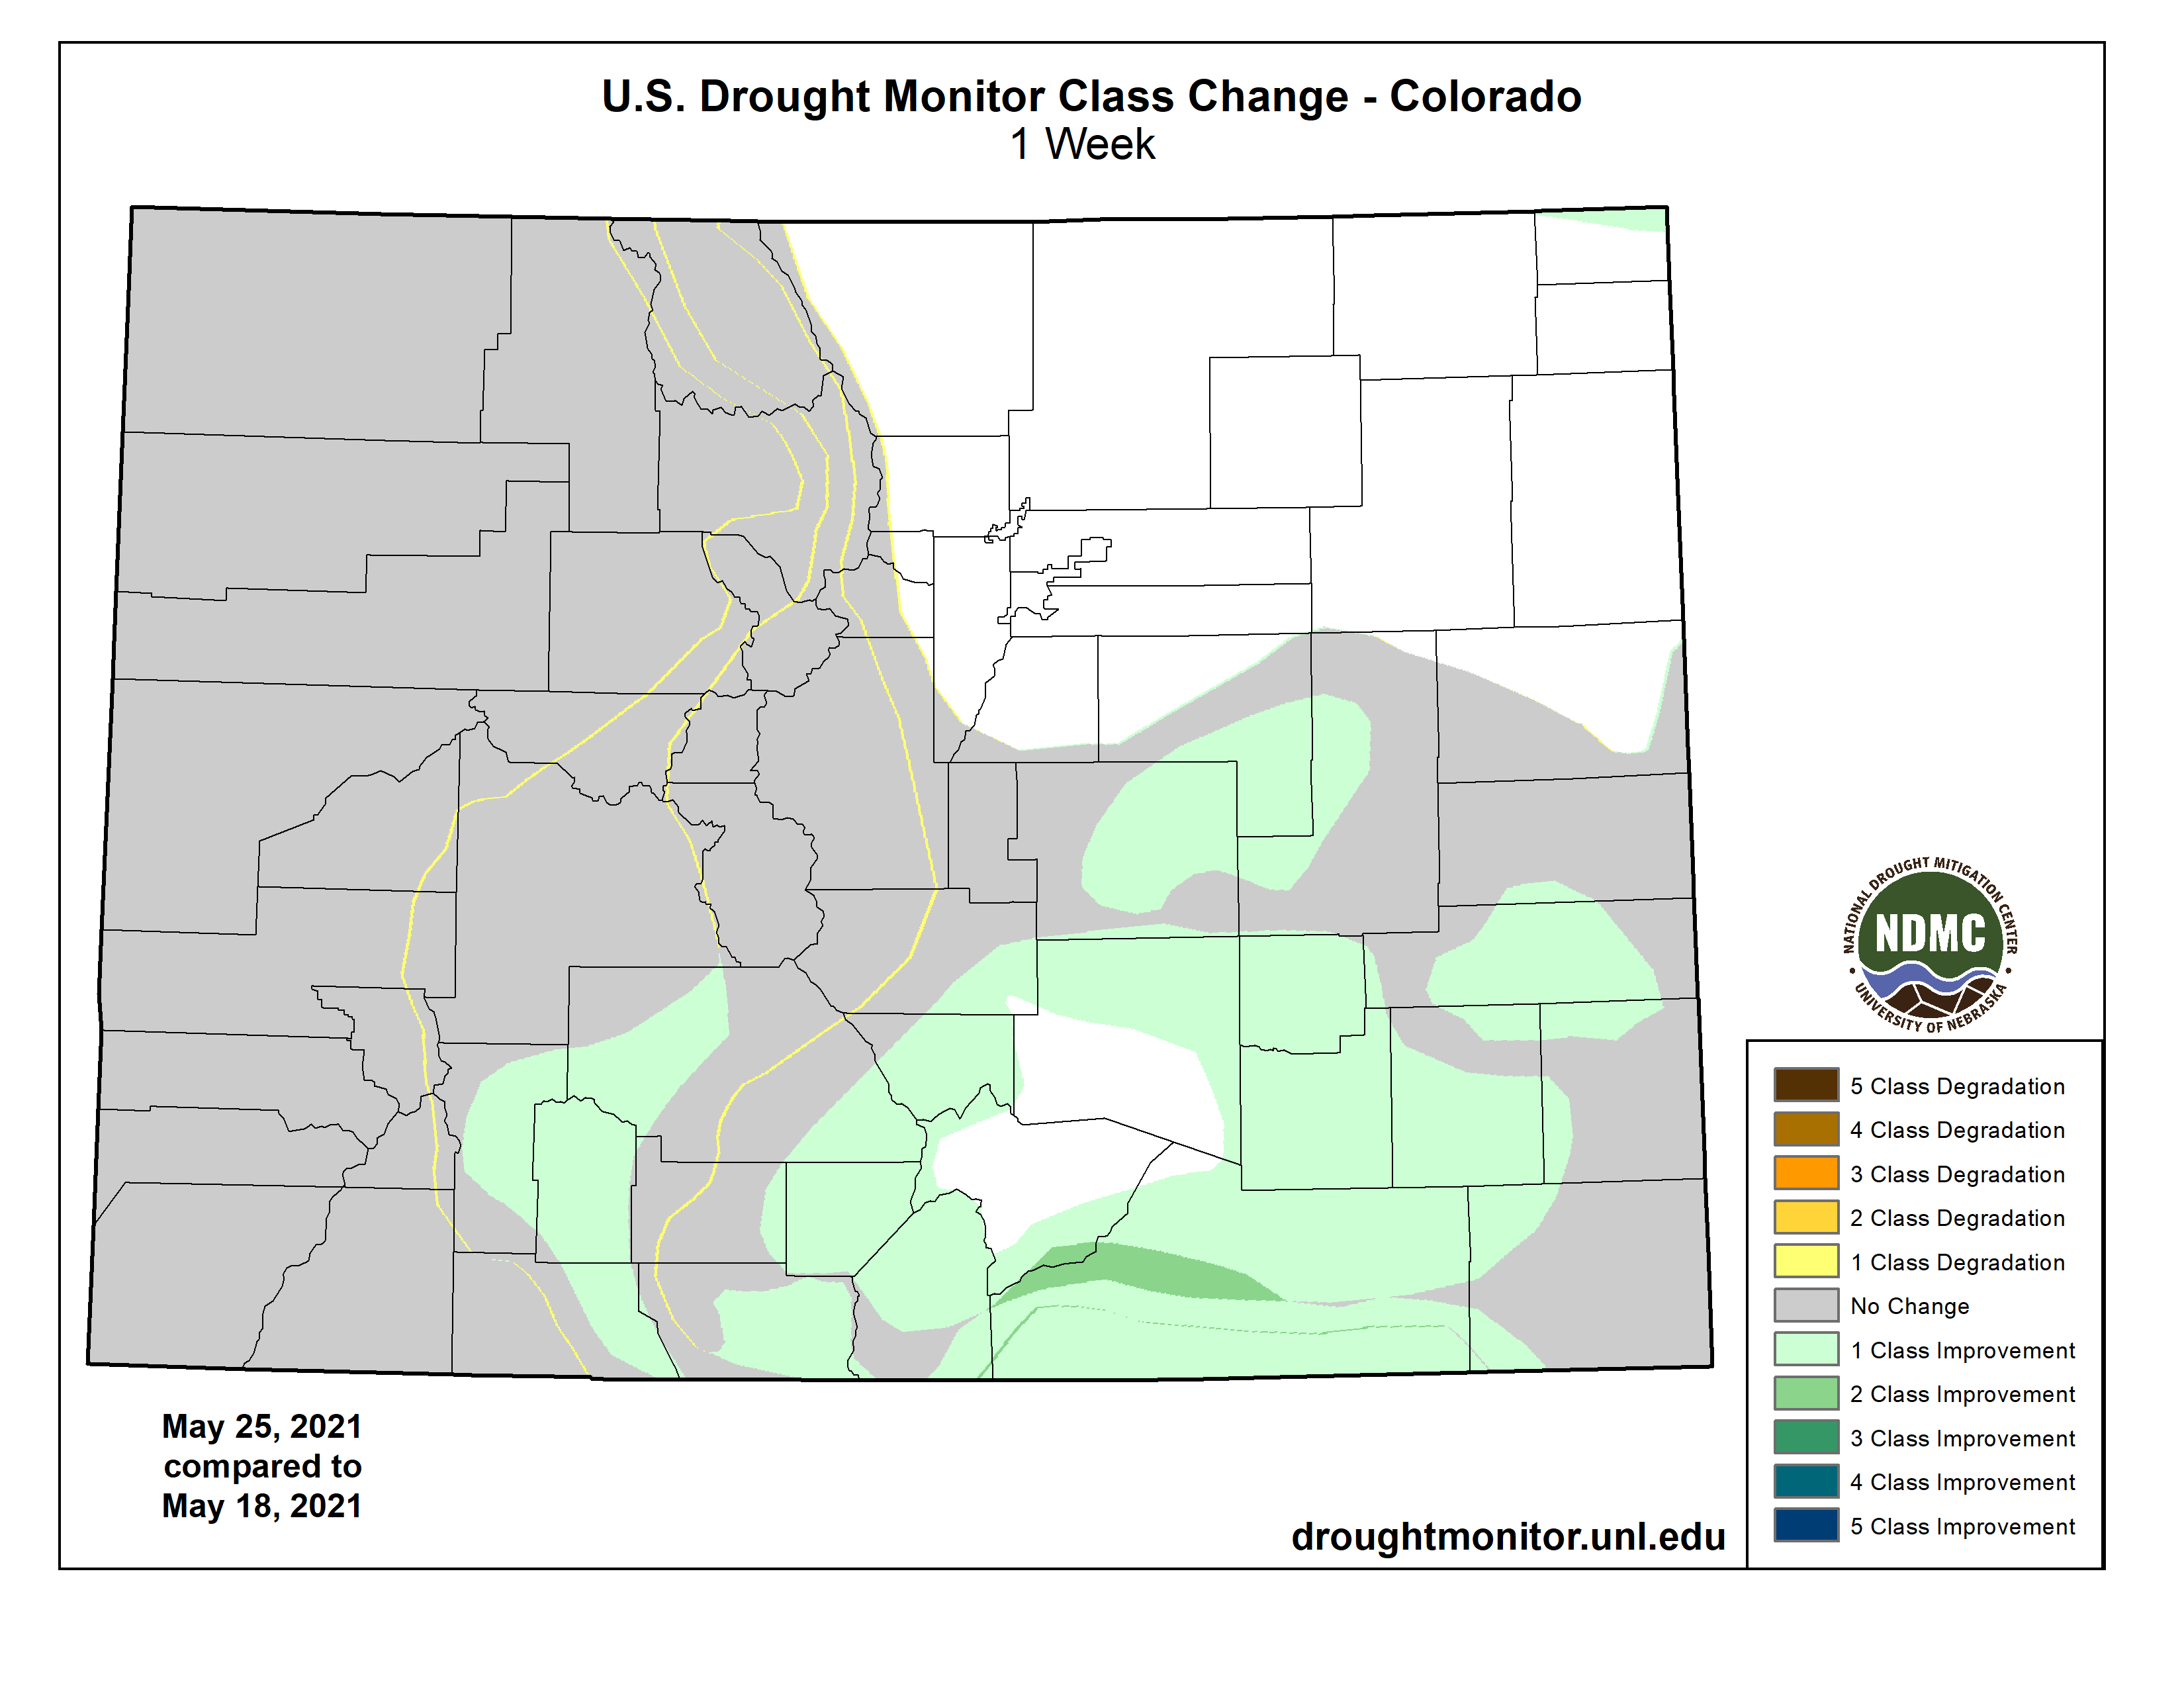
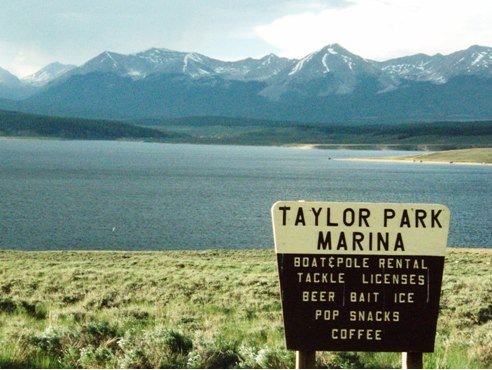


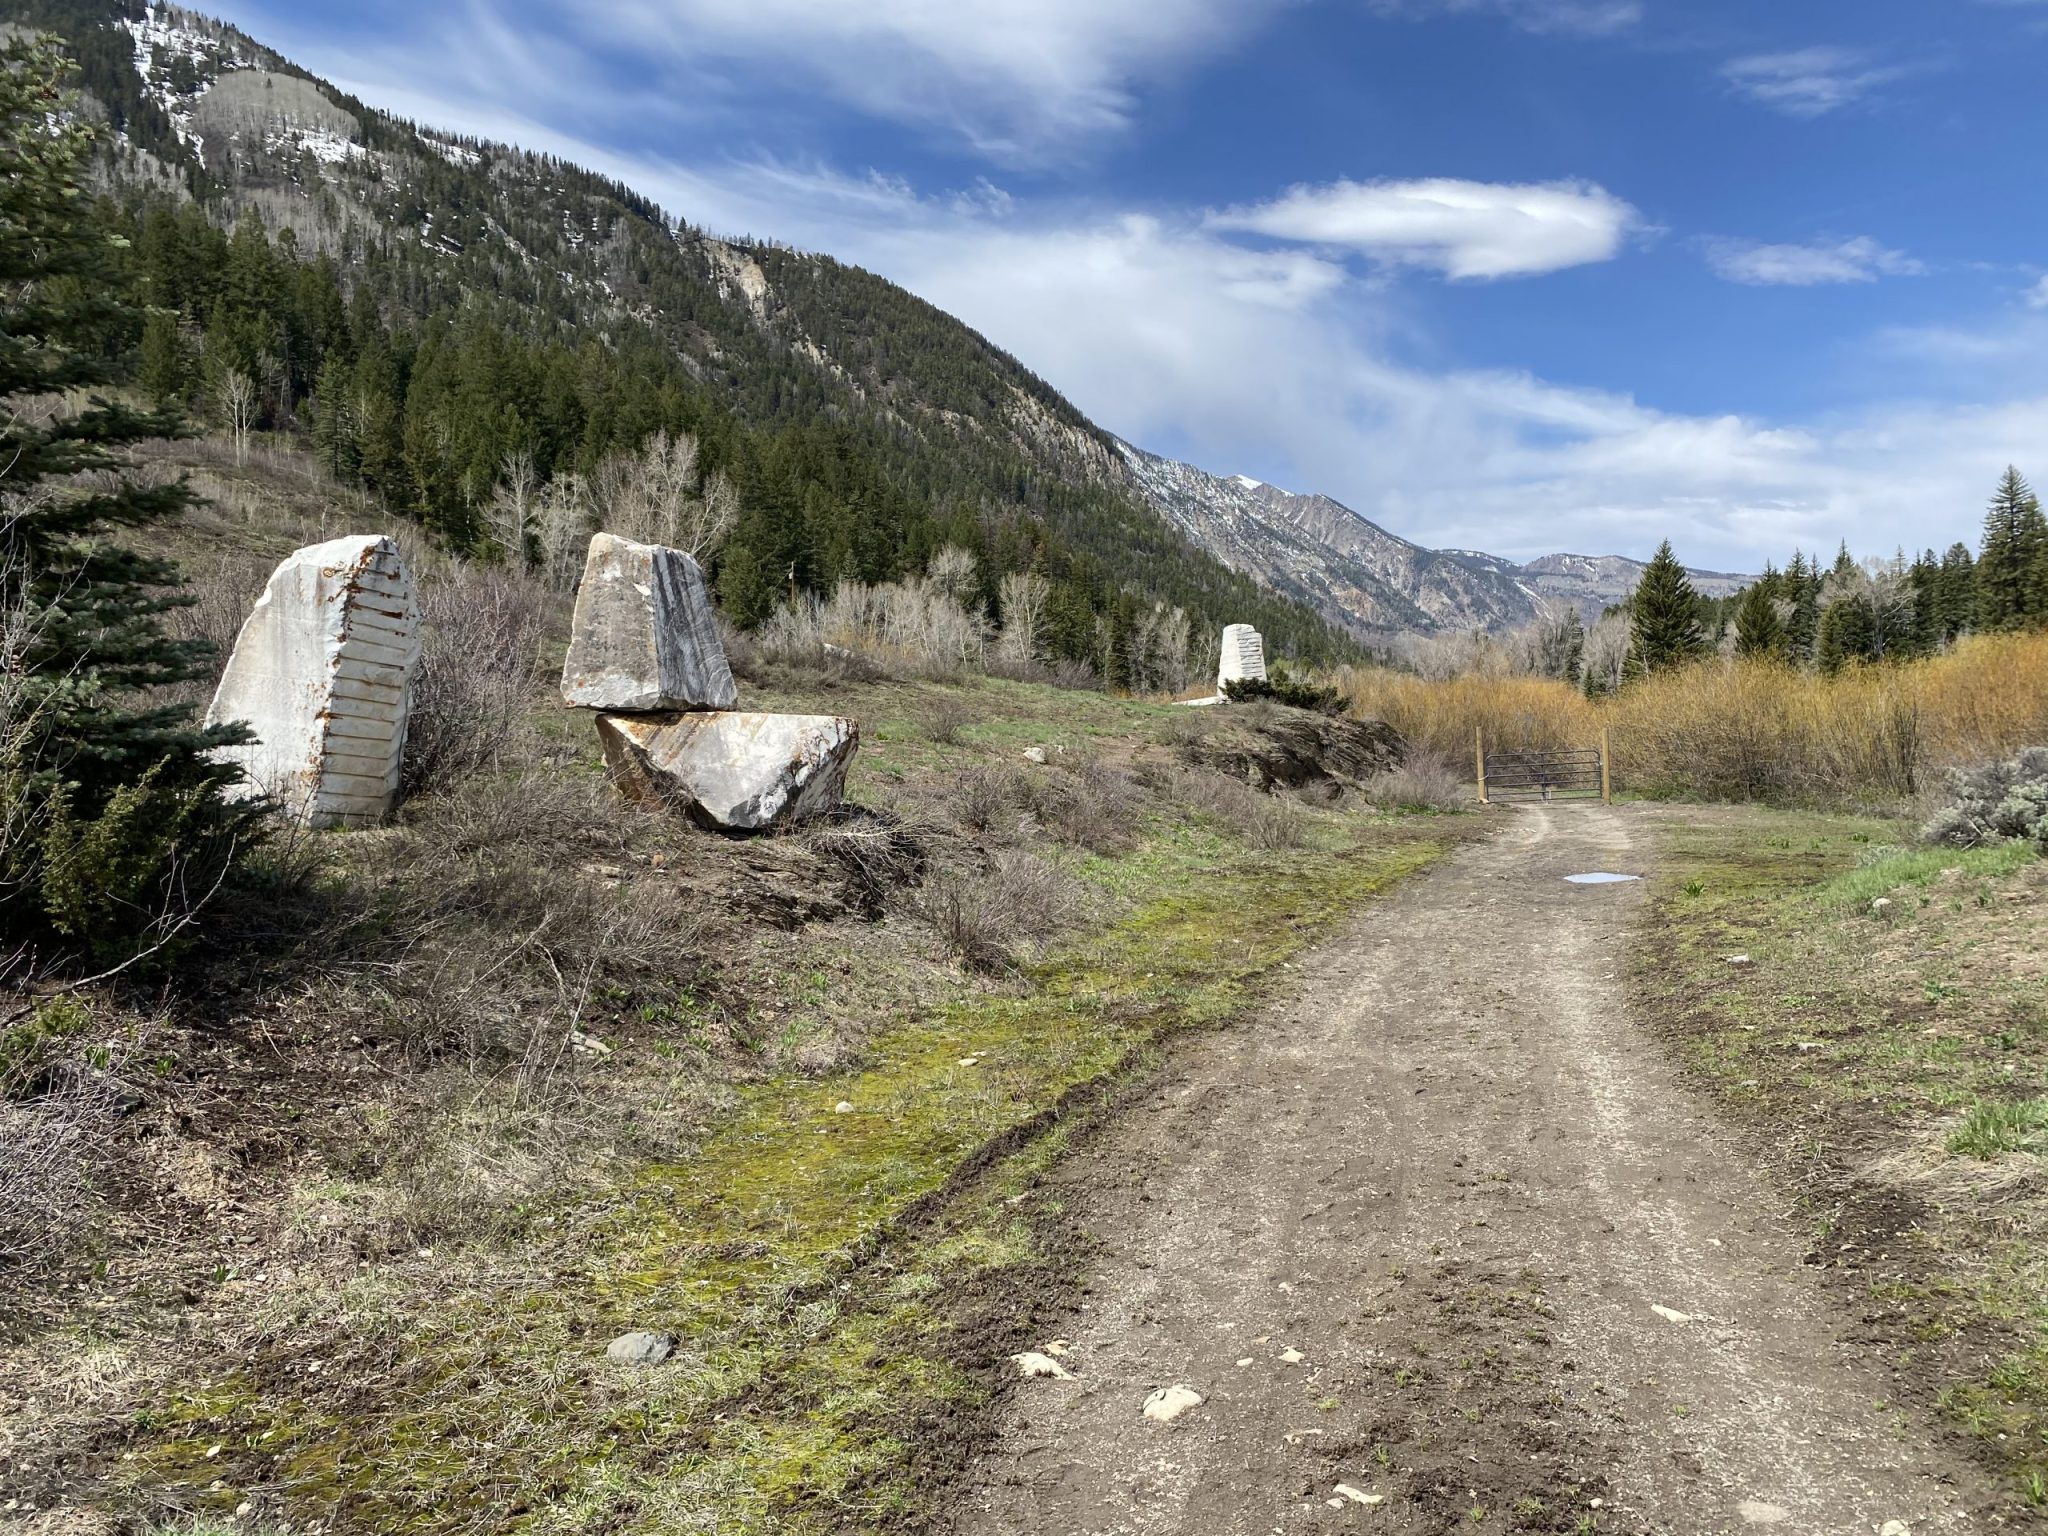
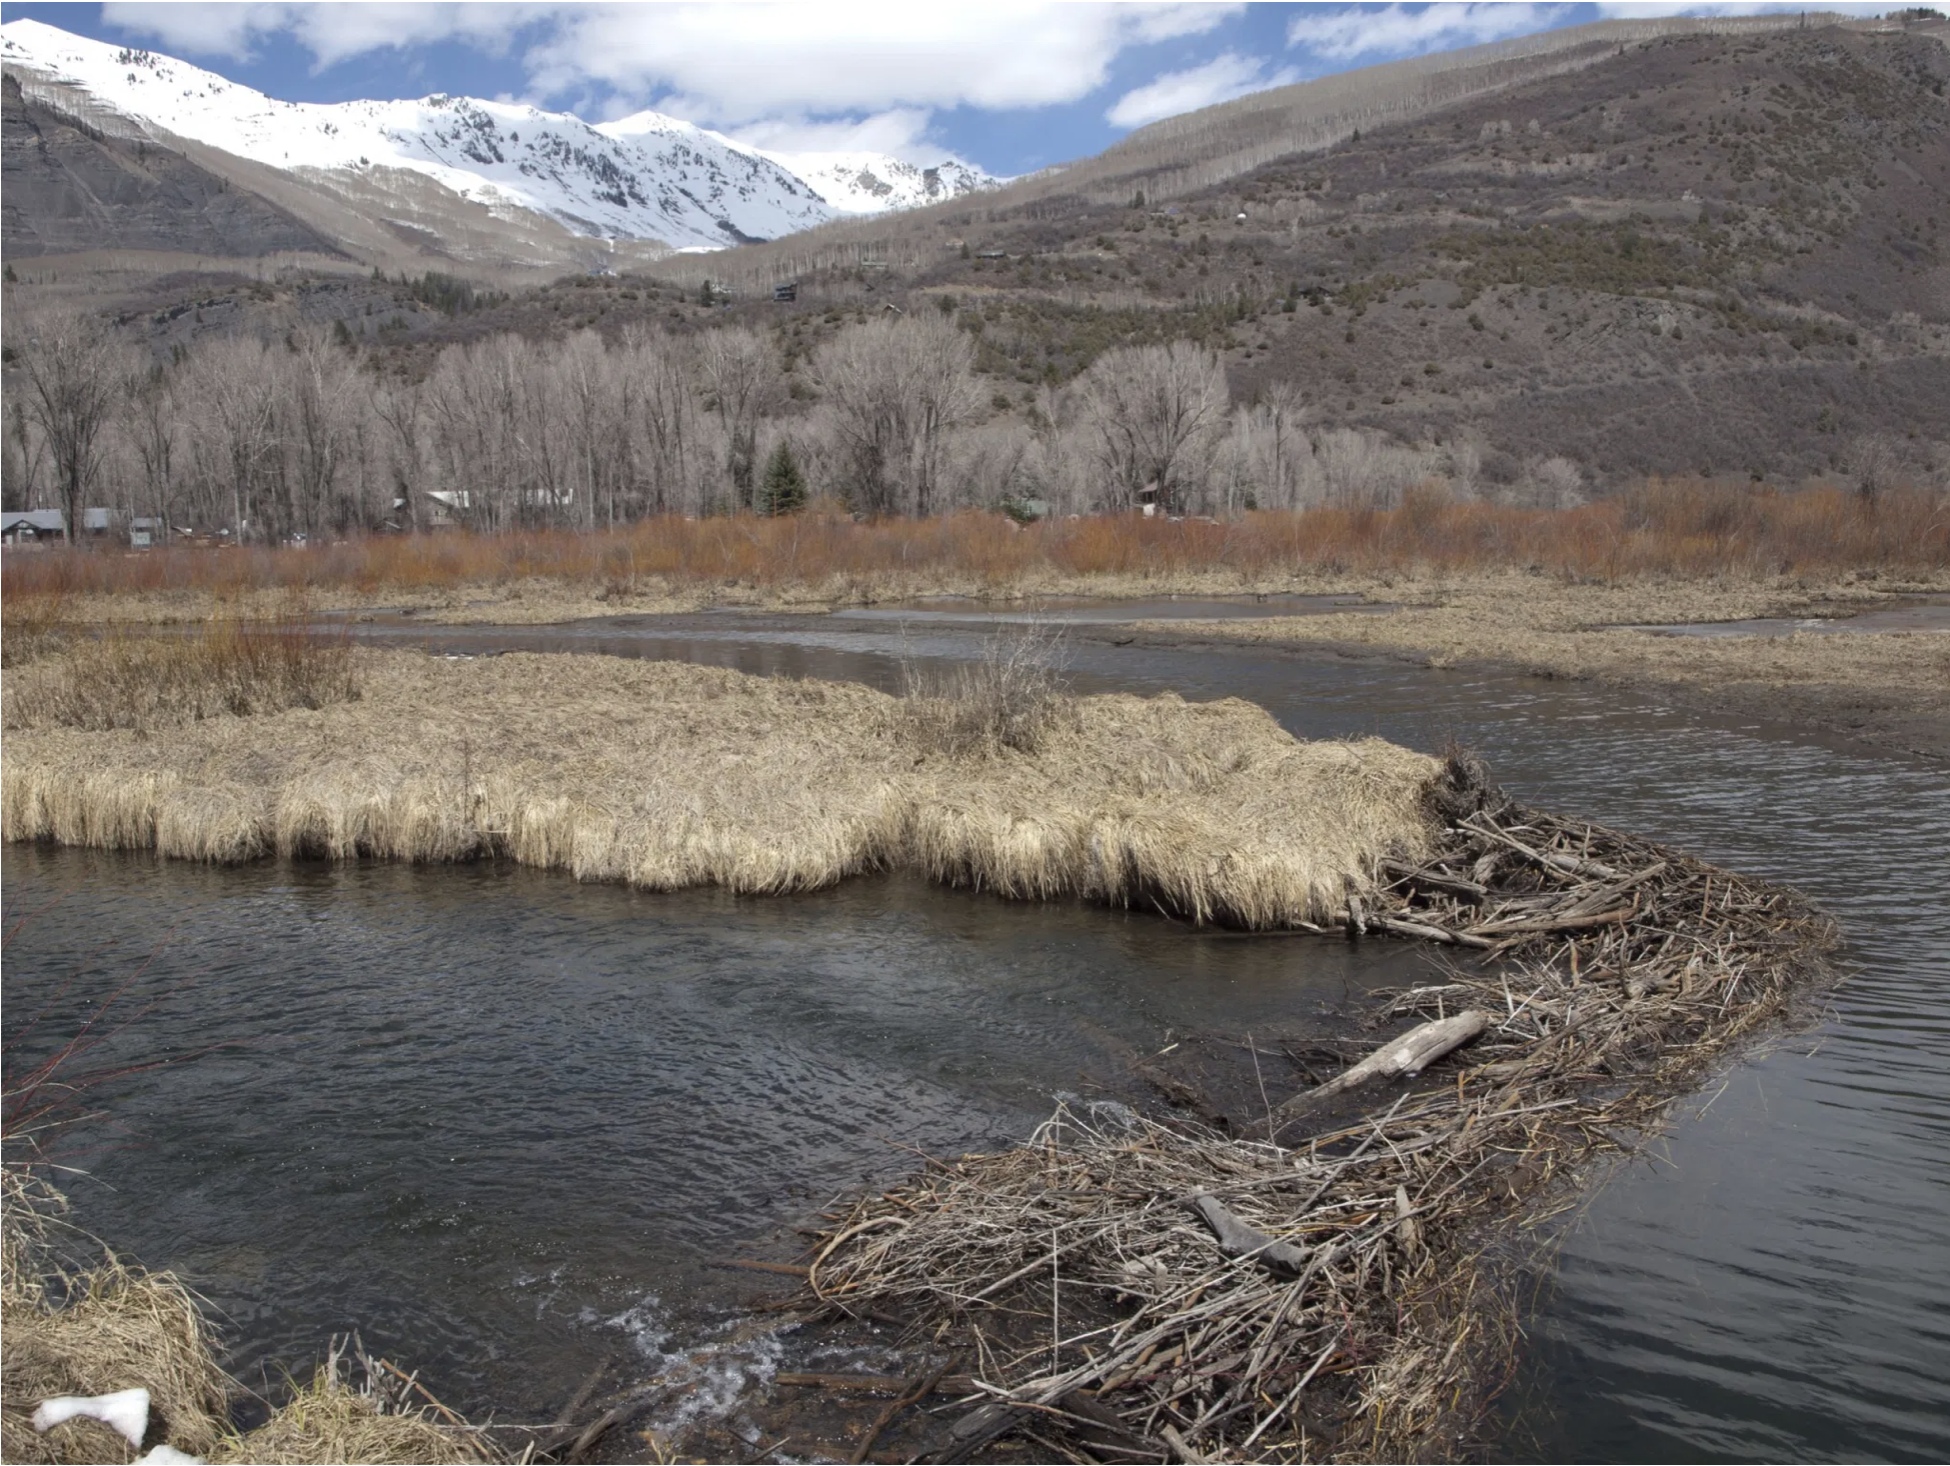


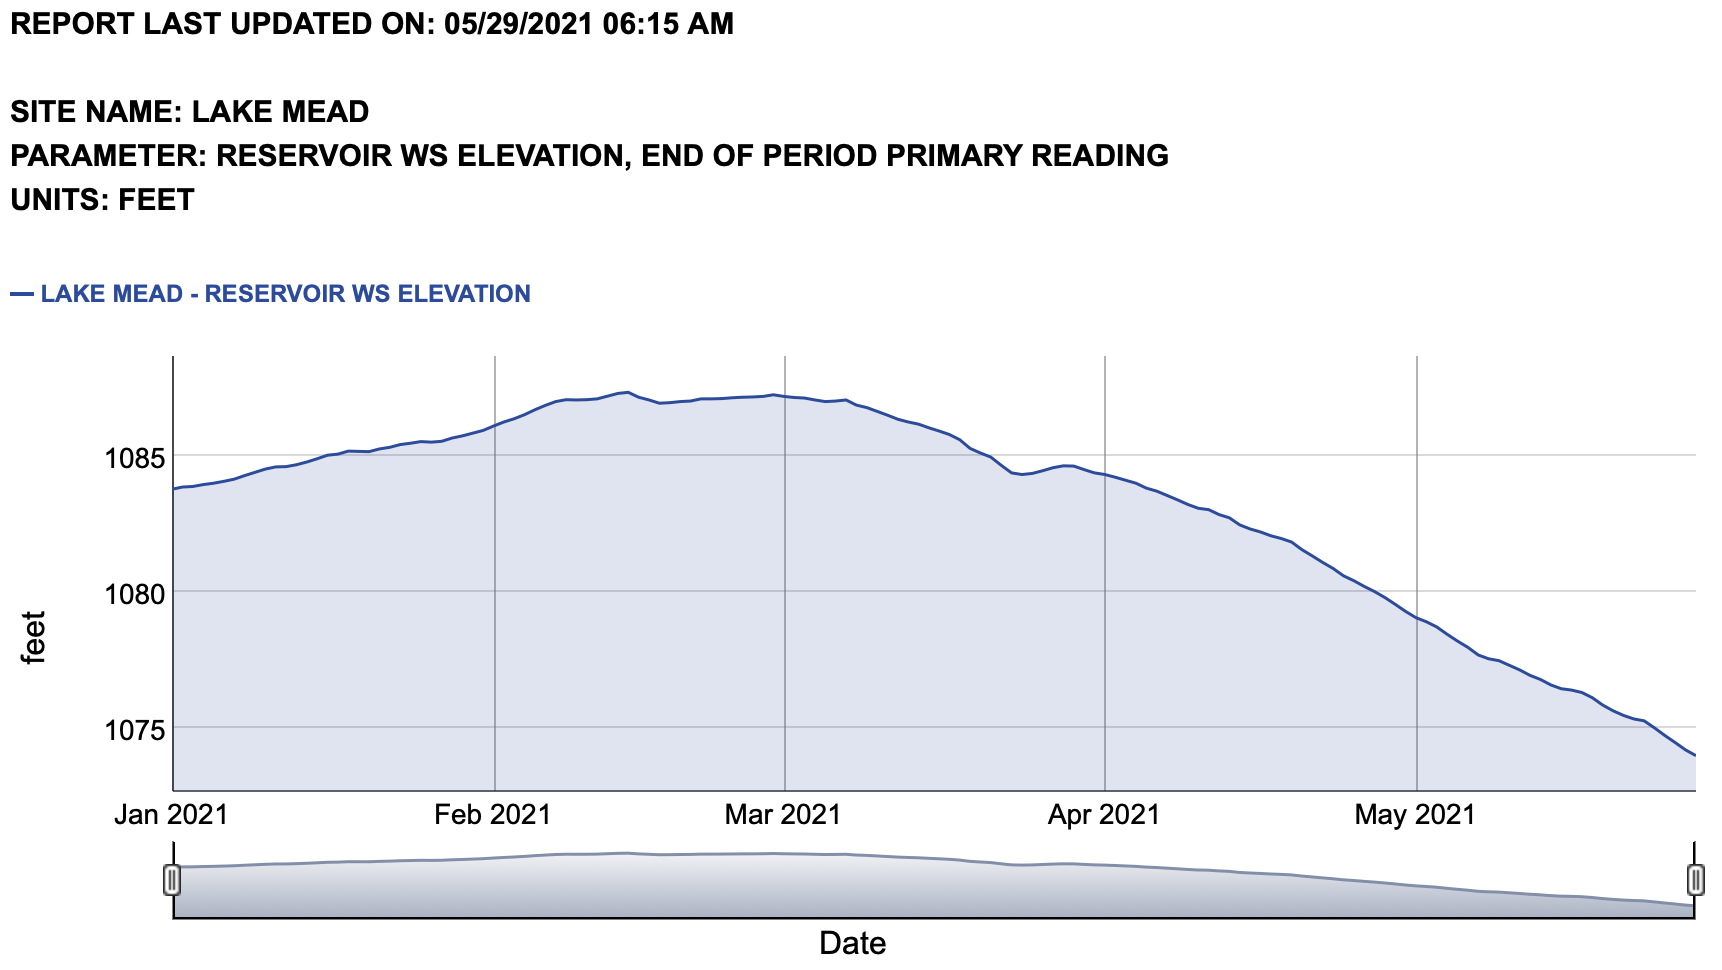

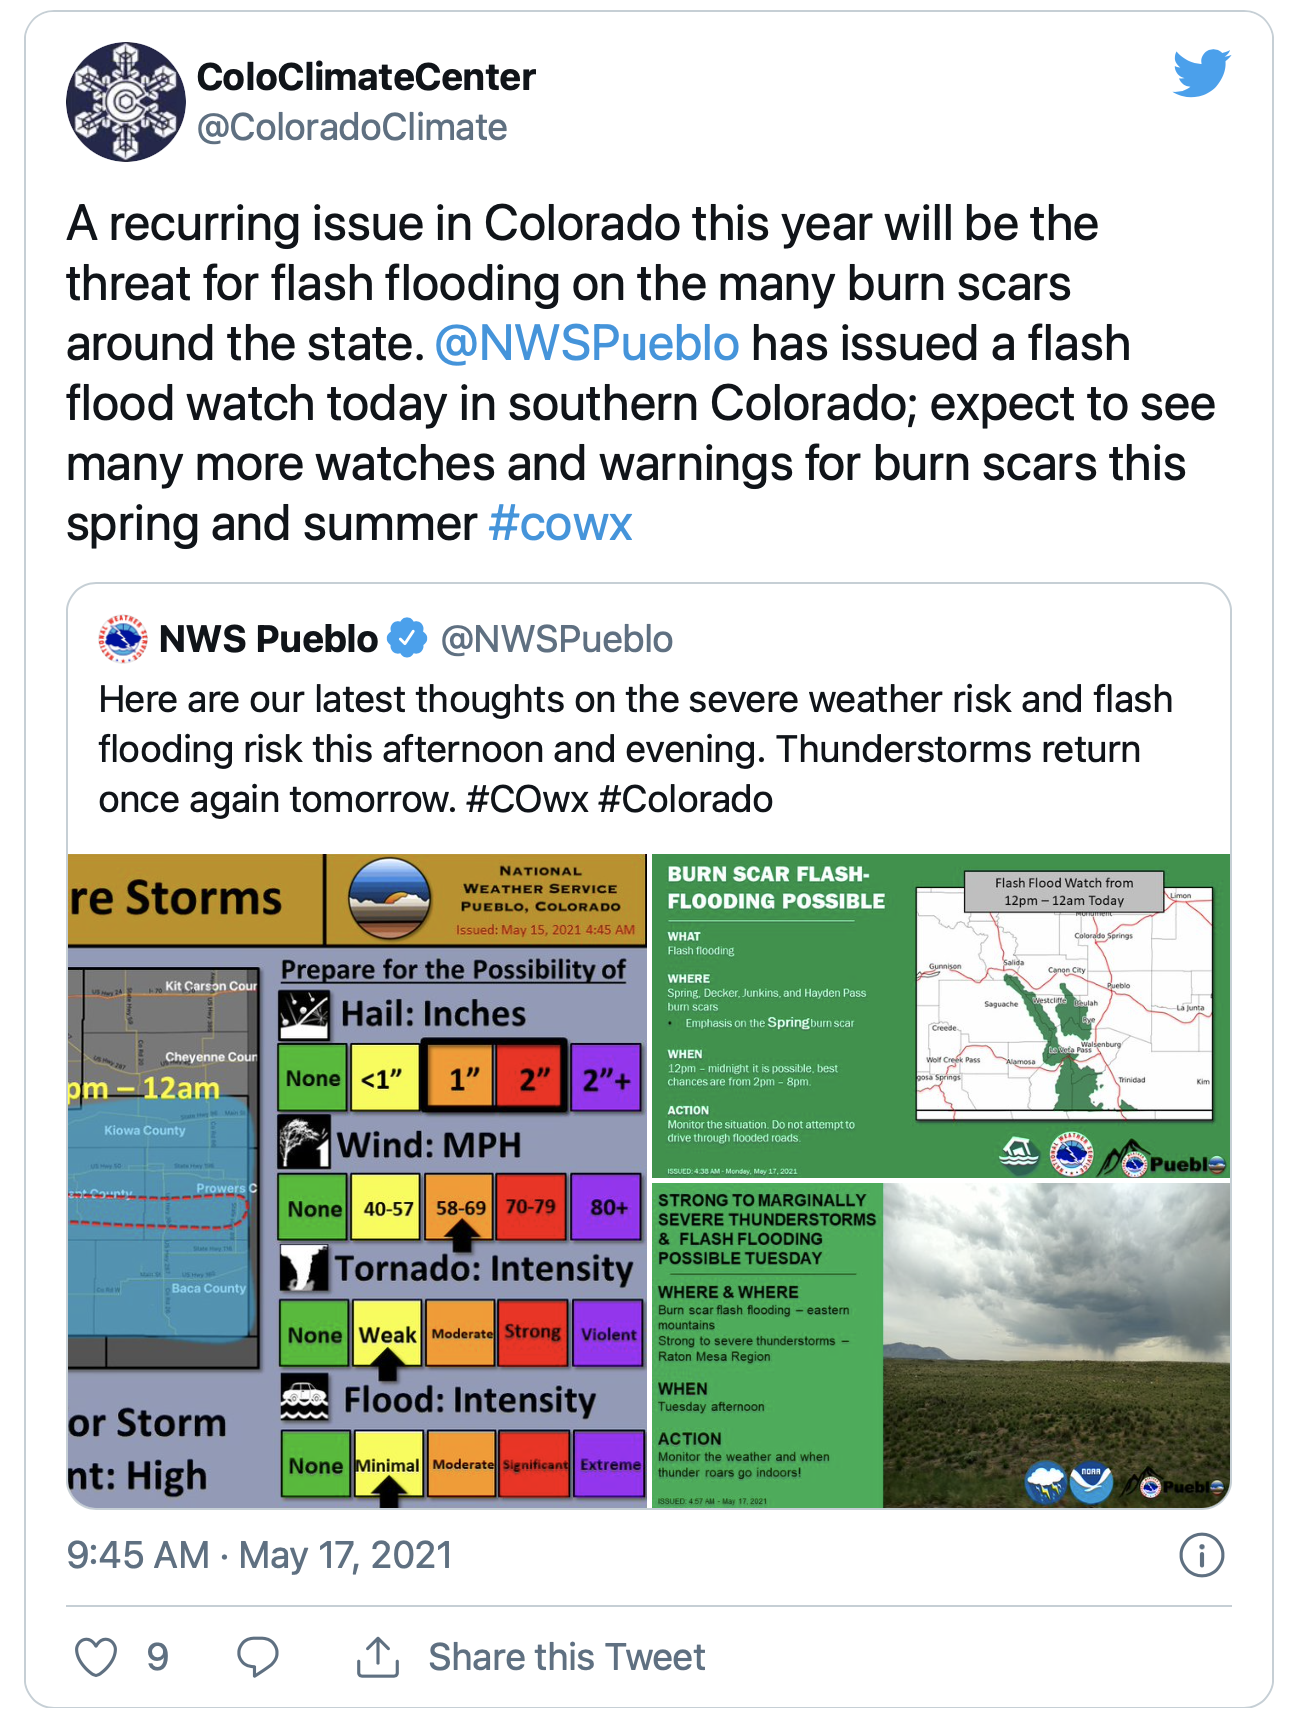
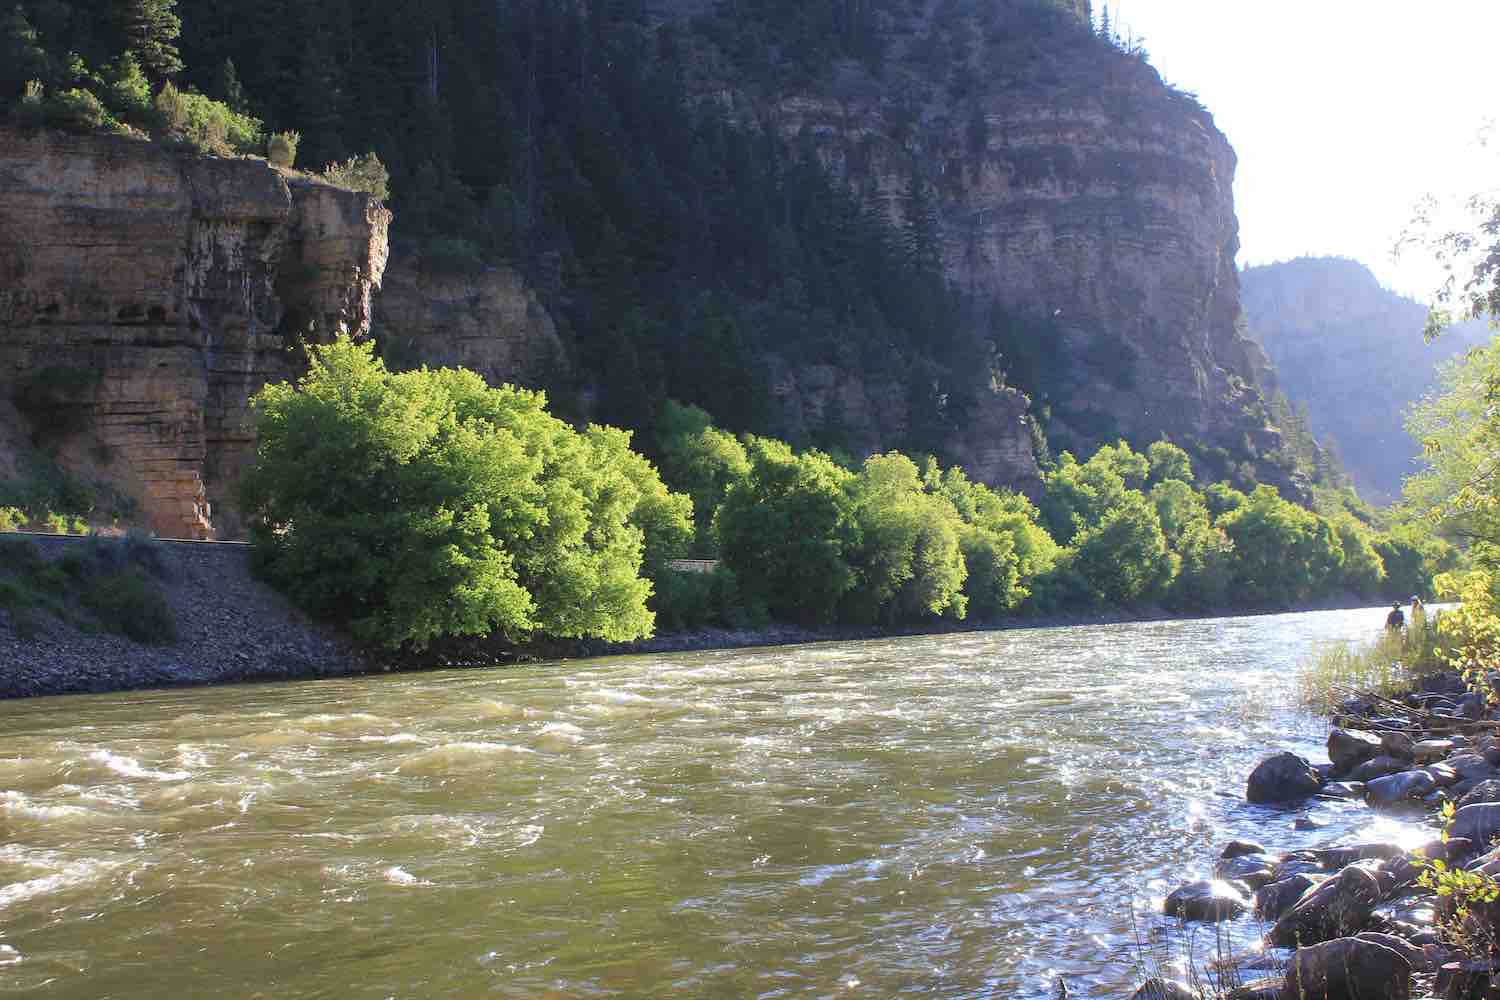
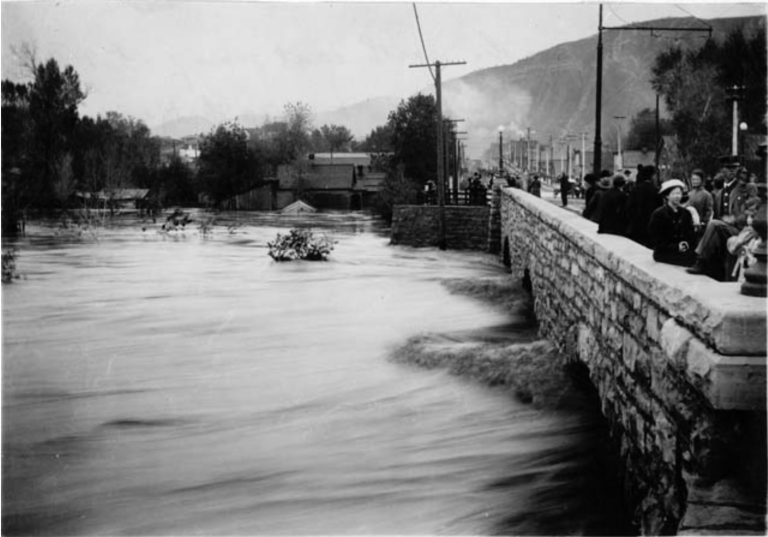

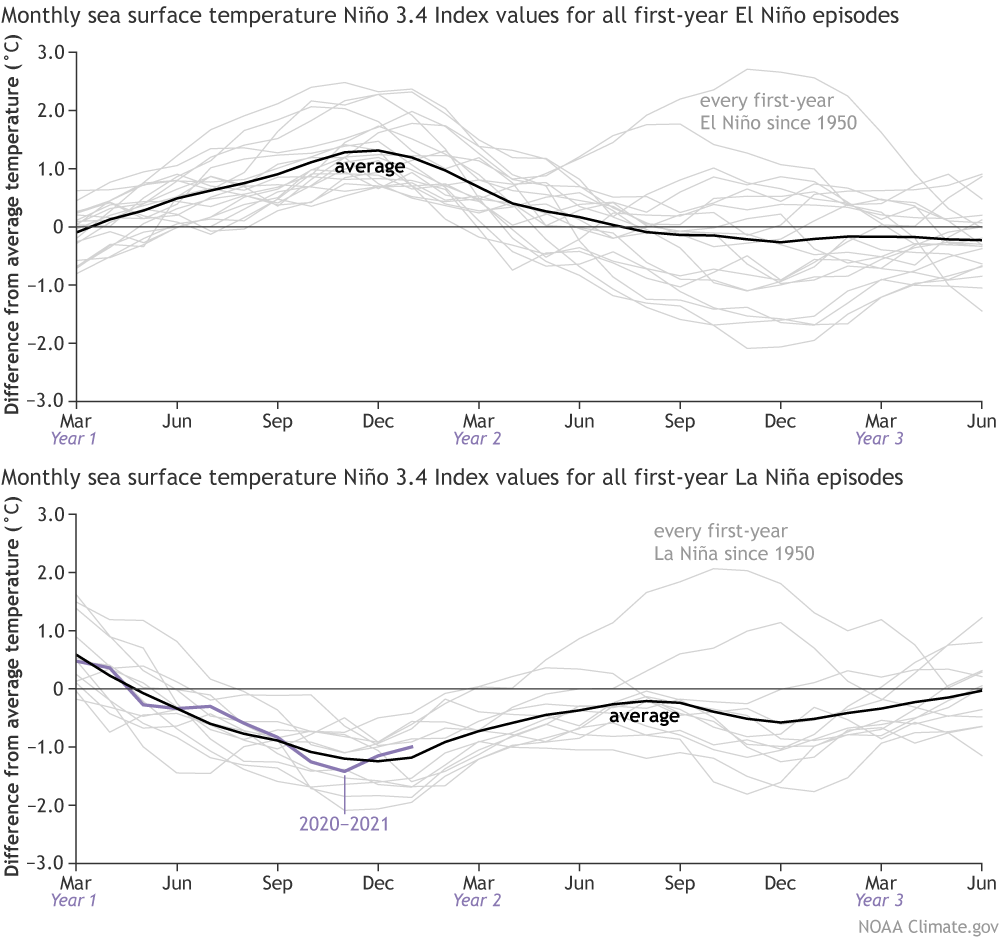
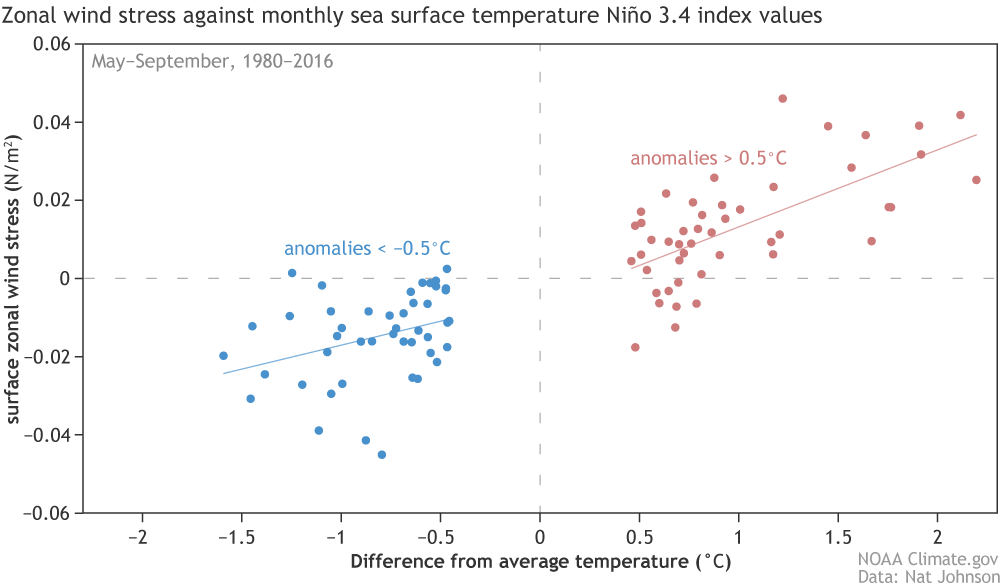
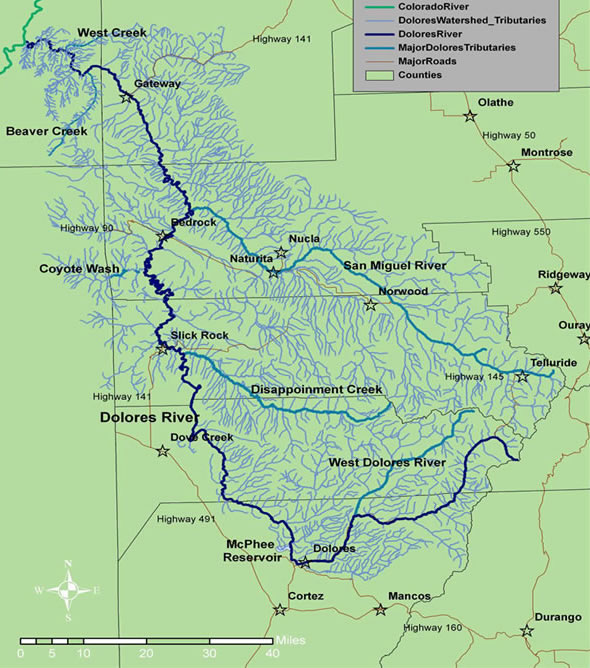

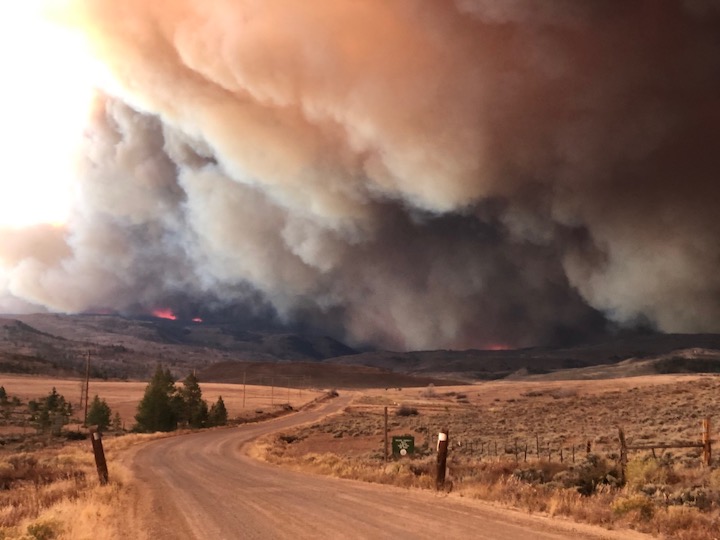
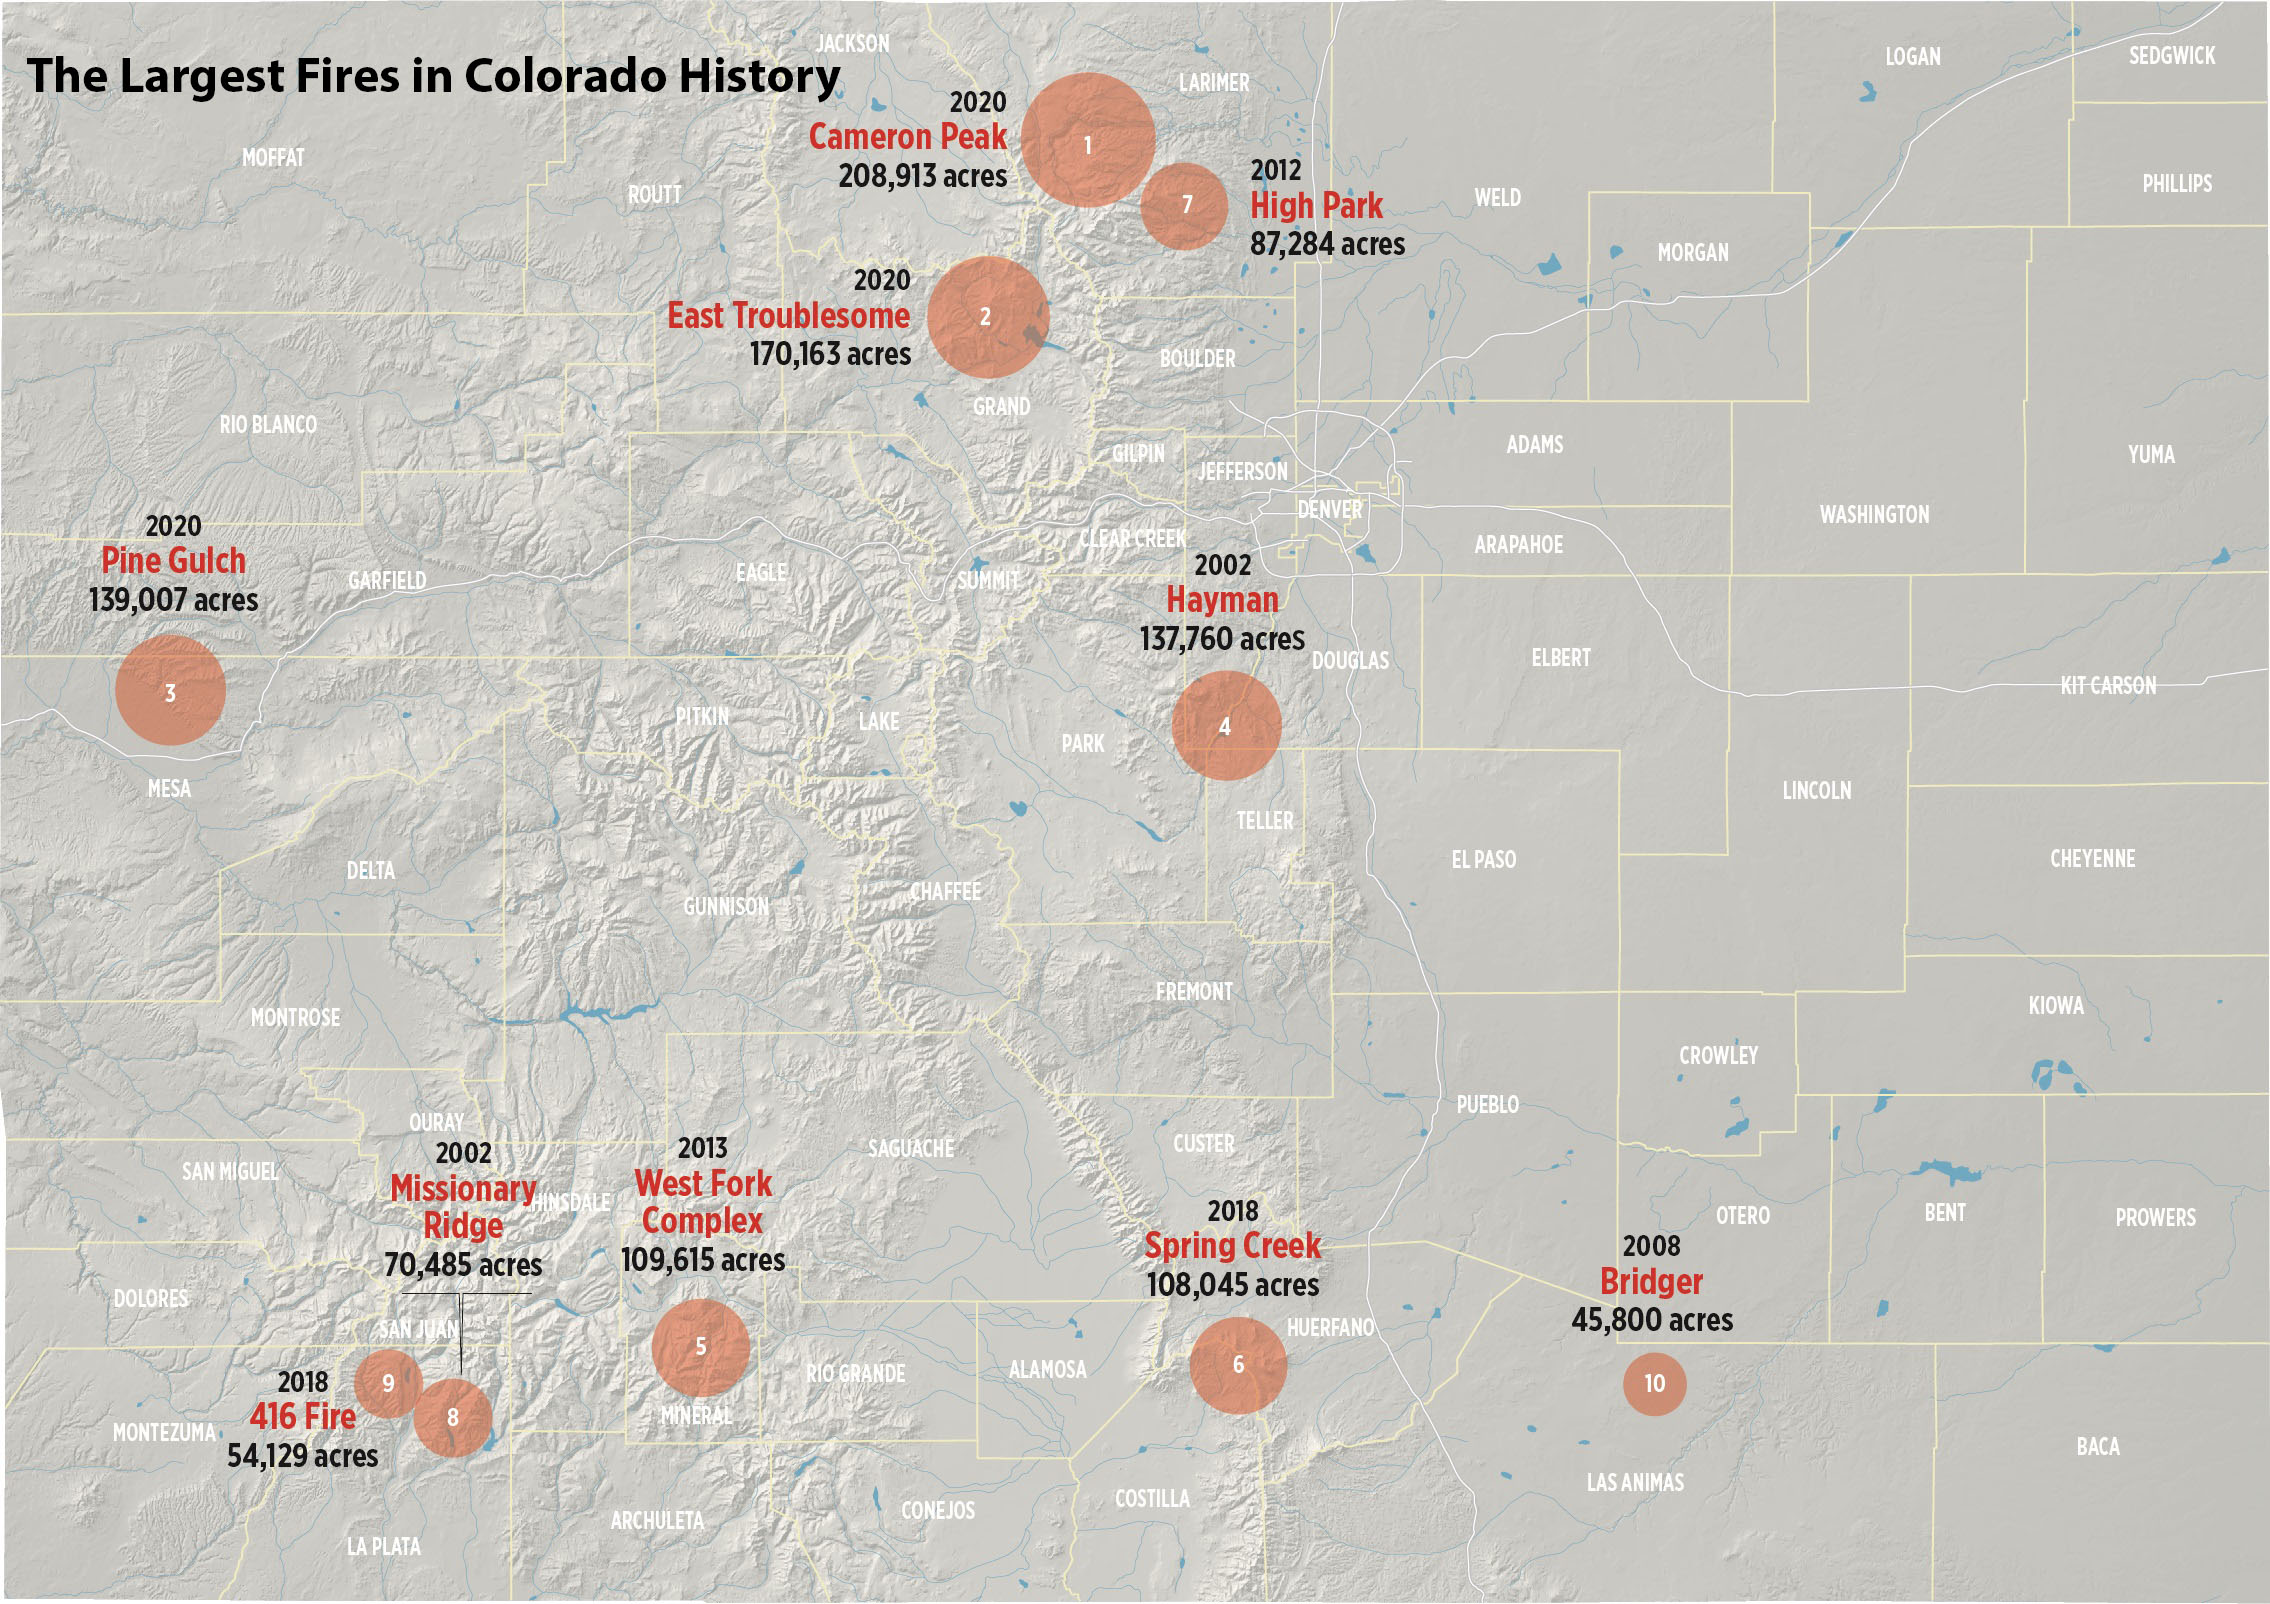
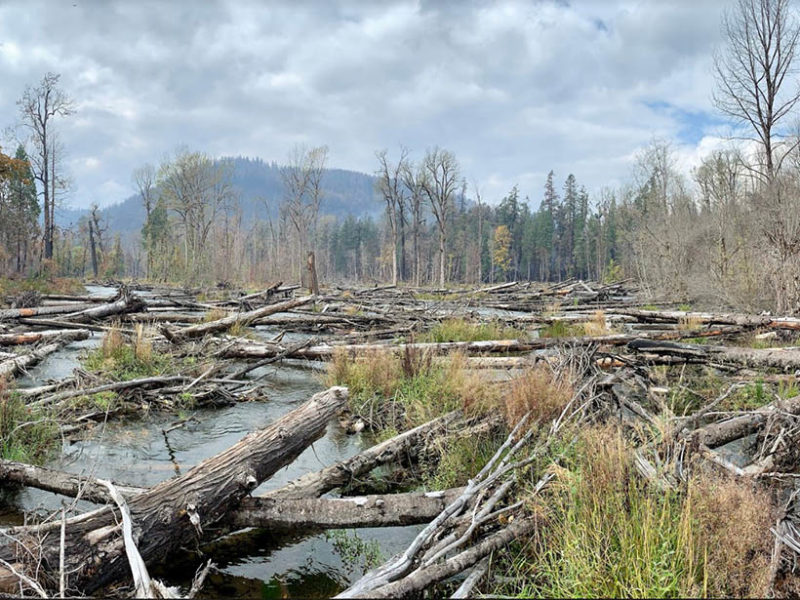
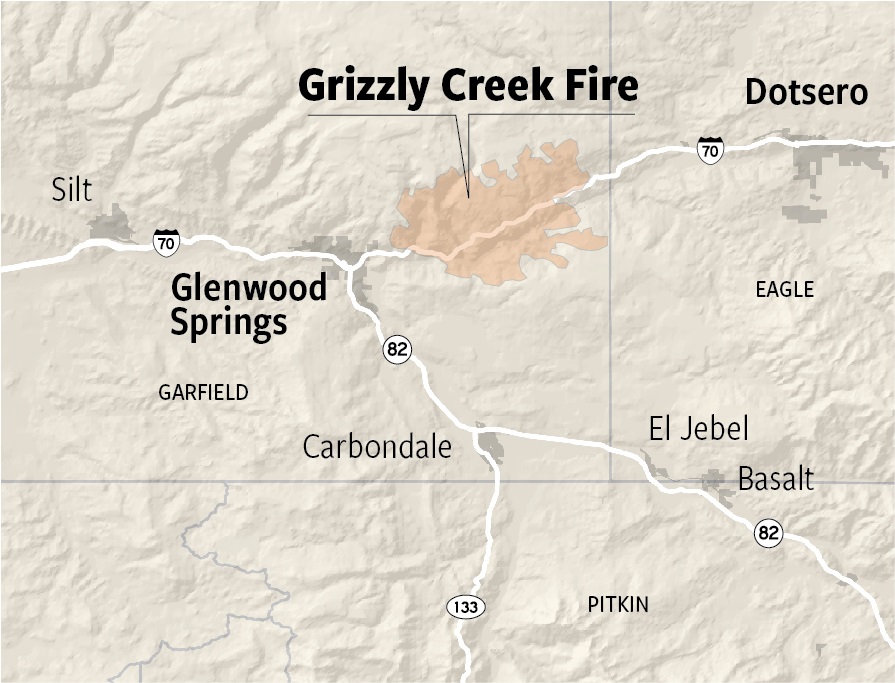
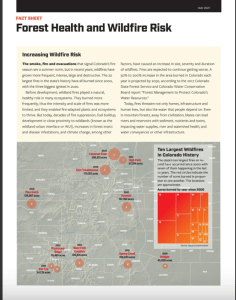
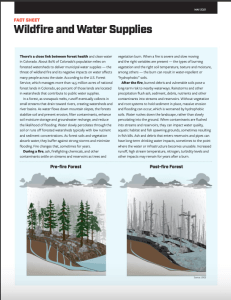
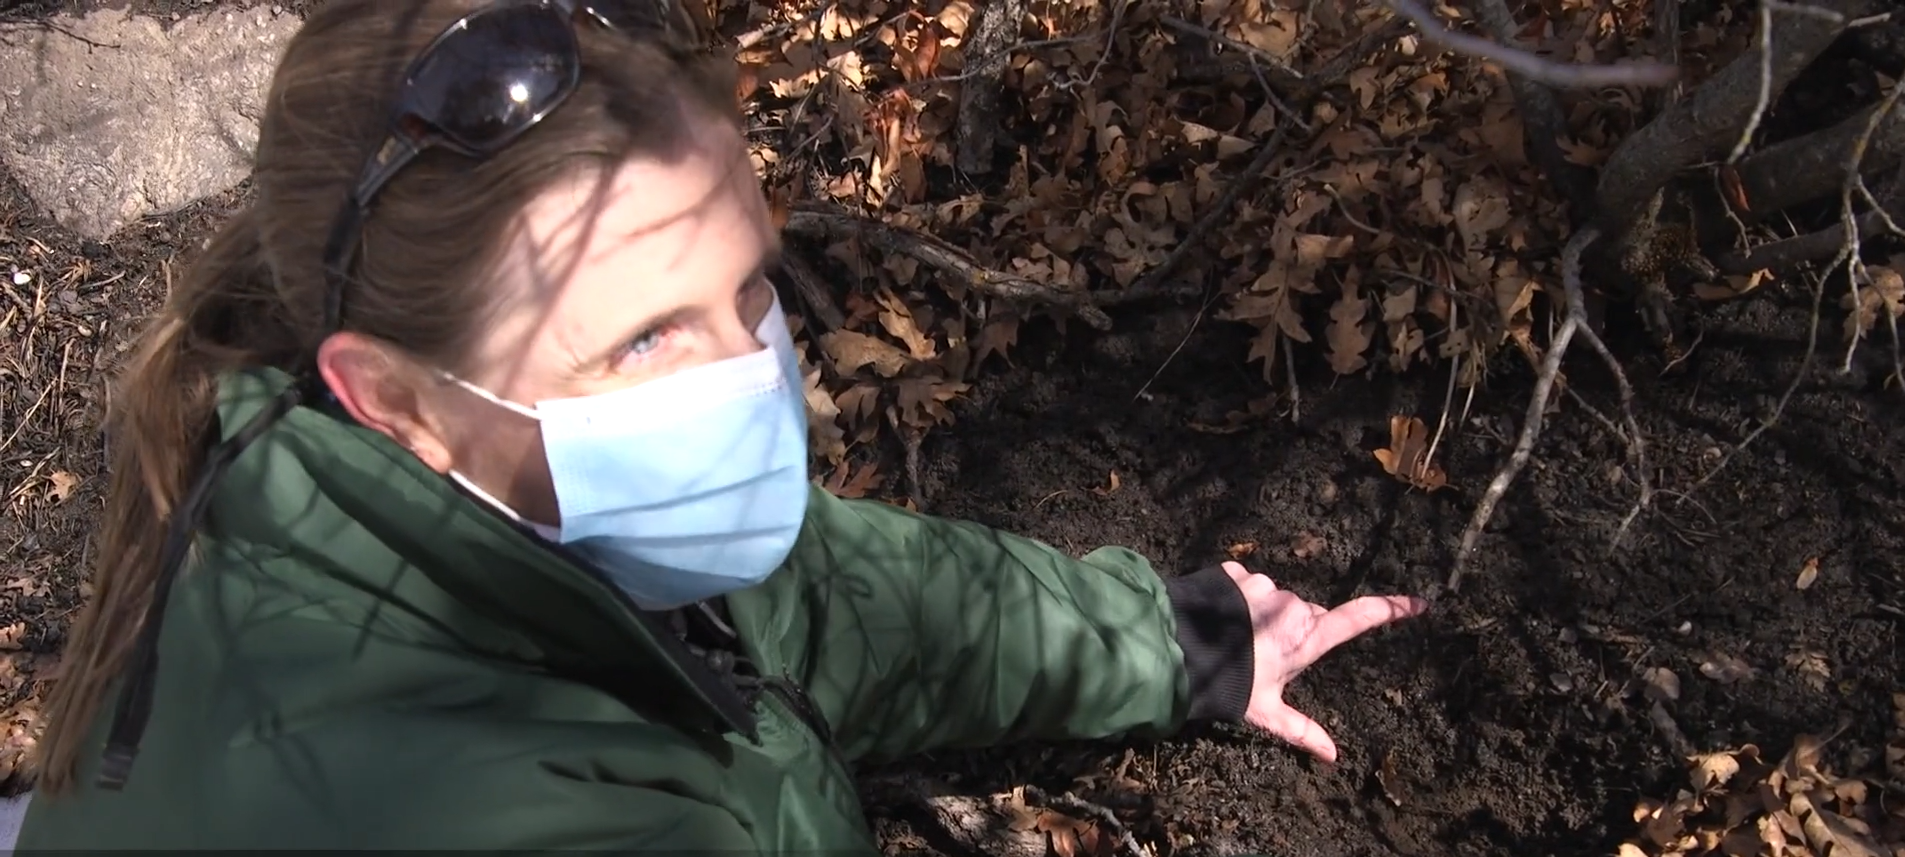
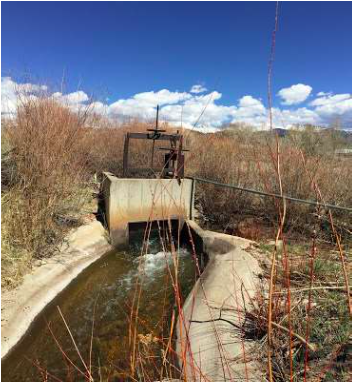
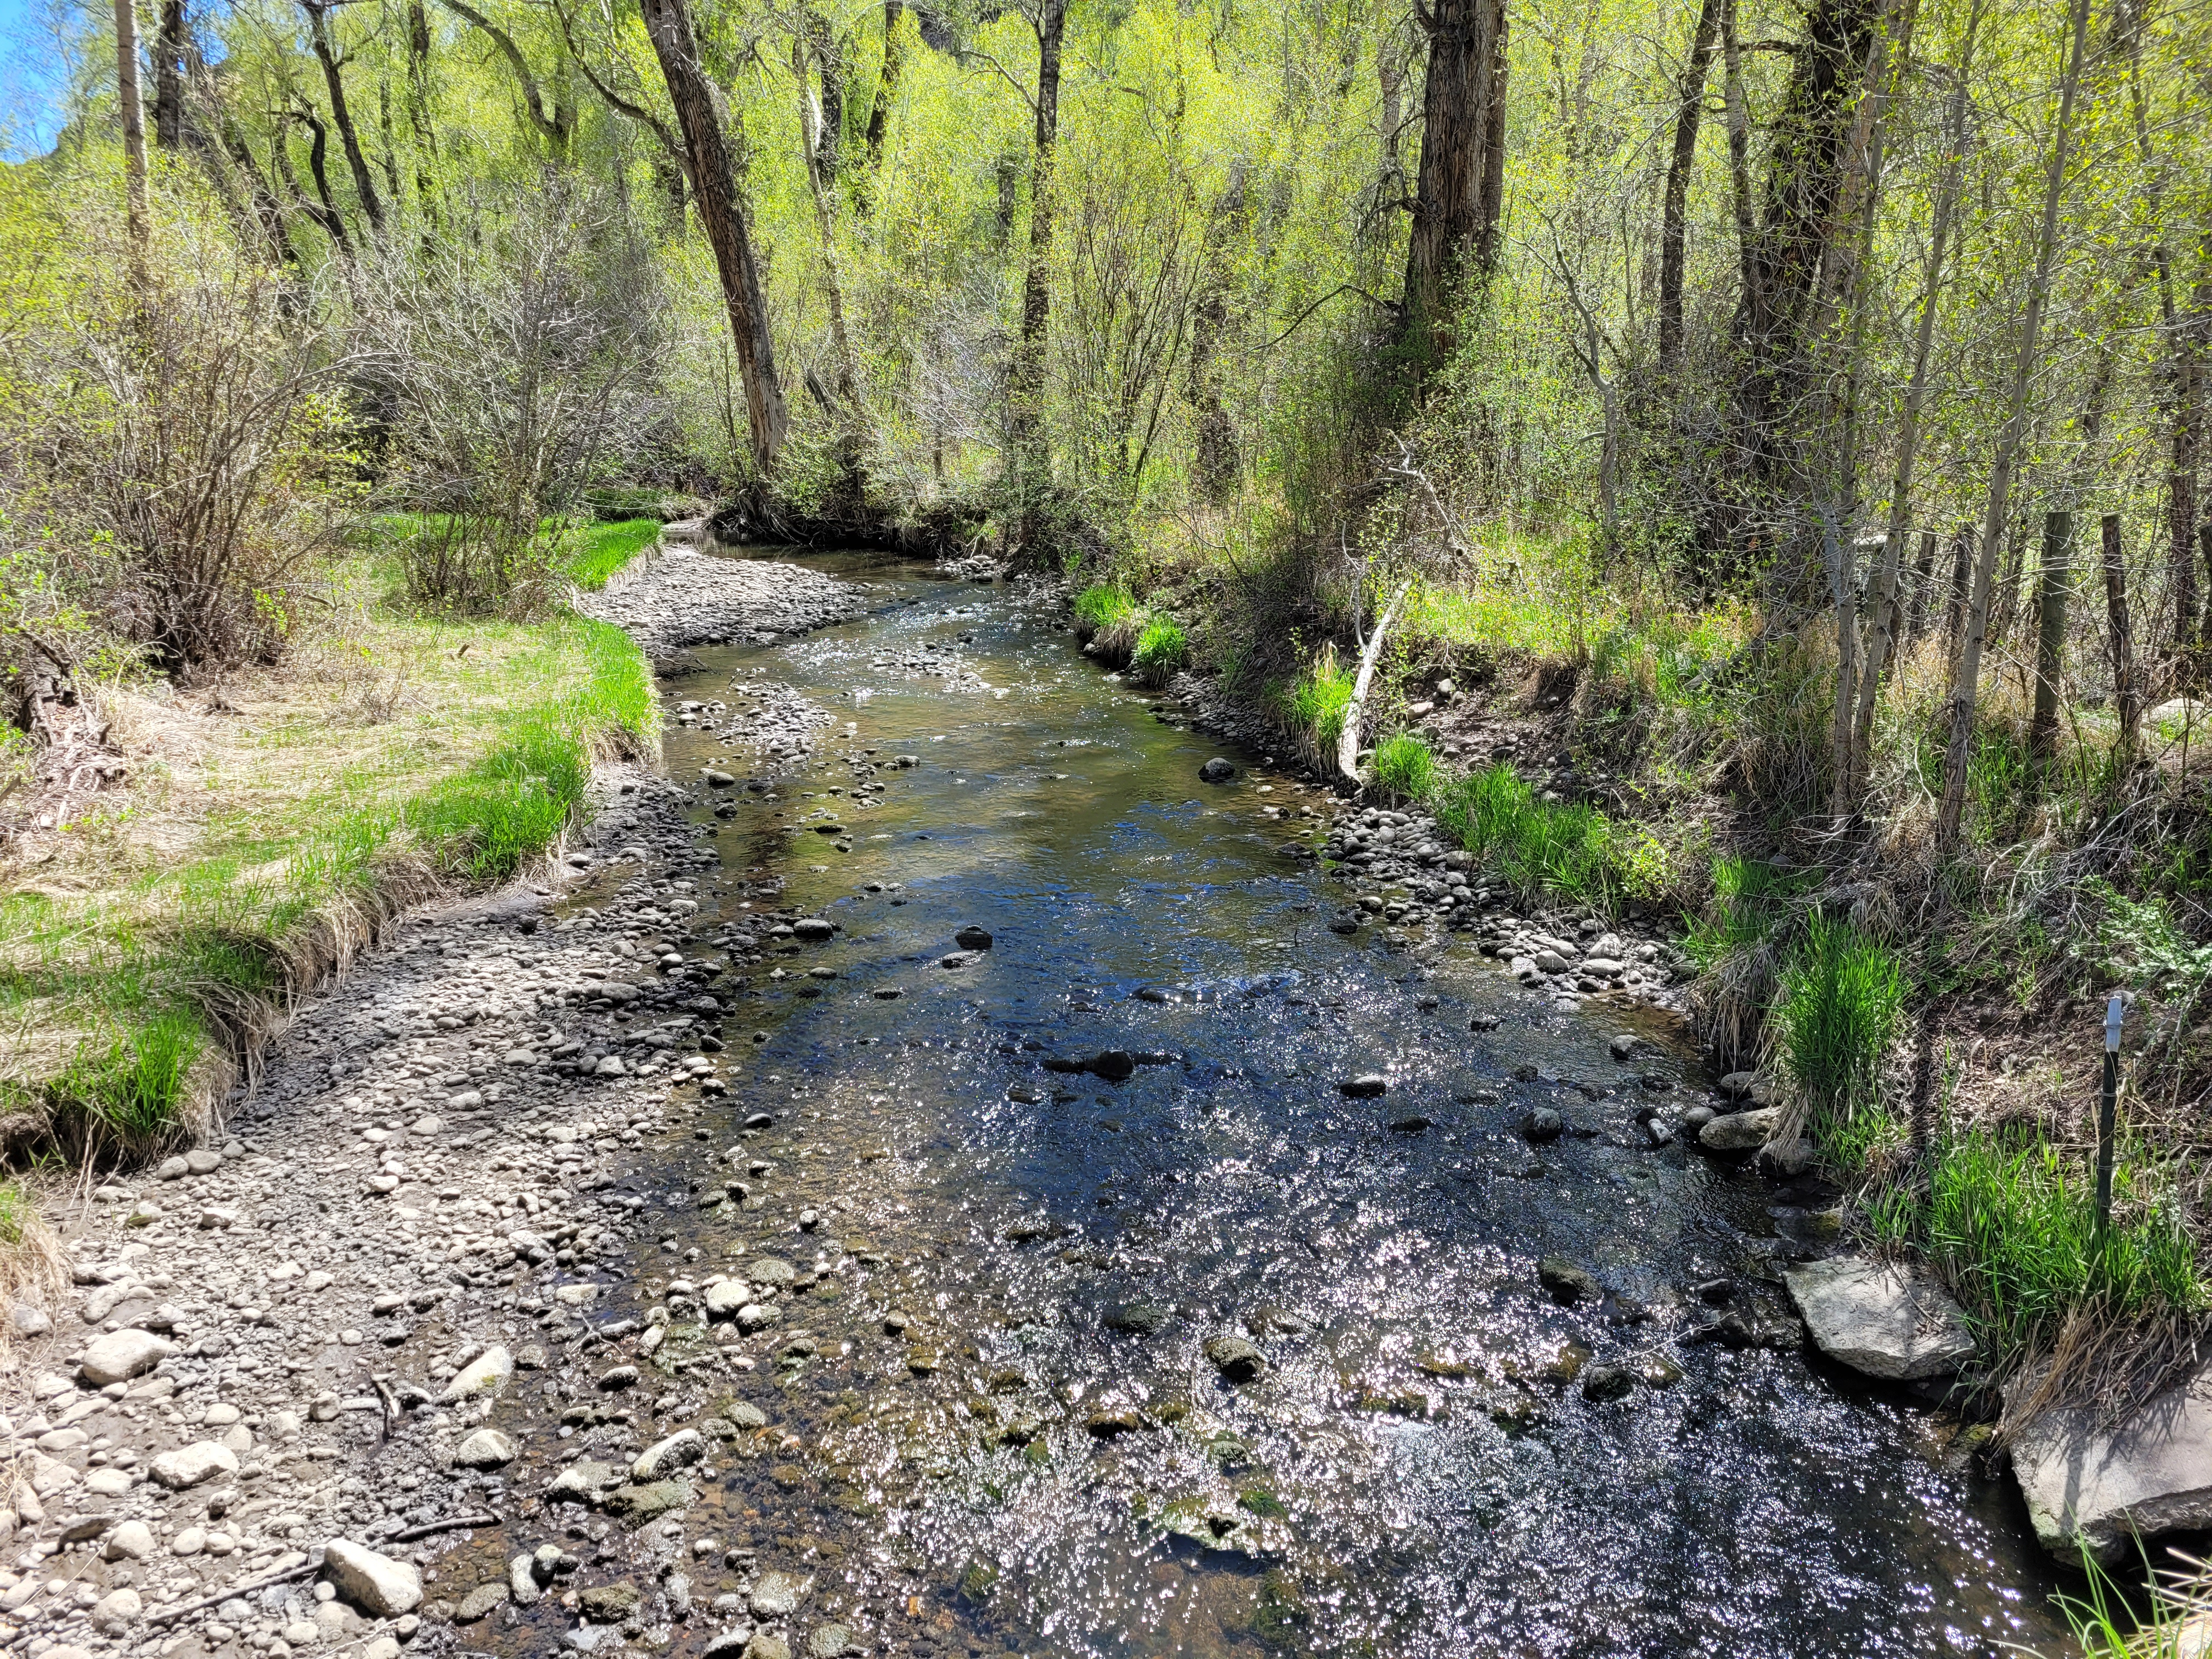
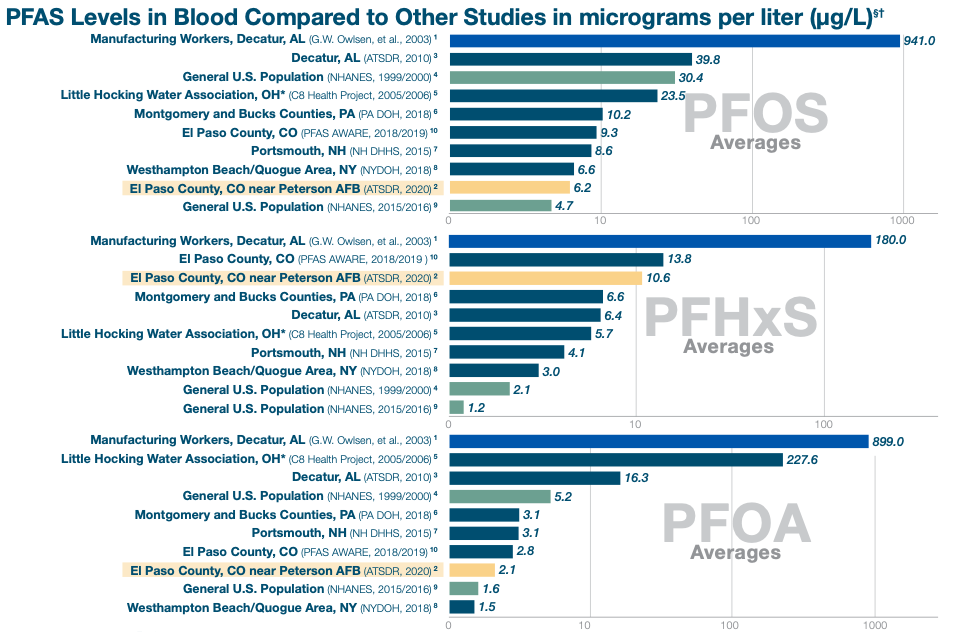

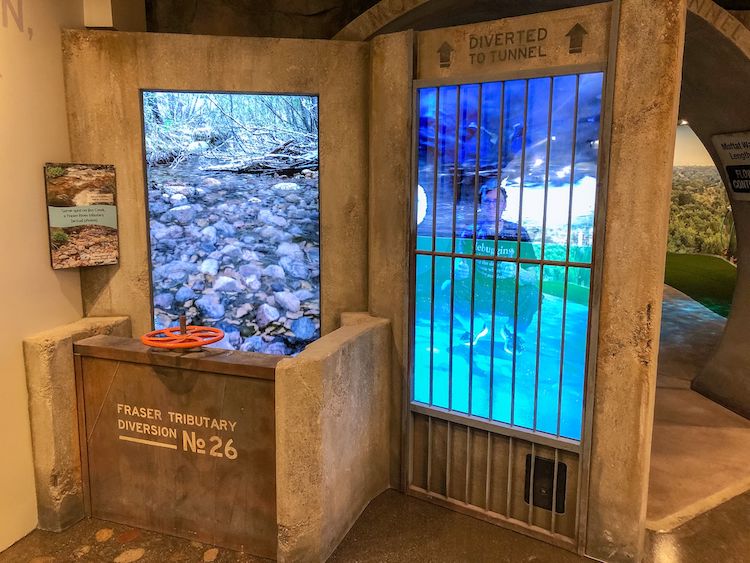


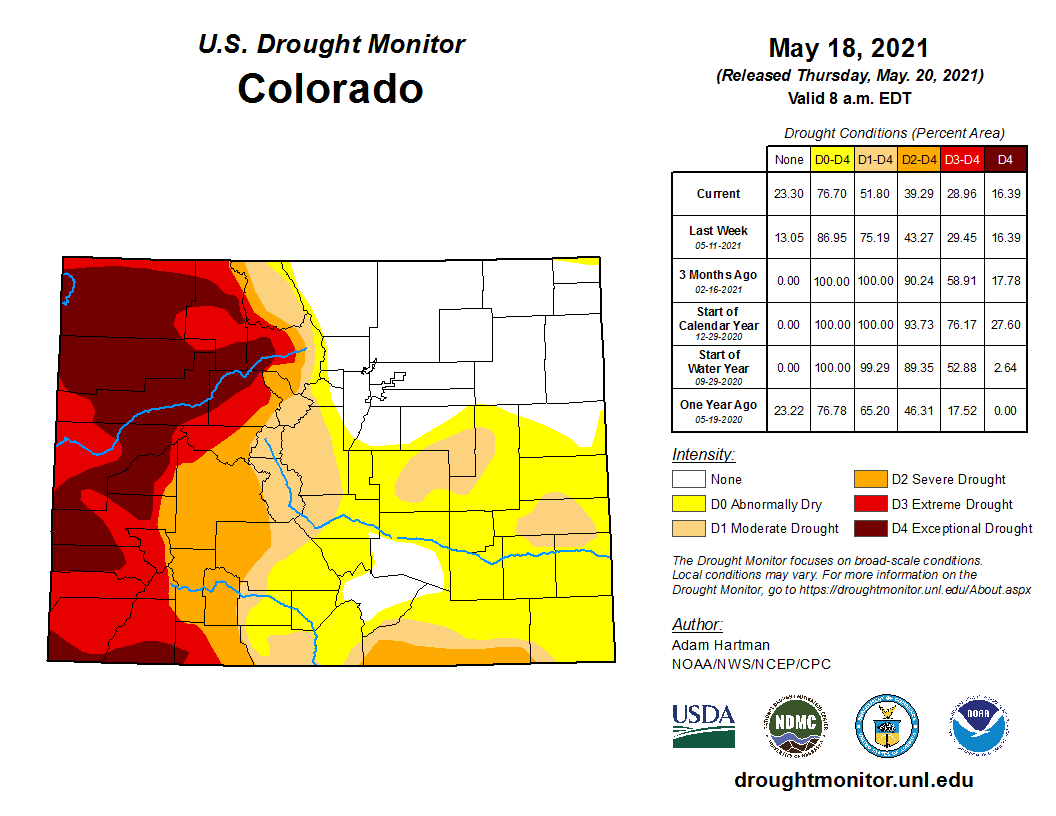
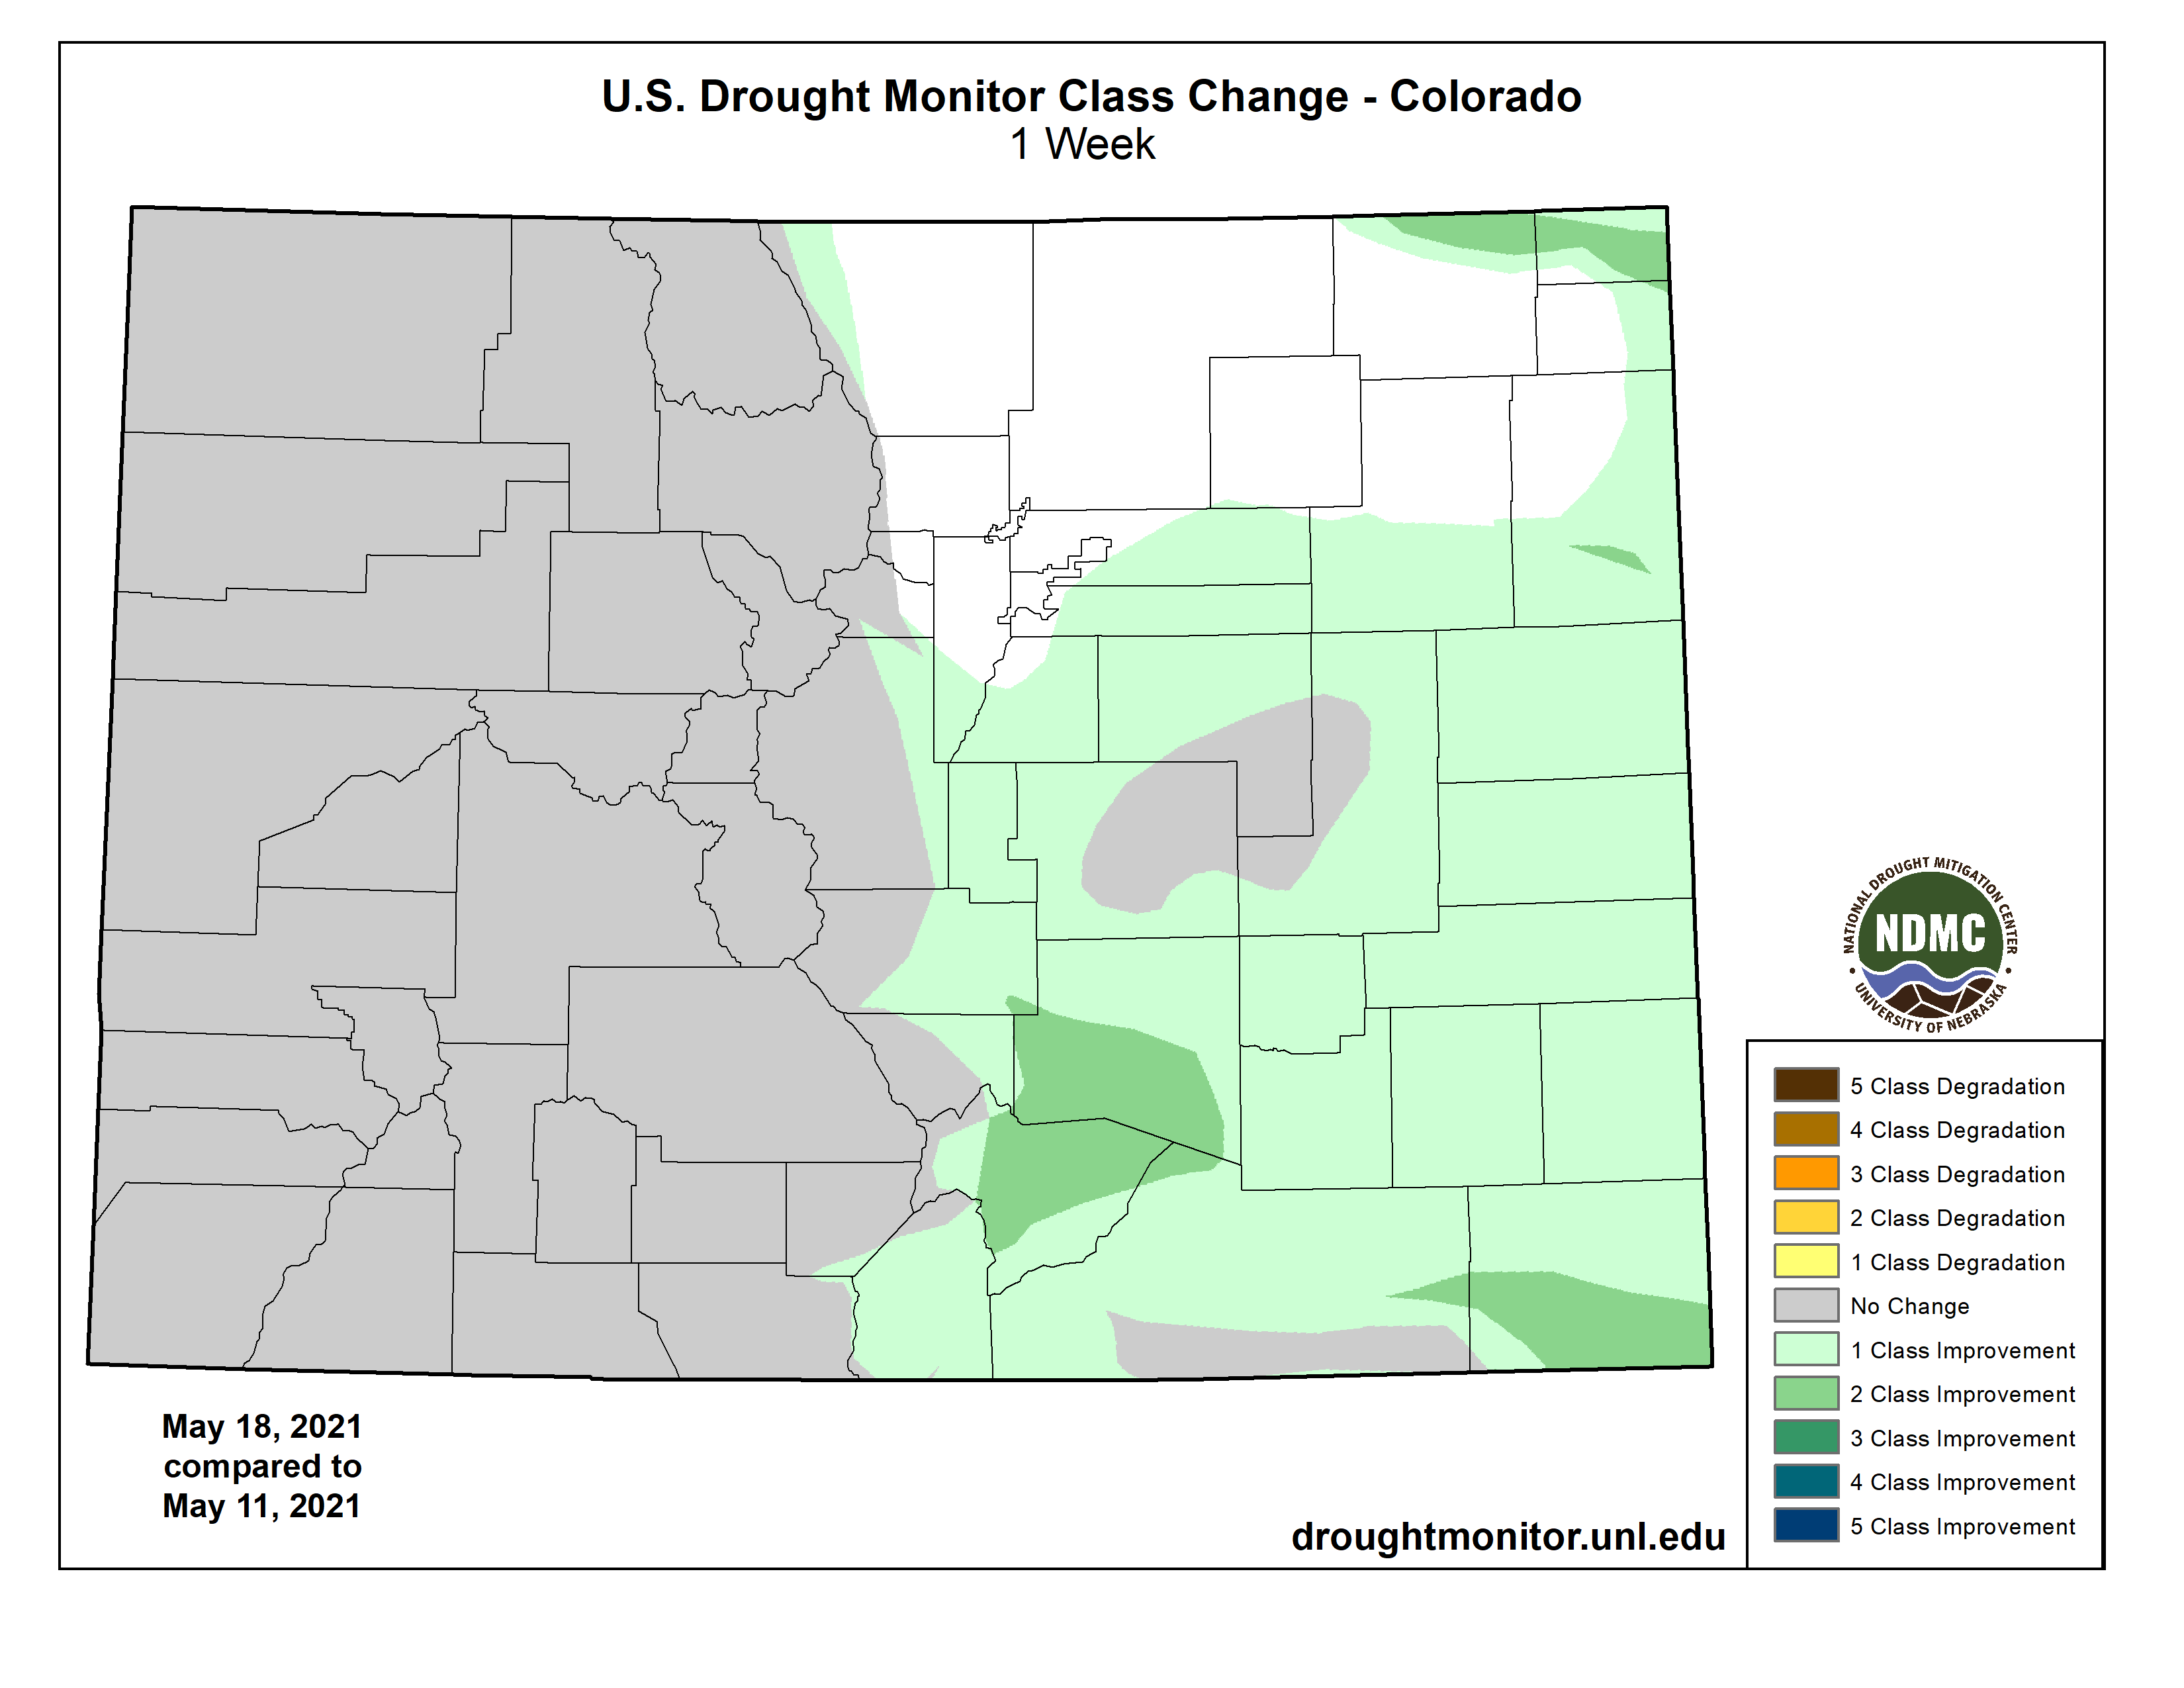
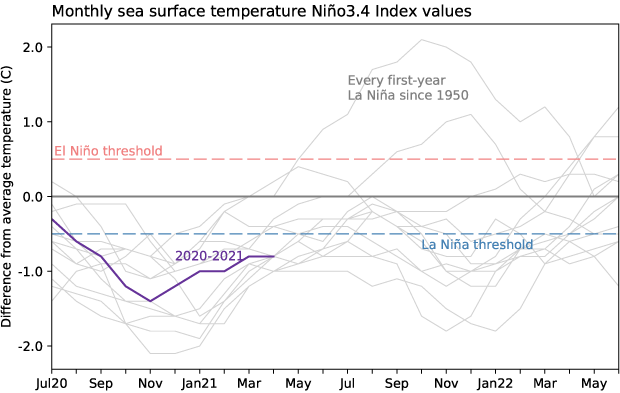
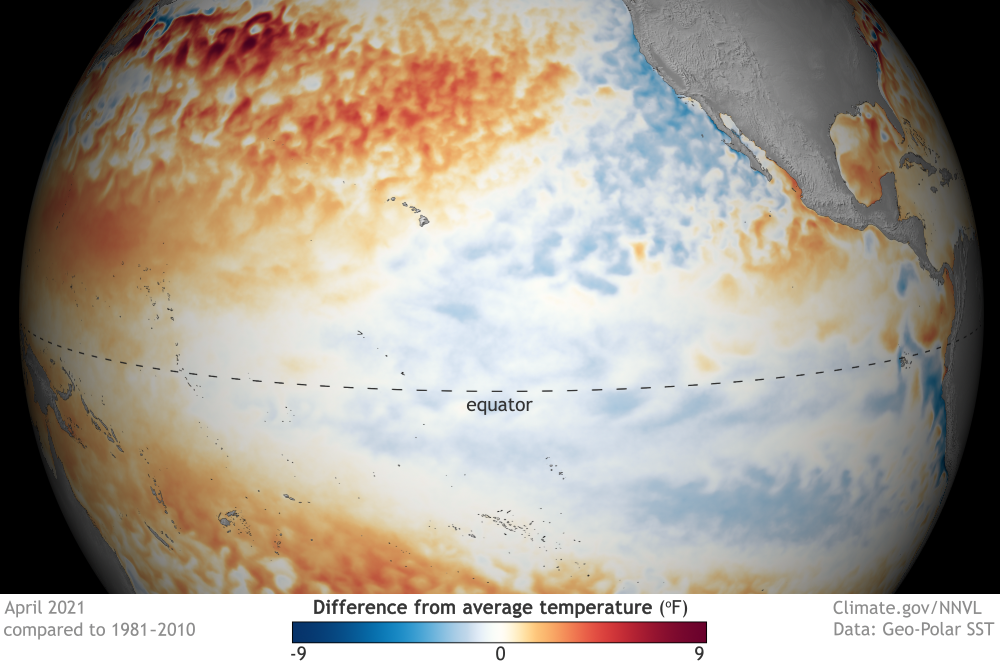

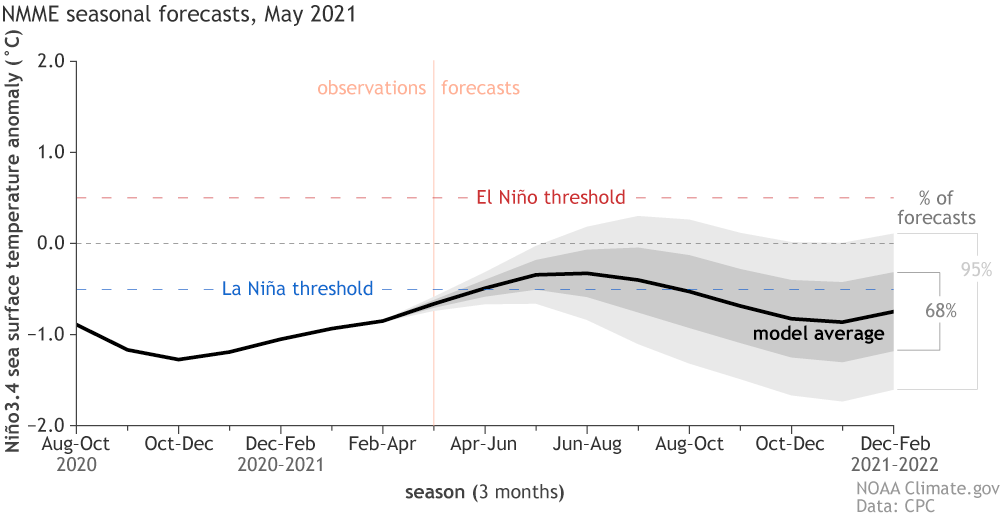

