La Niña conditions have ended and NOAA forecasters estimate about a 67% chance that neutral conditions will continue through the summer. The ENSO forecast for the fall is less confident, with odds of a second-year La Niña currently hovering around 50–55%.
Spring cleaning
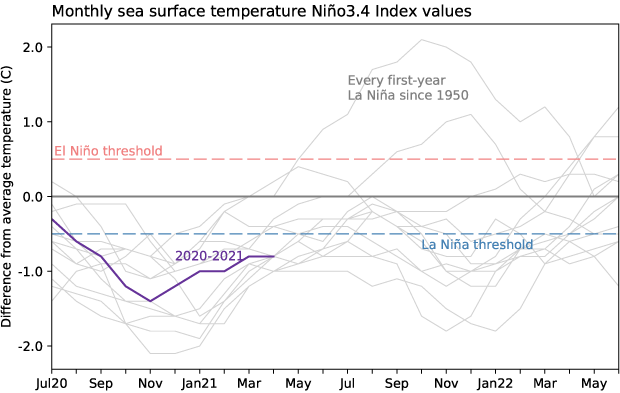
If you’ve been paying very close attention to the surface temperature of the tropical Pacific Ocean (and really, who doesn’t?!) you may have noticed that the April 2021 Niño 3.4 Index, at 0.75°C below average, still exceeds the La Niña threshold of 0.5°C below average. This is according to ERSSTv5, our primary sea surface temperature dataset.
Monthly sea surface temperature in the Niño 3.4 region of the tropical Pacific for 2020-21 (purple line) and all other years starting from first-year La Niña winters since 1950. Graph by Emily Becker based on ERSSTv5 temperature data.
By the way, “average” is now calculated over 1991–2020. Check out the second half of this post for more on what that means for measuring ENSO, and this climate.gov post by our esteemed editor for what it means as far as US climate.
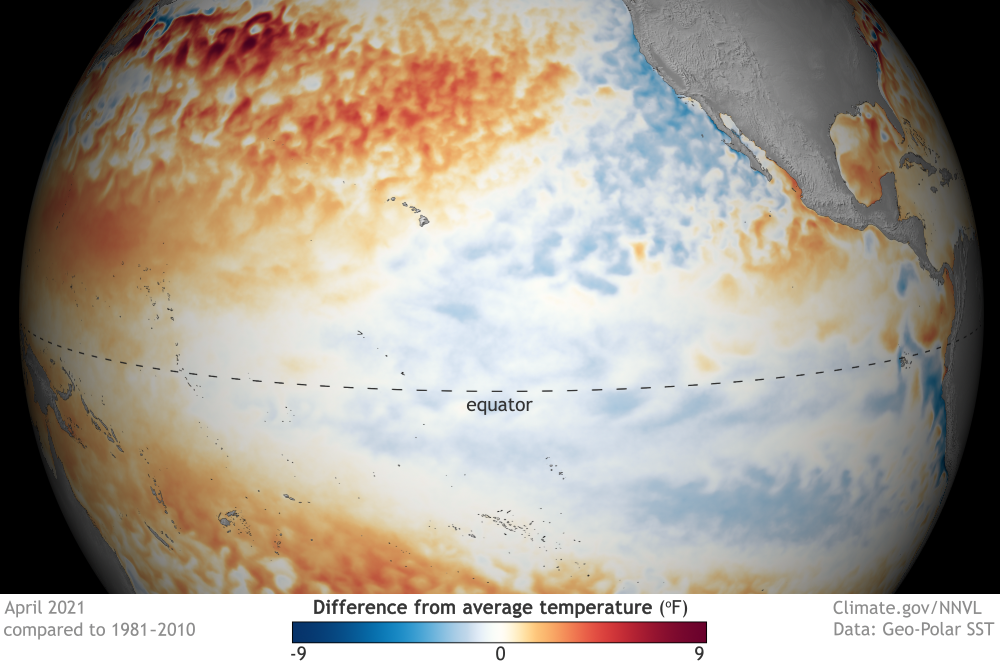
April 2021 sea surface temperature departure from the 1981-2010 average (note that this image still uses the previous averaging period). Image from Data Snapshots on Climate.gov.
However, as we know from long experience, ENSO (El Niño/Southern Oscillation) is more than just the ocean surface temperature anomaly (the difference from the long-term mean). The atmospheric component is just as important, as it serves to reinforce the surface temperature anomaly and transmit ENSO’s impacts across the globe. Over the past few weeks, atmospheric conditions over the tropical Pacific no longer resemble the strengthened Walker circulation pattern that we expect during La Niña.
That strengthened Walker circulation is characterized by reduced rain and clouds over the central Pacific and more over the far western Pacific and Indonesia. This pattern was evident for the past several months, especially the drier-than-average region over the central tropical Pacific, but has dissipated as of early April.
Outgoing long-wave radiation anomalies for the past year. Regions with more clouds and rain than average are shown in purple; areas with fewer clouds and less rain are shown in orange. Each row in this type of image is the departure from average (1974-2020) at that time. The drier-than-average signature of La Niña in the central tropical Pacific is visible as the large orange area that ends in April 2021. NOAA Climate.gov image, based on data provided by the Climate Prediction Center.
Other signifiers, such as stronger-than-average trade winds, have also diminished across most of the Pacific Ocean in the past month. The Southern Oscillation Index and Equatorial Southern Oscillation Index, both of which measure the atmospheric component of ENSO (more details here), are also indicating neutral conditions. Hence, the ENSO forecast team has concluded that La Niña is over, despite the sea surface temperature anomaly.
A sea surface temperature anomaly of -0.5°C (or, in the case of El Niño, +0.5°C) isn’t a magic switch that causes an instant atmospheric reaction, as we’ve seen many times before. For example, a couple of months preceding the last El Niño featured sea surface temperature anomalies near or slightly exceeding the thresholds, but a coherent atmospheric response didn’t kick in right away. The atmosphere-ocean system is vastly complicated, of course, and there are always many different things going on at once, so a delayed response isn’t surprising. As an atmospheric scientist, I’d actually be very surprised if the atmosphere coupling occurred immediately upon crossing the ENSO threshold!
Finally, the water below the surface of the tropical Pacific is warmer than average and a downwelling Kelvin wave is moving eastward under the surface. This means that there are limited sources of cooler-than-average water to replenish the surface over the next few months, adding some confidence that La Niña is done… for now.
Springboard
What everyone would like to know, of course, is what will happen ENSO-wise later in the year, following the neutral conditions that are likely to remain through the summer. ENSO has a strong relationship with the Atlantic hurricane season (June–November), with El Niño tending to lead to a reduced number of tropical storms and hurricanes, and La Niña tending to enhance the season. Last year’s extremely active Atlantic hurricane season was influenced by La Niña, so of course we’d like to get an idea of what’s ahead.
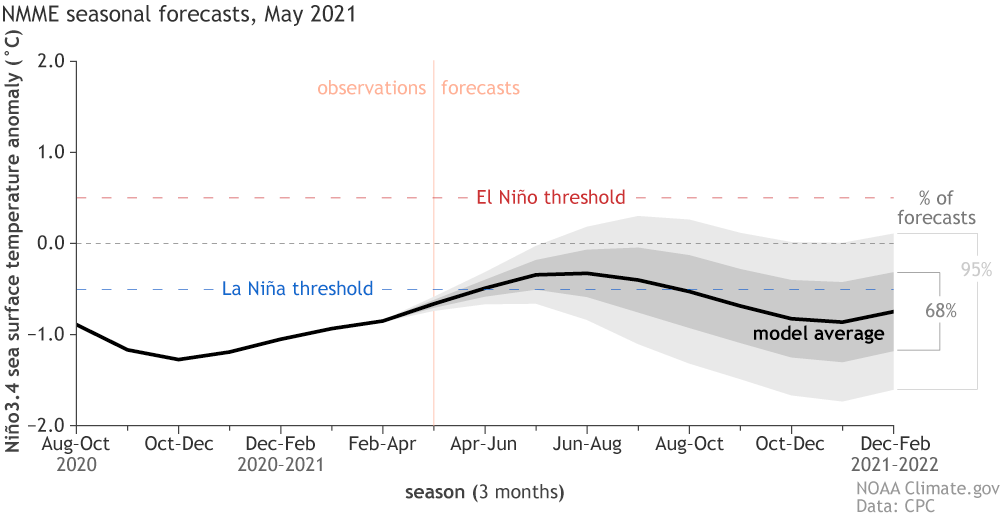
Let’s start with the easier case—chances that El Niño will develop are low, hovering around 8%. El Niño has developed following a first-year La Niña in the past, but we’ve only seen that happen twice since 1950, and most of the computer models give the development of El Niño similarly low odds.
Climate model forecasts for the Niño3.4 Index. Dynamical model data (black line) from the North American Multi-Model Ensemble (NMME): darker gray envelope shows the range of 68% of all model forecasts; lighter gray shows the range of 95% of all model forecasts. NOAA Climate.gov image from University of Miami data.
A substantial amount of warmer-than-average subsurface water in the spring can sometimes give an early heads-up that El Niño is on the way, but this April’s average of 0.6°C is not particularly high, ranking 12th out of the 43 years we have on record. The February–April 2021 average is just about zero. Other springs with a similar value have been followed by El Niño, La Niña, or neutral in the subsequent fall. Our guest blogger Aaron Levine discussed springtime ENSO prediction—head over there for more details. So, to sum up: small chance of El Niño.
The Warm Water Volume anomaly during February-April compared against Niño-3.4 sea surface temperature (SST) during the following November-January. The La Niña years are colored in blue, the El Niño years in red, and ENSO-Neutral years in black. Large negative values of Warm Water Volume anomalies almost always lead to a La Niña event. However, large positive Warm Water Volume anomalies do not lead to El El Niño events. For SST data, OISST is used. Warm Water Volume comes from the PMEL analysis (http://www.pmel.noaa.gov/elnino/upper-ocean-heat-content-and-enso). Figure provided by Aaron Levine and modified by Climate.gov.
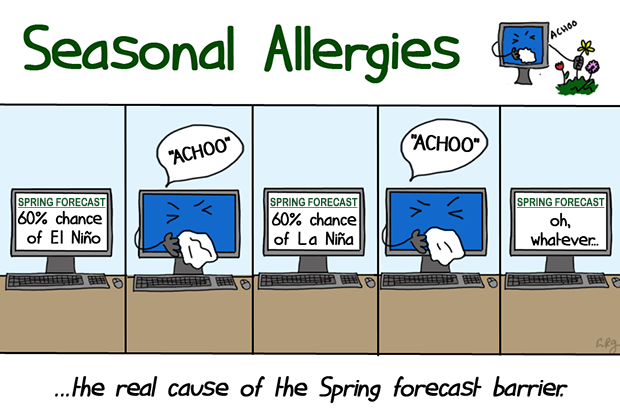
The likelihood of La Niña versus neutral after the summer is less clear. Many of the computer models are suggesting that we may see a second-year La Niña, a common occurrence in the historical record (and a topic that Nat will be covering in his post later this month). However, the spring predictability barrier—forecasts made in the spring tend to be less skillful than forecasts made in other times of the year—is still in effect for May predictions, reducing the confidence in forecasts for the fall and winter.
Editor’s note from R.L.: I’ve added this image without Emily’s express permission…because it’s a cartoon, and who doesn’t like a cartoon? Illustration by Emily Greenhalgh, NOAA Climate.gov.
Currently, forecasters estimate the chance of La Niña during August-October, the heart of the hurricane season, at 42%, which is slightly lower than the 50% chance of neutral.
There are other factors at play in the hurricane season besides ENSO, including Atlantic Ocean temperatures. NOAA’s team is hard at work on the 2021 outlook, which will be released on May 20th.
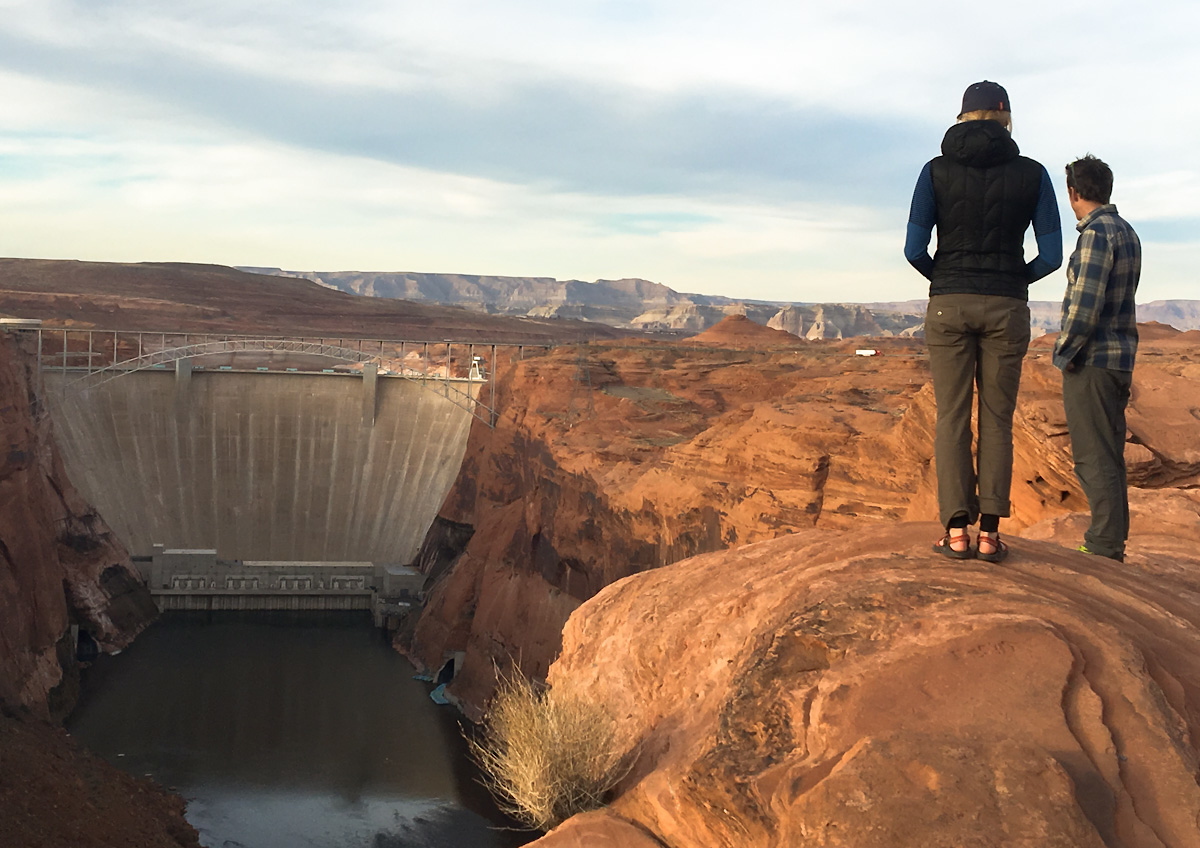
Declining levels at the second-largest reservoir in the U.S. have spurred officials in Colorado, Utah, Wyoming, and New Mexico to search for ways to prop it up.
Lake Powell on the Colorado River is dropping rapidly amid one of the southwestern watershed’s driest years on record. It’s currently forecast to be at 29% of capacity by the end of September — the lowest level since the reservoir first started filling in 1963. Its sister reservoir downstream on the Colorado River, Lake Mead, is also approaching a record low this year.
The amount of water flowing to Lake Powell since October has been less than what the river delivered during the same period in 2002, the driest year on record. Total reservoir storage in the Colorado River basin is projected to be at 39% of capacity by the end of September.
Current Upper Colorado River Basin Reservoir Status May 12, 2021 via the USBR.
Federal projections for the reservoir are prompting water officials to begin strategizing ways to keep Lake Powell from declining to a level where hydroelectric power generation is not possible. In a statement, the Upper Colorado River Commission announced it will begin developing a drought response operations plan, a measure outlined in a 2019 agreement. Earlier this year the reservoir’s declining level triggered monthly calls among the Upper Basin states and mandated a wider range of modeling.
Rows of recent planted of young pine trees. Photo via the University of Michigan
Here’s the release from the University of Michigan (Jim Erickson):
Some climate activists advocate large-scale tree-planting campaigns in forests around the world to suck up heat-trapping carbon dioxide and help rein in climate change.
But in a Perspectives article scheduled for publication May 21 in the journal Science, a University of Michigan climate scientist and his University of Arizona colleague say the idea of planting trees as a substitute for the direct reduction of greenhouse gas emissions could be a pipe dream.
“We can’t plant our way out of the climate crisis,” said Arizona’s David Breshears, a top expert on tree mortality and forest die-off in the West. His co-author is Jonathan Overpeck, dean of the U-M School for Environment and Sustainability and an expert on paleoclimate and climate-vegetation interactions.
Instead of wasting money by planting lots of trees in a way that is destined to fail, it makes more sense to focus on keeping existing forests healthy so they can continue to act as carbon “sinks,” removing carbon from the atmosphere through photosynthesis and storing it in trees and soils, according to the researchers. At the same time, emissions must be reduced as much as possible, as quickly as possible.
Overpeck and Breshears say they hope the role of the world’s forests—and specifically the urgent need to protect existing forests and keep them intact—is thoroughly debated when the world’s climate action leaders gather at the COP26 climate change conference in Glasgow this November.
“Policymakers need to enable new science, policy and finance mechanisms optimized for the disturbance and vegetation change that is unstoppable, and also to ensure that the trees and forests we wish to plant or preserve for the carbon they sequester survive in the face of climate change and other human threats,” Overpeck and Breshears wrote.
“Failure to meet this challenge will mean that large terrestrial stores of carbon will be lost to the atmosphere, accelerating climate change and the impacts on vegetation that threaten many more of the ecosystem services on which humans depend.”
Keeping forests healthy will require a new approach to forest management, one that Overpeck and Breshears call managing for change. As a first step, policymakers and land managers need to acknowledge that additional large-scale vegetation changes are inevitable.
Climate change has been implicated in record-setting wildfires in the western United States, Australia and elsewhere, as well as extensive tree die-offs that are largely due to hotter, drier climate extremes. Those disturbing trends are expected to accelerate as the climate warms, according to Overpeck and Breshears.
“Even in a world where climate change is soon halted, global temperature rise will likely reach between 1.5 and 2 C above pre-industrial levels, with all the associated extreme heat waves that brings, and thus global vegetation will face up to double the climate change already experienced,” they wrote.
At the same time, deforestation continues to expand globally and is especially damaging in tropical forests, which hold vast amounts of biodiversity and sequestered carbon.
The next step toward a new managing-for-change paradigm is to manage forests proactively for the vegetation changes that can be anticipated—instead of trying to maintain forests as they were in the 20th century, Overpeck and Breshears say.
Managing for change means, for example, more aggressive thinning of forests to reduce the buildup of fuels that stoke massive wildfires. It also means selectively replacing some trees—after a wildfire, for example—that are no longer in optimal climate zones with new species that will thrive now and in coming decades.
Such activities, where needed, will inevitably increase the costs of forest management, according to the researchers. But such costs should be considered a prudent investment, one that helps preserve an underappreciated service that forests provide to humanity for free: carbon storage, also known as carbon sequestration.
Forests are already managed to preserve the natural resources and ecosystem services they provide. In addition to supplying timber, fuelwood, fiber and other products, forests clean the air, filter the water, and help control erosion and flooding. They preserve biodiversity and promote soil formation and nutrient cycling, while offering recreational opportunities such as hiking, camping, fishing and hunting.
Carbon sequestration should rank high on the list of invaluable services that forests provide, and efforts to preserve and enhance this vital function should be funded accordingly, Overpeck and Breshears say.
For example, there’s a big opportunity to improve the ability of forests to store carbon through increased use of biochar, a form of charcoal produced by exposing organic waste matter—such as wood chips, crop residue or manure—to heat in a low-oxygen environment. Large amounts of wood generated during forest thinning projects could be converted to biochar, then added to forest soils to improve their health and increase the amount of carbon that is locked away, Overpeck says.
“Thinning of forests, conversion of the removed wood to biochar and burial of the biochar in forest soils is a way to bring new jobs to forested rural areas while allowing forests to play a bigger role in keeping carbon out of the atmosphere and thus fighting climate change,” he said. “Forest carbon management could be a boon for rural areas in need of new economic engines.”
In the long run, such projects are likely to benefit forests and enhance their ability to store carbon far more than massive tree-planting campaigns conducted without appropriate management strategies, according to Overpeck and Breshears.
“Tree-planting has great appeal to some climate activists because it is easy and not that expensive,” Breshears said. “But it’s like bailing water with a big hole in the bucket: While adding more trees can help slow ongoing warming, we’re simultaneously losing trees because of that ongoing warming.”
In their Perspectives article, Overpeck and Breshears explore the implications of a new study by Ondřej Mottl et al., also scheduled for publication May 21 in Science, titled “Global acceleration in rates of vegetation change over the past 18,000 years.”
In a photo from 2020, a distinct line around the rocky shore shows how much the water level has decreased in Nevada’s Lake Mead. Mead is expected to drop 15 feet in 2021 Photo credit: Roberto (Bear) Guerra/High Country News
Opinion: The latest forecast suggests for the first time that Lake Mead could fall into a Tier 2 shortage by 2023, thrusting even deeper water cuts on Arizona.
Lake Mead’s water levels are heading the wrong way and going there alarmingly fast.
If the forecast holds, it’s now likely that we will fall into a more severe Tier 2 shortage by 2023, spreading painful cuts to even more water users in Arizona.
That nugget of bad news comes from the U.S. Bureau of Reclamation’s 24-month study, which is updated each month to predict reservoir conditions for the next two years. In April, the projection was that Lake Mead – the reservoir that provides nearly 40% of Arizona’s water – would most certainly be in a Tier 1 shortage in 2022 but would miss the Tier 2 cutoff for 2023 by three-tenths of a foot.
Now, in May, the most likely projection is that Lake Mead will end 2022 at 1,048.83 feet of elevation – more than a foot past the trigger to put us in Tier 2.
We’re hot, dry and low – a volatile mix
The good news (if you can call it that) is that the predictions didn’t change nearly as rapidly from April to May as they did from March to April. Projected lake levels for December 2022 dropped last month by about 5 feet, thanks to horribly anemic and earlier-than-expected runoff.
It’s also worth noting that if we didn’t have the Drought Contingency Plan (DCP) in place to conserve water, we would already be in this shape. That agreement didn’t solve our problems, but it has bought us time and certainty as deeper cuts play out – which is exactly what it was intended to do.
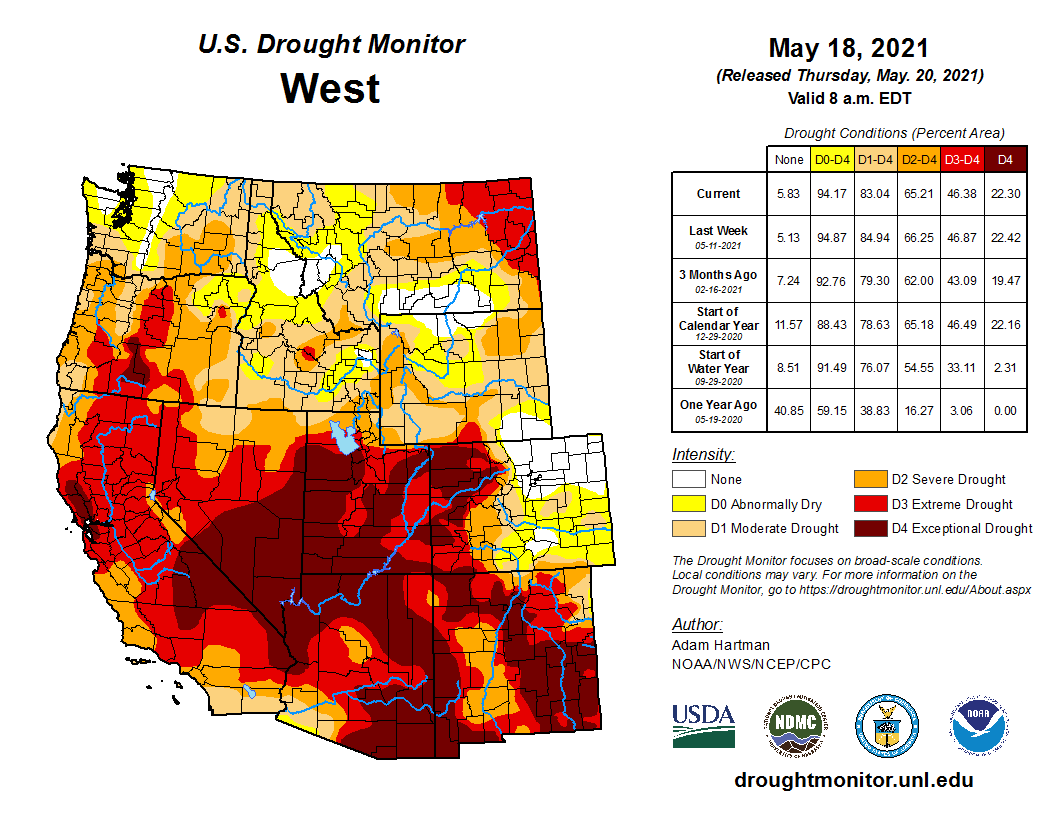
West Drought Monitor map May 18, 2021.
That said, we’re still hot and dry, with more than half of the Colorado River basin now in extreme drought, the most severe category. Unless that trajectory changes, the forecast is probably not going to get much better.
And, even worse, we’re getting down into the V-shaped part of Lake Mead, meaning it takes a loss of less water to drop lake levels than it once did. Losing smaller volumes of water can have bigger impacts.
Which is why there’s also a 1 in 4 chance that we could fall into a Tier 3 shortage by 2025 – the worst-case scenario spelled out under DCP and one that would much more heavily impact metro Phoenix cities.
How a Tier 2 shortage could play out
But a Tier 2 shortage in 2023 wouldn’t be a walk in the park. Technically, there are two levels of Tier 2 shortage for Arizona – a Tier 2a that’s triggered at 1,050 feet of elevation on Lake Mead and a Tier 2b that would occur at 1,045 feet.
It’s a small variance in elevation, but it would increase required cuts statewide, from 592,000 to 640,000 acre-feet, and decimate Central Arizona Project’s Non-Indian Agriculture (NIA) pool, which despite its name mostly supplies tribes and cities.
Luckily, Arizona’s DCP implementation plan includes water to temporarily mitigate the impact of those cuts. But the amount replenished in 2023 would fall from 75% to 50% in a Tier 2b shortage. That will still be painful, particularly for metro Phoenix cities that use NIA water to serve a few existing customers.
The May projection is already within about 3 feet of reaching a Tier 2b shortage. And let me underline that – we’re talking about the most probable projection. Not the best or worst case, but the most likely.
We’ve planned for this, but it’ll still hurt
We’re also less than 20 feet from triggering what might be called the doomsday provision within DCP.
If the lake is projected to fall below 1,030 feet any time within two years, Arizona, California and Nevada must reconvene to decide what additional steps they will take to keep Mead from falling below 1,020 feet – an elevation that many consider the crash point. The next milestone below that is “dead pool,” where no water leaves the lake.
And that provision is triggered by any part of the forecast – not just the maximum or most probable scenario, but the minimum probable scenario, too.
It’s anyone’s guess what will happen then.
But, hey, at least we’ve got plans in place to handle Tier 2 and 3 shortages. And, in even better timing, Arizona has just completed a multiyear effort to flesh out how cities and other users can begin withdrawing the millions of acre-feet of water they have stored underground.
Explaining the benefits and pitfalls of that effort is for another blog on another day, but for now, let’s just say it’s a good thing we have water stored for a (non)rainy day.
Because the outlook for Arizona’s major renewable water source is parched and bleak – and growing more so every day.
Colorado River “Beginnings”. Photo: Brent Gardner-Smith/Aspen Journalism
Click here for all the inside skinny and to register:
Topic
Colorado State of the River
Description
Join the Colorado River District for the Colorado State of the River, a webinar addressing issues across the basin.
Learn how last year’s wicked wildfire season has impacted our water supplies and how to prepare for the impacts of post-fire floods. Get information about water availability amid impending summer drought and find out more about funding available for local water projects.
If you cannot attend the webinar live, register to receive a recording of the webinar in your email inbox to watch later.
Agenda:
• Welcome – Colorado River District
• Colorado River District’s Community Funding Program – Colorado River District Director of Strategic Partnerships Amy Moyer
• Water Supply Updates and Drought in the Colorado River Basin – Division 5 Assistant Division Engineer James Heath
• Impacts of 2020 Wildfires and Fire Recovery in the Colorado River Basin – U.S. Forest Service Hydrologist Liz Schnackenberg, Joel Cochran, Grand County Director of Emergency Management, Northern Water Source Water Protection Specialist Kimberly Mihelich and Middle Colorado Watershed Council Executive Director Paula Stepp
• Learning By Doing: Updates and Fire Recovery – Learning by Doing Coordinator Kiki Sayre and Water Quality Technical Assistance Consultant for Grand County Kayli Foulk
Time
May 27, 2021 06:00 PM in Mountain Time (US and Canada)
Possible reservoir a key element of [water] providers’ long-term plans
The Eagle River Water & Sanitation District and the Upper Eagle Regional Water Authority — separate entities that share offices — is looking at a possible plan to create a reservoir on the lake site just south of Minturn. The plan, if it comes to pass, could take 10 years to complete, at a still-unknown cost.
The water providers currently have a purchase contract for the lake site with the Battle North LLC, which owns the property, and has for some time envisioned housing near the site.
During the contract period — about 12 months — the district and authority will conduct feasibility studies for the lake.
District Director of Engineering and Water Resources Jason Cowles said that work will include soils testing and other evaluation. If the evaluation provides the right answers, the water providers will buy the site and get to work.
The current idea is to roughly triple the size of the old lake by digging down about 30 feet from the current empty lake bottom. That would keep the size of the new dam reasonable. The old dam was breached in the early 1990s for safety reasons. In addition, digging that much material would provide plenty of clean fill dirt to use for other purposes, including capping tailings from the Eagle Mine.
A near-perfect site
Eagle River Water & Sanitation District General Manager Linn Brooks said if the evaluation bears fruit, Bolts Lake is a nearly-perfect site for a reservoir.
The site is on private land, is the right size and is off the main channel of the Eagle River, Brooks said, adding that the environmental impacts would be minimal…
The upper valley’s water providers have long been looking for more water storage within the Eagle River basin. The providers get most of their water from streamflows…
Since the Bolts Lake reservoir wouldn’t take water directly from the river, Brooks said the reservoir would still keep streamflows whole. And, like the providers’ other reservoirs, the water would be used to augment streamflows in the river, which helps river health.
In an email, Tim McGuire of Battle North wrote that the company is excited to work with the water providers on the project.