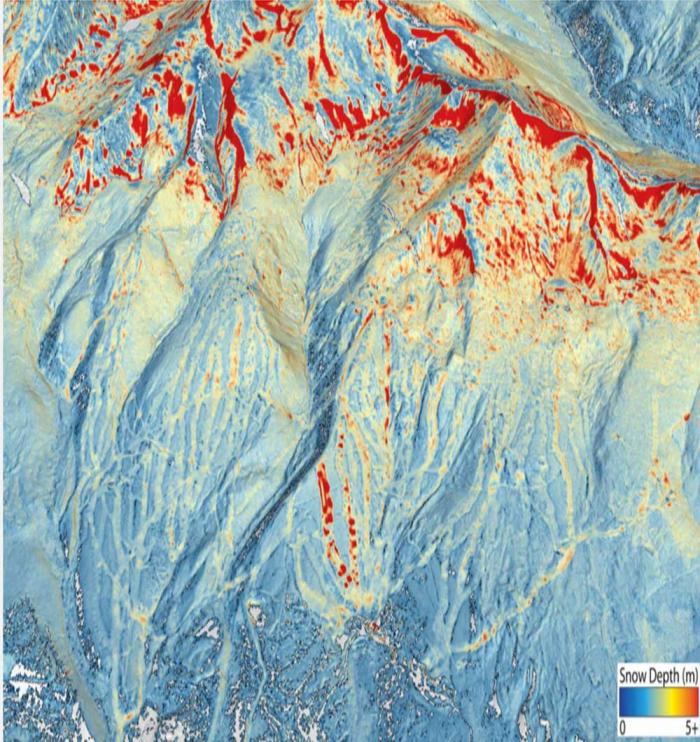
The mountain ranges above Dillon Reservoir, seen through the lens of the data collected by sophisticated equipment onboard a plane that flew over the Blue River Basin to measure the amount of water frozen in the snow above Denver Water’s largest reservoir. Image credit: Airborne Snow Observatory Inc.
New generation of high-tech snow measurements feeds Denver area’s water supply models.
On April 18, a Beech A90-1 King Air stuffed with sophisticated equipment took off from Gunnison’s regional airport and soared over the mountains above Dillon Reservoir.
The flight occurred toward the end of the 2020-21 snow season, a nail-biter that has seen streaks of unusually warm, sunny days — and record-breaking heat in early April — broken by waves of storms and inches of snow that extended the ski season at some resorts.
In the air for three hours, the plane cruised above 20,000 feet, flying back and forth across the 335 square miles of high-country snow drifts that make up the Blue River Basin. Snow melting off high peaks and tumbling down the basin’s creeks ultimately ends up in Dillon Reservoir and the Blue River below Denver Water’s dam.
And as the Airborne Snow Observatories Inc. plane crisscrossed the sky, lidar equipment it carried shot beams of light at the snow below, capturing reflections from its frozen surface and measuring its depth. The company grew out of a seven-year research effort by NASA’s Jet Propulsion Laboratory.
Reams of data collected during the flight provide Denver Water with an assessment of the amount of water frozen in the snow.
Those calculations will in turn feed the utility’s forecast of the amount of water expected to flow into the largest reservoir in the utility’s system that 1.5 million people rely on for drinking water.
Red splashed across the mountains in the Blue River Basin show where the snow was the deepest in mid-April. The line of dots down the mountain is a ski run at Breckenridge Ski Resort where snow-making machines have added snow to the ground. Image credit: Airborne Snow Observatory.
“About 80% of Denver Water’s supply comes from snowpack and we want to be able to forecast spring runoff as accurately as possible,” said Nathan Elder, Denver Water’s manager of water supply.
“Getting more and better information improves accuracy and that helps us know if we have to go on watering restrictions, or what the impacts of runoff will be on the environment and recreation, how we should manage and move our water resources,” he said.
The mid-April flight was timed to be at or close to the peak of the season’s snowpack. It was the first of two flights Denver Water commissioned to collect data over the Blue River Basin this season.
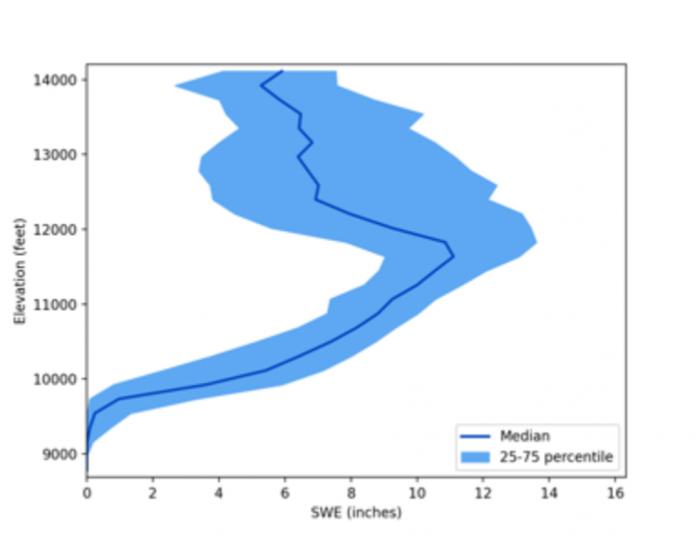
Information from the first flight indicated there were normal amounts snow in the middle and lower elevations, but less than expected at higher elevations, Elder said.
“That’s important to know, because where the snow is on the mountain will dictate when it starts melting for the runoff,” Elder said.
A second flight in late May or early June will collect information about how much snow might be lingering at the highest elevations.
he flight path of a plane tasked with collecting data on the snowpack above Dillon Reservoir in mid-April, as it flew a pattern back and forth across the Blue River Basin. Photo credit: Denver Water.
That’s important because by then, snow at the four SNOTEL measurement sites in the basin, perched at about 11,000 feet, will have already melted away, leaving the utility and other snow watchers blind to water that might still be frozen in place at higher elevations — or may have already melted away.
“Based on the measurements and history we have, we can overpredict the amount of water in the snow or underpredict. Either way has consequences for how we operate our system, and is something we want to avoid,” Elder said.
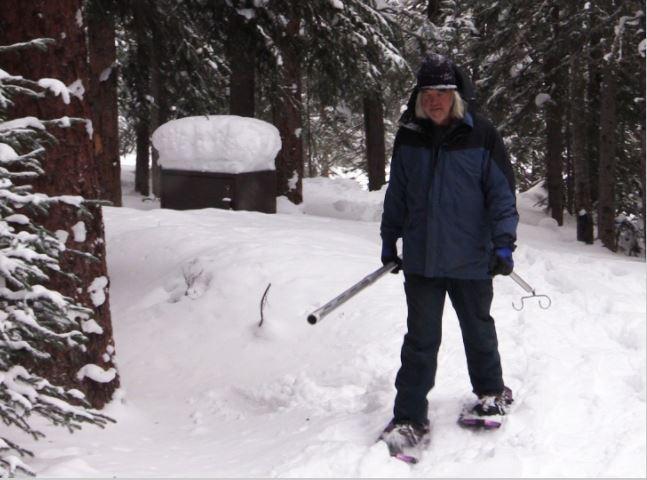
Historically, Denver Water and other water watchers gather information about snowpack and water supplies by looking at data from SNOTEL sites scattered across the mountains, including four in the Blue River Basin area, and information collected by crews snowshoeing to remote locations. Information collected during the season is compared to historical data.
But Elder compares the SNOTEL measurement spots to pixels in a TV screen.
“If you have four sites in the Blue River Basin, imagine watching TV and you have four pixels for the entire screen – you won’t be able to tell what’s going on. And if the pixels are in a line across the middle, like the SNOTEL sites are all between 10,500 and 11,400 feet, you can’t see anything above or below that line,” Elder said.
Throw in additional layers of uncertainty in shifting weather patterns due to climate change, and the confidence in data collected the same way it’s been done for decades starts to slide.
Denver Water caretaker Per Olsson snowshoes through the woods to access snow-measuring sites. Olsson retired from Denver Water in 2018 after 26 years of service. Photo credit: Denver Water.
“What we see now isn’t the same as what we’ve seen in the past. You can’t base today’s forecast on yesterday’s data, conditions are changing,” Elder said.
Gathering data on the snowpack by flying above it started in California and Colorado in 2013 and has occurred occasionally in various river basins across Colorado for several years, as utilities and others have had money available to commission flights.
Denver Water flew two flights above the Blue River Basin in 2019, then skipped 2020 amid the pandemic.
But several Colorado water utilities and entities are looking at the possibility of banding together to coordinate future flights, sharing costs and also sharing the data that comes from the flights.
“When Denver Water did the first Airborne Snow Observatory flights in 2019, we found incredible value from the information and we started to tell the story of those pilot flights at conferences,” said Taylor Winchell, a water resource engineer at Denver Water who works on climate change adaptation and water supply planning issues.
“There’s a lot of interest, but there also are a lot of questions about the cost, the information, timing – when do you fly – and where those flights might be the most useful,” Winchell said.
Information collected from the flights is another tool to be integrated into the wealth of information that exists about Colorado’s snowpack, and how it might change in coming years, he said.
How many inches of water were frozen in the snow in mid-April? The shaded blue band shows how the amount of water changed as you go from 9,000 feet to 14,000 feet on the mountains above Dillon Reservoir. Image credit: Airborne Snow Observatory.
In April, the Colorado Water Conservation Board gave $45,000 to fund the Colorado Airborne Snow Observatory Expansion Plan, allowing the group to work through all the questions.
“This project isn’t designed to pay for the flights, but to create a plan for developing a sustainable operation in Colorado with consistent flights, across many watersheds, every year, with costs and information shared – similar to the California program,” Winchell said.
The planning team includes Denver Water, Northern Water, Dolores Water Conservancy District, Airborne Snow Observatories Inc. (a company that grew out of the NASA-led pilot flights in California) and Lynker, which specializes in water resources planning and analysis.
Winchell said the planning process is expected to get a diversity of water perspectives across Colorado, spanning state and federal agencies, agriculture and recreation interests, water providers, cities, researchers, environmental groups and Native American tribal groups.
“Airborne snow flights have benefits for everyone who is involved in water management,” Winchell said. “We’re trying to make sure all perspectives are included in developing this program.”
Looking to the south from a plane above Dillon Reservoir in June 2019, during an Airborne Snow Observatory flight to gather data on the snowpack above the reservoir for Denver Water. Photo credit: Quantum Spatial.
Abstract
In the Southwest and Central Plains of Western North America, climate change is expected to increase drought severity in the coming decades. These regions nevertheless experienced extended Medieval-era droughts that were more persistent than any historical event, providing crucial targets in the paleoclimate record for benchmarking the severity of future drought risks. We use an empirical drought reconstruction and three soil moisture metrics from 17 state-of-the-art general circulation models to show that these models project significantly drier conditions in the later half of the 21st century compared to the 20th century and earlier paleoclimatic intervals. This desiccation is consistent across most of the models and moisture balance variables, indicating a coherent and robust drying response to warming despite the diversity of models and metrics analyzed. Notably, future drought risk will likely exceed even the driest centuries of the Medieval Climate Anomaly (1100–1300 CE) in both moderate (RCP 4.5) and high (RCP 8.5) future emissions scenarios, leading to unprecedented drought conditions during the last millennium.
INTRODUCTION
Millennial-length hydroclimate reconstructions over Western North America (1–4) feature notable periods of extensive and persistent Medieval-era droughts. Such “megadrought” events exceeded the duration of any drought observed during the historical record and had profound impacts on regional societies and ecosystems (2, 5, 6). These past droughts illustrate the relatively narrow view of hydroclimate variability captured by the observational record, even as recent extreme events (7–9) highlighted concerns that global warming may be contributing to contemporary droughts (10, 11) and will amplify drought severity in the future (11–15). A comprehensive understanding of global warming and 21st century drought therefore requires placing projected hydroclimate trends within the context of drought variability over much longer time scales (16, 17). This would also allow us to establish the potential risk (that is, likelihood of occurrence) of future conditions matching or exceeding the severest droughts of the last millennium.
Quantitatively comparing 21st century drought projections from general circulation models (GCMs) to the paleo-record is nevertheless a significant technical challenge. Most GCMs provide soil moisture diagnostics, but their land surface models often vary widely in terms of parameterizations and complexity (for example, soil layering and vegetation). There are few large-scale soil moisture measurements that can be easily compared to modeled soil moisture, and none for intervals longer than the satellite record. Instead, drought is typically monitored in the real world using offline models or indices that can be estimated from more widely measured data, such as temperature and precipitation.
One common metric is the Palmer Drought Severity Index (PDSI) (18), widely used for drought monitoring and as a target variable for proxy-based reconstructions (1, 2). PDSI is a locally normalized index of soil moisture availability, calculated from the balance of moisture supply (precipitation) and demand (evapotranspiration). Because PDSI is normalized on the basis of local average moisture conditions, it can be used to compare variability and trends in drought across regions. Average moisture conditions (relative to a defined baseline) are denoted by PDSI = 0; negative PDSI values indicate drier than average conditions (droughts), and positive PDSI values indicate wetter than normal conditions (pluvials). PDSI is easily calculated from GCMs using variables from the atmosphere portion of the model (for example, precipitation, temperature, and humidity) and can be compared directly to observations. However, whereas recent work has demonstrated that PDSI is able to accurately reflect the surface moisture balance in GCMs (19), other studies have highlighted concerns that PDSI may overestimate 21st century drying because of its relatively simple soil moisture accounting and lack of direct CO2 effects that are expected to reduce evaporative losses (12, 20, 21). We circumvent these concerns by using a more physically based version of PDSI (13) (based on the Penman-Monteith potential evapotranspiration formulation) in conjunction with soil moisture from the GCMs to demonstrate robust drought responses to climate change in the Central Plains (105°W–92°W, 32°N–46°N) and the Southwest (125°W–105°W, 32°N–41°N) regions of Western North America.
RESULTS
We calculate summer season [June-July-August (JJA)] PDSI and integrated soil moisture from the surface to ~30-cm (SM-30cm) and ~2- to 3-m (SM-2m) depths from 17 GCMs (tables S1 and S2) in phase 5 of the Coupled Model Intercomparison Project (CMIP5) database (22). We focus our analyses and presentation on the RCP 8.5 “business-as-usual” high emissions scenario, designed to yield an approximate top-of-atmosphere radiative imbalance of +8.5 W m−2 by 2100. We also conduct the same analyses for a more moderate emissions scenario (RCP 4.5).
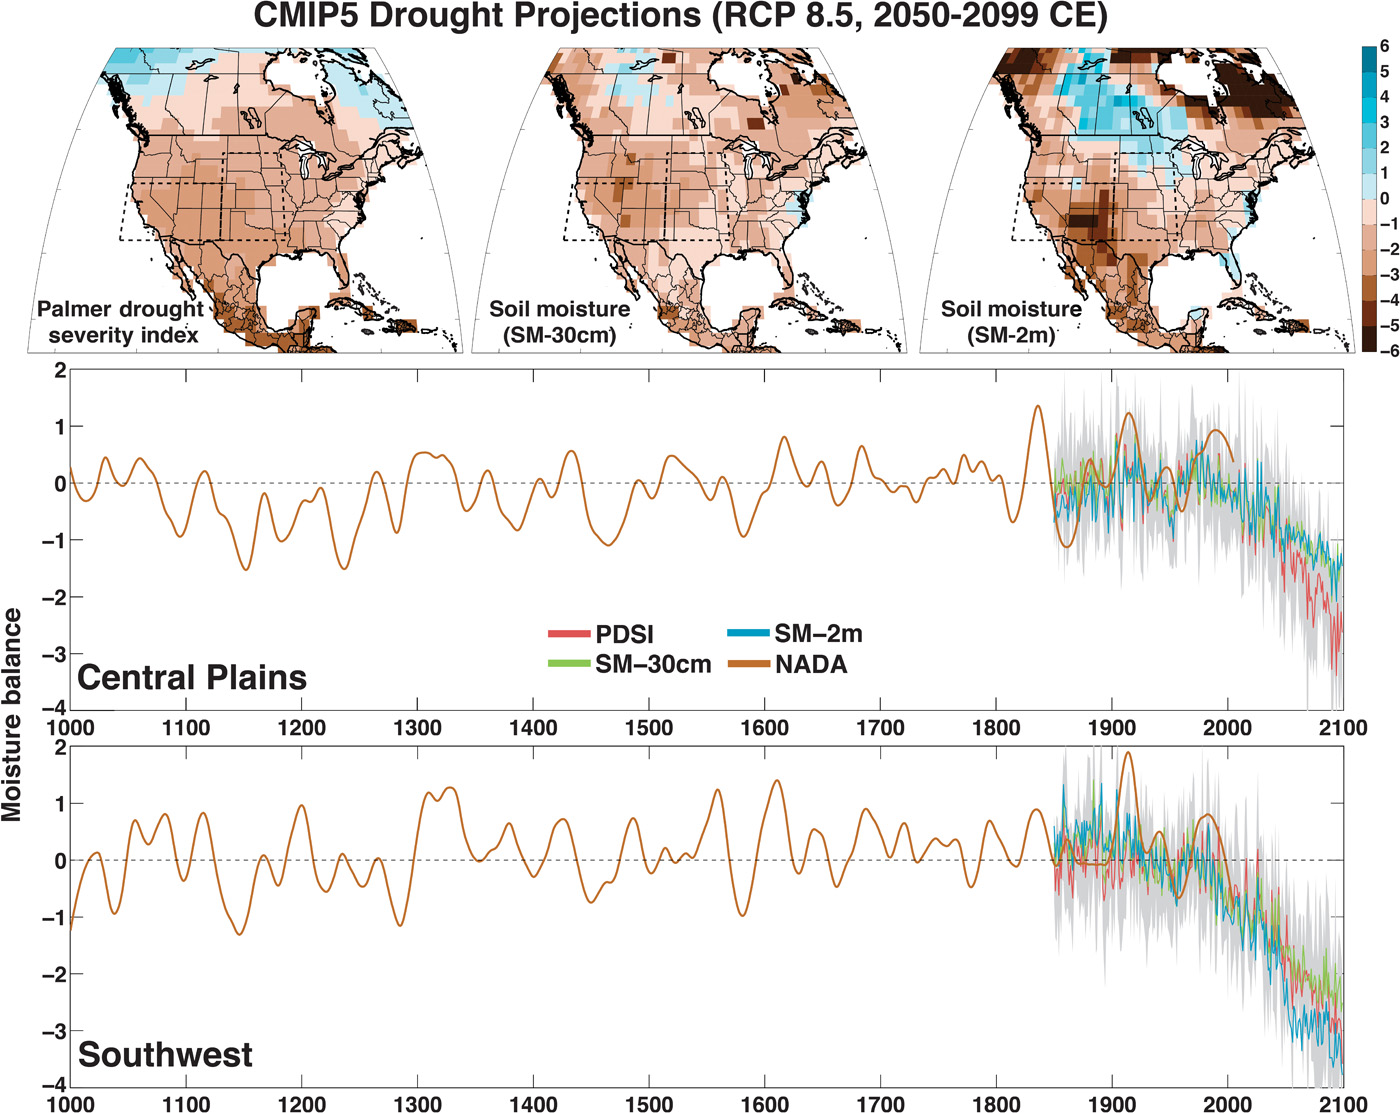
Over the calibration interval (1931–1990), the PDSI distributions from the models are statistically indistinguishable from the North American Drought Atlas (NADA) (two-sided Kolmogorov-Smirnov test, p ≥ 0.05), although there are some significant deviations in some models during other historical intervals. North American drought variability during the historical period in both models and observations is driven primarily by ocean-atmosphere teleconnections, internal variability in the climate system that is likely to not be either consistent across models or congruent in time between the observations and models, and so such disagreements are unsurprising. In the multimodel mean, all three moisture balance metrics show markedly consistent drying during the later half of the 21st century (2050–2099) (Fig. 1; see figs. S1 to S4 for individual models). Drying in the Southwest is more severe (RCP 8.5: PDSI = −2.31, SM-30cm = −2.08, SM-2m = −2.98) than that over the Central Plains (RCP 8.5: PDSI = −1.89, SM-30cm = −1.20, SM-2m = −1.17). In both regions, the consistent cross-model drying trends are driven primarily by the forced response to increased greenhouse gas concentrations (13), rather than by any fundamental shift in ocean-atmosphere dynamics [indeed, there is a wide disparity across models regarding the strength and fidelity of the simulated teleconnections over North America (23)]. In the Southwest, this forcing manifests as both a reduction in cold season precipitation (24) and an increase in potential evapotranspiration (that is, evaporative demand increases in a warmer atmosphere) (13, 25) acting in concert to reduce soil moisture. Even though cold season precipitation is actually expected to increase over parts of California in our Southwest region (24, 26), the increase in evaporative demand is still sufficient to drive a net reduction in soil moisture. Over the Central Plains, precipitation responses during the spring and summer seasons (the main seasons of moisture supply) are less consistent across models, and the drying is driven primarily by the increased evaporative demand. Indeed, this increase in potential evapotranspiration is one of the dominant drivers of global drought trends in the late 21st century, and previous work with the CMIP5 archive demonstrated that the increased evaporative demand is likely to be sufficient to overcome precipitation increases in many regions (13). In the more moderate emissions scenario (RCP 4.5), both the Southwest (RCP 4.5: PDSI = −1.49, SM-30cm = −1.63, SM-2m = −2.39) and Central Plains (RCP 4.5: PDSI = −1.21, SM-30cm = −0.89, SM-2m = −1.17) still experience significant, although more modest, drying into the future, as expected (fig. S5).
Fig. 1 Top: Multimodel mean summer (JJA) PDSI and standardized soil moisture (SM-30cm and SM-2m) over North America for 2050–2099 from 17 CMIP5 model projections using the RCP 8.5 emissions scenario. SM-30cm and SM-2m are standardized to the same mean and variance as the model PDSI over the calibration interval fromthe associated historical scenario (1931–1990). Dashed boxes represent the regions of interest: the Central Plains (105°W–92°W, 32°N–46°N) and the Southwest (125°W–105°W, 32°N–41°N). Bottom: Regional average time series of the summer season moisture balance metrics from the NADA and CMIP5models. The observational NADA PDSI series (brown) is smoothed using a 50-year loess spline to emphasize the low-frequency variability in the paleo-record. Model time series (PDSI, SM-30cm, and SM-2m) are the multimodel means averaged across the 17 CMIP5models, and the gray shaded area is the multimodel interquartile range for model PDSI.
In both regions, the model-derived PDSI closely tracks the two soil moisture metrics (figs. S6 and S7), correlating significantly for most models and model intervals (figs. S8 and S9). Over the historical simulation, average model correlations (Pearson’s r) between PDSI and SM-30cm are +0.86 and +0.85 for the Central Plains and Southwest, respectively. Correlations weaken very slightly for PDSI and SM-2m: +0.84 (Central Plains) and +0.83 (Southwest). The correlations remain strong into the 21st century, even as PDSI and the soil moisture variables occasionally diverge in terms of long-term trends. There is no evidence, however, for systematic differences between the PDSI and modeled soil moisture across the model ensemble. For example, whereas the PDSI trends are drier than the soil moisture condition over the Southwest in the ACCESS1-0 model, PDSI is actually less dry than the soil moisture in the MIROC-ESM and NorESM1-M simulations over the same region (fig. S7). These outlier observations, showing no consistent bias, in conjunction with the fact that the overall comparison between PDSI and modeled soil moisture is markedly consistent, provide mutually consistent support for the characterization of surface moisture balance by these metrics in the model projections.
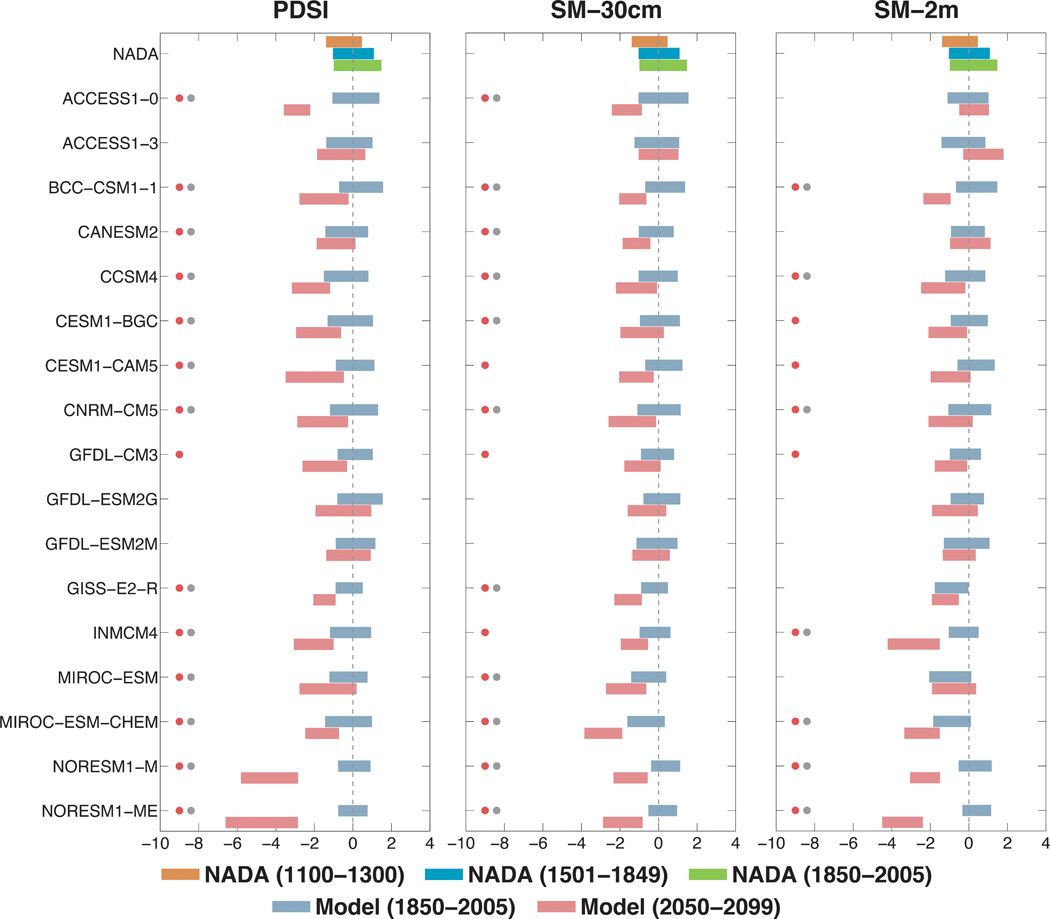
For estimates of observed drought variability over the last millennium (1000–2005), we use data from the NADA, a tree-ring based reconstruction of JJA PDSI. Comparisons between the NADA and model moisture are shown in the bottom panels of Fig. 1. In the NADA, both the Central Plains (Fig. 2) and Southwest (Fig. 3) are drier during the Medieval megadrought interval (1100–1300 CE) than either the Little Ice Age (1501–1849) or historical periods (1850–2005). For nearly all models, the 21st century projections under the RCP 8.5 scenario reveal dramatic shifts toward drier conditions. Most models (indicated with a red dot) are significantly drier (one-sided Kolmogorov-Smirnov test, p ≤ 0.05) in the latter part of the 21st century (2050–2099) than during their modeled historical intervals (1850–2005). Strikingly, shifts in projected drying are similarly significant in most models when measured against the driest and most extreme megadrought period of the NADA from 1100 to 1300 CE (gray dots). Results are similar for the more moderate RCP 4.5 emissions scenario (figs. S10 and S11), which still indicates widespread drying, albeit at a reduced magnitude for many models. Although there is some spread across the models and metrics, only two models project wetter conditions in RCP 8.5. In the Central Plains, SM-2m is wetter in ACCESS1-3, with little change in SM-30cm and slightly wetter conditions in PDSI. In the Southwest, CanESM2 projects markedly wetter SM-2m conditions; PDSI in the same model is slightly wetter, whereas SM-30cm is significantly drier.
Fig. 2 Interquartile range of PDSI and soil moisture from the NADA and CMIP5 GCMs, calculated over various time intervals for the Central Plains. The groups of three stacked bars at the top of each column are from the NADA PDSI: 1100–1300 (the time of the Medieval-era megadroughts, brown), 1501–1849 (the Little Ice Age, blue), and 1850–2005 (the historical period, green). Purple and red bars are for the modeled historical period (1850–2005) and late 21st century (2050–2099) period, respectively. Red dots indicate model 21st century drought projections that are significantly drier than the model simulated historical periods. Gray dots indicate model 21st century drought projections that are significantly drier than the Medieval-era megadrought period in the NADA.
When the RCP 8.5 multimodel ensemble is pooled together (Fig. 4), projected changes in the Central Plains and Southwest (2050–2099 CE) for all three moisture balance metrics are significantly drier compared to both the modern model interval (1850–2005 CE) and 1100–1300 CE in the NADA (one-sided Kolmogorov-Smirnov test, p ≤ 0.05). In the case of SM-2m in the Southwest, the density function is somewhat flattened, with an elongated right (wet) tail. This distortion arises from the disproportionate contribution to the density function from the wetting in the five CanESM2 ensemble members. Even with this contribution, however, the SM-2m drying in the multimodel ensemble is still significant. Results are nearly identical for the pooled RCP 4.5 multimodel ensemble (fig. S12), which still indicates a significantly drier late 21st century compared to either the historical interval or Medieval megadrought period.
Fig. 3 Same as Fig. 2, but for the Southwest.Fig. 4 Kernel density functions of PDSI, SM-30cm, and SM-2m for the Central Plains and Southwest, calculated from the NADA and the GCMs. The NADA distribution (brown shading) is from 1100–1300 CE, the timing of the medieval megadroughts. Blue lines represent model distributions calculated from all years from all models pooled over the historical scenario (1850–2005 CE). Red lines are for all model years pooled from the RCP 8.5 scenario (2050–2099 CE).
With this shift in the full hydroclimate distribution, the risk of decadal or multidecadal drought occurrences increases substantially. We calculated the risk (17) of decadal or multidecadal drought occurrences for two periods in our multimodel ensemble: 1950–2000 and 2050–2099 (Fig. 5). During the historical period, the risk of a multidecadal megadrought is quite small: <12% for both regions and all moisture metrics. Under RCP 8.5, however, there is ≥80% chance of a multidecadal drought during 2050–2099 for PDSI and SM-30cm in the Central Plains and for all three moisture metrics in the Southwest. Drought risk is reduced slightly in RCP 4.5 (fig. S13), with largest reductions in multidecadal drought risk over the Central Plains. Ultimately, the consistency of our results suggests an exceptionally high risk of a multidecadal megadrought occurring over the Central Plains and Southwest regions during the late 21st century, a level of aridity exceeding even the persistent megadroughts that characterized the Medieval era.
Fig. 5 Risk (percent chance of occurrence) of decadal (11-year) andmultidecadal (35-year) drought, calculated from the multimodel ensemble for PDSI, SM-30cm, and SM-2m. Risk calculations are conducted for two separate model intervals: 1950–2000 (historical scenario) and 2050–2099 (RCP 8.5). Results for the Central Plains are in the top row, and those for the Southwest are in the bottom row.
DISCUSSION
Within the body of literature investigating North American hydroclimate, analyses of drought variability in the historical and paleoclimate records are often separate from discussions of global warming–induced changes in future hydroclimate. This disconnection has traditionally made it difficult to place future drought projections within the context of observed and reconstructed natural hydroclimate variability. Here, we have demonstrated that the mean state of drought in the late 21st century over the Central Plains and Southwest will likely exceed even the most severe megadrought periods of the Medieval era in both high and moderate future emissions scenarios, representing an unprecedented fundamental climate shift with respect to the last millennium. Notably, the drying in our assessment is robust across models and moisture balance metrics. Our analysis thus contrasts sharply with the recent emphasis on uncertainty about drought projections for these regions (21, 27), including the most recent Intergovernmental Panel on Climate Change assessment report (28).
Our results point to a remarkably drier future that falls far outside the contemporary experience of natural and human systems in Western North America, conditions that may present a substantial challenge to adaptation. Human populations in this region, and their associated water resources demands, have been increasing rapidly in recent decades, and these trends are expected to continue for years to come (29). Future droughts will occur in a significantly warmer world with higher temperatures than recent historical events, conditions that are likely to be a major added stress on both natural ecosystems (30) and agriculture (31). And, perhaps most importantly for adaptation, recent years have witnessed the widespread depletion of nonrenewable groundwater reservoirs (32, 33), resources that have allowed people to mitigate the impacts of naturally occurring droughts. In some cases, these losses have even exceeded the capacity of Lake Mead and Lake Powell, the two major surface reservoirs in the region (34, 35). Combined with the likelihood of a much drier future and increased demand, the loss of groundwater and higher temperatures will likely exacerbate the impacts of future droughts, presenting a major adaptation challenge for managing ecological and anthropogenic water needs in the region.
MATERIALS AND METHODS
Estimates of drought variability over the historical period and the last millennium used the latest version of the NADA (1), a tree ring–based reconstruction of summer season (JJA) PDSI. All statistics were based on regional PDSI averages over the Central Plains (105°W–92°W, 32°N–46°N) and the Southwest (125°W–105°W, 32°N–41°N). We restricted our analysis to 1000–2005 CE; before 1000 CE, the quality of the reconstruction in these regions declines.
The 21st century drought projections used output from GCM simulations in the CMIP5 database (22) (table S1). All models represent one or more continuous ensemble members from the historical (1850–2005 CE) and RCP 4.5 (15 models available) and 8.5 (17 models available) emissions scenarios (2006–2099 CE). We used the same methodology as in (13) to calculate model PDSI for the full interval (1850–2099 CE), using the Penman-Monteith formulation of potential evapotranspiration. The baseline period for calibrating and standardizing the model PDSI anomalies was 1931–1990 CE, the same baseline period as the NADA PDSI. Negative model PDSI values therefore indicate drier conditions than the average for 1931–1990.
To augment the model PDSI calculations and comparisons with observed drought variability in the NADA, we also calculated standardized soil moisture metrics from the GCMs for two depths: ~30 cm (SM-30cm) and ~2 to 3 m (SM-2m) (table S2). For these soil moisture metrics, the total soil moisture from the surface was integrated to these depths and averaged over JJA. At each grid cell, we then standardized SM-30cm and SM-2m to match the same mean and interannual SD for the model PDSI over 1931–1990. This allows for direct comparison of variability and trends between model PDSI and model soil moisture and between the model metrics (PDSI, SM-30cm, and SM-2m) and the NADA (PDSI) while still independently preserving any low-frequency variability or trends in the soil moisture that may be distinct from the PDSI calculation. The soil moisture standardization does not impose any artificial constraints that would force the three metrics to agree in terms of variability or future trends, allowing SM-30cm and SM-2m to be used as indicators of drought largely independent of PDSI.
Risk of decadal and multidecadal megadrought occurrence in the multimodel ensemble is estimated from 1000 Monte Carlo realizations of each moisture balance metric (PDSI, SM-30cm, and SM-2m), as in (17). This method entails estimating the mean and SD of a given drought index (for example, PDSI or soil moisture) over a reference period (1901–2000), then subtracting that mean and SD from the full record (1850–2100) to produce a modified z score. The differences between the reference mean and SD are then used to conduct (white noise) Monte Carlo simulations of the future (2050–2100) to emulate the statistics of that era. The fraction of Monte Carlo realizations exhibiting a decadal or multidecadal drought are then calculated from each Monte Carlo simulation of each experiment in both regions considered here. Finally, these risks from each model are averaged together to yield the overall risk estimates reported here. Additional details on the methodology can be found in (17).
UPPLEMENTARY MATERIALS
Supplementary material for this article is available at http://advances.sciencemag.org/cgi/ content/full/1/1/e1400082/DC1
Fig. S1. For the individual models, ensemble mean soil moisture balance (PDSI, SM-30cm, and SM-2m) for 2050–2099: ACCESS1.0, ACCESS1.3, BCC-CSM1.1, and CanESM2.
Fig. S2. Same as fig. S1, but for CCSM4, CESM1-BGC, CESM-CAM5, and CNRM-CM5.
Fig. S3. Same as fig. S1, but for GFDL-CM3, GFDL-ESM2G, GFDL-ESM2M, and GISS-E2-R.
Fig. S4. Same as fig. S1, but for INMCM4.0,MIROC-ESM, MIROC-ESM-CHEM, NorESM1-M, and NorESM1-ME models.
Fig. S5. Same as Fig. 1, but for the RCP 4.5 scenario.
Fig. S6. Regional average moisture balance time series (historical + RCP 8.5) from the first ensemble member of each model over the Central Plains.
Fig. S7. Same as fig. S6, but for the Southwest.
Fig. S8. Pearson’s correlation coefficients for three time intervals from the models over the Central Plains: PDSI versus SM-30cm, PDSI versus SM-2m, and SM-30cm versus SM-2m.
Fig. S9. Same as fig. S8, but for the Southwest.
Fig. S10. Same as Fig. 2, but for the RCP 4.5 scenario.
Fig. S11. Same as Fig. 3, but for the RCP 4.5 scenario.
Fig. S12. Same as Fig. 4, but for the RCP 4.5 scenario.
Fig. S13. Same as Fig. 5, but for the RCP 4.5 scenario.
Table S1. Continuous model ensembles from the CMIP5 experiments (1850–2099, historical + RCP8.5 scenario) used in this analysis, including the modeling center or group that supplied the output, the number of ensemble members, and the approximate spatial resolution.
Table S2. The number of soil layers integrated for our CMIP5 soil moisture metrics (SM-30cm and SM-2m), and the approximate depth of the bottom soil layer.
This is an open-access article distributed under the terms of the Creative Commons Attribution-NonCommercial license, which permits use, distribution, and reproduction in any medium, so long as the resultant use is not for commercial advantage and provided the original work is properly cited.
Given the size and tremendous heat capacity of the global oceans, it takes a massive amount of heat energy to raise Earth’s average yearly surface temperature even a small amount. The 2-degree increase in global average surface temperature that has occurred since the pre-industrial era (1880-1900) might seem small, but it means a significant increase in accumulated heat. That extra heat is driving regional and seasonal temperature extremes, reducing snow cover and sea ice, intensifying heavy rainfall, and changing habitat ranges for plants and animals—expanding some and shrinking others.
Conditions in 2020
According to the 2020 Global Climate Report from NOAA National Centers for Environmental Information, every month of 2020 except December was in the top four warmest on record for that month. In December, the presence of a moderately strong La Niña event cooled the tropical Pacific Ocean and dampened the global average warmth. The month turned out as “only” the eighth warmest December on record.
This animation shows maps of monthly temperatures for January–December 2020 compared to the 1981–2010 average, with warm anomalies in red and cool anomalies in blue. The final frame of the animation shows the 2020 average. Note that the temperature range on the monthly maps is broader than the range for the annual average (plus or minus 9 degrees versus plus or minus 5 degrees). Image by NOAA Climate.gov, based on data from NOAA NCEI.
Despite La Niña, 2020 ranked as the second-warmest year in the 141-year record for the combined land and ocean surface, and land areas were hottest on record. Many parts of Europe and Asia were record warm, including most of France and northern Portugal and Spain, most of the Scandinavian Peninsula, Russia, and southeastern China. An even larger portion of the globe was much warmer than average, including most of the Atlantic and Indian Oceans. The heat reached all the way to the Antarctic, where the station at Esperanza Base, at the tip of the Antarctic Peninsula, appeared to set a new all-time record high temperature of 65.1 degrees Fahrenheit (18.4 degrees Celsius) on February 6, 2020.
For more regional details and 2020 climate statistics, see the 2020 Annual Climate Report from NOAA’s National Centers for Environmental Information.
Change over time
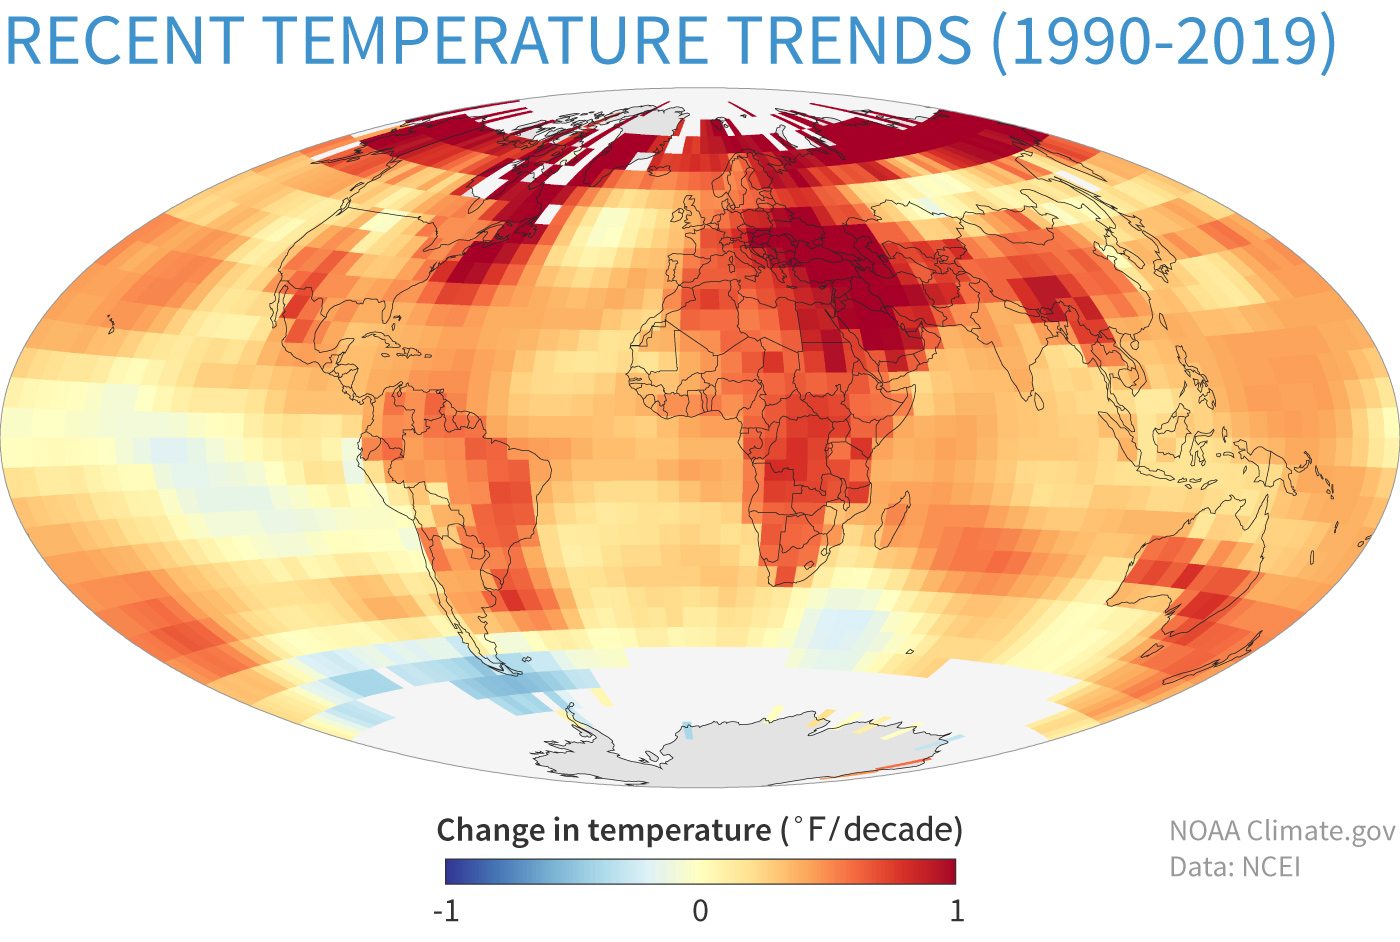
Though warming has not been uniform across the planet, the upward trend in the globally averaged temperature shows that more areas are warming than cooling. According to NOAA’s 2020 Annual Climate Report the combined land and ocean temperature has increased at an average rate of 0.13 degrees Fahrenheit ( 0.08 degrees Celsius) per decade since 1880; however, the average rate of increase since 1981 (0.18°C / 0.32°F) has been more than twice that rate.
Changes in global average surface temperature from 1990-2019. Places that warmed by up to 1° Fahrenheit over the past 30 years are red, places that have cooled by up to 1° F are blue, and places where we don’t have enough observations to calculate a trend are light gray. NOAA Climate.gov map, based on NCEI data.
The 10 warmest years on record have all occurred since 2005, and 7 of the 10 have occurred just since 2014. Looking back to 1988, a pattern emerges: except for 2011, as each new year is added to the historical record, it becomes one of the top 10 warmest on record at that time, but it is ultimately replaced as the “top ten” window shifts forward in time.
By 2020, models project that global surface temperature will be more than 0.5°C (0.9°F) warmer than the 1986-2005 average, regardless of which carbon dioxide emissions pathway the world follows. This similarity in temperatures regardless of total emissions is a short-term phenomenon: it reflects the tremendous inertia of Earth’s vast oceans. The high heat capacity of water means that ocean temperature doesn’t react instantly to the increased heat being trapped by greenhouse gases. By 2030, however, the heating imbalance caused by greenhouse gases begins to overcome the oceans’ thermal inertia, and projected temperature pathways begin to diverge, with unchecked carbon dioxide emissions likely leading to several additional degrees of warming by the end of the century.
About surface temperature
The concept of an average temperature for the entire globe may seem odd. After all, at this very moment, the highest and lowest temperatures on Earth are likely more than 100°F (55°C) apart. Temperatures vary from night to day and between seasonal extremes in the Northern and Southern Hemispheres. This means that some parts of Earth are quite cold while other parts are downright hot. To speak of the “average” temperature, then, may seem like nonsense. However, the concept of a global average temperature is convenient for detecting and tracking changes in Earth’s energy budget—how much sunlight Earth absorbs minus how much it radiates to space as heat—over time.
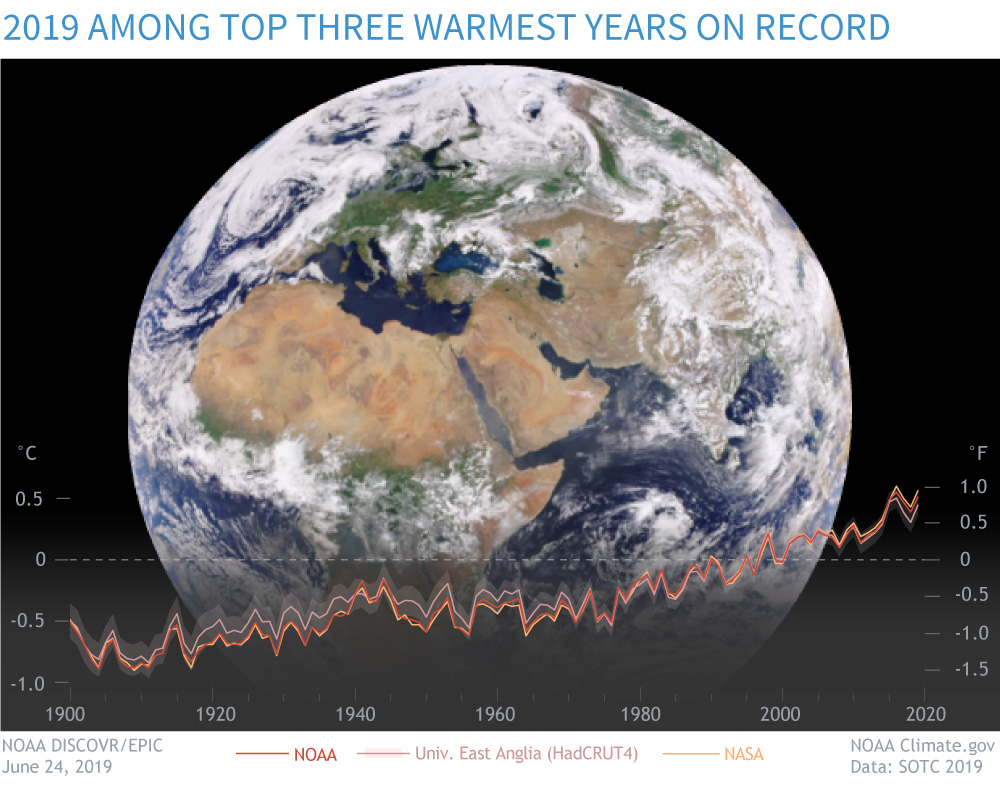
To calculate a global average temperature, scientists begin with temperature measurements taken at locations around the globe. Because their goal is to track changes in temperature, measurements are converted from absolute temperature readings to temperature anomalies—the difference between the observed temperature and the long-term average temperature for each location and date. Multiple independent research groups across the world perform their own analysis of the surface temperature data, and they all show a similar upward trend.
Temperature records from NOAA, NASA, and the University of East Anglia all show an increase from the start of the 20th-century through 2019. The year 2019 counted among the top three warmest years on record. Background image from NOAA DISCOVR/EPIC. Graph by NOAA Climate.gov based on data from the Bulletin of the American Meteorological Society’s State of the Climate 2019.
Across inaccessible areas that have few measurements, scientists use surrounding temperatures and other information to estimate the missing values. Each value is then used to calculate a global temperature average. This process provides a consistent, reliable method for monitoring changes in Earth’s surface temperature over time. Read more about how the global surface temperature record is built in our Climate Data Primer.
References
Sánchez-Lugo, A., Berrisford, P., Morice, C., and Argüez, A. (2018). Temperature [in State of the Climate in 2018]. Bulletin of the American Meteorological Society, 99(8), S11–S12.
NOAA National Centers for Environmental Information, State of the Climate: Global Climate Report for Annual 2020, online January 2021, retrieved on March 15, 2021 from https://www.ncdc.noaa.gov/sotc/global/202013.
IPCC, 2013: Summary for Policymakers. In: Climate Change 2013: The Physical Science Basis. Contribution of Working Group 1 to the 5th Assessment Report of the Intergovernmental Panel on Climate Change [Stocker, T.F., D. Qin, G.-K. Plattner, M. Tignor, S.K. Allen, J. Boschung, A. Nauels, Y. Xia, V. Bex and P.M. Midgley (eds.)]. Cambridge University Press, Cambridge, United Kingdom and New York, NY, USA.
Scientists in the University of Arizona’s Department of Atmospheric Sciences are experts on our monsoon storm season. This video from 2011 explains how the monsoon works, and shows some of the cool computer models used to predict monsoon storm patters.
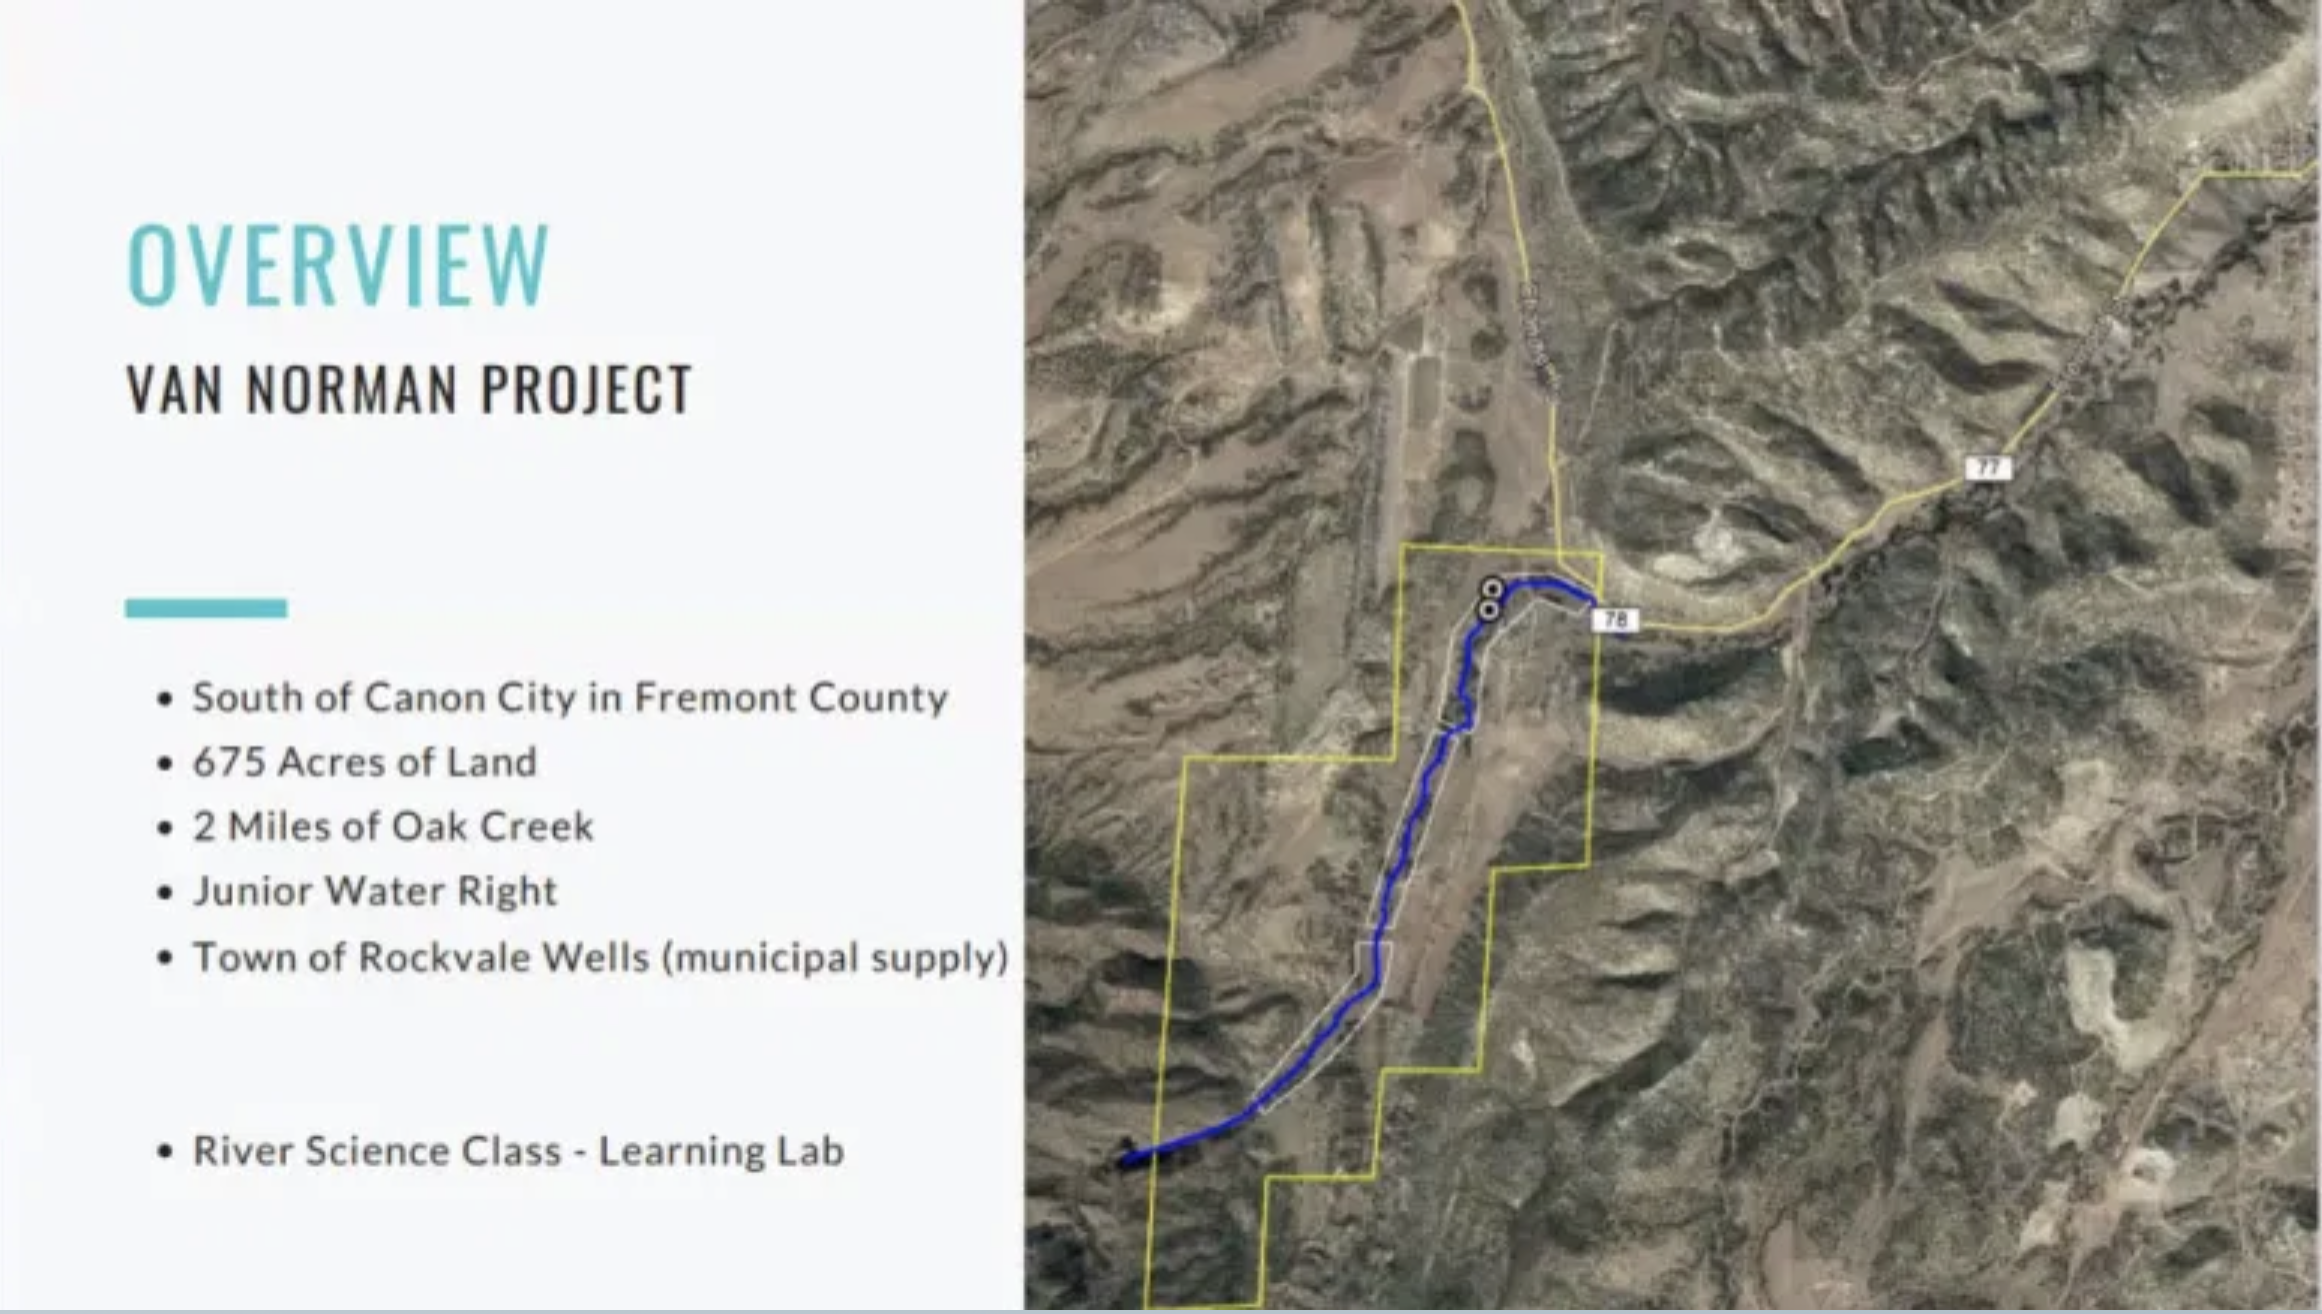
Members of the Upper Arkansas Water Conservancy District board of directors agreed to support a stream restoration project for a 2-mile section of Oak Creek on the Van Norman Ranch near Cañon City.
Luke Javernick, executive director of Cañon City-based River Science, provided an overview of the project at the District’s May board meeting.
As a demonstration project, the endeavor promises to provide important information to guide future restoration efforts, and since the land lies within the Upper Ark District, directors and staff agreed on the importance of being involved to better understand the risk to water rights as well as the benefits.
Javernick said the benefits of “process-based stream restoration” include wildfire suppression and habitat improvements in the stream as well as in the riparian zone. “But the real impact is restoring hydrologic connectivity between the surface water and groundwater.”
Process-based restoration involves hand-building stream features that mimic natural structures, he said. “We’re mimicking nature, encouraging natural river processes for beneficial restoration,” and those structures can be modified or removed to accommodate the dynamics of the stream. “It takes time … five to 10 years.”
From the District’s perspective, one of the most important questions the project will attempt to answer is how stream restoration effects flows and, therefore, water rights.
“If you’re slowing the water down and allowing it to soak into the aquifer, when do you get that equilibrium?” Javernick asked. “We need UAWCD support because you’re the experts in water rights administration. … We need your help in navigating what types of creative solutions might be available.”
The Van Normans have an Oak Creek water right. However, the Town of Rockvale has the senior water right on Oak Creek, Javernick said, and “the Town is onboard.”
The Colorado Water Conservation Board has awarded a $99,900 grant to the Van Norman Project, and Javernick indicated that the Phase I project budget includes $10,000 for the Upper Ark District. “We’re asking for a $10,000 (in-kind) match.”
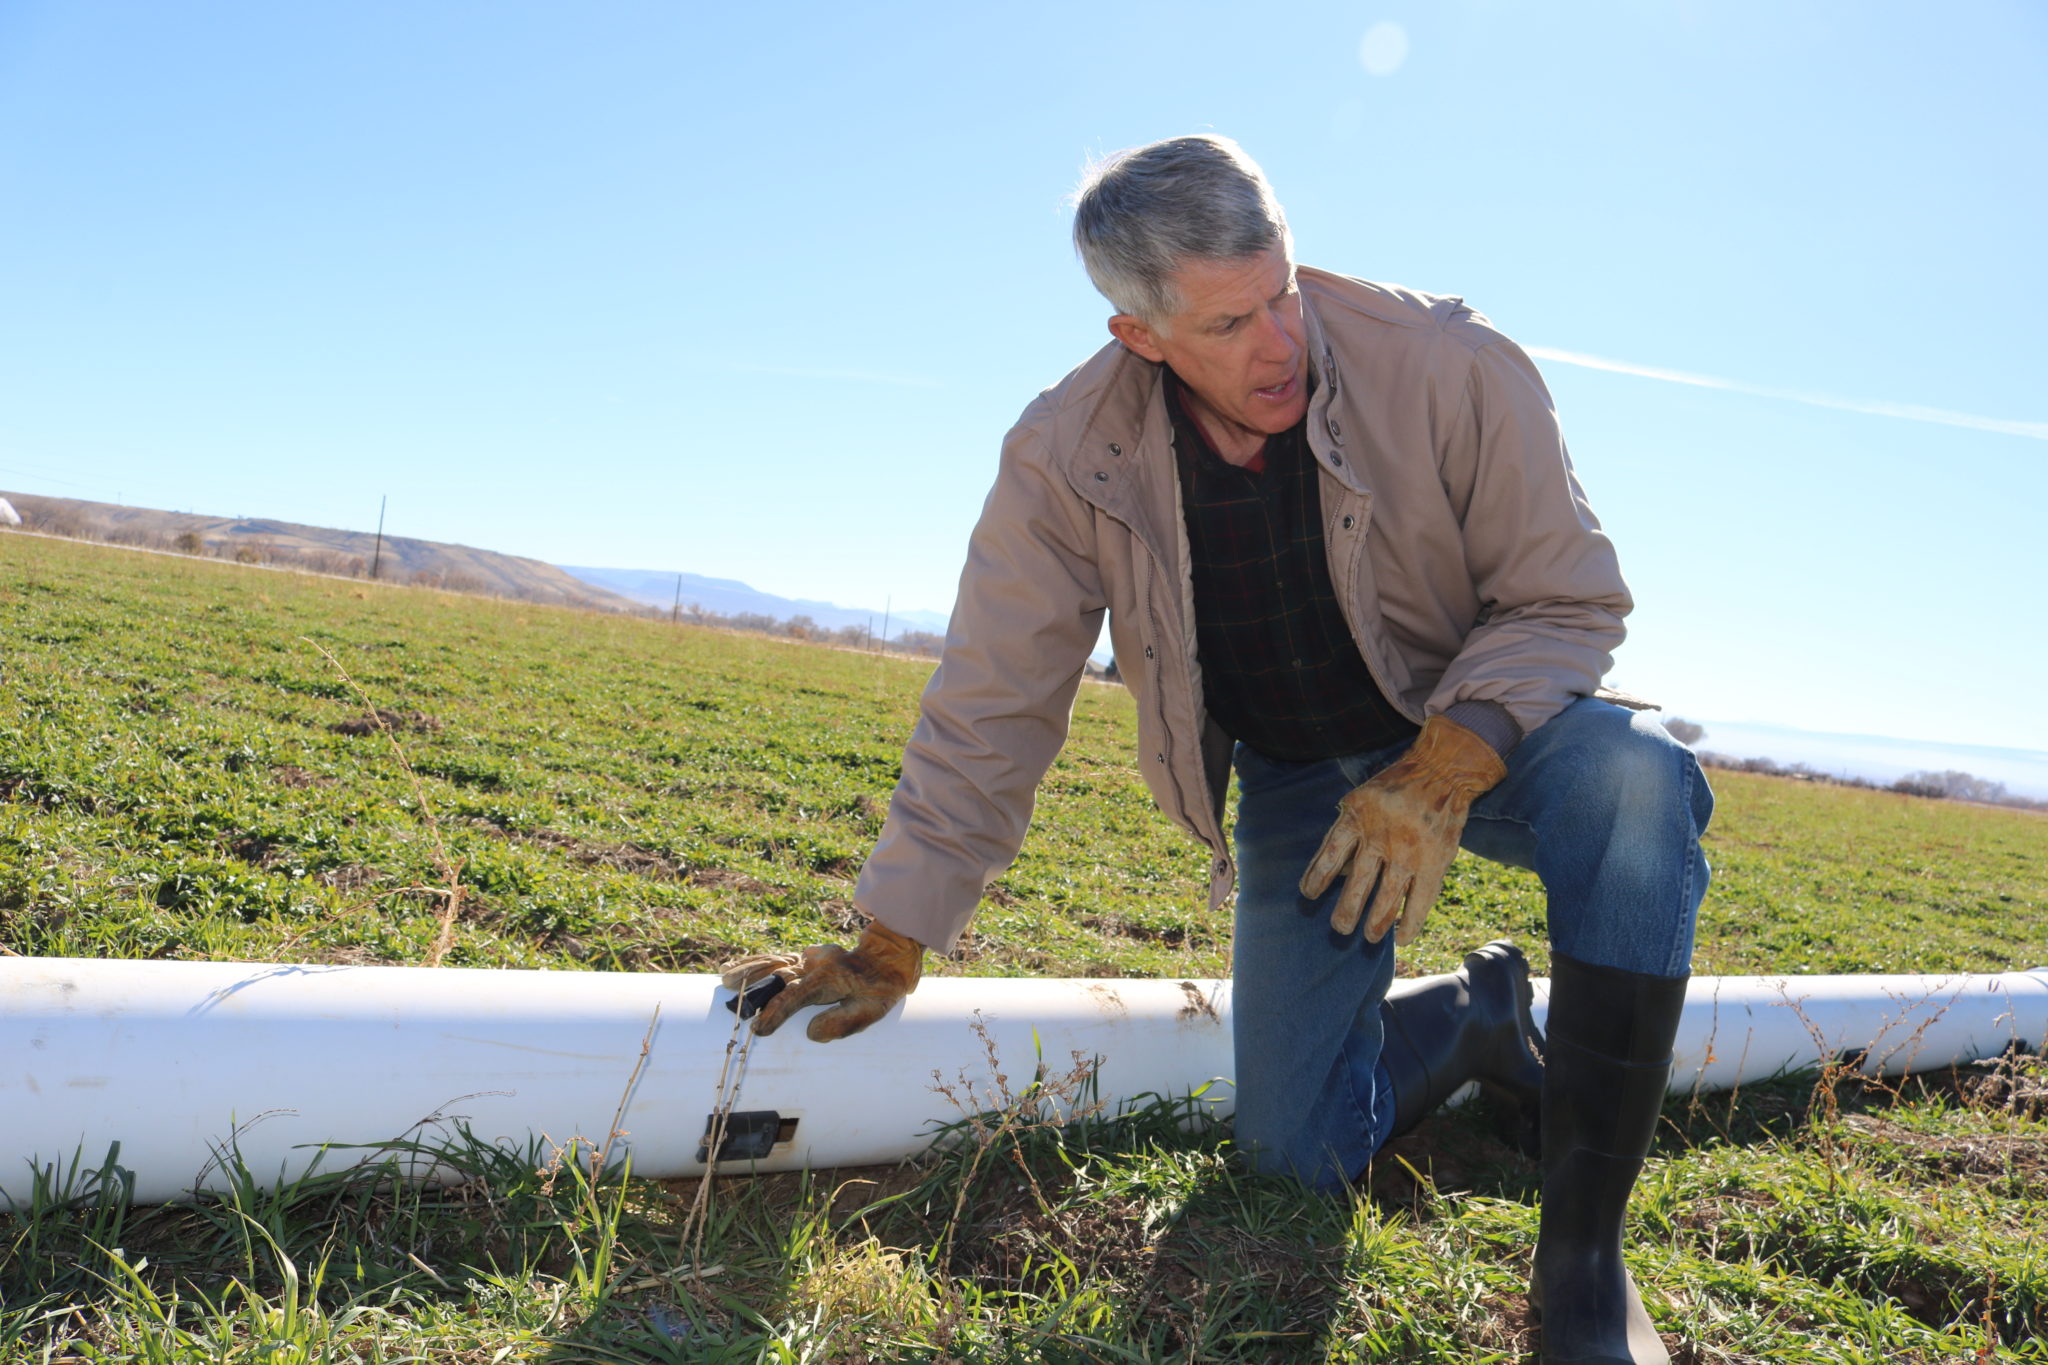
Delta County farmer Paul Kehmeier kneels by gated pipes in his family’s alfalfa field. He received funding to replace an unlined canal with the pipes in 2014 from the U.S. Department of Agriculture’s Natural Resources Conservation Service. Piping unlined canals, which is one of the primary methods used to prevent salt and selenium from leaching into the water supply, is critical to the protection of endangered fish in the Gunnison and Colorado river basins. Photo credit: Natalie Keltner-McNeil/Aspen Journalism
The U.S. Department of Agriculture’s (USDA) Natural Resources Conservation Service (NRCS) is investing up to $15 million to support the development of new tools, approaches, practices and technologies to further natural resource conservation on private lands through the Conservation Innovation Grants (CIG) program.
CIG partners use creative problem solving and innovation to address our nation’s water quality, air quality, soil health and wildlife habitat challenges, all while improving agricultural operations. This year, funded CIGs will focus on climate-smart strategies for water resources, soil health (focused on carbon sequestration and climate resilience), nutrient management, grazing lands conservation and strategies to increase conservation adoption.
“Through Conservation Innovation Grants, we’re able to co-invest with partners on the next generation of agricultural conservation solutions,” said Acting NRCS Chief Terry Cosby. “Using creative problem solving and innovation, CIG partners work to address our nation’s most pressing natural resource concerns, all while helping to ensure the health and longevity of American agriculture.”
All U.S.-based non-Federal entities and individuals are eligible to apply. Proposals must be submitted through Grants.gov by 11:59 p.m. ET on July 19, 2021.
The CIG program has three components, CIG Classic, CIG On-Farm Conservation Innovation Trials and state-level CIG. Today’s funding opportunity announcement is for CIG Classic, which supports early pilot projects or demonstrations of promising new conservation approaches, tools and technologies.
CIG Classic grantees must match each federal dollar invested at least one to one.
NRCS intends to expend at least 10% of the total funding for CIG Classic on projects that are focused on providing conservation benefits to historically undeserved producers.
In April, USDA announced $25 million for CIG On-Farm Conservation Innovation Trials, which features collaboration between NRCS and partners to implement on-the-ground conservation activities and then evaluate their impact. Incentive payments are provided to producers to offset the risk of implementing new approaches. The On-Farm Conservation Innovation Trials funding opportunity deadline is June 21, 2021.
More Information
For more information on CIG, please visit the CIG website.
Under the Biden-Harris Administration, USDA is engaged in a whole-of-government effort to combat the climate crisis and conserve and protect our nation’s lands, biodiversity and natural resources including our soil, air and water. Through conservation practices and partnerships, USDA aims to enhance economic growth and create new streams of income for farmers, ranchers, producers and private foresters. Successfully meeting these challenges will require USDA and our agencies to pursue a coordinated approach alongside USDA stakeholders, including State, local and Tribal governments.
USDA touches the lives of all Americans each day in so many positive ways. In the Biden-Harris Administration, USDA is transforming America’s food system with a greater focus on more resilient local and regional food production, fairer markets for all producers, ensuring access to healthy and nutritious food in all communities, building new markets and streams of income for farmers and producers using climate smart food and forestry practices, making historic investments in infrastructure and clean energy capabilities in rural America, and committing to equity across the Department by removing systemic barriers and building a workforce more representative of America. To learn more, visit http://www.usda.gov.
Watering restrictions are in place for Glenwood Springs residents, according to a news release.
Odd numbered home addresses can water on odd days of the month and even numbered home addresses can water on even days of the month.
Watering on both odd and even numbered days is prohibited from 10 a.m. to 6 p.m…
Glenwood Springs spokesperson Bryana Starbuck said the watering schedule was enacted during the response to the Grizzly Creek Fire last year as a necessary precaution to maintain water capacity due to fire activity near one of the city’s water sources…
The city expects the water schedule to remain in effect throughout the summer to help encourage water conservation during the drought conditions, Starbuck said.
Jessica Woelfel’s family is weighing whether or not they can continue living in their home of six years in Midway, south of Fountain, as affordable water options dry up.
“It’s forcing us out of our home,” said Woelfel. “We’re going to have to move and we own this place. We’re kind of down to the last resort here.”
Because her family doesn’t live in Fountain City limits, they can’t receive Fountain City water. Because they don’t live in Pueblo, they can’t get a key for access to Pueblo water. The family says Wigwam utilities quoted them $50,000 for a new water tap and pipes to their home. Unable to afford that hefty bill, her household pays Koury Transport to truck in water from the Pueblo area at a rate of $85 per 1,000 gallons…
Owner of Koury Transport, Grant Koury, says he does everything he can to keep costs low. But the business model factors in upfront water costs, rising fuel prices, heavy equipment, insurance, delivery, and labor fees.
Koury told 13 Investigates the company services 20 to 40 Midway-area homes twice a week. Each roundtrip takes about five hours. Koury says his business also faces limited water supply coupled with increasing demand…
Meanwhile, the Fountain Utilities Department is evaluating how it can accommodate thousands of new taps amid rapid development plans…
The city of Fountain currently provides water to 8,700 taps. A recent study revealed a way to improve the water delivery system. City leaders are implementing a plan that would increase the number of available water taps in Fountain by 1,000 to 1,200…
The Fountain Utilities Department calculated the demand for new water taps across all proposed development projects. It’s more than three times the current supply.
Here’s the release from the International Energy Agency:
World’s first comprehensive energy roadmap shows government actions to rapidly boost clean energy and reduce fossil fuel use can create millions of jobs, lift economic growth and keep net zero in reach
The world has a viable pathway to building a global energy sector with net-zero emissions in 2050, but it is narrow and requires an unprecedented transformation of how energy is produced, transported and used globally, the International Energy Agency said in a landmark special report released today.
Climate pledges by governments to date – even if fully achieved – would fall well short of what is required to bring global energy-related carbon dioxide (CO2) emissions to net zero by 2050 and give the world an even chance of limiting the global temperature rise to 1.5 °C, according to the new report, Net Zero by 2050: a Roadmap for the Global Energy Sector.
The report is the world’s first comprehensive study of how to transition to a net zero energy system by 2050 while ensuring stable and affordable energy supplies, providing universal energy access, and enabling robust economic growth. It sets out a cost-effective and economically productive pathway, resulting in a clean, dynamic and resilient energy economy dominated by renewables like solar and wind instead of fossil fuels. The report also examines key uncertainties, such as the roles of bioenergy, carbon capture and behavioural changes in reaching net zero.
“Our Roadmap shows the priority actions that are needed today to ensure the opportunity of net-zero emissions by 2050 – narrow but still achievable – is not lost. The scale and speed of the efforts demanded by this critical and formidable goal – our best chance of tackling climate change and limiting global warming to 1.5 °C – make this perhaps the greatest challenge humankind has ever faced,” said Fatih Birol, the IEA Executive Director. “The IEA’s pathway to this brighter future brings a historic surge in clean energy investment that creates millions of new jobs and lifts global economic growth. Moving the world onto that pathway requires strong and credible policy actions from governments, underpinned by much greater international cooperation.”
Building on the IEA’s unrivalled energy modelling tools and expertise, the Roadmap sets out more than 400 milestones to guide the global journey to net zero by 2050. These include, from today, no investment in new fossil fuel supply projects, and no further final investment decisions for new unabated coal plants. By 2035, there are no sales of new internal combustion engine passenger cars, and by 2040, the global electricity sector has already reached net-zero emissions.
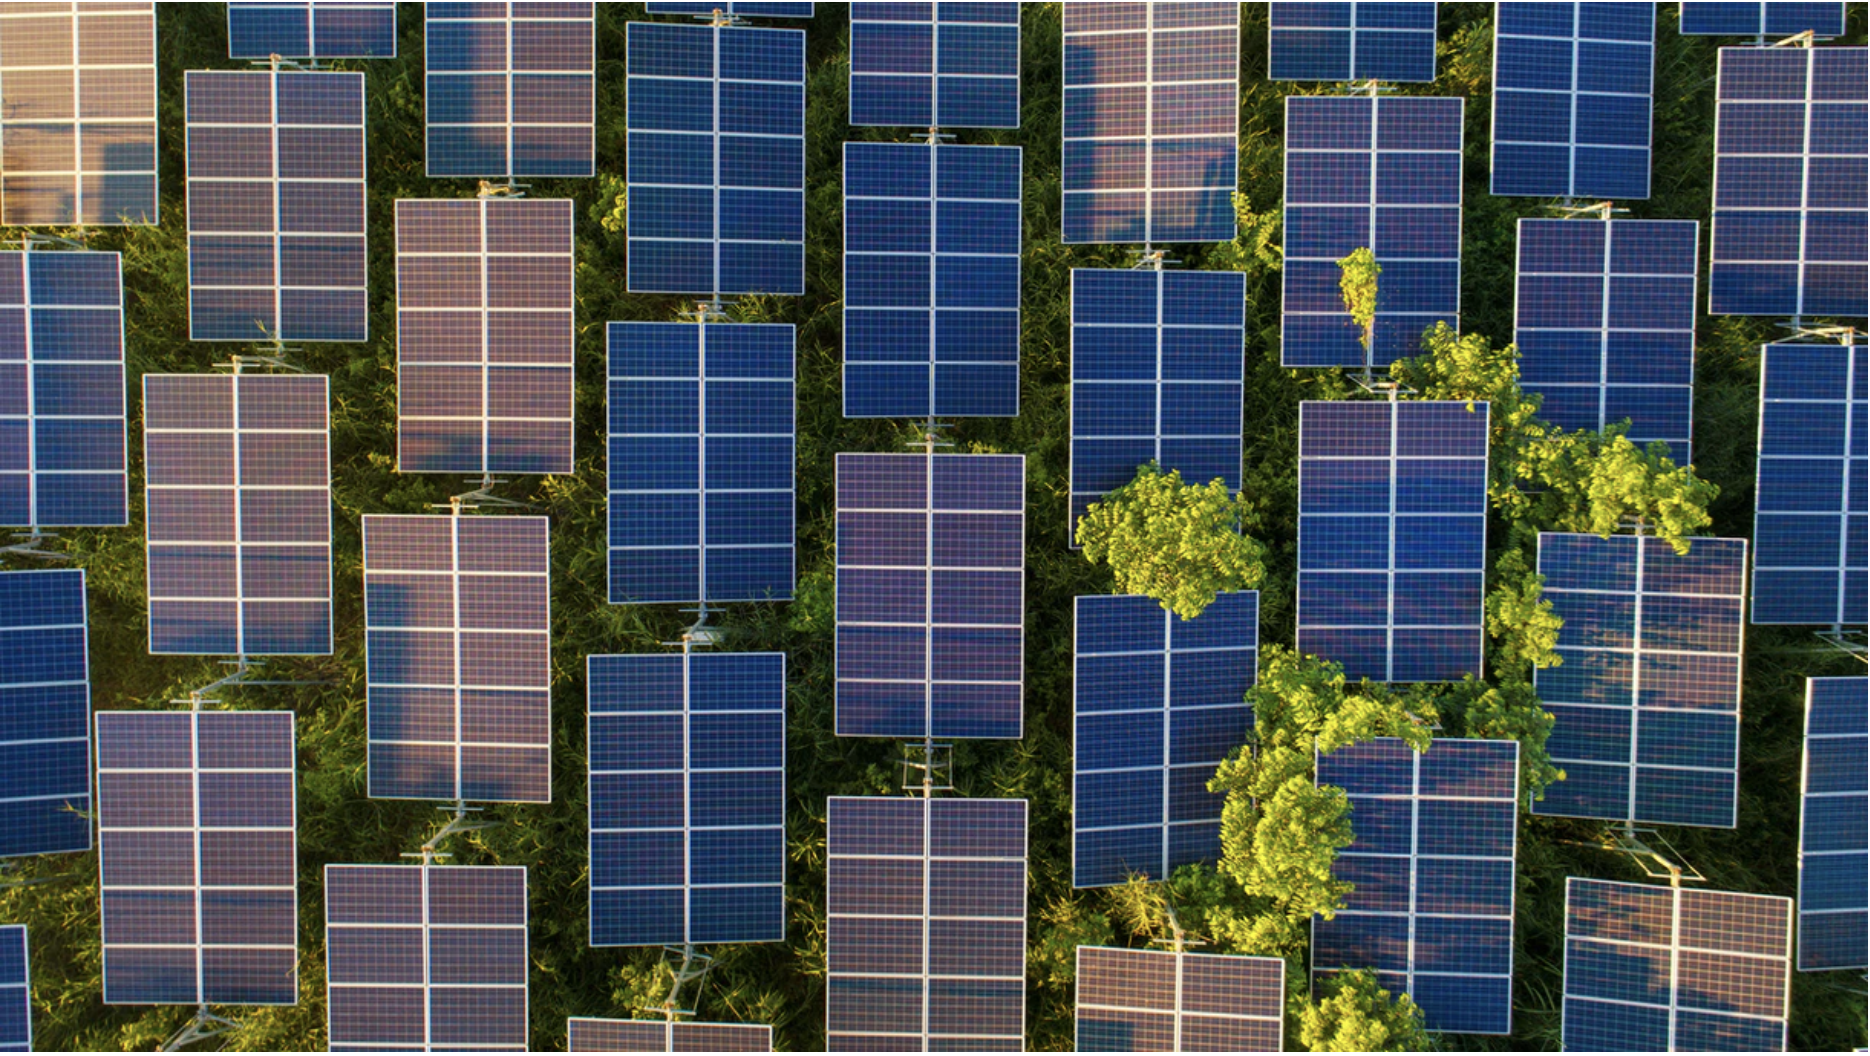
In the near term, the report describes a net zero pathway that requires the immediate and massive deployment of all available clean and efficient energy technologies, combined with a major global push to accelerate innovation. The pathway calls for annual additions of solar PV to reach 630 gigawatts by 2030, and those of wind power to reach 390 gigawatts. Together, this is four times the record level set in 2020. For solar PV, it is equivalent to installing the world’s current largest solar park roughly every day. A major worldwide push to increase energy efficiency is also an essential part of these efforts, resulting in the global rate of energy efficiency improvements averaging 4% a year through 2030 – about three times the average over the last two decades.
Most of the global reductions in CO2 emissions between now and 2030 in the net zero pathway come from technologies readily available today. But in 2050, almost half the reductions come from technologies that are currently only at the demonstration or prototype phase. This demands that governments quickly increase and reprioritise their spending on research and development – as well as on demonstrating and deploying clean energy technologies – putting them at the core of energy and climate policy. Progress in the areas of advanced batteries, electrolysers for hydrogen, and direct air capture and storage can be particularly impactful.
A transition of such scale and speed cannot be achieved without sustained support and participation from citizens, whose lives will be affected in multiple ways.
“The clean energy transition is for and about people,” said Dr Birol. “Our Roadmap shows that the enormous challenge of rapidly transitioning to a net zero energy system is also a huge opportunity for our economies. The transition must be fair and inclusive, leaving nobody behind. We have to ensure that developing economies receive the financing and technological know-how they need to build out their energy systems to meet the needs of their expanding populations and economies in a sustainable way.”
Providing electricity to around 785 million people who have no access to it and clean cooking solutions to 2.6 billion people who lack them is an integral part of the Roadmap’s net zero pathway. This costs around $40 billion a year, equal to around 1% of average annual energy sector investment. It also brings major health benefits through reductions in indoor air pollution, cutting the number of premature deaths by 2.5 million a year.
Total annual energy investment surges to USD 5 trillion by 2030 in the net zero pathway, adding an extra 0.4 percentage points a year to global GDP growth, based on a joint analysis with the International Monetary Fund. The jump in private and government spending creates millions of jobs in clean energy, including energy efficiency, as well as in the engineering, manufacturing and construction industries. All of this puts global GDP 4% higher in 2030 than it would reach based on current trends.
By 2050, the energy world looks completely different. Global energy demand is around 8% smaller than today, but it serves an economy more than twice as big and a population with 2 billion more people. Almost 90% of electricity generation comes from renewable sources, with wind and solar PV together accounting for almost 70%. Most of the remainder comes from nuclear power. Solar is the world’s single largest source of total energy supply. Fossil fuels fall from almost four-fifths of total energy supply today to slightly over one-fifth. Fossil fuels that remain are used in goods where the carbon is embodied in the product such as plastics, in facilities fitted with carbon capture, and in sectors where low-emissions technology options are scarce.
“The pathway laid out in our Roadmap is global in scope, but each country will need to design its own strategy, taking into account its own specific circumstances,” said Dr Birol. “Plans need to reflect countries’ differing stages of economic development: in our pathway, advanced economies reach net zero before developing economies. The IEA stands ready to support governments in preparing their own national and regional roadmaps, to provide guidance and assistance in implementing them, and to promote international cooperation on accelerating the energy transition worldwide.”
The special report is designed to inform the high-level negotiations that will take place at the 26th Conference of the Parties (COP26) of the United Nations Climate Change Framework Convention in Glasgow in November. It was requested as input to the negotiations by the UK government’s COP26 Presidency.
“I welcome this report, which sets out a clear roadmap to net-zero emissions and shares many of the priorities we have set as the incoming COP Presidency – that we must act now to scale up clean technologies in all sectors and phase out both coal power and polluting vehicles in the coming decade,” said COP26 President-Designate Alok Sharma. “I am encouraged that it underlines the great value of international collaboration, without which the transition to global net zero could be delayed by decades. Our first goal for the UK as COP26 Presidency is to put the world on a path to driving down emissions, until they reach net zero by the middle of this century.”
New energy security challenges will emerge on the way to net zero by 2050 while longstanding ones will remain, even as the role of oil and gas diminishes. The contraction of oil and natural gas production will have far-reaching implications for all the countries and companies that produce these fuels. No new oil and natural gas fields are needed in the net zero pathway, and supplies become increasingly concentrated in a small number of low-cost producers. OPEC’s share of a much-reduced global oil supply grows from around 37% in recent years to 52% in 2050, a level higher than at any point in the history of oil markets.
Growing energy security challenges that result from the increasing importance of electricity include the variability of supply from some renewables and cybersecurity risks. In addition, the rising dependence on critical minerals required for key clean energy technologies and infrastructure brings risks of price volatility and supply disruptions that could hinder the transition.
“Since the IEA’s founding in 1974, one of its core missions has been to promote secure and affordable energy supplies to foster economic growth. This has remained a key concern of our Net Zero Roadmap,” Dr Birol said. “Governments need to create markets for investments in batteries, digital solutions and electricity grids that reward flexibility and enable adequate and reliable supplies of electricity. The rapidly growing role of critical minerals calls for new international mechanisms to ensure both the timely availability of supplies and sustainable production.”
The full report is available for free on the IEA’s website along with an online interactive that highlights some of the key milestones in the pathway that must be achieved in the next three decades to reach net-zero emissions by 2050.