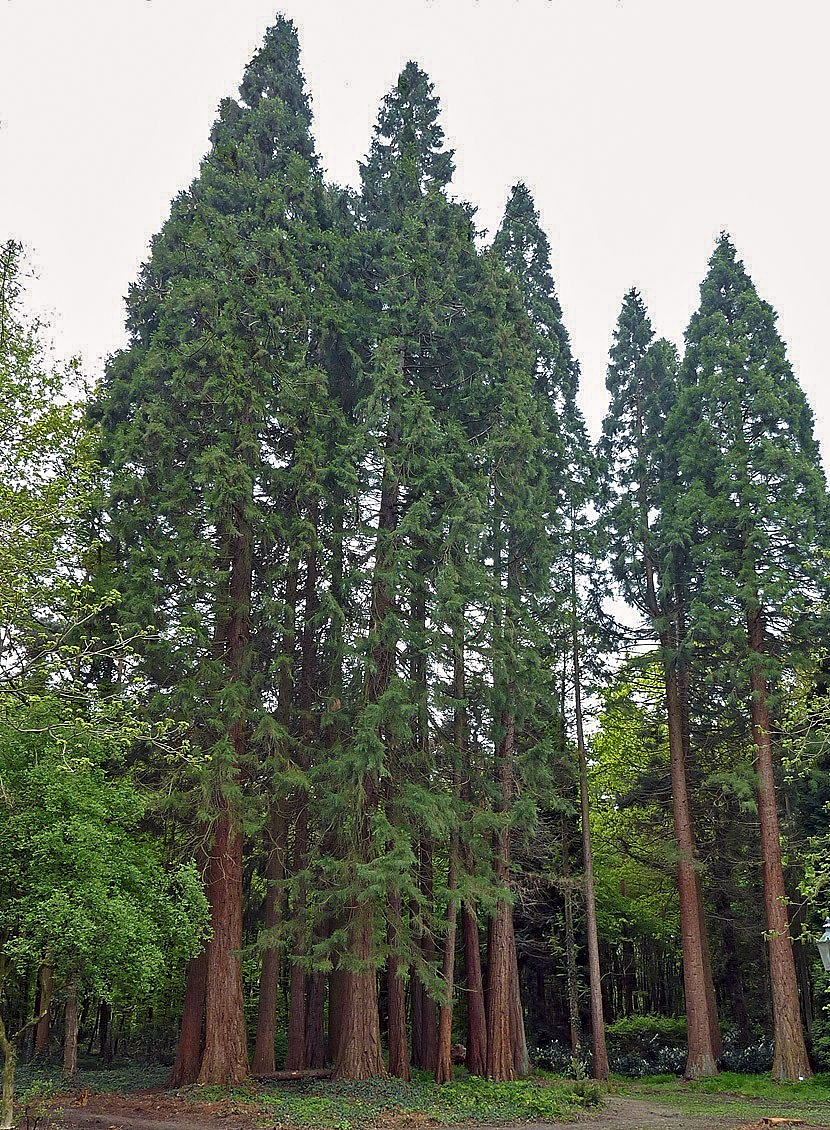
Like many Westerners, giant sequoias came recently from farther east. Of course, “recent” is a relative term. “You’re talking millions of years (ago),” William Libby said. The retired University of California, Berkeley, plant geneticist has been studying the West Coast’s towering trees for more than half a century. Needing cooler, wetter climates, the tree species arrived at their current locations some 4,500 years ago — about two generations. “They left behind all kinds of Eastern species that did not make it with them, and encountered all kinds of new things in their environment,” Libby said. Today, sequoias grow on the western slopes of California’s Sierra Nevada.
Humanity must solve the climate and nature crises together or solve neither, according to a report from 50 of the world’s leading scientists.
Global heating and the destruction of wildlife is wreaking increasing damage on the natural world, which humanity depends on for food, water and clean air. Many of the human activities causing the crises are the same and the scientists said increased use of nature as a solution was vital.
The devastation of forests, peatlands, mangroves and other ecosystems has decimated wildlife populations and released huge amounts of carbon dioxide. Rising temperatures and extreme weather are, in turn increasingly damaging biodiversity.
But restoring and protecting nature boosts biodiversity and the ecosystems that can rapidly and cheaply absorb carbon again, the researchers said. While this is crucial, the scientists emphasise that rapid cuts in fossil fuel burning is also essential to ending the climate emergency.
They also warned against action on one crisis inadvertently aggravating the other, such as creating monoculture tree plantations that store carbon but are wildlife deserts and more vulnerable to extreme weather.
“It is clear that we cannot solve [the global biodiversity and climate crises] in isolation – we either solve both or we solve neither,” said Sveinung Rotevatn, Norway’s climate and environment minister.
The peer-reviewed report was produced by the world’s leading biodiversity and climate experts, who were convened by the Intergovernmental Panel on Climate Change and the Intergovernmental Science-Policy Platform on Biodiversity and Ecosystem Services, both which report to the world’s political leaders.
The report identified actions to simultaneously fight the climate and nature crises, including expanding nature reserves and restoring – or halting the loss of – ecosystems rich in species and carbon, such as forests, natural grasslands and kelp forests.
Food systems cause a third of all greenhouse gas emissions, and more sustainable farming is another important action, helped by the ending of destructive subsidies and rich nations eating less meat and cutting food waste…
Protecting and restoring natural ecosystems was the fastest and cheapest way to remove CO2 from the atmosphere, the scientists said. Cutting fossil fuel emissions was essential, but not enough at this point in the climate crisis, said Parmesan. “We cannot avoid dangerous climate change without soaking up some of the carbon that we’ve already put into the atmosphere and the best way to suck up carbon is using the power of plants,” she said.
“The science of restoration of ecosystems has really blossomed over the last 40 years. We are now able to efficiently and effectively restore complex systems, tropical rainforest, coastal wetlands, kelp forests and seagrass meadows, natural American prairie, and UK meadows back to their near historical diversity.”
Prof Mark Maslin, of University College London, said the report was seminal: “The science is very clear that climate change and biodiversity are inseparable. To stabilise climate change we need massive rewilding and reforestation.”
The UK environment minister, Zac Goldsmith, said: “This is an absolutely critical year for nature and climate. With the UN biodiversity [and climate summits], we have an opportunity and responsibility to put the world on a path to recovery. This hugely valuable report makes it clear that addressing biodiversity loss and climate change together offers our best chance of doing so.”
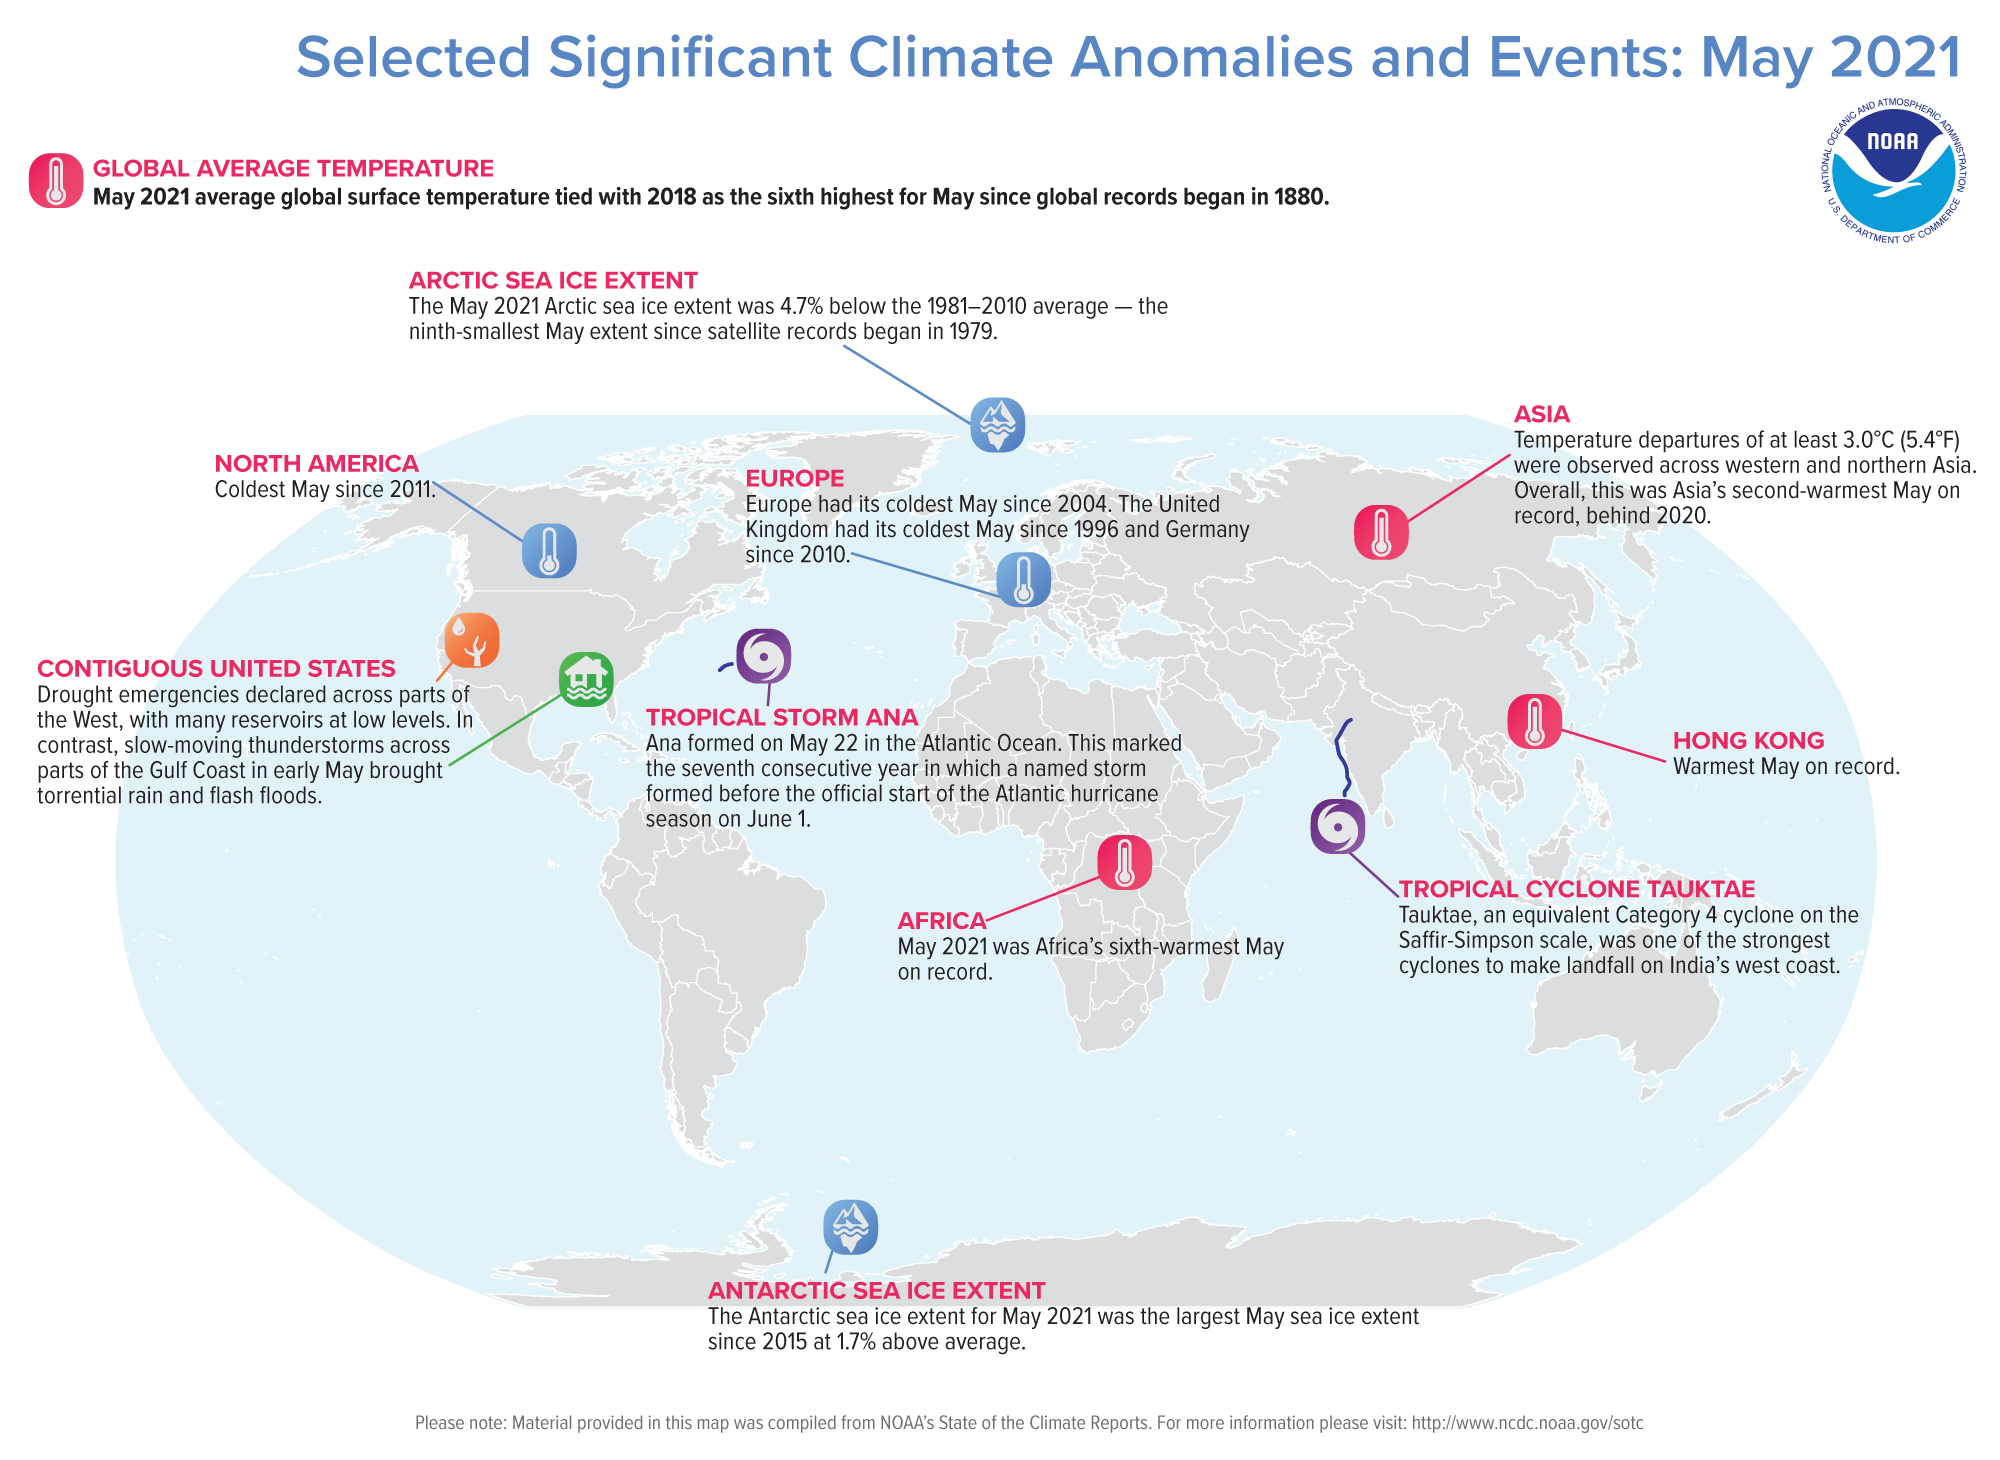
Continuing the year’s warming trend, May 2021 tied with 2018 as the world’s sixth-warmest May on record, while the year to date (through May) ranked eighth warmest, according to scientists at NOAA’s National Centers for Environmental Information.
Here’s a closer look into NOAA’s latest monthly global climate report:
Climate by the numbers
May 2021
The average global temperature in May was 1.46 degrees F (0.81 of a degree C) above the 20th-century average, tying with May 2018 as the sixth-warmest May recorded.
May 2021 ended as the 45th-consecutive May and the 437th-consecutive month with average temperatures peaking above the 20th-century average.
Regionally, Asia had its second-warmest May on record behind May 2020, and Africa had its sixth warmest. Meanwhile, Europe and North America experienced their coolest May since 2004 and 2011, respectively.
Season | March through May
The average global temperature for the three-month season, March through May, was 1.48 degrees F (0.82 of a degree C) above average, making it the eighth-warmest such season for the world on record.
The Northern Hemisphere had its sixth-warmest spring, while the Southern Hemisphere had its 11th-warmest autumn on record.
Year to date | January through May
The year to date (through May) ranked eighth-warmest on record and logged a global temperature of 1.39 degrees F (0.77 of a degree C) above the 20th-century average of 55.5 degrees F.
Africa had its third-warmest YTD on record, behind the same period for 2010 (2nd warmest) and 2016 (warmest). Asia and South America saw their eighth- and ninth-warmest YTDs on record, respectively.
A map of the world plotted with some of the most significant climate events that occurred during May 2021. Please see the story below as well as more details in the report summary from NOAA NCEI at http://bit.ly/Global202105. (NOAA NCEI)
More notable climate stats and facts from the May global climate report
Arctic sea ice retreated at a slightly slower rate: Sea ice covered about 243,000 square miles of the Arctic last month — an area roughly the size of Somalia — making it the ninth-smallest May ice coverage in the 43-year record, according to the National Snow and Ice Data Center offsite link.
Snow cover was quite sparse: The Northern Hemisphere’s snow cover in May was 1.08 million square miles below average — the third smallest for May on record. Only May 2010 and 2012 had a smaller snow cover. North America’s snow cover placed 11th smallest on record, while Eurasia saw its fifth smallest.
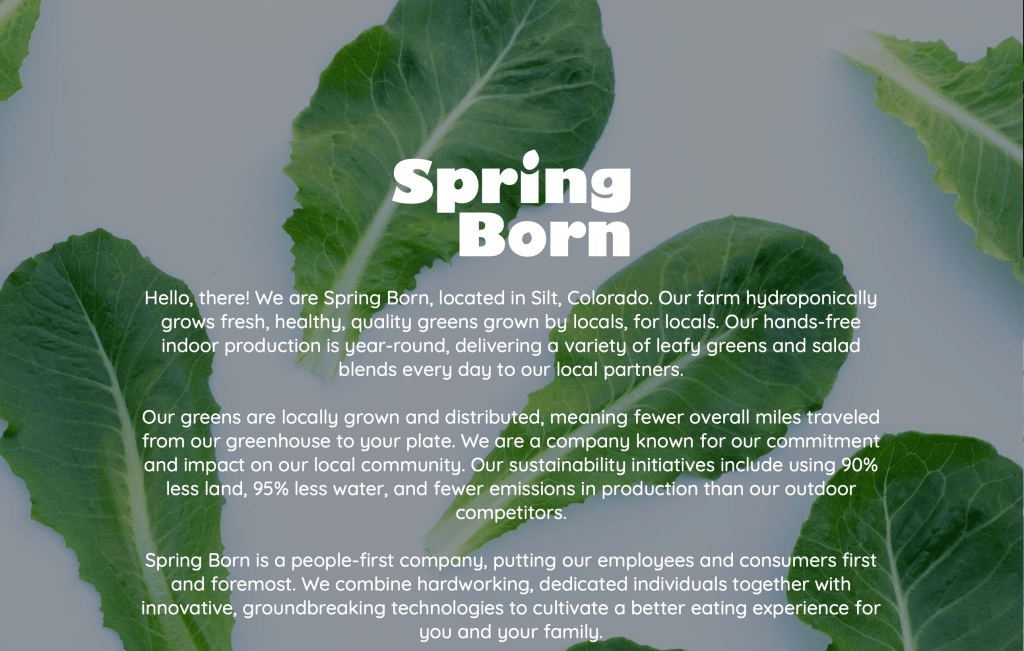
Spring Born, a 3.5-acre indoor hydroponic farm, is breaking ground in the CEA industry. The company is one of the first leafy green greenhouses in Colorado to undergo USDA Organic Certification. Spring Born products will be available for retail distribution starting August 2021.
“Spring Born combines innovative technologies and hardworking individuals that, when put together, provide fresh, healthy, quality greens better than anyone on the market,” said Charles Barr, president. “We care about the state of our environment and building sustainable practices that leave a lasting impact on our local community. Our company looks forward to supporting the community with nourishment but also economically with jobs and added business.”
Their advanced technology supports an efficient and sustainable environment for the greens and the local community. All products are grown and packed hands-free, pesticide-free, and use significantly less land and water than farm fields. The indoor farm grows, packs and distributes products directly from the greenhouse to support a long shelf life of 14 days at retail.
“Our greens are grown in a protected environment, not susceptible to the risk of harsh natural elements,” Barr said. “Spring Born promises unique varieties with consistent quality and supply year-round.”
With consumer preferences in mind, Spring Born currently offers four unique varieties available in standard retail and club-pack sizes. Spring Born will open its doors for tours and variety testing in July 2021. Contact info@springborn.us or learn more at http://www.springborn.us.
The following story was supported by funding from The Water Desk and was reported by The Utah Investigative Journalism Project in partnership with The Salt Lake Tribune.
Utah politicians and water officials have for years insisted that there is ample water in the Colorado River to fill its planned 140-mile Lake Powell pipeline to St. George in the southwestern corner of the state.
Despite impacts from climate change that have resulted in an 18% decline in river flows during the past two decades and a drop in Lake Powell’s level to just 35% of capacity, they might just be right.
Utah’s consistent argument that it has nearly 400,000 acre-feet (roughly 130 billion gallons) of undeveloped water in the river is disputed by hydrologists who say it’s using all its allotted share under the 1922 Colorado River Compact. Even so, legal experts and engineers point out that there could be room for additional development — if the state is willing to buy or take the water from someone else.
“If there is going to be a new pipeline,” Eric Kuhn, former general manager of the Colorado River District, said in an interview, “let’s not pretend that it’s going to be using new water. If they build a new pipeline, they’re going to get that from irrigation water.”
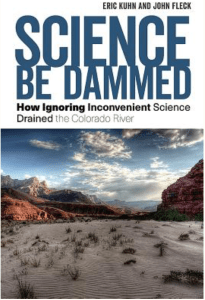
The most likely candidate is irrigation water from the Uinta Basin, said Kuhn, co-author of “Science Be Dammed: How Ignoring Inconvenient Science Drained the Colorado River.”
And that is exactly what Utah plans to do.
There’s one problem: The water the state plans to tap for the Lake Powell pipeline was previously promised to the Ute Indian Tribe, which is now suing to get back its water and asserting that the misappropriation is one of a decades-long string of racially motivated schemes to deprive it of its rights and property.
Graphic credit: Central Utah Project
Pulling the plug on the Central Utah Project
The dispute dates to the 1950s and the origins of the Central Utah Project (CUP), a series of pipelines and reservoirs that channels Colorado River water over the Wasatch Mountains to Utah’s population centers in Salt Lake and Utah counties.
Utah water managers at the time leveraged Ute tribal water rights to cut a deal for construction of the CUP. In exchange for the destruction of lands and fisheries essential to the Ute way of life, state and federal governments agreed to extend the project to tribal lands.
But once the first phases of the project were complete, Utah and its federal partners abandoned plans to build dams and pipelines for the Utes, citing excessive costs and underwhelming benefits.
“It is unclear why the costs and benefits varied so significantly,” the tribe’s 2020 federal lawsuit said, referring to the completed CUP phases delivering water to the Wasatch Front compared to the originally proposed tribal phases. “However, it is clear that as an exclusively tribal project — that is, as a project for the delivery of the Tribe’s Reserved Water Rights — [the Bureau of Reclamation] found poor economics, but when non-Indians were included as part of the project, the economics drastically improved.”
These decisions significantly curtailed the tribe’s expected economic benefits from the project, guaranteeing it would not grow as quickly as other communities that received CUP water, the complaint said. It cited, for example, a 2018 attempt by the tribe to enter into a contract with an oil and gas development company, which ultimately fell through because the tribe lacked access to sufficient water to make the project happen.
Moreover, in what the tribe sees as an illegal betrayal and violation of its rights, the state has reassigned the promised water to a variety of other projects, including the Lake Powell pipeline.
Starting in 1996, the Utah Board of Water Resources divvied up the unused CUP water, awarding tens of thousands of acre-feet to the Uintah Water Conservancy District, the Duchesne County Water Conservancy District, and other public and private water developers. Two final divisions plan to split the remainder. Roughly 86,000 acre-feet will be assigned to the 140-mile Lake Powell pipeline — a $1 billion-plus project that still awaits federal approval — and the last 72,641 acre-feet of water has been allotted to a conservation and storage project called the Green River Block.
In a statement to The Utah Investigative Journalism Project, the tribe called the approval of the Green River Block a “sham contract” that lacks “any legal authority.”
According to the tribe’s 2020 federal lawsuit, which names the Green River Block specifically but does not include the as-yet unfinalized Lake Powell pipeline transfer, Utah appears to derive its claimed authority to execute these transfers from the Central Utah Project Completion Act of 1992.
The congressionally approved compact, which required ratification of the state and Ute Tribe, has never won approval of the Utes, rendering it null and void in their eyes. The state Legislature only recently endorsed it.
The act, while promising protection for the tribe’s water rights and future financial compensation for economic losses associated with the incomplete portion of the CUP, said the Bureau of Reclamation no longer would fund the construction of pipelines and dams needed to store and access the water — a provision unacceptable to the tribe.
From the 2018 Tribal Water Study, this graphic shows the location of the 29 federally-recognized tribes in the Colorado River Basin. Map credit: USBR
State moves forward despite tribe’s objections
In 1996, even as the Utes were still trying to negotiate a deal to help pay for the needed infrastructure, the bureau determined that the pledged water had not been put to beneficial use and deeded it to the Utah Board of Water Resources. This transfer took place, the tribe told The Utah Investigative Journalism Project, “without any prior notice to, or consultation with, the Tribe.”
[…]
When Utah lawmakers in 2018 finally decided to officially ratify and put into statute the congressional compact, state leaders were aware that the tribe objected to it but chose to move forward with SB98 regardless, records show. A month before the final legislative passage, the tribe sent a letter to then-Sen. Kevin Van Tassell, the bill’s sponsor, to express its view that the terms of the compact were “unacceptable to the Ute Indian Tribe in that it was substantially amended without any input from the Tribe.” The only saving grace of the congressional action that created it, the letter said, was that Congress “made the compact contingent upon ratification by the Ute Tribal members before it became a valid document.”
“We therefore request that your bill be withdrawn until such time as the Ute Tribe and the state of Utah have come to a compromise on the water compact that can be approved by both the state of Utah and the Ute Tribe and its members,” Ute Tribal Business Committee Chairman Luke Duncan wrote to Van Tassell.
Van Tassell responded in a letter dated Feb. 27, 2018, saying he had asked the tribe for proposed amendments to the compact that would address its concerns and expressed disappointment that it had not done so. He said he intended to move ahead with his bill.
“Please know I’m happy to continue to work with you and the rest of the Ute Tribal Business Committee throughout this year to improve the statute and address your concerns,” he wrote the same day the bill cleared its first Senate vote.
A few days earlier, Christine Finlinson, assistant manager of the CUP, appeared before a Senate committee to endorse SB98. “We’re anxious,” she said, “to have this part of our history concluded.”
The bill passed the Legislature without a dissenting vote — and with no testimony from any member of the tribe…
Utes seek a seat at the table
After the Ute Tribe watched the Utah Legislature act unilaterally to try to solidify and codify the never-ratified compact of 1992, it decided to pursue another avenue for defending its rights on the Colorado River. A few months after SB98 passed and was signed by then-Gov. Gary Herbert, Chairman Duncan sent a letter to the Upper Colorado River Basin Commission seeking appointment of a tribal representative to the body.
“We have studied the law of the Colorado River and its management, and we conclude that there will never be effective management of the river unless the Commission establishes a relationship with the Ute Tribe,” Duncan wrote in the July 24, 2018, missive. “This relationship must recognize that the Tribe has a sovereign, governmental interest in its apportionment of water in the Colorado River Basin with senior, reserved water rights that are held in trust by the United States for the Tribe, as the beneficial owner of these water rights.”
The letter requested a meeting at Ute Indian tribal headquarters in Fort Duchesne. Amy Haas, executive director of the commission, subsequently forwarded the letter to other members, saying she was suggesting some alternative locales. She signed off with a sarcastic quip: “Good thing we have nothing else going on!”
Representatives from the tribe met in December of that year with commissioners in Las Vegas. In his report back to the Utah Division of Water Resources, Eric Millis, then-division director and Utah’s representative on the river commission, noted the tribe’s request for its own member but disagreed with its argument.
“The Upper Basin states — Wyoming, Colorado, New Mexico and Utah — believe that any tribe within any of the states’ boundaries are already and best served by their state representative on the Colorado River,” Millis wrote to his colleagues. “For the Ute Tribe, that is Eric Millis, Utah’s Upper Colorado River Commissioner. This has been expressed to the Tribe.”
(Gene Shawcroft, who was appointed in January by Gov. Spencer Cox to replace Millis as Utah’s Upper Colorado River commissioner, did not respond to questions regarding his position on the tribe’s request.)
Not surprisingly, the tribe had a different view:
“State representatives are not in a position to represent tribal interests, which is largely why we continue to face issues related to Indian water rights recognition, development, and water management today. … Time and time again, we are made aware of situations and decisions where the Tribe is not involved in discussions which have direct implications for our most valuable tribal trust resource — water.”
The operation of Lake Powell and Lake Mead in this June 2021 24-Month Study is pursuant to the December 2007 Record of Decision on Colorado River Interim Guidelines for Lower Basin Shortages and the Coordinated Operations of Lake Powell and Lake Mead (Interim Guidelines), and reflects the 2021 Annual Operating Plan (AOP). Pursuant to the Interim Guidelines, the August 2020 24-Month Study projections of the January 1, 2021, system storage and reservoir water surface elevations set the operational tier for the coordinated operation of Lake Powell and Lake Mead during 2021.
The August 2020 24-Month Study projected the January 1, 2021, Lake Powell elevation to be below the 2021 Equalization Elevation of 3,659 feet and above elevation 3,575 feet. Consistent with Section 6.B of the Interim Guidelines, Lake Powell is operating under the Upper Elevation Balancing Tier for water year 2021. With an 8.23 million acre-foot (maf) release from Lake Powell in water year 2021, the April 2021 24-Month Study projected the end of water year elevation at Lake Powell to be below 3,575 feet. Therefore, in accordance with Section 6.B.1 of the Interim Guidelines, Lake Powell will continue to release 8.23 maf through the remainder of the water year 2021.
Consistent with Section 2.B.5 of the Interim Guidelines, the Intentionally Created Surplus (ICS) Surplus Condition is the criterion governing the ope ration of Lake Mead for calendar year 2021. In addition, Section III.B of Exhibit 1 to the Lower Basin Drought Contingency Plan (DCP) Agreement is also governing the operation of Lake Mead in calendar year 2021.
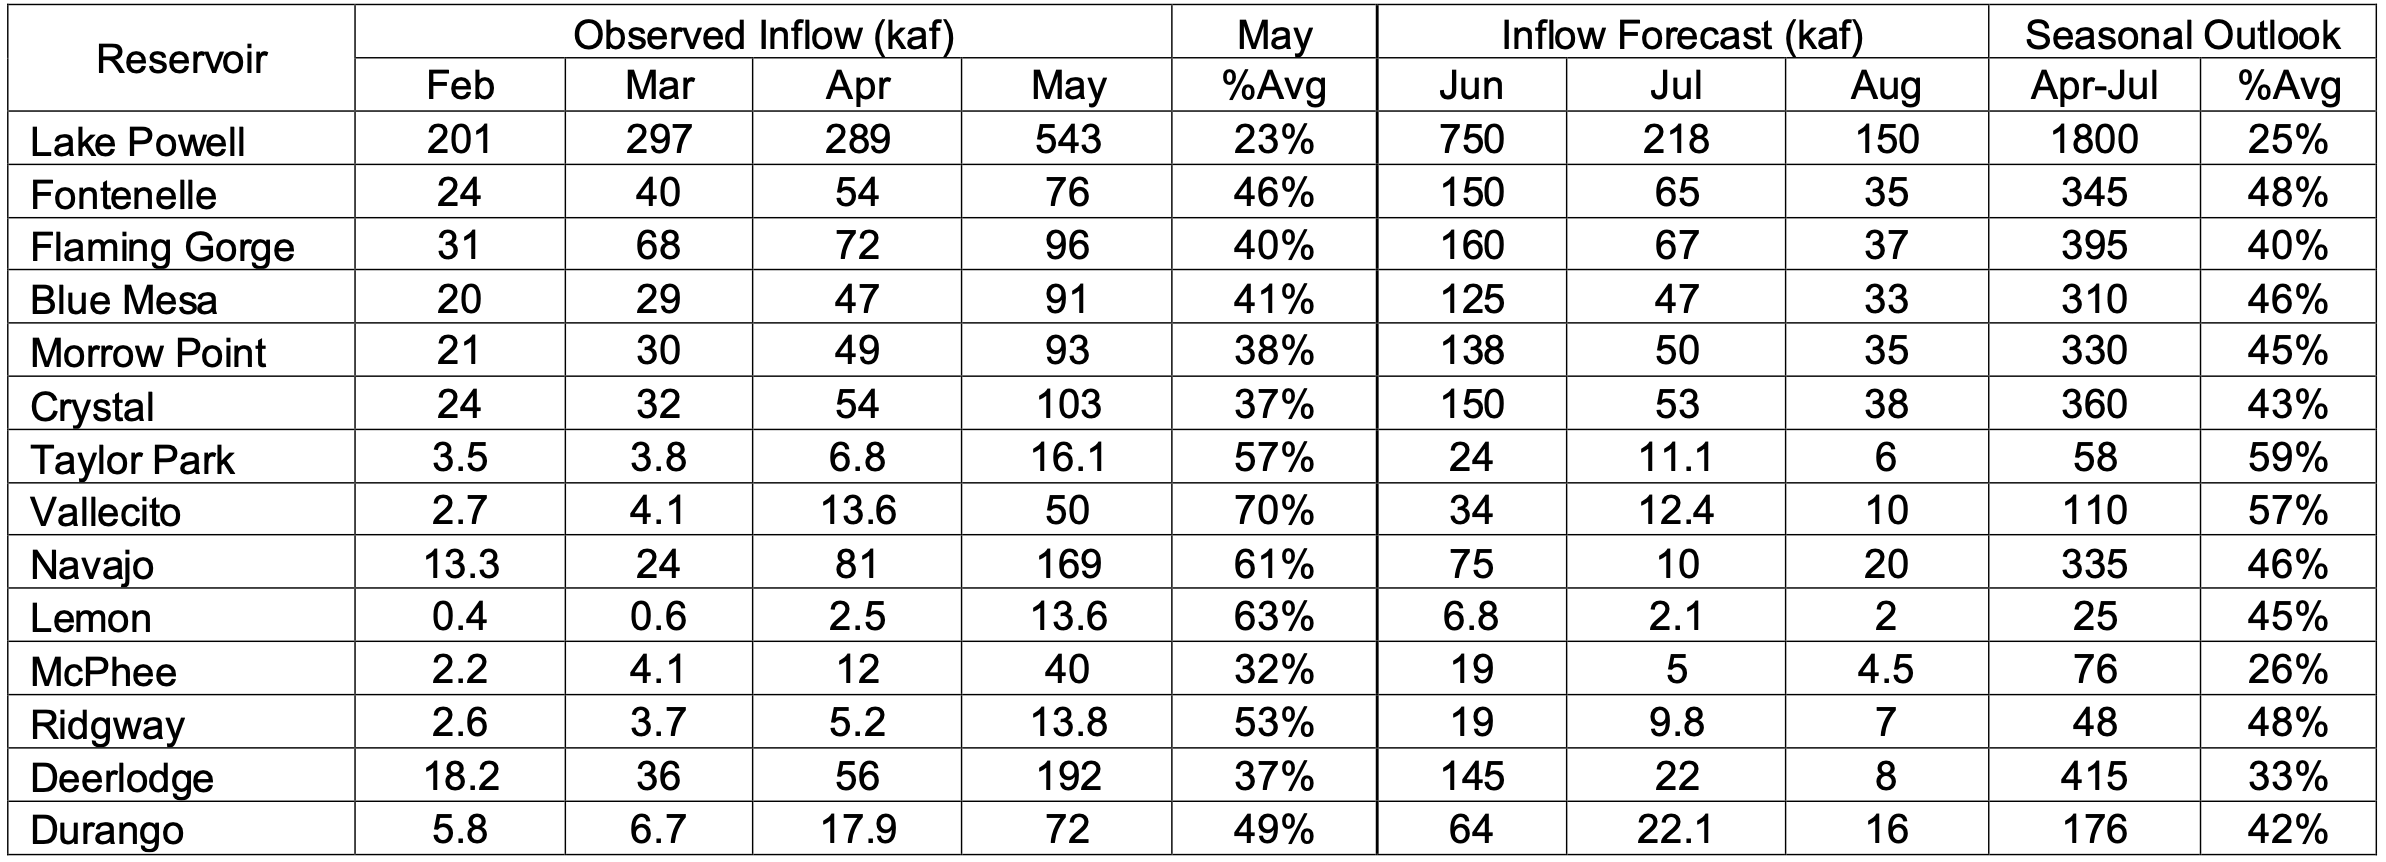
Current runoff projections into Lake Powell are provided by the National Weather Service’s Colorado Basin River Forecast Center and are as follows. The observed unregulated inflow into Lake Powell for the month of May was 0.543 maf or 23 percent of the 30-year average from 1981 to 2010. The June unregulated inflow forecast for Lake Powell is 0.750 maf or 28 percent of the 30-year average. The 2021 April through July unregulated inflow forecast is 1.800 maf or 25 percent of average. [ed. emphasis mine]
In this study, the calendar year 2021 diversion for Metropolitan Water District of Southern California (MWD) is projected to be 1.087 maf. The calendar year 2021 diversion for the Central Arizona Project (CAP) is projected to be 1.359 maf. Consumptive use for Nevada above Hoover (SNWP Use) is projected to be 0.248 maf for calendar year 2021.
Due to changing Lake Mead elevations, Hoover’s generator capacity is adjusted based on estimated effective capacity and plant availability. The estimated effective capacity is based on projected Lake Mead elevations. Unit capacity tests will be performed as the lake elevation changes. This study reflects these changes in the projections.
Hoover, Davis, and Parker Dam historical gross energy figures come from PO&M reports provided by the Lower Colorado Region’s Power Office, Bureau of Reclamation, Boulder City, Nevada. Questions regarding these historical energy numbers can be directed to Colleen Dwyer at (702) 293-8420.
Runoff and inflow projections into upper basin reservoirs are provided by the Colorado River Forecasting Service through the National Weather Service’s Colorado Basin River Forecast Center and are as follows:
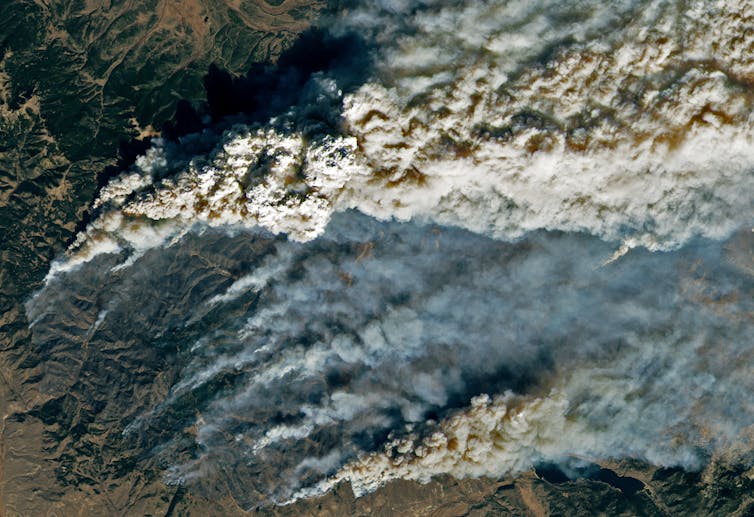
Colorado’s East Troublesome Fire jumped the Continental Divide on Oct. 22, 2020, and eventually became Colorado’s second-largest fire on record. Lauren Dauphin/NASA Earth Observatory
The exceptional drought in the U.S. West has people across the region on edge after the record-setting fires of 2020. Last year, Colorado alone saw its three largest fires in recorded state history, one burning late in October and crossing the barren Continental Divide well above the tree line.
Those fires didn’t just feel extreme. Evidence now shows the 2020 fire season pushed these ecosystems to levels of burning unprecedented for at least 2,000 years.
That evidence, which we describe in a study published June 14, 2021, serves as a sobering example of how climate change is altering the ecosystems on which lives and economies depend. A previous study nearly a decade ago warned that by the mid-21st century, climate warming could increase burning past historical levels and transform some Rocky Mountain forests. Our results show such changes in fire activity are now underway.
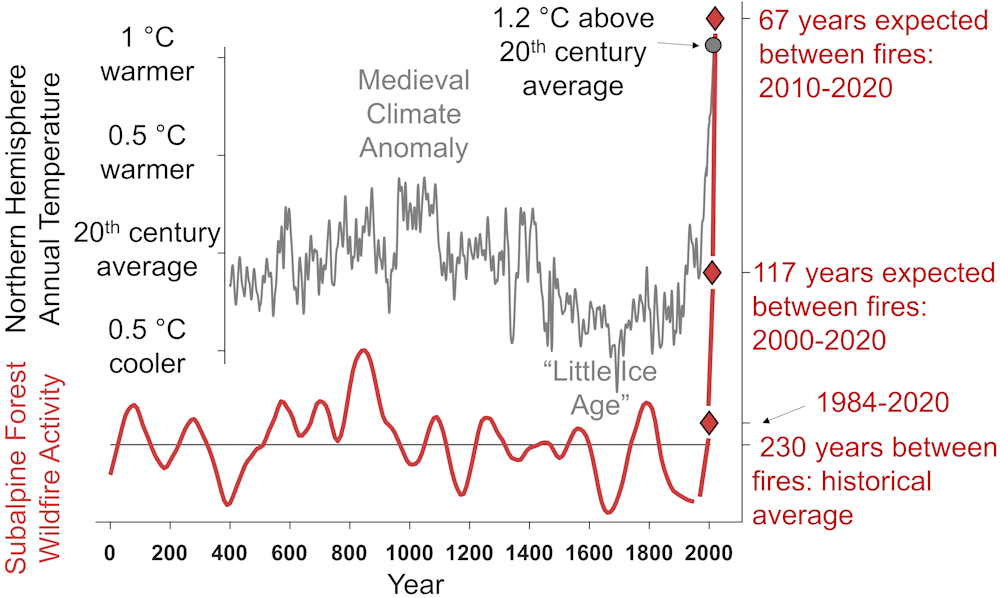
Historically, fires burned in the subalpine central Rockies every 230 years, on average. That has increased significantly in the 21st century. Philip Higuera
Entering uncharted territory
As paleoecologists – scientists who study how and why ecosystems changed in the past – we’ve spent decades researching how wildfires, climate and forests change over time.
We used to be able to look to the past when rare events like large wildfires occurred and say “we’ve seen this before and our ecosystems have generally bounced back.” In the last few years, however, it’s become increasingly clear that many ecosystems are entering uncharted territory.
Witnessing the exceptionally large fires burning in high-elevation forests in 2020, unusually late in the season, we wondered if we were experiencing something truly unprecedented.
In Colorado and Wyoming, the largest fires of 2020 were burning in a region where our researchteams have spent over 15 years developing records of fire history and ecosystem change from materials preserved in the bottom of lakes. This work has centered on understanding how climate change might one day affect wildfires. We looked to those records for an answer.
Evidence of past fires preserved in lake sediments
When a fire burns a forest, it sends tiny bits of charcoal into the air. If a lake is nearby, some of that charcoal will settle to the bottom, adding to the layers that build up each year. By plunging a long tube into the mud and extracting a core, we can examine the history of the surrounding landscape – revealed in the layers of everything that sank to the bottom over thousands of years.
Carbon dating of tree needles and twigs helps us determine the age of each layer in a core. Pollen preserved in the sediments can tell us what grew nearby. And dense charcoal layers tell us when fires burned.
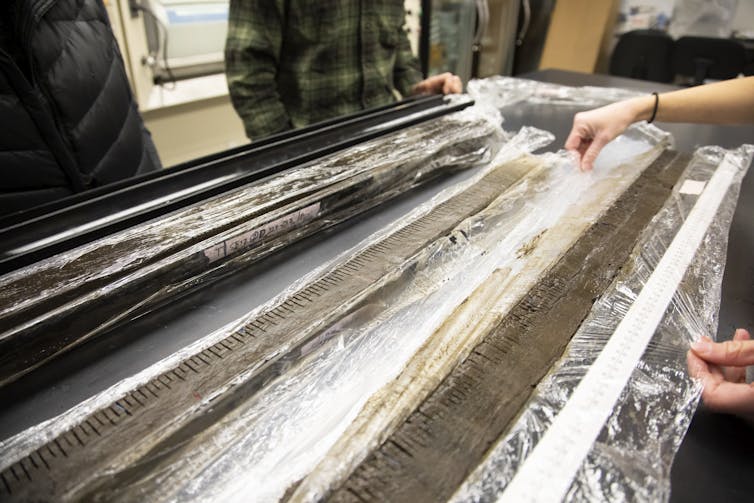
Philip Higuera (right) and his team examine a sediment core from Chickaree Lake, in Rocky Mountain National Park, used to reconstruct fire and vegetation history over thousands of years. Grace Carter
We used such records of past fires preserved in the sediments of 20 lakes in the central Rocky Mountains. In total, the dozens of researchers who helped analyze these cores counted over 100,000 tiny charcoal pieces, within the thousands of 0.5-centimeter layers of lake sediments examined. Identifying distinct increases in charcoal accumulation within the cores allows us to estimate when fires burned around a lake, and compare today’s patterns to those of the distant past.
The result: The extensive burning over the 21st century is unprecedented in this region in the past 2,000 years.
Burning nearly twice as often as in the past
We estimated that fires burned the forests around each lake once every 230 years, on average, over the past 2,000 years. Over just the 21st century, the rate of burning has nearly doubled, with a fire now expected to burn a given spot once every 117 years.
Kyra Wolf holds up a vial containing charcoal and other organic material from a half-centimeter slice of a lake sediment core. University of Montana In the lab, the sediment cores are split open and examined in detail. The color variation reflects differences in the material the fell into the lake at different times over the centuries. University of Montana
Even more surprising, fires in the 21st century are now burning 22% more often than the highest rate of burning reached in the previous 2,000 years.
That previous record was established around 1,100 years ago, during what’s known as the Medieval Climate Anomaly. The Northern Hemisphere at that time was 0.3 C (0.5 F) warmer then than the 20th century average. Subalpine forests in the central Rockies during the early Medieval Climate Anomaly burned on average once every 150 years. To put that period’s temperature into perspective, the Northern Hemisphere in 2020 was 1.28 C (2.3 F) above the 20th century average.
Adapting to a future unlike the past will be a significant challenge for land managers, policy makers and communities. Reducing the threats of increasing wildfires requires both combating climate change and learning to live in ways that help make our communities more resilient to our fire-prone future.
This map highlights the places around the globe that are experiencing water shortages. Yellow areas on the map represent places that experience water shortages during droughts, orange areas experience scarcity during certain months of the year, and red areas are chronically short of water. Water scarcity presently affects half of the world’s population and three-fourths of all irrigated agriculture. (Map and statistics from Brauman and others, 2016)
Here’s a guest column from Jim Spehar that’s running in The Grand Junction Daily Sentinel:
It’ll be hard to avoid the overwhelming desire for a tall glass of cool, refreshing water in the coming week while we’re flirting with record 100-degree plus temperatures here in the Grand Valley. In a broader sense, the daily blast of heat past the century mark will put another exclamation point on water issues along the Colorado River.
The first one came a few days ago. The water level at Lake Mead near Las Vegas hit its lowest level since filling in the 1930s. The Bureau of Reclamation expects the decline will continue until November, causing ripples upriver as agreements linking Mead and Lake Powell water levels come into play sooner than expected. Other recent alarms include massive drought-induced wildfires, resulting post-fire runoffs impacting water supplies, shorter irrigating seasons … the litany goes on and on while the Colorado River Basin is expected to post its second-driest year in more than a century of recorded history.
Before you complain about those fountains and golf courses in Sin City, consider what that desert community has done to alleviate its water use. Millions of dollars, as much as $3/square foot, is paid to residents to replace grass with xeriscaping. Building codes prohibit front lawns for new houses. A new state law will prohibit Colorado River water from being used to irrigate “non-functional turf” such as grass in office parks, at the entrances to subdivisions and in strips between sidewalks and streets.
That latest restriction, according to the Southern Nevada Water Authority, will save about 10% of the region’s Colorado River allocation, that 30,000 acre feet equal to the amount normally used by 60,000 homes. The Central Arizona Project is taking 30% less water from the Colorado River than in previous years. Further downriver, farmers in California and along the border in Arizona are being paid nearly handsomely to fallow cropland by cities clamoring for municipal water.
Here in Colorado, there are rumblings of what may become necessary steps for some communities in the not too distant future.
In Fountain, south of Colorado Springs, developers have applied for nearly 30,000 new water taps in the last year. The city currently serves 9,000 taps. According to Colorado Public Radio, Fountain is telling developers they need to support their applications with the millions of dollars necessary to obtain new water rights and storage and delivery infrastructure. Utilities Director Dan Blankenship is telling those developers “We can’t give you something we don’t have.”
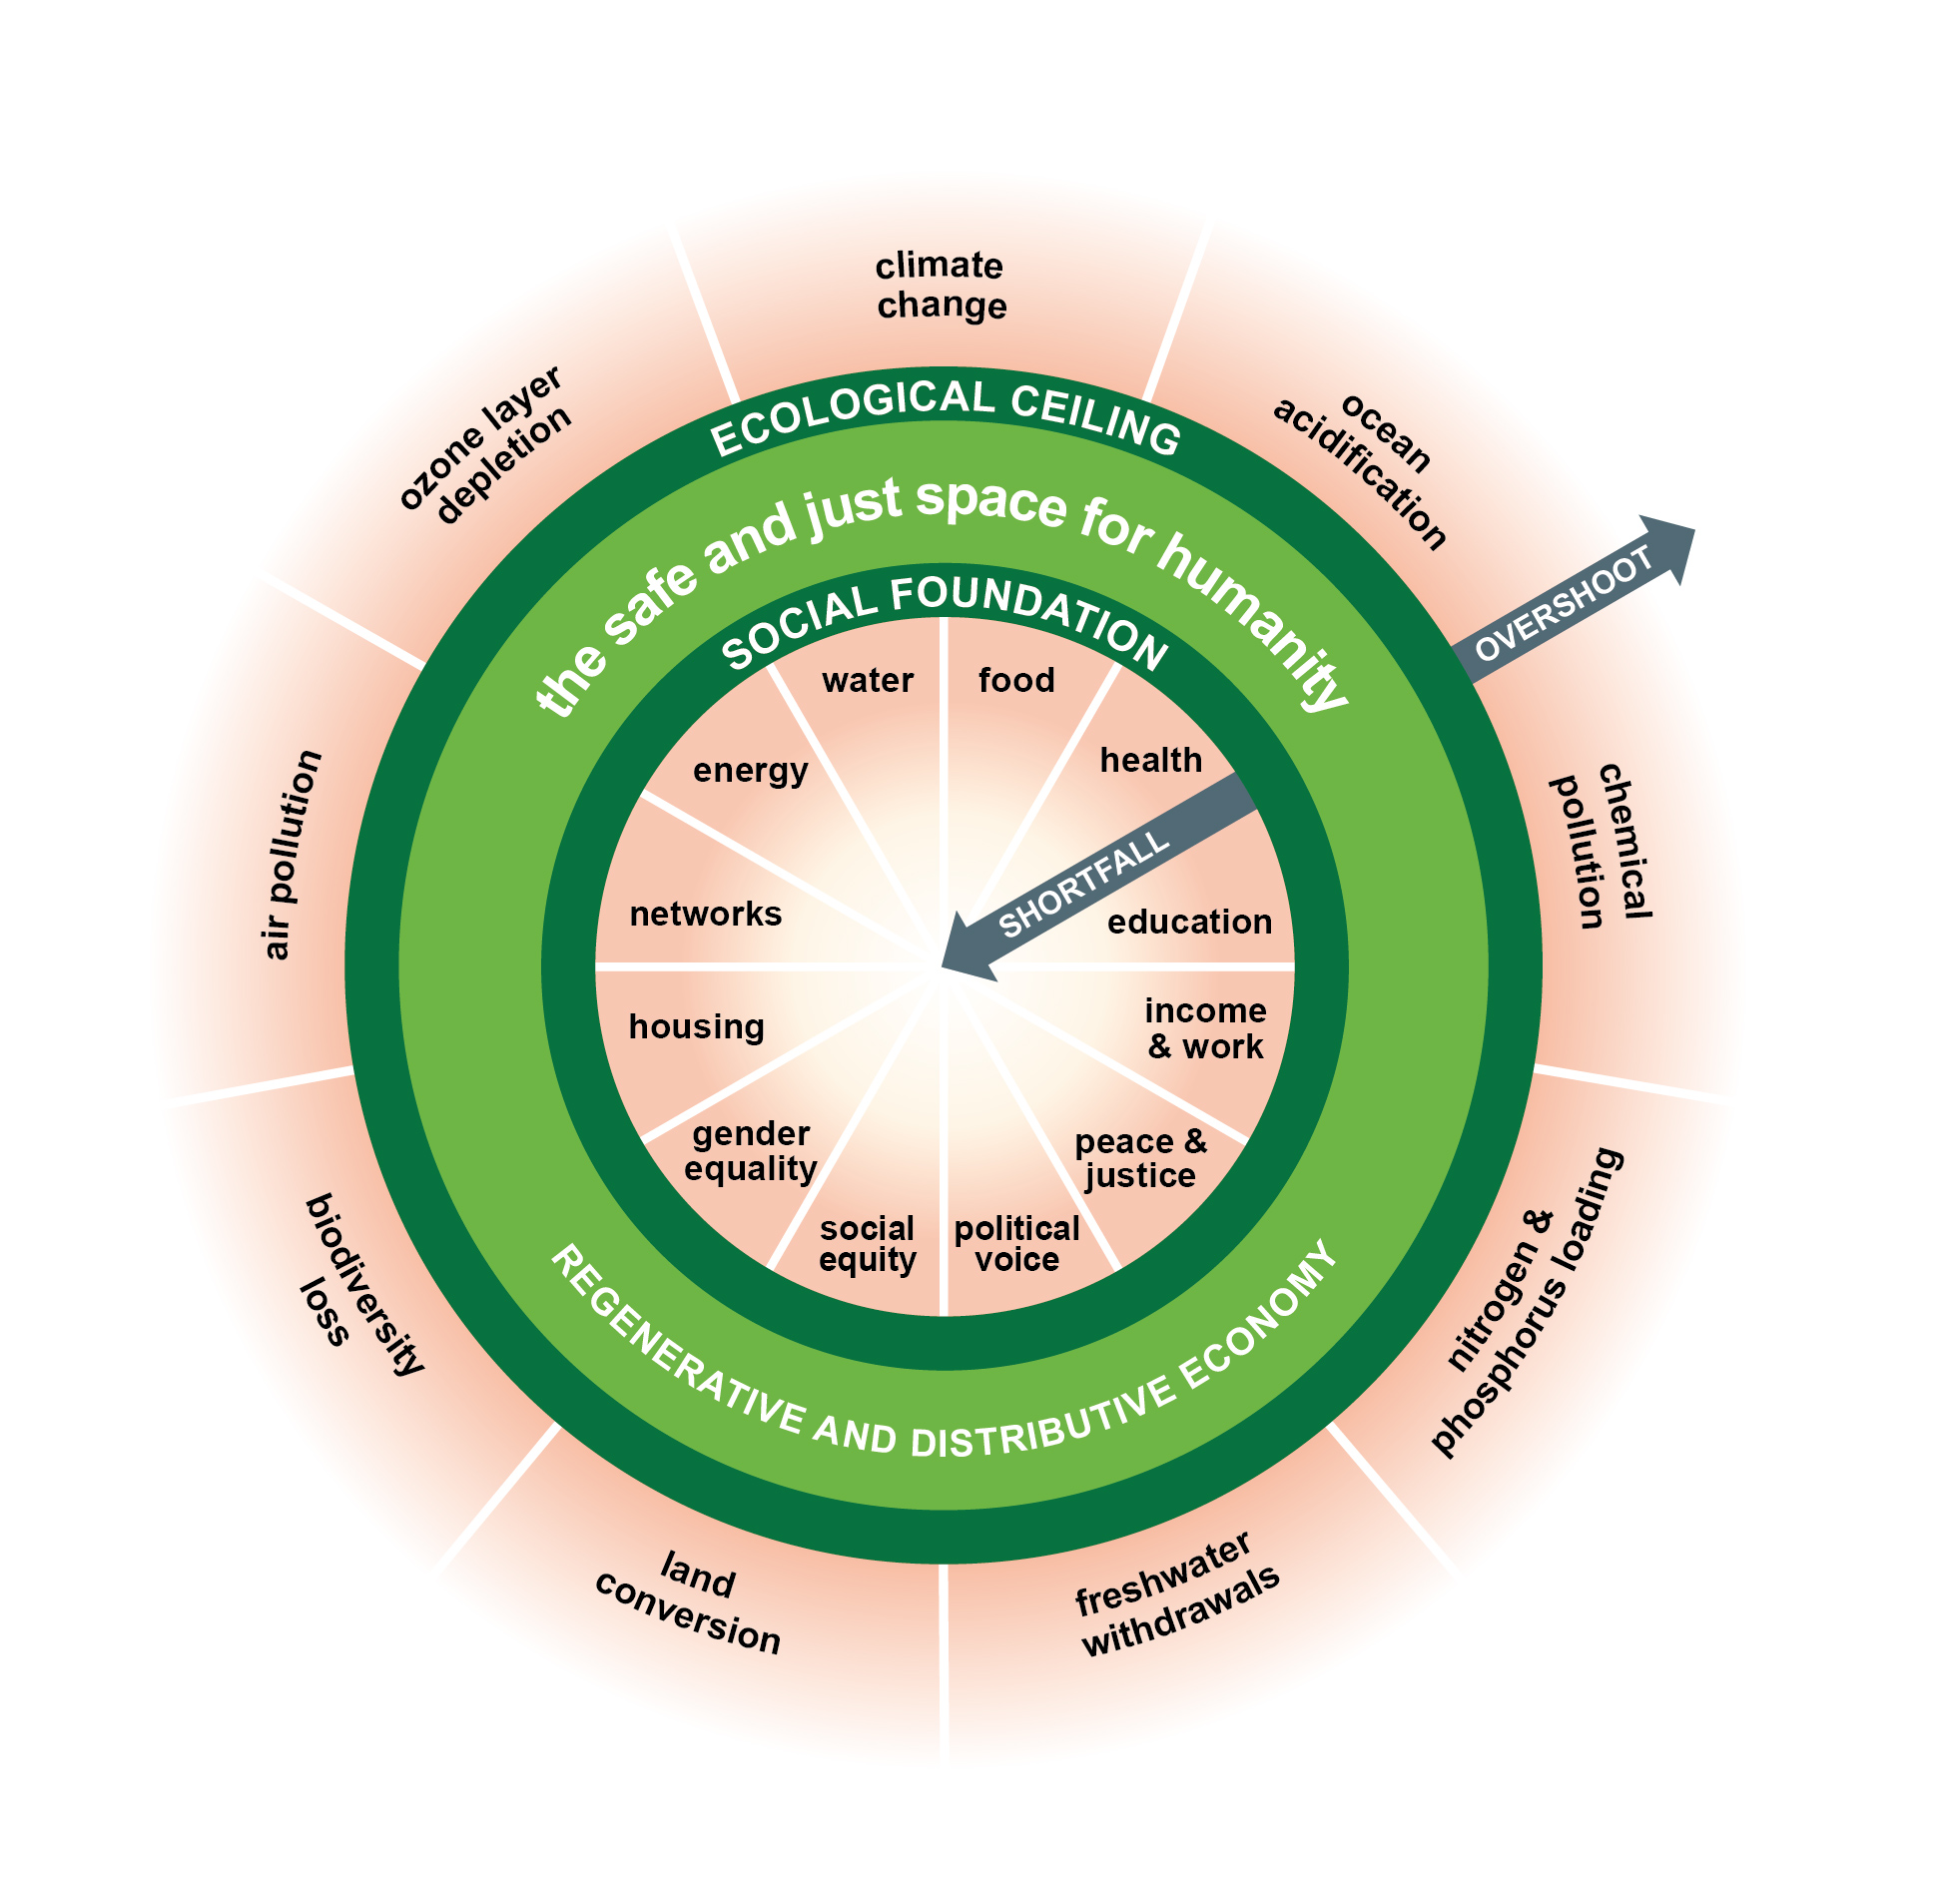
The classic image of the Doughnut; the extent to which boundaries are transgressed and social foundations are met are not visible on this diagram. Graphic via Wikipedia.com
Which spotlights the elephant (perhaps more appropriately the whale) in the room as water shortages are discussed — carrying capacity. It’s a question that’s been avoided for years but ultimately can’t be ignored. Is there a hard limit to how many of us can live, work, recreate in any one place along the Colorado River?
Of course there is. We just don’t want to acknowledge that, at least so far, though we live in an arid West where more than 40 million people in seven states and two countries depend, at least in part, on the Colorado River and its tributaries.
Twenty-five years ago, I worked for Gov. Roy Romer on his Smart Growth Initiative. One of his ideas was that developers wishing to build in the then-emerging area around Castle Rock ought to prove there was a 300-year supply of guaranteed water for their projects. That, of course, didn’t fly. Nor did a later 100-year proposed guarantee. But setting requirements like that, or such as Fountain is talking about, seems inevitable.
In 1922, Federal and State representatives met for the Colorado River Compact Commission in Santa Fe, New Mexico. Among the attendees were Arthur P. Davis, Director of Reclamation Service, and Herbert Hoover, who at the time, was the Secretary of Commerce. Photo taken November 24, 1922. USBR photo.
I’m both amused and frightened at suggestions the flawed 1922 Colorado River Compact needs to be renegotiated, hoping to keep more of “our water” in the Upper Basin. That’d take congressional action. Count the number of members from California, Arizona and Nevada and compare that total to those from Colorado, Utah, Wyoming and New Mexico. Shouldn’t reopening the Compact be the option of last resort?
“Water, water, water…. There is no shortage of water in the desert but exactly the right amount , a perfect ratio of water to rock, water to sand, insuring that wide free open, generous spacing among plants and animals, homes and towns and cities, which makes the arid West so different from any other part of the nation. There is no lack of water here unless you try to establish a city where no city should be.” — Edward Abbey, “Desert Solitaire”
Jim Spehar represented western Colorado communities for eight years on the Board of Directors of the Colorado Water Congress. Comments always welcome to speharjim@gmail.com.
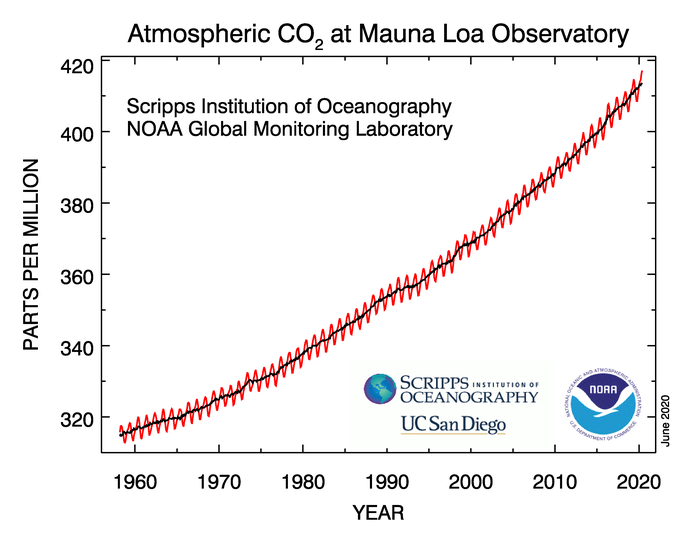
The carbon dioxide data on Mauna Loa constitute the longest record of direct measurements of carbon dioxide in the atmosphere. C. David Keeling of the Scripps Institution of Oceanography began measurements in 1958 at the NOAA weather station. NOAA started its own CO2 measurements in May of 1974, and they have run in parallel with those made by Scripps since then. Credit: NOAA and Scripps Institution of Oceanography.
Temperatures soared to 98 degrees in Denver Monday afternoon – way above the average high of 82 degrees for mid-June, but shy of the record of 102 degrees, set on June 14, 2006.
Colorado is on the eastern edge of a huge bubble of hot, dry air that covers all of the southwestern United States. This hot, dry airmass has little thunderstorm potential, just a few hit or miss storms to bring brief relief from the heat…
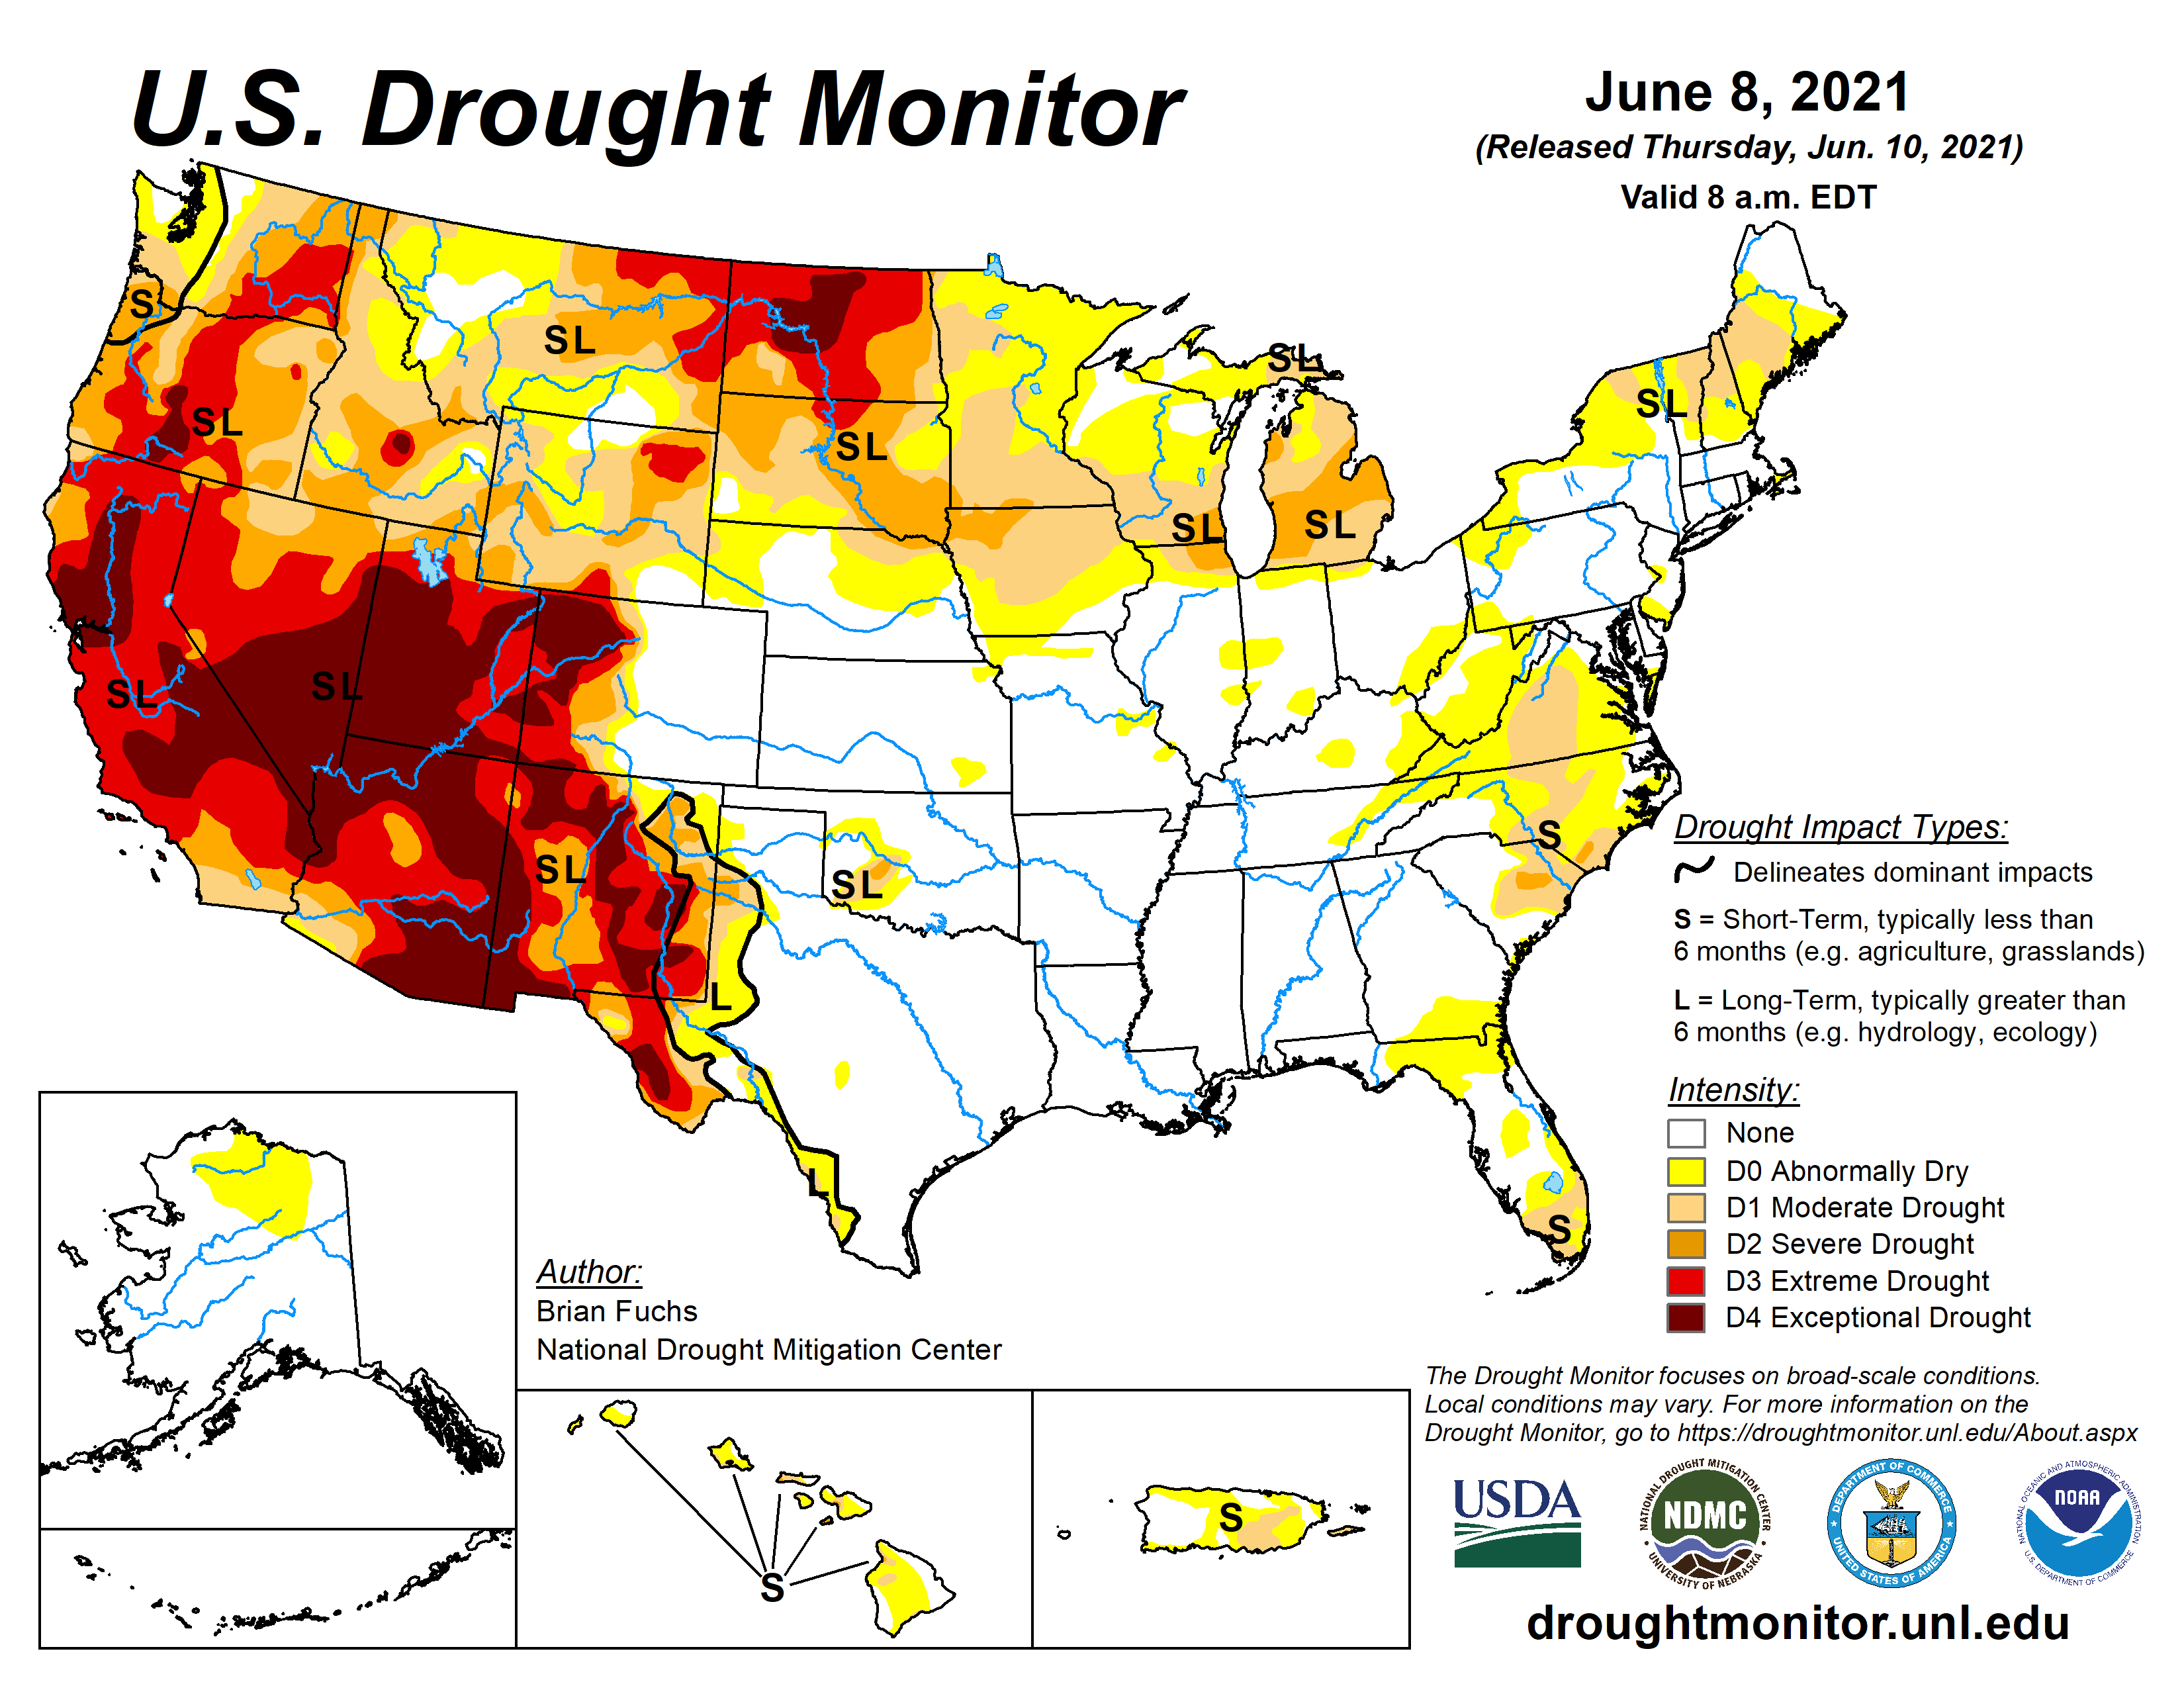
US Drought Monitor map June 8, 2021.
Western Colorado, Utah, Nevada, Arizona, New Mexico and California are all experiencing extreme drought conditions. The drought exacerbates the heat wave as the sun’s heat is simply heating up ground as opposed to evaporating water. This compounds the cycle of heat and dryness and is not likely to break for most of the summer.
The hottest weather of the year is typically in mid-July, so this is an early heatwave. With global warming we are seeing hotter weather earlier, so this type of event will become more frequent…
If we reach 100 degrees Tuesday and Wednesday, it would be the earliest ever Denver has had two straight days of triple digits.
June 2012 had 6 days of 100 degrees or hotter, with 2 days reaching 105 degrees – the all-time hottest temperature for Denver. (It has been reached several different days in June, July and August.)
Our hottest weather is typically in July, but we are seeing heatwaves coming earlier in the warm season, while our mid-summer heatwaves are tending to become longer and hotter in recent decades.
The role of climate change cannot be left out of the equation in this weather pattern. As the level of carbon dioxide (CO2) increases in our atmosphere, our world is getting warmer. The effect of increased CO2 in our atmosphere is well understood and has been known for over 150 years…
The role of carbon dioxide (CO2) in determining the temperature of our planet is established science, regardless of efforts to discount the impact of CO2.
In 1825, a French mathematician — Joseph Fourier — calculated that given the distance from the Sun, the Earth should be much colder. He theorized that it was the atmosphere that trapped enough heat to make our planet habitable.
In 1856, Eunice Foote, an American researcher, filled glass jars with different gases and set them in the sun. The jar filled with CO2 warmed the most.
In 1863, John Tyndall, an Irish physicist, did more elaborate experiments with carbon dioxide and discovered that CO2 was very effective at trapping long-wave or Earth energy.
In 1895, a Swedish researcher named Svante Arrhenius theorized that a doubling of carbon dioxide in the atmosphere would cause the Earth’s average temperature to increase by several degrees. The greatest impact would be in the far northern latitudes – which is exactly what we are seeing!
In the 1970s – CBS anchorman Walter Cronkite, who was famously known as the most trusted man in America, reported on the threat of global warming.
The basic explanation for why CO2 and other greenhouse gases warm the planet is so simple and has been known science for more than a century. Our atmosphere is transparent to visible light — the rainbow of colors from red to violet that make up natural sunlight. When the sun shines, its light passes right through the atmosphere to warm the Earth. The warm Earth then radiates some of its energy back upward in the form of infrared radiation — the “color” of light that lies just beyond red that our eyes can’t see (unless we’re wearing infrared-sensitive night-vision goggles). If all of that infrared radiation escaped back into space, the Earth would be frozen solid. However, naturally occurring greenhouse gas molecules, including not just CO2 but also methane and water vapor, intercept some of it — re-emitting the infrared radiation in all directions, including back to Earth. That keeps us warm. When we add extra greenhouse gases to the atmosphere, though, we increase the atmosphere’s heat-trapping capacity. Less heat escapes to space, more returns to Earth, and the planet warms.
Even though CO2 is a TRACE gas in our atmosphere, it is highly effective at capturing infrared (Earth) energy from escaping into space. The CO2 molecule vibrates a little when infrared energy passes by, this tiny “wiggle” serves to trap that energy in the atmosphere instead of letting it pass through into outer space…
On timescales of millions of years, CO2 is mostly a balance between volcanoes that create it and “chemical weathering” (dissolving) of rocks that destroy it. The weathering of rocks creates calcium carbonate that returns the carbon to the soil, the oceans and the Earth’s crust.
When volcanic emissions exceed rock dissolving, CO2 increases and vice versa when volcanic emissions decline.
CO2 was extremely high (maybe 5 times current levels!) 55 million years ago (more volcanoes than dissolving rocks), and it fell steadily for 50 million years straight.
The main reason that CO2 dropped was that India crashed into Asia, raising the Himalayas and Tibetan Plateau. All that fresh rock dissolved fast, sucking down CO2.
When the CO2 got low enough about 2 million years ago (about 300 ppm), we started having ice ages. We have had at least 20 since then.
During ice ages, about ⅓ of all the CO2 dissolves into the oceans, so CO2 drops to around 200 ppm. Then, when the ice melts, it shoots back up to about 300 ppm again. It’s done this 20 times in 2 million years.
During the last great global warming, CO2 rose from 180 to 280 ppm between 18,000 years ago and 8,000 years ago. That’s a rise of 0.01 ppm per century.
Now, as we dig up fossil carbon and light it on fire, the CO2 rises 3 ppm per year, 300 times as fast as it during deglaciation! It is not just the fact that the world is getting warmer, it really is the rate at which the warming is occurring. Since 1800, the CO2 has risen more than it did in 100 centuries after 16,000 BC.
With things changing so quickly, the big concern is how will we deal with the rapid change and whether many species will be able to survive, as there is not time for them to evolve…
Even though an individual severe weather event cannot be blamed on Global Warming, a warmer climate adds energy to the system — “juicing up” the atmosphere and will cause more frequent and extreme severe weather events in the future.
We can expect more intense rain events, such as the Front Range Flood in September 2013, but also more wildfires as the changing climate creates stress on our forests.
Our Colorado climate will become warmer over the next 100 years. Denver will have temperatures more like Albuquerque, New Mexico.
The result will be less snowpack, lower reservoirs and more frequent droughts. We know the population will increase and therefore the demand for water – we need to plan ahead! We have been blessed to have a few big snow years recently, the long-term prospects may not be so rosy.