FromColorado Public Radio (Michael Elizabeth Sakas):
Colorado Springs is one of the fastest growing regions in the state. Homes are getting more expensive and harder to buy. The boom is expanding into nearby cities — and the pressure is building…
There are currently fewer than 9,000 taps, or connections, to Fountain’s water supply. Over the last year, Blankenship said developers have applied for nearly 30,000 new taps to the city’s water system.
[Dan] Blankenship is telling developers, Fountain is tapped out…
To support that many new taps, the city would need to buy additional rights to use more water. They would also need a place to store that water, and the city would need to treat it and find a way to get it to homes.
Summary of Observed Wet & Dry Surface Water Hydrology via SCW
That’s getting harder to make happen in a state like Colorado, where most of the people live on the Front Range but most of the water is on the Western Slope.
Where the city of Fountain gets its water from
Fountain gets most of its water from the Pueblo Reservoir, which is filled with water that would otherwise end up in the Colorado River. The reservoir project was built in the 1970s. It’s unlikely the city would be able to build something similar today, Blankenship said. It’s a lot tougher to do that now, just because of the environmental concerns…
Smith said it’s becoming more common for developers to have to secure water rights and pay for additional water infrastructure if they want to build a big project.
But he said the situation in Fountain is unusual…
Fountain hasn’t finalized any plans yet, but they say developers are going to need to help pay the millions of dollars to buy those new water rights, reservoirs, and pipes needed to support that kind of growth. Blankenship, Fountain’s utility director, said instead of the city paying for that upfront, he wants to shift that cost to developers…
No matter how a developer might have to secure water for a new project, the cost will get rolled into the price of a new home, said Kevin Walker, with the housing and building association in Colorado Springs…
Kevin Reidy, a senior water conservation specialist with the Colorado Water Conservation Board, said other water utilities are also worried about how to keep up with growth. Fountain is just the first to talk so openly about the issue…
A big part of Reidy’s job is to get water and land planners to work together, which he said have been too siloed. Reidy helps host training events to get water and land people in the same room to talk about these issues.
“I think we’re kind of hitting that point where people are kind of saying, ‘Okay wow, we’ve got to do things differently,’” Reidy said.
For Fountain, that means telling developers this town doesn’t have the water you need. If you want to build here, you’ll have to bring your own.
Hoover Dam, straddling the border between Nevada and Arizona, holds back the waters of the Colorado River in Lake Mead. In 2016, Lake Mead declined to its lowest level since the reservoir was filled in the 1930s. Source: Bureau of Reclamation
Lake Mead on the Colorado River is now nearly two-thirds empty
Seems like every day brings another news story about the water crisis in the Western US.
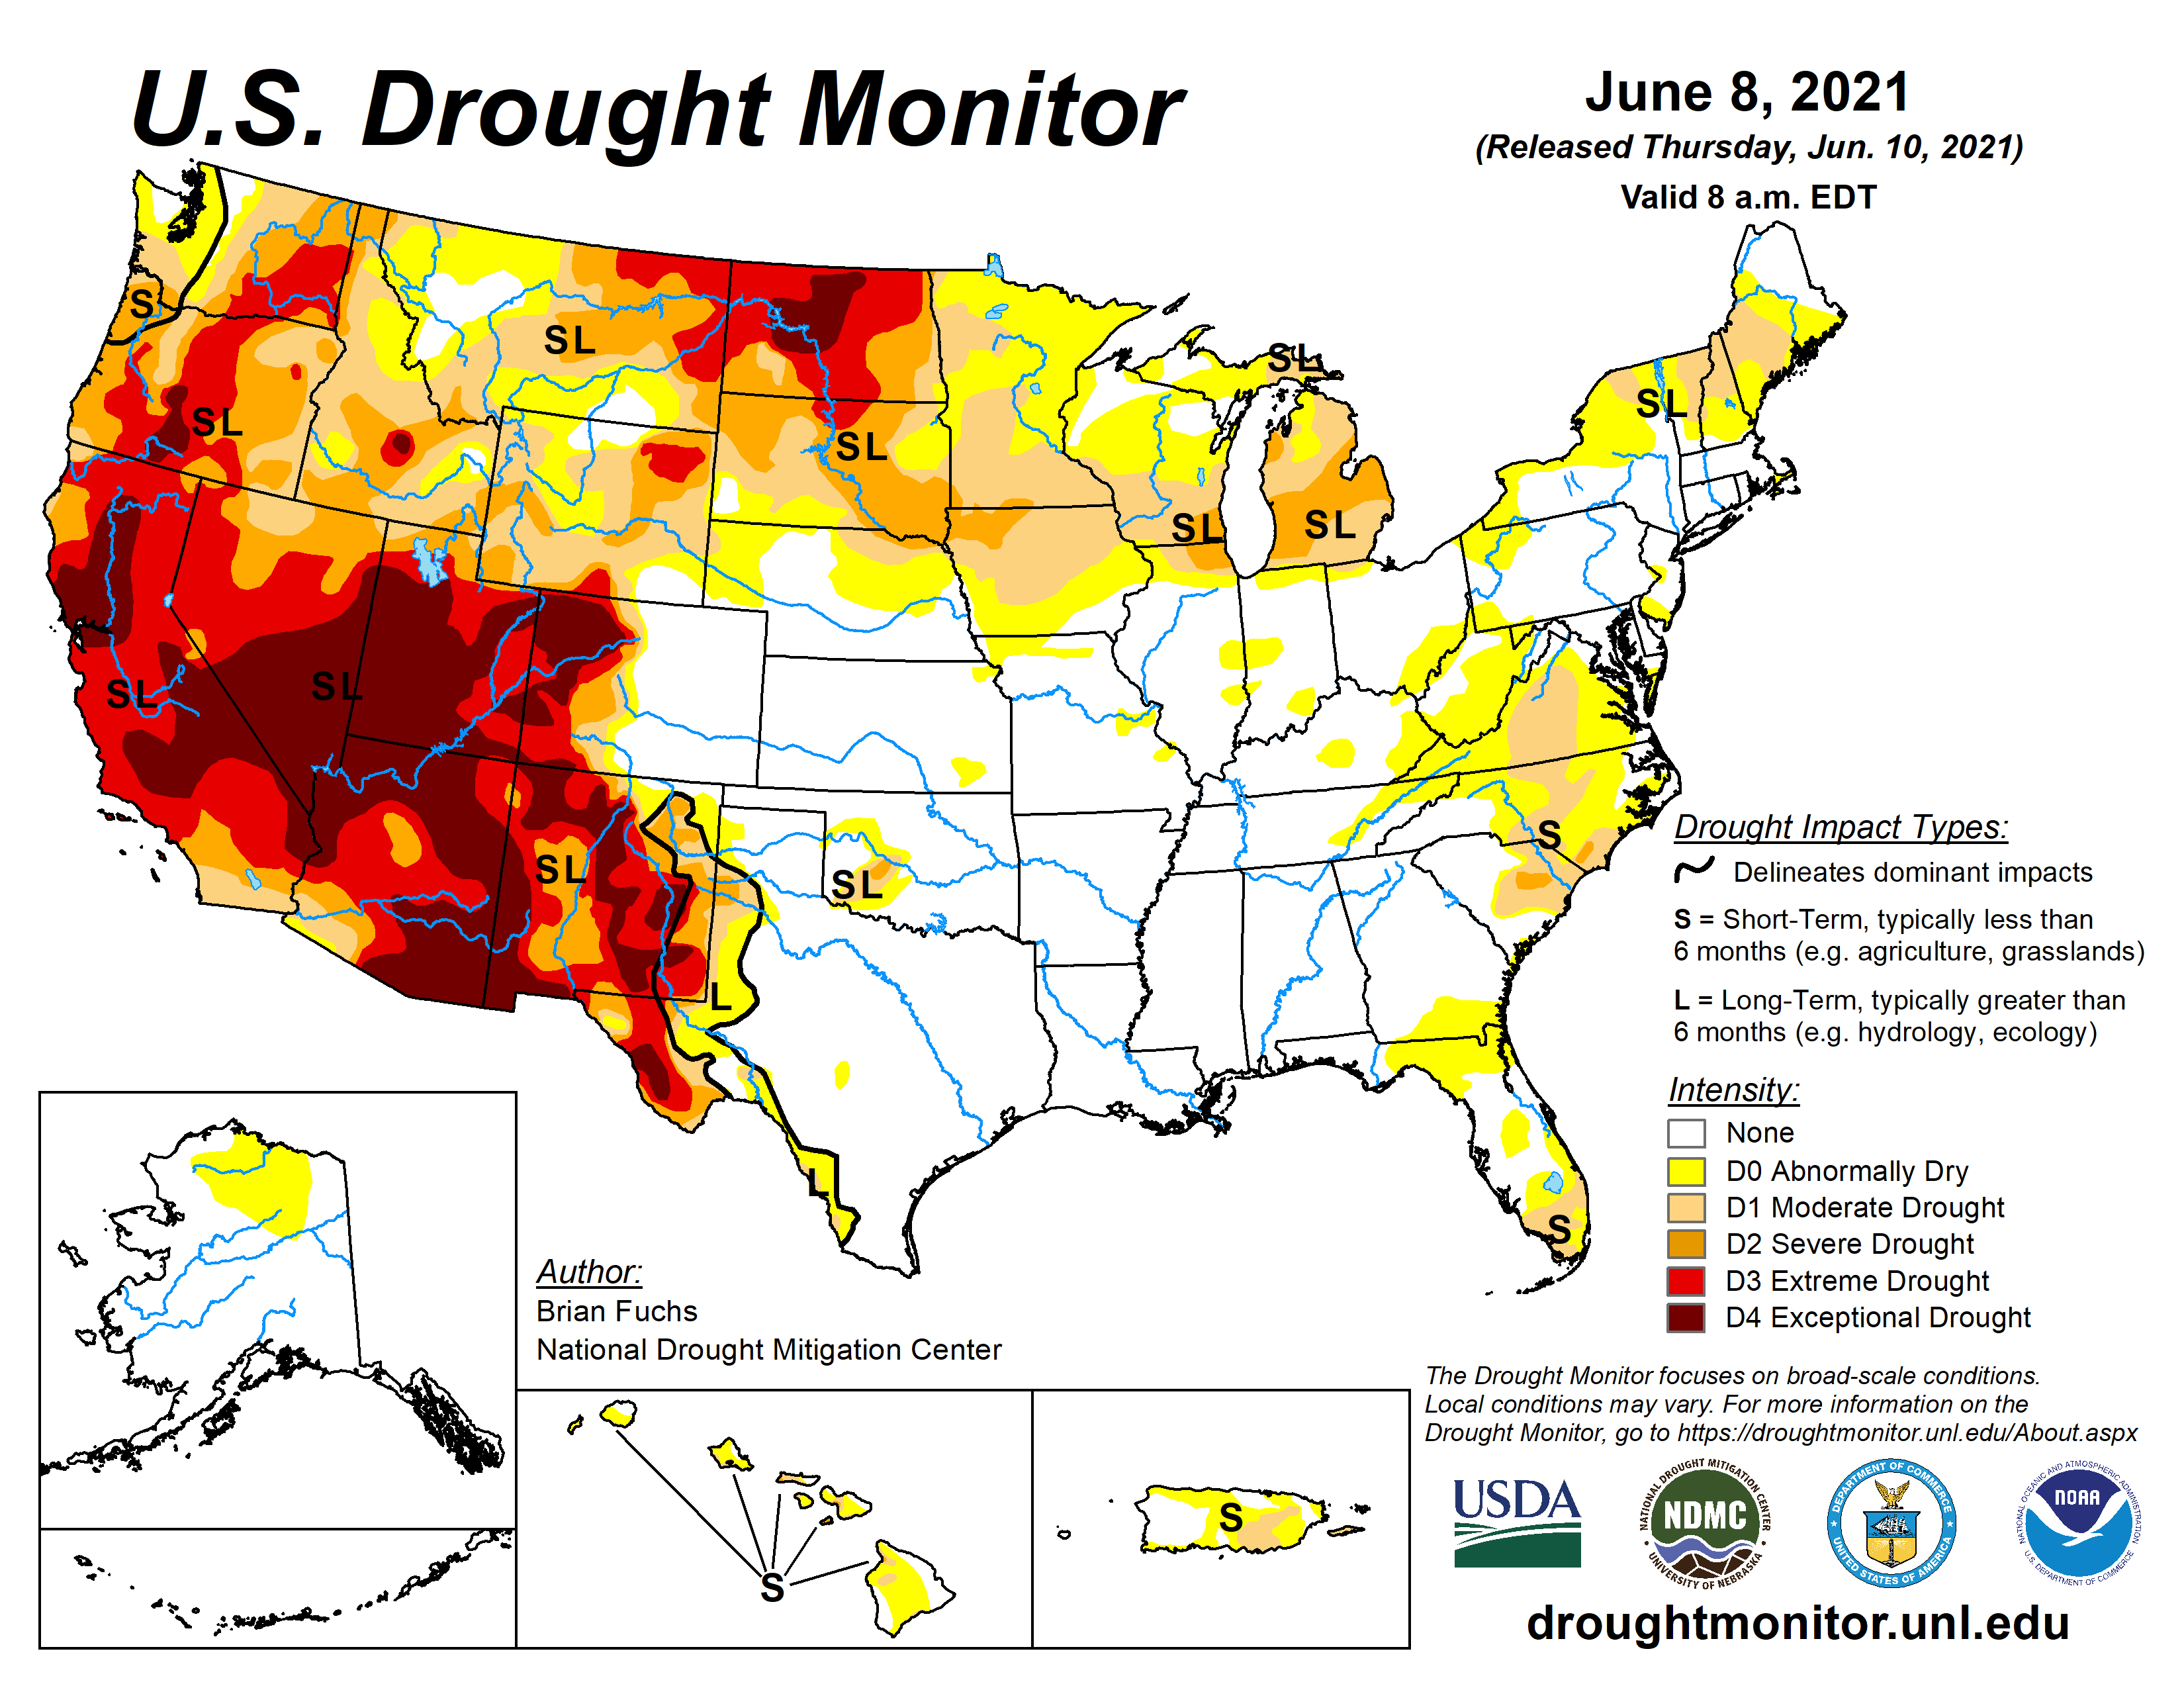
US Drought Monitor map June 8, 2021.
Never in my lifetime have I seen such an intense drought spanning such a wide geographic sweep: from West Texas to the Rio Grande to the Colorado River to the Central Valley of California to the Klamath River in Oregon.
It’s really important for this story to get a lot of media attention, because publicity can help provoke the big changes that desperately need to happen with water management in the West. But it’s also critically important that reporters get this story straight, so that their readers will understand how we got into this mess, and how we can move toward a more secure and sustainable water future.
Here’s a few key points, addressing some of the most common misconceptions about water scarcity.
#1. Droughts Don’t Cause Water Scarcity. People Do.
By definition, water scarcity is human-driven; it is a function of the volume of water consumed by humans relative to the volume of accessible, affordable water resources in a given area. As such, an arid region with very little water but no human water consumption would not be considered “water scarce,” but rather simply “arid.” Similarly, droughts do not in themselves cause scarcity; instead, scarcity and associated water shortages occur when human demands for water are greater than what is available at any given time. Simple supply and demand logic.
Your bank account is a very good analog. If you are always spending virtually all of the money you deposit, you are highly vulnerable to overdraft when (1) you aren’t depositing as much money, such as when you experience an interruption of your income; or (2) you have a need to spend more, such as to pay a hefty doctor’s bill. If you don’t have enough money in your savings account to cover your overdraft, you go bankrupt (or at least bounce a few checks).
Therefore, focusing only on the supply (deposit) side — the lessened availability of water during a drought — is only half the scarcity story. It’s very important to tell the other half, which is that our consumption (spending) has become too high relative to water availability.
From my analyses of the emergence of scarcity in many places around the globe, it’s quite obvious that a community’s vulnerability to water shortages increases greatly as human dependence on a particular water supply such as the Colorado River is allowed to grow to the limits of the natural, renewable water supply. A city or farming district might get by pretty well during normal or wet years, but when drier times eventually come, somebody doesn’t get the water they need and water-dependent ecosystems suffer.
The graph below illustrates this very well, and the map below shows the places in the world where water consumption has been approaching the limits of water supplies.
Virtually all of the water flowing in the Colorado River was being consumed during the mid-1950s drought, yet consumption was allowed to increase, largely without constraint. Consumption now exceeds annual river flows in most years; the overdraft is accommodated by pulling water out of storage reservoirs such as Lake Mead. Those reservoirs are being rapidly depleted, placing the communities and businesses dependent upon the river at great risk of water shortages. (Data source: US Bureau of Reclamation. MAF=million acre feet)This map highlights the places around the globe that are experiencing water shortages. Yellow areas on the map represent places that experience water shortages during droughts, orange areas experience scarcity during certain months of the year, and red areas are chronically short of water. Water scarcity presently affects half of the world’s population and three-fourths of all irrigated agriculture. (Map and statistics from Brauman and others, 2016)
#2. Don’t Blame This on the Cities
Tim Egan of the New York Times, when writing about the Colorado River last month, got it right: “….Vegas, and other oasis metropolises like Los Angeles, Phoenix and Tucson, are not the problem.”
He’s right for two important reasons: (1) urban water uses — including residential, commercial, and industrial uses — account for only 11% of all water consumption in the West; and (2) urban water use has been declining since the 1980s.
There are many examples of water-guzzling urban areas, particularly smaller towns and ‘exurbs’ of large metropolitan areas, but in general the big cities of the West have been doing a phenomenal job of actually lowering their water use even while their populations have grown rapidly. Our research, published last year in the international Water journal, documented that on average, Western US cities have grown by 21% while their water use has decreased by 19% during the past two decades.
Los Angeles is a terrific example of a high-performing water conservation city, as shown in the graph below.
Over the past 50 years, the City of Los Angeles has been able to reduce its total water use by 23% even while its population grew by 43%. The City was able to accomplish this largely by incentivizing its residents to reduce their per-capita water use by more than 40%. (Data and statistics from Richter and others, 2020)
#3. Water Scarcity Isn’t a New Story
Some communities in the Western US have been struggling with water scarcity — and experiencing water shortages — for more than 100 years. We developed the animation below (click to activate) to illustrate the fact that many areas around the world, including much of the Western US, have been bumping up against the limits of their natural renewable water supplies for a very long time. This animation highlights places where total water consumption nearly equaled (or exceeded) water availability in each year.
(Special thanks to Charles Wight of The Nature Conservancy for assisting with this animation.)
This animation and the scarcity hot spots highlighted here are based solely on agricultural water consumption — it does not include any additional water consumed by cities or industries. Irrigated agriculture has always accounted for the lion’s share of water consumption in the West; even today it accounts for 86% of all water consumed. Many Western rivers were being heavily diverted for irrigation by the latter half of the 19th century, when farmers needed to feed massive waves of new settlers rushing to gold fields in California, Montana, and the Black Hills of South Dakota, and federal Homestead Acts gave free land to those willing to farm it.
Yes, farming is a very water intensive industry but it would not be appropriate to blame farmers for our water scarcity either. It simply takes a lot of water to produce food for our families, our country, and people around the world.
There are certainly too many farmers that use water wastefully, but the same can be said for city-dwellers. If there’s anyone to blame here, it should be directed at those that were entrusted to manage water on our behalf.
#4. Water Scarcity is a Failure of Governance
Elinor Ostrom won the Nobel Prize in Economic Sciences in 2009 in large part for her insightful work on “Governing the Commons.” Ostrom resisted the premise that shared (‘common pool’) resources would always fall victim to the tragedy of the commons, i.e., become over-exploited. Ostrom highlighted examples of communities, such as the Philippine irrigation farmers known as zanjeras, that manage their shared resources in communal fashion, such as by allowing each farmer to take a proportional share of the available water each year.
San Pedro Acequia. The headgate of the second oldest acequia in Colorado. Photo by Devon G. Peña
When I was writing the governance chapters of my Chasing Water book in 2014, I looked very hard to find other examples of successful communal water governance. In my book I wrote about the acequia irrigation systems brought to Mexico and the American Southwest by the Spaniards. But there are preciously few other good examples, and none at the scale of a large river basin.
Instead, most state and federal governments have taken a regulatory approach to water governance, specifically the prior appropriation system managed by state governments in the Western US. Under this system, state governments hold the water in trust and issue rights to use water to individuals, companies, water utilities, electricity producers, irrigation districts, and other water users.
The fatal flaw in this approach was that states issued far more water rights than the water flowing in their rivers. California, for example, has issued five times more rights than the mean volume of river water available! And as I pointed out in the graph above of the Colorado River, state regulators continued issuing more and more water rights even after the river had been almost completely drained by the mid-1950s.
It is a treacherously difficult and politically contentious challenge to try to get the cows back in the barn after they’ve busted loose. It takes strong courage for a politician or water regulator to take back some of the water that people have become accustomed to, and are financially dependent upon.
But some hopeful signs of leadership are emerging. In 2014, California passed a Sustainable Groundwater Management Act that requires sufficient reduction in pumping to stabilize aquifer levels; SGMA could result in 20% of farmland being taken out of production unless farmers can find other ways to reduce their water use. In 2019, the ‘Lower Basin’ states of California, Nevada, and Arizona that share the Colorado River agreed to curtailments in water use by as much as 20% of their current use, as needed to stabilize Lake Mead.
#5. It’s Time to Start Talking About the Long Game for Water in the West
Taking bold political steps to set a limit, or a cap, on the volume of water that can be taken from any particular river or aquifer is a very important place to begin the journey toward a secure and sustainable water future.
However, it is a far more daunting challenge to figure out how to live within those limits.
It’s understandable why reporters are drawn toward sensational stories of pain and loss during a water crisis like the one the West is experiencing. But crisis brings extraordinary opportunities as well. Let’s not squander this opportunity to begin vigorously designing a more sustainable and secure water future. I hope that media reporters will increasingly feature stories about the ways that cities and farmers and industries are adapting to water scarcity and climate change in progressive ways, rebalancing their overdrawn water budgets. What are the innovative ideas and practices and changes that we need to implement to get us out of trouble?
Stay tuned. I intend to continue telling some of those stories myself.
ENSO-neutral conditions are present in the tropical Pacific, and NOAA forecasters think they’re likely to continue through the summer. Neutral is slightly favored through the fall, although it’s a close call between continued neutral and re-developing La Niña for the late fall and winter.
Neutral soup
I often start my top-of-the-month blog posts with a detailed review of the current conditions in the tropical Pacific, but I think I’ll just breeze through that and get to the forecast today. Currently, sea surface temperatures in the ENSO monitoring regions are still slightly cooler than average, but within the neutral range of +/- 0.5°C from the long-term (1991–2020) average.
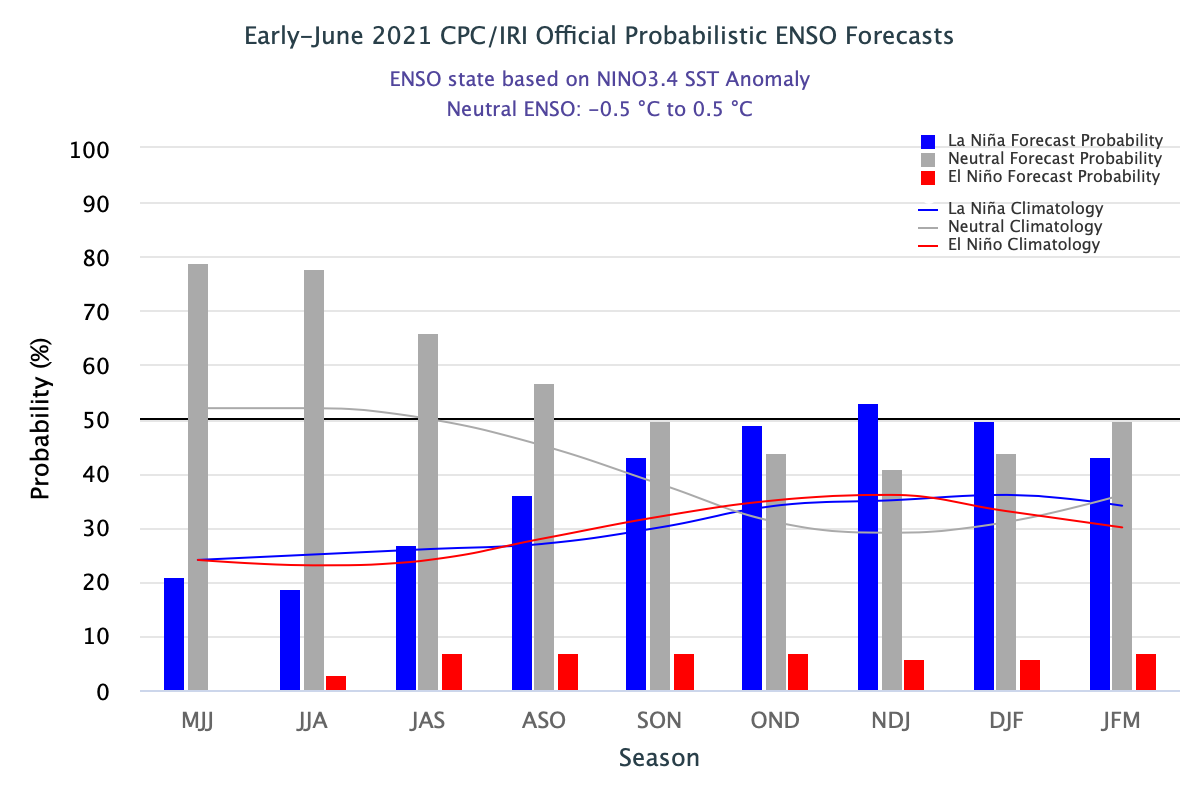
The official CPC/IRI ENSO probability forecast, based on a consensus of CPC and IRI forecasters. It is updated during the first half of the month, in association with the official CPC/IRI ENSO Diagnostic Discussion. It is based on observational and predictive information from early in the month and from the previous month. Image from IRI.
Neutral conditions are likely through the summer: there’s a 78% chance that the sea surface temperature in the Niño3.4 region of the Pacific ocean will be close to the long-term average—within the neutral range—during June–August. The sea surface temperature in the Niño3.4 region is our primary ENSO-monitoring index.
The chance of neutral drops, and La Niña chances rise, through the fall, until the probability of La Niña overtakes neutral in October–December and reaches 53% for November–January. As Nat discussed last month, La Niña has a tendency to appear in consecutive winters. Meanwhile, the official forecast summary emphasizes neutral. NOAA has an ENSO Alert System for when La Niña (or El Niño) is expected to develop… why hasn’t it been activated for La Niña? There are a few reasons! Let’s noodle on this.
A La Niña Watch is issued when “conditions are favorable for the development of El Niño or La Niña conditions within the next six months,” and we’re still more than six months from the November–January season (we count by the center month). Also, many climate models predict neutral will continue through the fall and winter, and there is no consensus among the models that the Niño3.4 sea surface temperature will remain more than 0.5°C cooler than average for more than a few months. By January–March, neutral is again the most likely category. This is important, because ENSO is a seasonal system, requiring sustained conditions to impact global weather and climate.
In summary, there just isn’t enough evidence yet to tip the scales definitively between neutral and La Niña for this coming winter. One thing we can say with confidence is that chances for El Niño next fall/winter are low—less than 10%.
Tuna neutral casserole
We care about ENSO prediction because it can provide an early picture of potential climate conditions months in advance. (Also because it’s a super-interesting geophysical phenomenon, but that might just be us geeks!) One important aspect of ENSO is its influence on hurricane activity.
NOAA’s recent Atlantic hurricane outlook predicts an active season, with a 60% chance of above-average activity. The low chance of El Niño (which tends to suppress hurricane activity in the Atlantic) was an important component in this outlook. Other factors, such as predicted warmer-than-average tropical Atlantic sea surface temperatures, bolster the outlook. On the other hand, the Central and Eastern Pacific are expected to have normal or below-normal tropical storm seasons. El Niño tends to enhance storm activity in those regions.
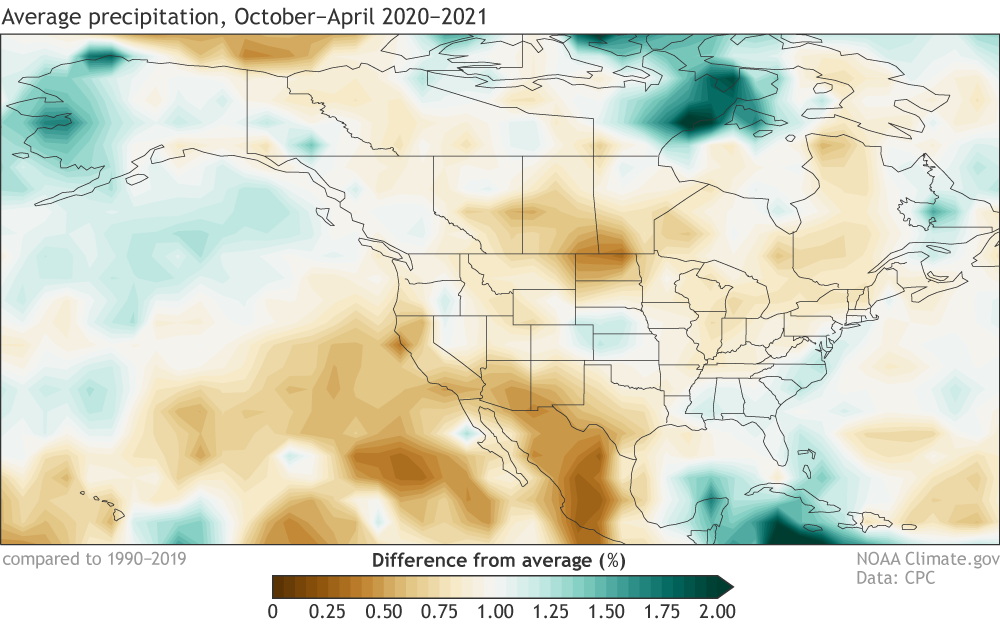
Another reason to care about long-range ENSO prediction is its relationship to rainfall in the southwestern US. La Niña is linked to reduced late-fall/winter/early-spring rain and snow in this region, while El Niño tends to enhance rain in the southwest. During La Niña 2020–21, much of the Southwest US and Mexico was indeed below average.
Percent of average precipitation (rain, snow, and other frozen precipitation) during October–April 2020–21. Average period is 1990–2019. Data from GPCP via ESRL PSL; image by climate.gov.
A huge portion of the western US is now in extreme drought, and the seasonal drought outlook predicts drought conditions to continue through the summer. Mexico is also experiencing widespread and intense drought. Second-year La Niña has been linked to more pronounced drought, another concern if La Niña does re-develop.
La Niña is also usually related to increased winter rain and snow in the Pacific Northwest, which did not materialize this past year. Since apparently I’m just linking to all of Nat’s posts today, here’s the one about the unexpected conditions we saw during the 2020–21 La Niña.
Buttered neutrals
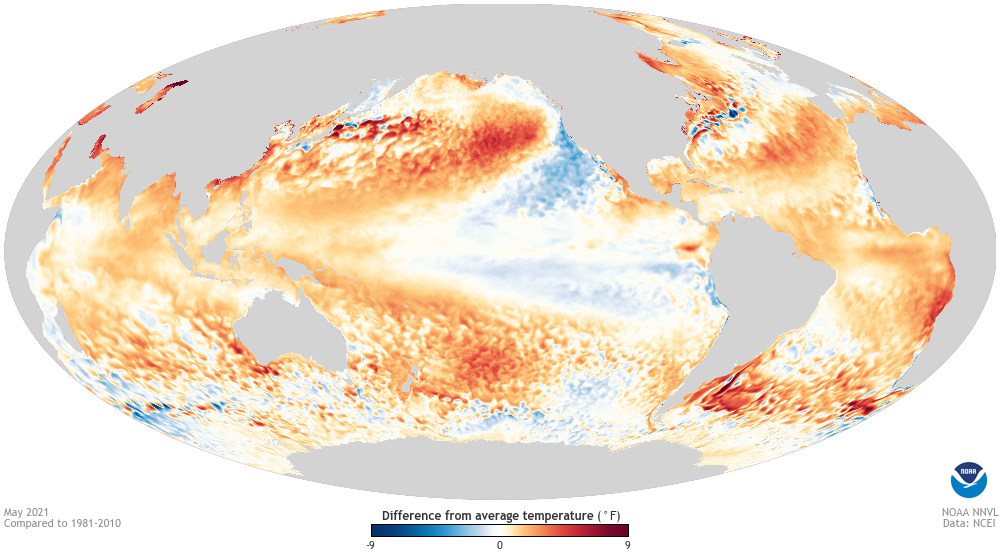
Finally, let’s take a look at the global sea surface temperature pattern from May, where we can see that much of the North Atlantic is already warmer than average.
May 2021 sea surface temperature departure from the 1981-2010 average (note that this image still uses the previous averaging period). Image from Data Snapshots on Climate.gov.
Although La Niña conditions have ended, there are still regions of cooler-than-average surface waters to in the eastern Pacific and southwest of the US. What I’d really like to point out here, though, is the re-emergent blob in the north Pacific. According to NOAA’s Blobtracker (official name: California Current Marine Heatwave Tracker) this marine heatwave formed in late April and has tripled in area since then. It formed in the same spot as a powerful marine heatwave that dominated much of 2020 and was the 2nd-largest on record (their record starts in 1982). Yet another ocean feature that bears watching.
Pool neutrals
Next month, Tom will be updating you on all things ENSO! His puns are much better than mine, so you have that to anticipate.
Citizen groups Save the Poudre and No Pipe Dream are suing to stop the city of Fort Collins from processing an application for Northern Integrated Supply Project infrastructure in city limits.
The two groups filed a lawsuit Wednesday against the city and the Northern Integrated Supply Project Water Activity Enterprise over Northern Water’s SPAR (site plan advisory review) application for the controversial Poudre River reservoir project. The complaint argues that SPAR is the wrong way for the city to review NISP infrastructure and seeks to terminate the SPAR application. It also seeks to cancel the Fort Collins Planning and Zoning Board review of the application set for June 30…
At the heart of the dispute is whether NISP, which seeks to divert flows from the Poudre and South Platte rivers for two new reservoirs, is an appropriate fit for the SPAR process. SPAR is a type of development review intended for “improvements to parcels owned or operated by public entities,” according to the city’s land use code.
SPAR, compared to the more commonly used development review process, puts the city’s P&Z board in an advisory position rather than giving Fort Collins City Council the final say on a proposal. The governing board of a SPAR applicant can override P&Z’s vote and proceed with the development over the city’s wishes.
The P&Z board must review a SPAR application within 60 days of the city accepting it. The city deemed Northern Water’s SPAR application complete on May 21.
The city directed Northern Water to submit a SPAR application for components of NISP within city limits: the Poudre intake diversion structure, a river diversion that would be located in Homestead Natural Area northwest of Mulberry Street and Lemay Avenue, and a 3.4-mile length of pipeline running from the river diversion to the southeast, passing through Fort Collins and unincorporated Larimer County land as well as three city natural areas (Williams, Kingfisher Point and Riverbend Ponds)…
The complaint also argues that Northern Water doesn’t meet the state’s legal guidelines for an entity that can overrule a municipal body’s decision on a development. The state gives that authority only to “the city council of a city … the board of trustees of a town, or any other body, by whatever name known, given authority to adopt ordinances for a specific municipality,” the complaint states…
City attorney Carrie Daggett said the city is still reviewing the complaint and declined further comment. Northern Water spokesman Jeff Stahla affirmed that the water district will continue to pursue SPAR review for NISP as city staff directed…
Fort Collins’ review of NISP is not the last step for the project. The project is awaiting a crucial record of decision from the Army Corps of Engineers that’s expected to come this year. An affirming record of decision would likely trigger another legal appeal.
Two additional lawsuits filed by Save the Poudre, No Pipe Dream and Save Rural NoCo related to Larimer County’s approval of NISP infrastructure are also working their way through the courts.
Carson Lake, a popular spot on Grand Mesa, has been drained in anticipation of maintenance work that will start this month.
The Carson Lake dam, which is part of the city of Grand Junction’s water supply system, was reclassified as a High Hazard Dam in 2015 because of developments occurring in the lower Kannah Creek basin and a dam safety evaluation was completed.
There have not been capacity restrictions placed on the dam or any critical safety issues identified, but maintenance projects are being implemented.
The current timeline has work beginning June 28 and being completed about Oct. 31.
The project includes the construction of new inlet and outlet structures, the lining of existing outlet pipe, spillway renovation, installation of an impact basin in the spillway channel and the installation of remote monitoring system.
The US Forest Service is encouraging trail users to access trails in the Kannah Creek basin at either the Deep Creek Trail Head or the Carson Lake Trail Head, which is on the rim south of Carson Lake, on the way to Flowing Park Reservoir.
Members of the Colorado River Commission, in Santa Fe in 1922, after signing the Colorado River Compact. From left, W. S. Norviel (Arizona), Delph E. Carpenter (Colorado), Herbert Hoover (Secretary of Commerce and Chairman of Commission), R. E. Caldwell (Utah), Clarence C. Stetson (Executive Secretary of Commission), Stephen B. Davis, Jr. (New Mexico), Frank C. Emerson (Wyoming), W. F. McClure (California), and James G. Scrugham (Nevada) CREDIT: COLORADO STATE UNIVERSITY WATER RESOURCES ARCHIVE via Aspen Journalism
Lake Mead has declined to its lowest level since the reservoir was filled in the 1930s following the construction of Hoover Dam, marking a new milestone for the water-starved Colorado River in a downward spiral that shows no sign of letting up…
The lake’s rapid decline has been outpacing projections from just a few months ago. Its surface reached a new low Wednesday night when it dipped past the elevation of 1,071.6 feet, a record set in 2016. But unlike that year, when inflows helped push the lake levels back up, the watershed is now so parched and depleted that Mead is projected to continue dropping next year and into 2023.
Lake Mead, the largest reservoir in the country, now stands at just 36% of full capacity.
In the past month, Mead has already fallen below the official threshold of a shortage, which the federal government is expected to declare in August. That will trigger major cuts in water allotments for Arizona, Nevada and Mexico next year. And even bigger water reductions could be forced upon the Southwest if the reservoir continues to drop, which government estimates show is likely…
The reservoir’s continuing decline, [Felicia] Marcus said, should ring “alarm bells” across the West that the days of business-as-usual approaches are over and that “we need to accelerate everything we can to use less water.”
That includes speeding up efforts that cities and water agencies are already undertaking in parts of the Southwest, such as investing in recycling wastewater, capturing stormwater or cleaning up polluted groundwater, Marcus said. And it also includes promoting conservation and more efficient water use in a variety of ways, she said, from investing in water-saving technologies on farms to offering homeowners cash rebates to removing grass and replacing it with drought-tolerant landscaping.
With shortage measures set to take effect next year, Arizona is in line for the biggest water cutbacks.
That will shrink the amount flowing through the Central Arizona Project Canal to farmlands in Pinal County that produce alfalfa, cotton, wheat and other crops. Farmers in Pinal plan to pump more groundwater from newly drilled wells, but they’ll still be short with the loss of Colorado River water and are planning to leave some farmlands dry and unplanted over the next couple of years.
In a first-level shortage, the water supplies of Arizona’s cities will be spared from cutbacks. But that could change over the next two years if Lake Mead continues to decline.
In the Las Vegas area, people are already conserving enough each year that their water supplier will be able to contribute its portion of the reductions from its unused allocation. But that hasn’t stopped Nevada’s leaders from pushing for more water-savings by getting rid of grass on medians and outside businesses and subdivisions, as required under a newly enacted law that bans “non-functional turf” in the Las Vegas area…
The watershed has been ravaged by one of the driest 22-year periods in centuries. Scientists describe the past two decades as a megadrought worsened by climate change, and say the Colorado River Basin is undergoing “aridification” that will complicate water management for generations to come.
In 2000, Lake Mead was nearly full and its surface was lapping at the spillway gates of the Hoover Dam. Since then, the reservoir has fallen nearly 143 feet. And it’s now at the lowest levels since 1937.
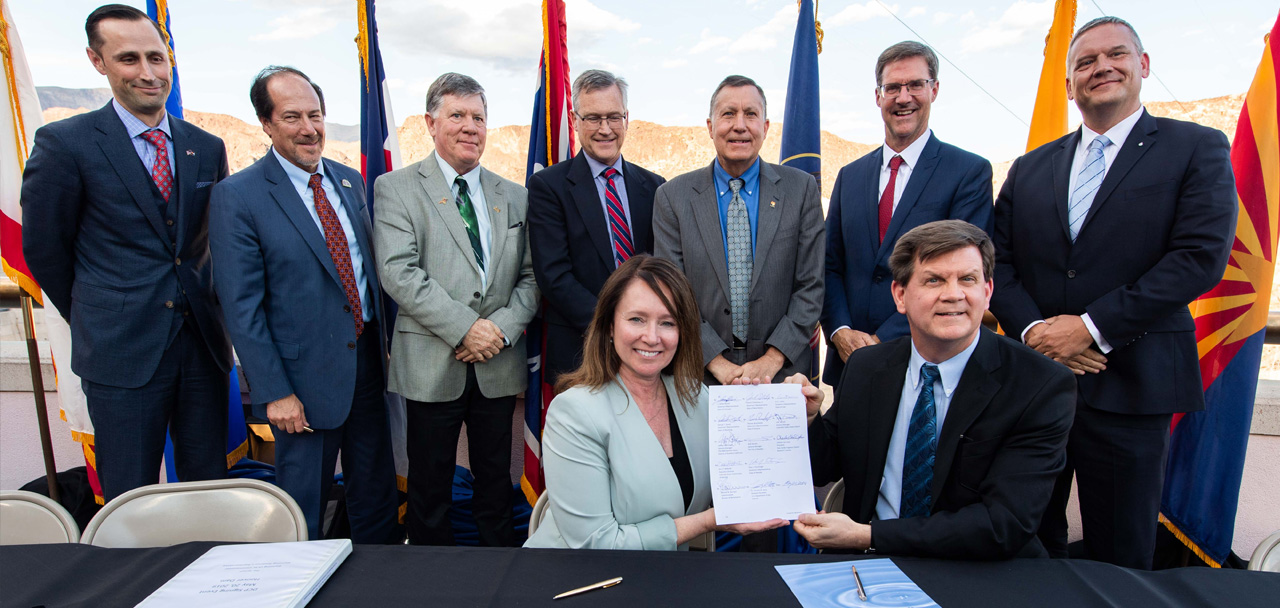
Signing ceremony for the Colorado River upper and lower basin Drought Contingency Plans. Back Row Left to Right: James Eklund (CO), John D’Antonio (NM), Pat Tyrell (WY), Eric Melis (UT), Tom Buschatzke (AZ), Peter Nelson (CA), John Entsminger (NV), Front Row: Brenda Burman (US), and from DOI – Assistant Secretary of Water and Science Tim Petty. Photo credit: Colorado River Water Users Association
Two years ago, representatives of the seven states that depend on the Colorado River met at Hoover Dam to sign a set of agreements called the Drought Contingency Plan, which laid out measures to take less water and share in reductions during a shortage to reduce the risks of Lake Mead falling to critically low levels.
But the declines have continued and the drought has intensified over the past year, with much of the watershed baking through the driest 12 months in 126 years of records. The river and its tributaries have dwindled, shrinking the flow into Lake Powell at the Utah-Arizona border, and in turn driving the receding water levels at Lake Mead…
Arizona’s plan for managing the shortages involves deliveries of “mitigation” water to help temporarily lessen the blow for some farmers and other entities, as well as payments for those that contribute water. The state and CAP approved more than $100 million for these payments, with much of the funds going to the Colorado River Indian Tribes and the Gila River Indian Community for water they contributed…
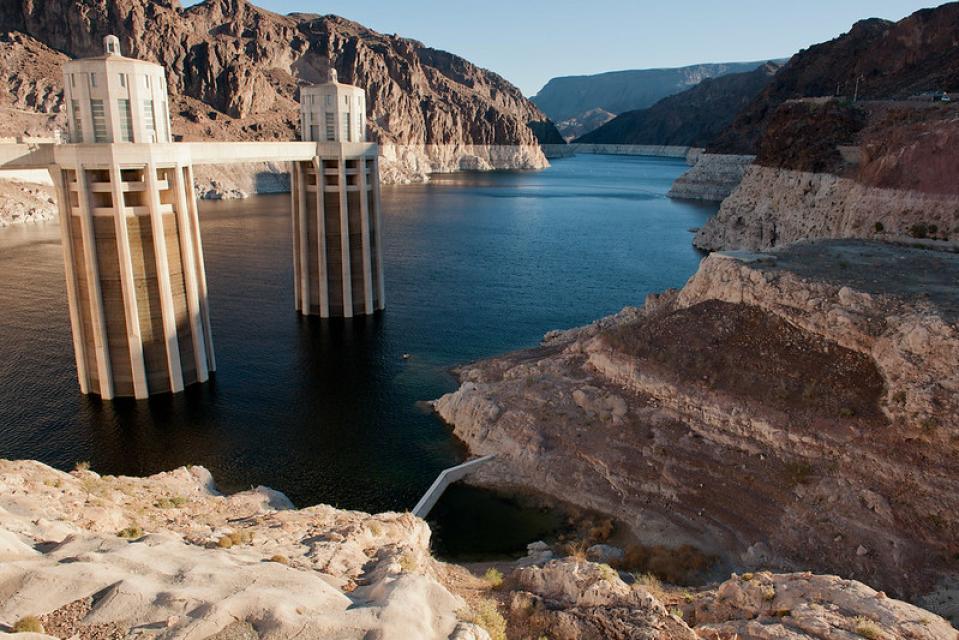
At full pool, Lake Mead is the largest reservoir in the United States by volume, but two decades of drought have dramatically dropped the water level behind Hoover Dam as can be seen in this photo. (Source: U.S. Bureau of Reclamation)
Over the past year, the declines in water levels have accelerated, outpacing previous estimates due to extremely parched conditions across the watershed in the Rocky Mountains, where much of the river’s flow originates as melting snow. Hotter temperatures have made the whole watershed “thirstier,” as climate researchers put it, eroding the flow of the river as vegetation draws more water and as more moisture evaporates off the landscape…
In just 12 months, the [Lake Mead’s] level has dropped nearly 20 vertical feet…
Officials from Arizona, Nevada, California and Mexico have been talking about other ways they might work together on long-term projects to shore up water supplies. One idea they’re studying would be for Arizona to work with Mexico to build a desalination plant on the shore of the Sea of Cortez and trade some of the drinking water that’s produced for a portion of Mexico’s Colorado River water.
Officials from Las Vegas’ Southern Nevada Water Authority have offered to invest in a water recycling project in Southern California, which would enable the agency to use some of the Metropolitan Water District’s Colorado River water in exchange. Arizona water officials are also considering joining the other agencies and taking part in the project.
When representatives of the seven states signed the Drought Contingency Plan on a terrace overlooking Hoover Dam in 2019, some of them described the deal as a “bridge” solution to temporarily lessen the risks of a damaging crash and buy time through 2026, by which time new rules for sharing shortages would be negotiated and adopted.
The agreement establishes a series of progressively larger water cutbacks if Lake Mead continues to drop below lower trigger points in the coming years.
If the reservoir drops about 26 more feet to below elevation 1,045 feet, California would start to take cuts.
And if the water level falls below 1,025 feet, which is a scenario the deal aims to avoid, the largest reductions would take effect for all three states and Mexico.
Increasingly, some researchers are voicing concerns that even the major cuts contemplated in the deal might not be enough. Some have suggested that with extremely dry conditions persisting in the watershed, the region’s water managers might need to take bigger steps before 2026 to prevent Mead’s levels from continuing to plummet.
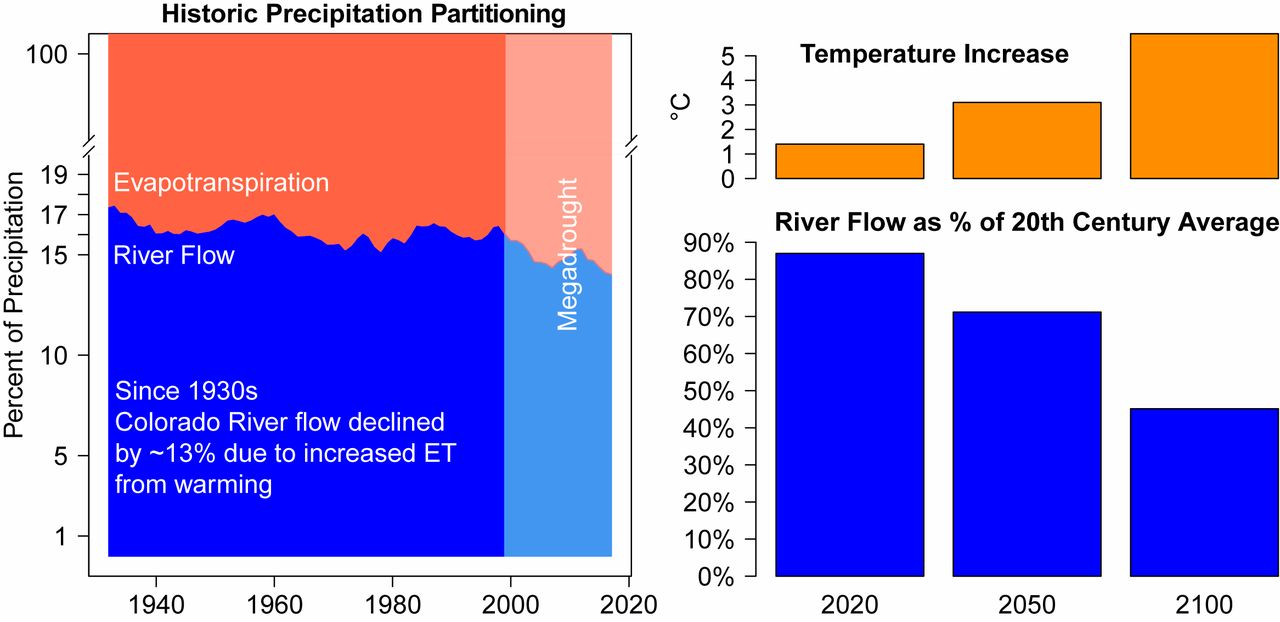
Climate change is causing the Southwest to aridify. (Left) Since the 1930s, increasing temperatures have caused the percentage of precipitation going to evapotranspiration (ET) to increase at the expense of precipitation going to Colorado River flow, resulting in an unprecedented and still ongoing megadrought (shading) starting in 1999 (8). (Right) Higher temperatures have already reduced Colorado River flow by 13%, and projected additional warming, assuming continued high emissions of greenhouse gases, will increase ET while reducing river flow even more through the 21st century. Data on Left are 20-y running means from ref. 5, and data on Right are calculated from Representative Concentration Pathways (RCP) 8.5 multimodel Coupled Model Intercomparison Project–Phase 5 (CMIP5) ensemble temperature increases projected for the Upper Colorado River Basin combined with temperature sensitivity of −9.3%/°C estimated by ref. 5, assuming no change in precipitation.
“We really have seen this coming all along on some level,” said Brad Udall, a water and climate scientist at Colorado State University. “And we in some ways aren’t ready for it, despite all the things we’ve done to make us feel good that we were ready for it.”
Udall said the network of people who work on Colorado River issues have made great strides in collaborating on adaptation strategies, including through the 2019 deal. But he said he’s not convinced that adequate measures are in place to quickly scale up the more aggressive steps if the contemplated cuts turn out to be insufficient — other than the possibility that Interior Secretary Deb Haaland could convene the states’ representatives and determine what steps to take, which is also included as a sort of backstop measure in the deal.
“This thing could spiral out of control pretty quickly,” Udall said, if more years of severe drought desiccate the region as they did in the early 2000s.
He said he also worries about the fact that some of the water in Lake Mead is reserved for specific water users based on prior conservation, which has been encouraged under the deal and previous agreements.
Concerns about that banked water also have been voiced by others, including Margaret Garcia, an assistant professor at Arizona State University who focuses on water infrastructure and management. She said this system of banking water, technically called “intentionally created surplus,” poses concerns because it means some water in Mead is already spoken for beyond established allocations, and this stored water can still be withdrawn unless the reservoir hits critical lows.
As Garcia put it, “a savings account full with IOUs is not the same as a full savings account.” And Lake Mead’s account is far from full.
The heart of the issue, Udall said, may be developing new ways of quickly adapting to a river that’s yielding less water as the West grows hotter and drier.
“We may need to take this next big step, which is how do you permanently reduce demands?” Udall said.
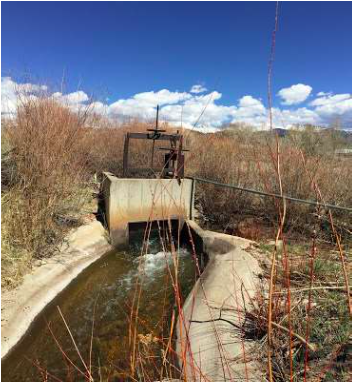
The Government Highline Canal flows past Highline State Park. Photo credit: Bethany Blitz/Aspen Journalism
Here’s the release from the Bureau of Reclamation (Rob Manning):
The Bureau of Reclamation selected three Canal Safety Challenge finalists to test their proposed prototypes that reduce accidents and drownings around canals. The Greenfields Irrigation District, Isotope LLC, and WGM Group, Inc will each receive $50,000 for testing at the Reclamation Technical Service Center’s Hydraulics Laboratory in Denver, Colorado.
The Canal Safety Challenge is a public competition focused on developing solutions to improve public safety and reduce drownings in canals throughout the United States and make egress from canals easier or allow for safer rescue and recovery efforts.
The three finalist’s proposals are:
The Greenfields Irrigation District’s proposed solution includes a unique ramp that would use the force of the water to help the individual get to safety. (Fairfield, Montana)
Isotrope LLC’s proposed solution includes a partially submerged deck that will allow people to walk, crawl or be rescued from the current. (Medfield, Massachusetts)
WGM Group Inc.’s proposed solution includes a unique scoop designed to capture floating objects at a pipe entrance and allow a person to get out or be rescued. (Missoula, Montana)
“Reclamation maintains more than 8,000 miles of canals throughout the West, and more than 10% of those are in urban areas.” Chief Engineer David Raff said. “These innovative proposals have the potential to increase public safety in and around canals throughout the Western United States.”
In addition to the three finalists, Reclamation recognizes two submissions with an honorable mention for their novel solutions, Northern Water in Berthoud, Colorado, and Peltonen & Sardi of Bellevue, Washington.
Reclamation is partnering with the Denver Water, Klamath Irrigation District, Pacific Gas & Electric, NASA Tournament Lab and Carrot. To learn more about this prize competition, please visit https://www.usbr.gov/research/challenges/canalsafety.html.
Update Status: NIDIS and its partners release these updates every 4 weeks December through June. This update will be the last for the 2021 Water Year as snowpack and snowmelt are past peak values. Updates will resume in the 2022 Water Year.
Snow drought impacts have intensified as snow melted weeks early this spring.
Key Points
Remaining higher-elevation western snowpack is well below normal with the exception of Washington, parts of Montana, and the South Platte Basin that drains the Front Range of Colorado.
The 2020–2021 snow drought was initially caused primarily by a lack of precipitation and storminess, and intensified after April 1. A huge, and in some cases record breaking, decline in snow water equivalent percent of normal was observed throughout April due to warm and dry conditions.
Much of the western snow melted one to four weeks early, including three to four weeks early in the Sierra.
Low snowpack, rapid melt out, and poor runoff efficiency have led to significant water supply concerns going into summer of 2021. Click here to learn more about the impacts of snow drought.
Water Year 2021 Conditions Across the West
Current SWE: Western U.S. Via the NRCS. This USDA Natural Resources Conservation Service (NRCS) map shows Snow Telemetry (SNOTEL) snow water equivalent (SWE) basin values over the western U.S. as a percent of the NRCS 1981–2010 median. Only stations with at least 20 years of data are included in the station averages. The SWE percent of normal represents the current SWE found at selected SNOTEL sites in or near the basin compared to the average value for those sites on this day. This map is valid as of June 8, 2021. Source(s): USDA NRCS Last Updated – 06/08/21 Water Year 2021 Snow Drought Conditions Summary
Higher-elevation snowpack that remains throughout the West is well below normal with the exception of Washington, parts of Montana, and the South Platte Basin that drains the Front Range of Colorado. In the Sierra Nevada, snowpack is just about gone at SNOTEL elevations. For example, Mount Rose Ski Area, Nevada, on the northeast side of Lake Tahoe in the Carson Range, melted out on May 14, and the median melt out date was June 10. Melt out three to four weeks early was common throughout the Sierra. Throughout Utah, the Upper Colorado, and northern Rockies states of Idaho, Wyoming, and Montana, many sites melted out one to three weeks early.
Alaska mountain snowpack was generally typical for early June in the Chugach and Kenai mountains of south-central Alaska. A cool and wet spring has maintained higher-elevation snowpack in much of southeast Alaska except the far south, where precipitation and temperatures have been closer to normal.
Snow drought conditions developed early in the winter throughout California, the Great Basin, parts of Oregon, the Lower Colorado, and the Upper Colorado, with the most severe conditions initially in the Lower Colorado. Lack of precipitation and storminess was the initial driver of this snow drought, although temperatures throughout the West were above normal much of the winter and spring, particularly during the long dry spells. Strong storms in January brought some improvement to California, the Great Basin, and the Lower Colorado, but most basins still remained about 60%–80% of normal snow water equivalent (SWE) at the end of January. A series of atmospheric rivers in February brought a brief recovery from snow drought through heavy precipitation and snowfall to the mountains of the Pacific Northwest and Oregon into the northern Rockies. March was a very dry month except for parts of Utah, eastern Colorado, and Wyoming.
April 1 is a critical date for Western snowpack as it is often near peak SWE and, more importantly, is used as input for spring and summer water supply forecasts. Much of the West had below-normal SWE on April 1, although the severity of the snow drought was not nearly as bad as the benchmark 2015 snow drought when huge areas of the West were below 50% of normal SWE by April 1. Large river basin (HUC2) April 1 SWE percent of normal was at 75% for California, 77% for the Great Basin, 58% for the Lower Colorado, 87% for the Upper Colorado, 93% for the Rio Grande, 110% for the Pacific Northwest, and 90% for the Missouri. A huge, and in some cases record breaking, decline in SWE percent of normal was observed throughout April, and snow drought conditions intensified rapidly in just one month. By May 1, all of the HUC2 basins except for the Pacific Northwest and Missouri were between 15% and 61% of normal SWE. Temperatures soared to well above normal the first week of April, and dry conditions persisted throughout the whole month, leading to rapid snow melt rates. The dry and warm conditions allowed rapid melt to occur even in higher elevation basins like the Upper Colorado that typically have peak SWE several weeks after April 1.
The 2021 snow drought in the West highlights the need to track these events from the beginning of the snow accumulation season throughout the melt season. If April 1 or peak SWE was used as the snow drought indicator this year, the severity and downstream impacts that occurred throughout April would be lost. Low snowpack, rapid melt out, and poor runoff efficiency have led to significant water supply concerns going into the summer of 2021. The two biggest reservoirs in the U.S., Lake Powell and Lake Mead, are nearing historic lows, and a Colorado River water shortage is looming; many reservoirs throughout California are as low or lower for early June than during any of the 2012–2015 drought years. Click here to learn more about the impacts of snow drought on water management, ecosystems, recreation and tourism, and more.
April 2021 Precipitation: Western U.S.
This USDA NRCS map shows Snow Telemetry (SNOTEL) April precipitation basin values over the western U.S. as a percent of the NRCS 1981–2010 median. Only stations with at least 20 years of data are included in the station averages. The precipitation percent of normal represents the current precipitation found at selected SNOTEL sites in or near the basin compared to the average value for those sites on this day. This map is valid as of April 30, 2021.
HUC2 River Basin Snow Water Equivalent
Large river basin (HUC2) snow water equivalent (SWE) percent of normal throughout the West for peak SWE, April 1, and May 1. SWE data are from the USDA NRCS SNOTEL network.
Maximum Temperature Departure from Average: April 1–8, 2021
Early April heatwave in the West depicted by April 1–8 maximum temperature anomalies. Temperature data are from gridMET, and the map was created using Climate Engine. For an interactive version of this map, please visit Climate Engine.
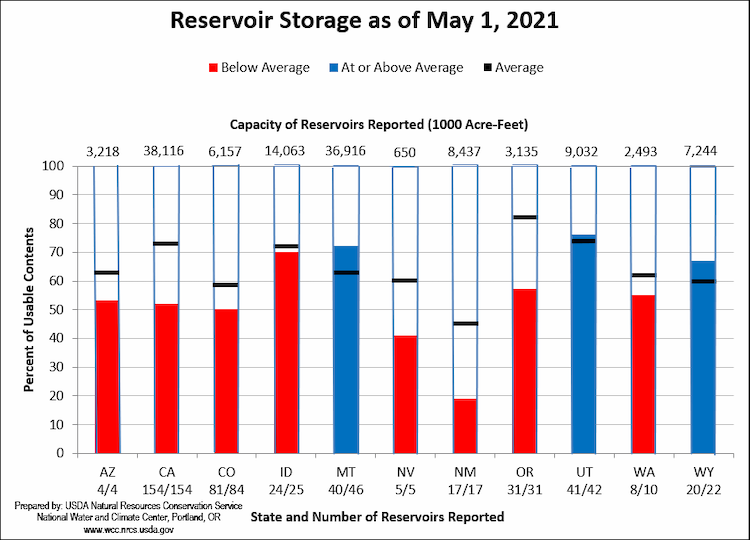
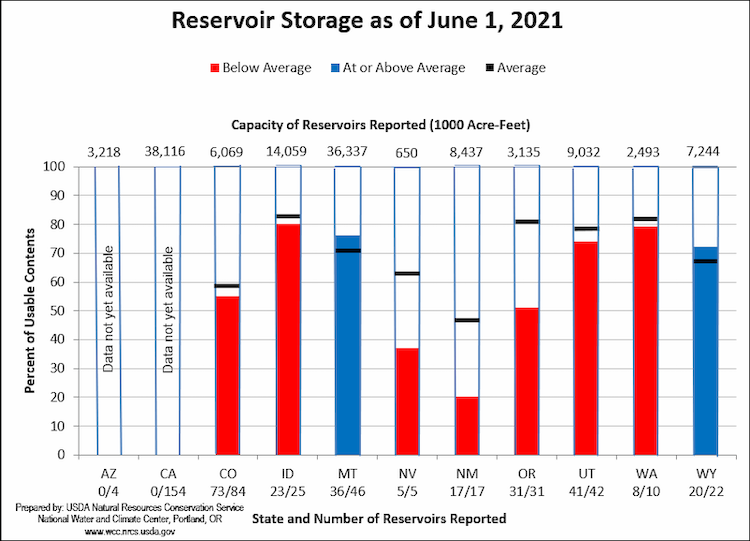
Reservoir Storage for the Western U.S.
Reservoir storage percent of capacity for the Western U.S. as of May 1 and June 1, 2021. Graph from the USDA.
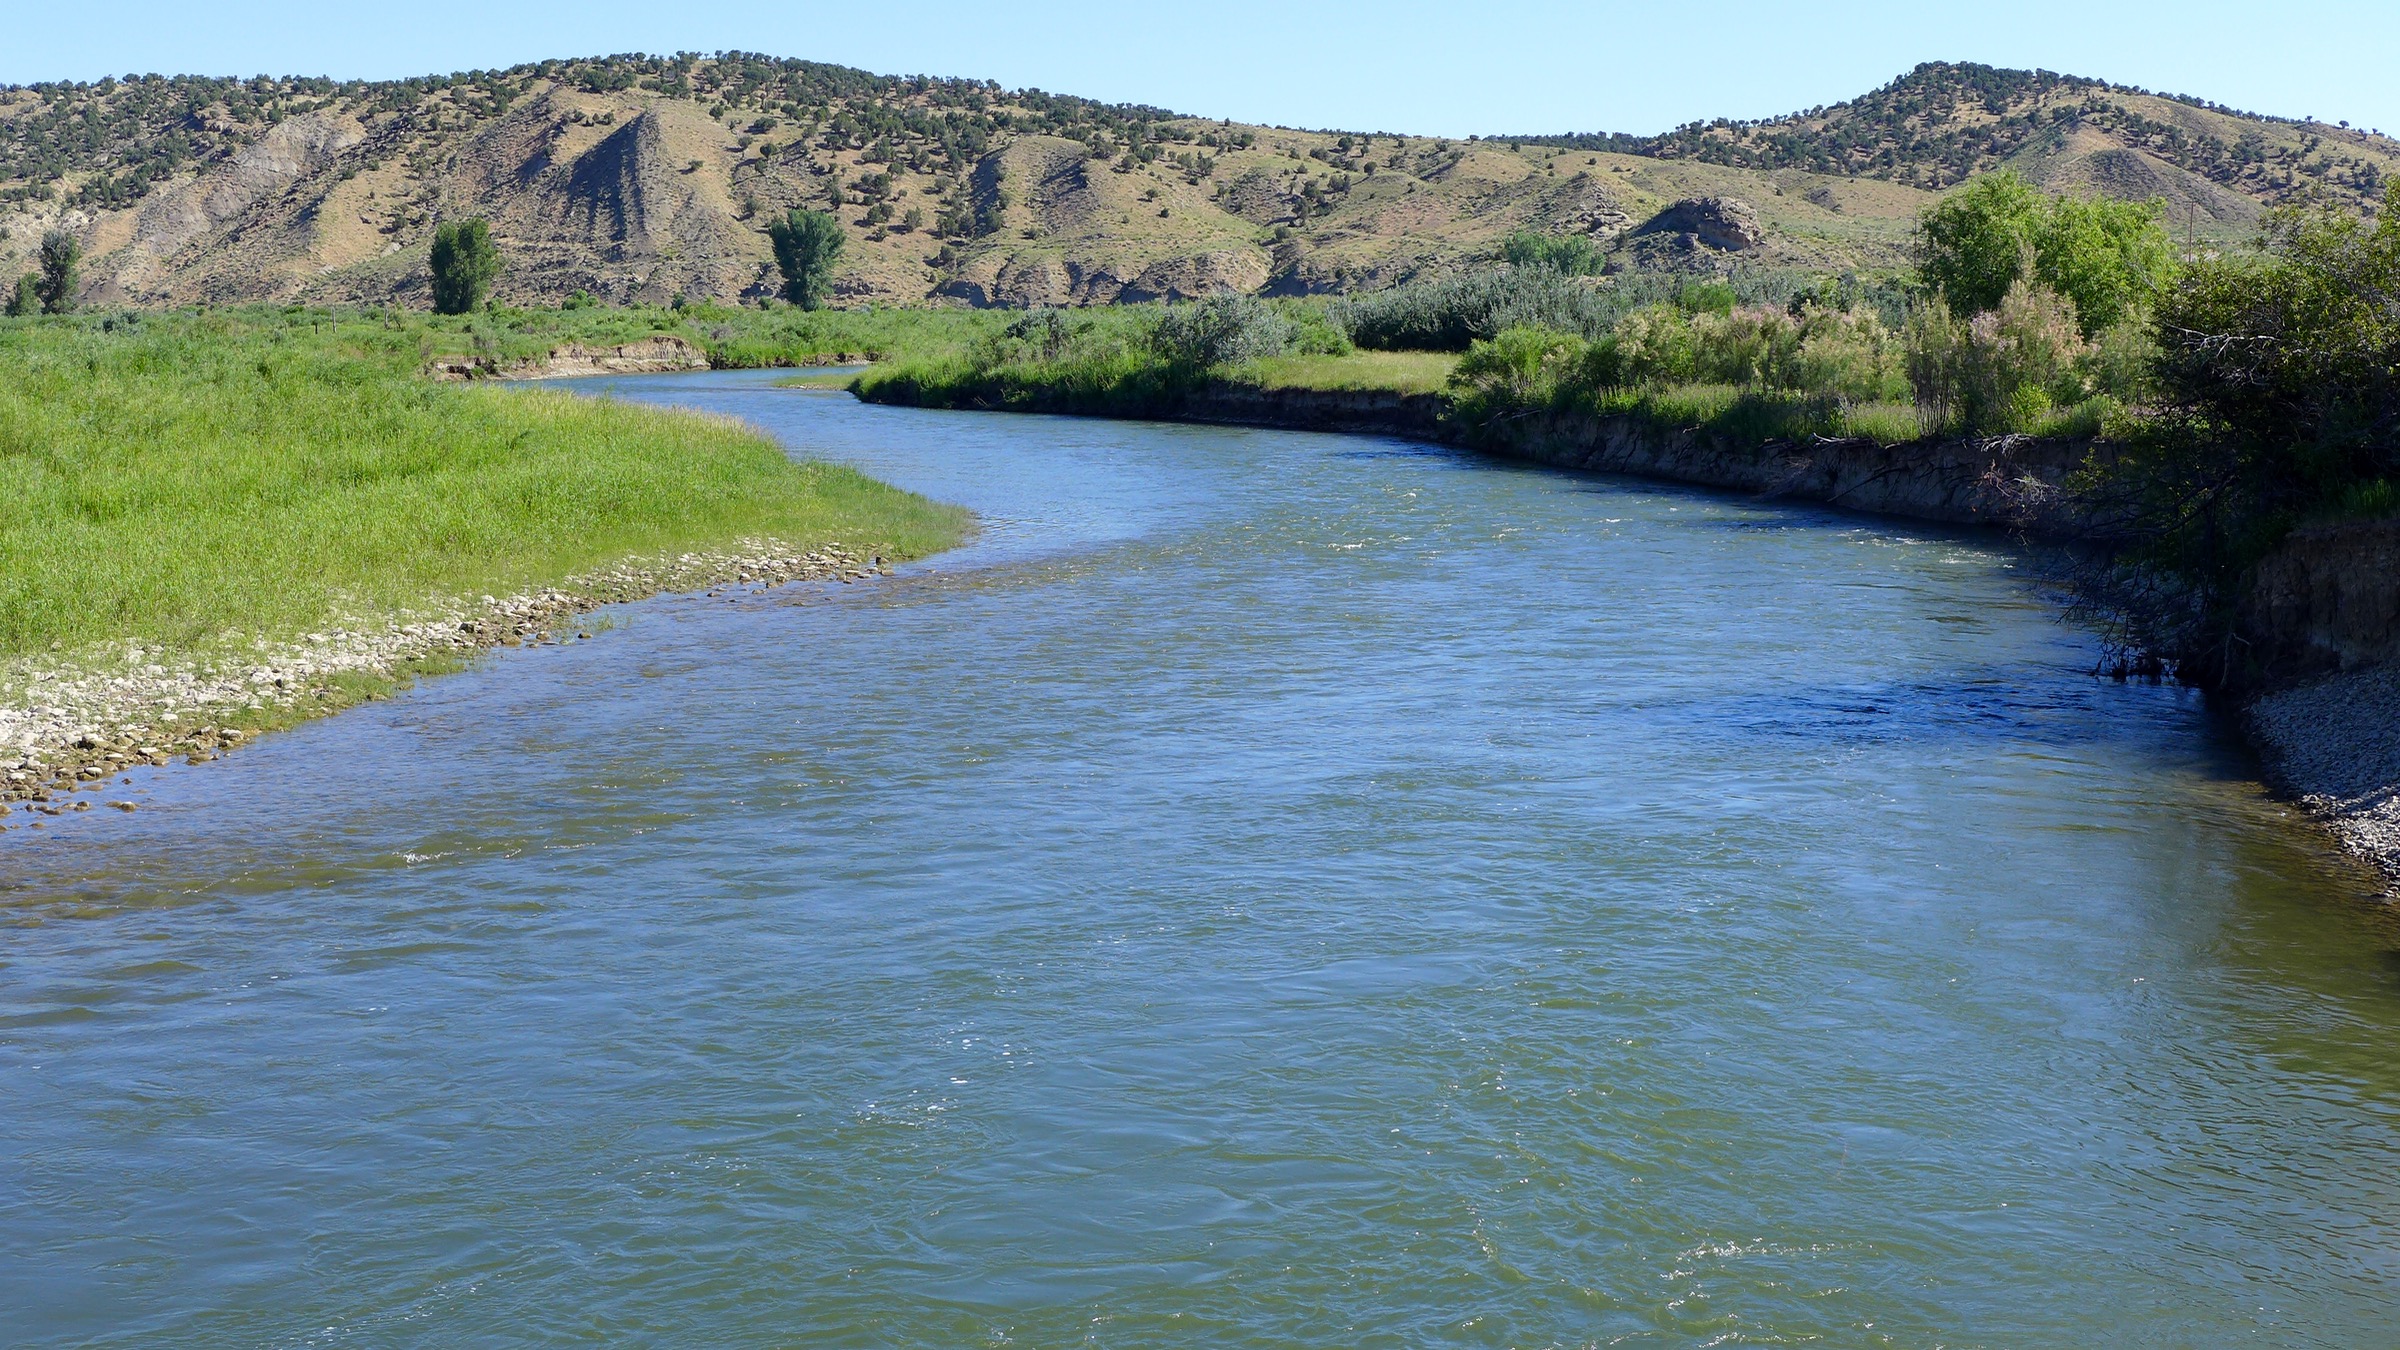
The White River, in the vicinity of the proposed Wolf Creek Reservoir. Photo by Brent Gardner-Smith/Aspen Journalism.
Click here for all the inside skinny and to register:
Join the Colorado River District for the White River State of the River webinar on Tuesday, June 15 at 6 p.m.! Our experts and special guests will be presenting on the issues that affect your water supply throughout the White River Basin.
Learn more about the river’s hydrology and water level forecasts as we enter another drought year. Hear updates on management plans to provide water for endangered fish species and learn about current efforts to study the impact of algae blooms in the river.
If you cannot attend the webinar live, register to receive an emailed webinar recording to watch later!
Agenda:
Welcome – Colorado River District Staff
The Community Funding Partnership – Amy Moyer, Colorado River District, Director of Strategic Partnerships
Water Supply and Drought in the White River Basin – Becky Bolinger, Colorado Assistant State Climatologist
Measurement and Abandonment on the White River – Erin Light, Colorado Division of Water Resources, Division 6 Engineer
Water Management Planning in the White River Basin – Callie Hendrickson, Executive Director, White River and Douglas Creek Conservation Districts
Algae Issues on the White – Natalie Day, Biologist, Colorado Water Science Center, U.S. Geological Survey
Rio Blanco Water Conservancy District Update – Alden Vanden Brink, Rio Blanco Water Conservancy District, District Manager
Fish Tales: The White River Basin and the Endangered Fish Recovery Program – Jojo La, Colorado Water Conservation Board, Endangered Species Policy Specialist
Jun 15, 2021 06:00 PM in Mountain Time (US and Canada)
Almost half the country’s population is facing dry conditions. Soils are parched. Mountain snowpacks produce less water. Wildfire risk is already extreme. The nation’s largest reservoir, Lake Mead, is headed to its lowest level since it was first filled in the 1930s.
The past year has been the driest or second driest in most Southwestern states since record-keeping began in 1895. Farms and cities have begun imposing water restrictions, but Western states are facing a threat that goes deeper than a single bad year. The hotter climate is shrinking water supplies, no matter what the weather brings.
Warming temperatures make it less likely for a raindrop or snowflake to reach a reservoir due to increased evaporation. As a result, the people who manage the West’s complex water systems are realizing that with climate change, they can no longer rely on the past to predict the future.
That’s creating a fundamental threat to the way Western water systems operate, because they were built around the idea that the climate would remain constant. Historical climate data such as river flows and rainfall totals told engineers how big to build reservoirs and canals. The data also told them how much water was available to divide up among cities and farms.
Climate change is putting that system under increasing stress, shrinking water supplies for tens of millions of people and for the farmland that produces most of the country’s fruits and vegetables. Water cutbacks are reverberating through California’s $50 billion agricultural industry, which employs tens of thousands of people in many small towns.
Southwestern states recently negotiated a temporary agreement to use less water as reservoirs keep falling. But tough conversations remain about how the West and its complex system of water rights will adapt to a future for which it wasn’t designed.
“We can really no longer look at the past and say: The amount of water we’ve had in the last 100 years is what we can expect in the future,” says Eric Kuhn, an author who worked on water policy for decades at the Colorado River Water Conservation District. “That is no longer true because of climate change.”
[…]
Hoover (Boulder) Dam photo credit Ansel Adams circa 1942 via Wikipedia.
Glen Canyon Dam
Climate amplifying bad luck
Like a run-of-the-mill streak of bad luck, droughts are normal in the West. Now, climate change is exacerbating their effects.
“Over the last 22 years or so, there’s been quite a bit of bad luck because precipitation totals have on average been low,” says Park Williams, associate professor of hydroclimatology at UCLA. “But the effect of that bad luck has been really amplified because of warmer temperatures.”
A hotter atmosphere is thirstier, drawing water out of plants and soils and into the air. Snowpacks melt earlier, which in turn boosts that evaporation, because without the reflective surface that snow creates, soils heat up faster. And when soils are dry, they act like a sponge. They need to soak up more moisture before they’re saturated enough for the water to run off into rivers and streams.
Studies show that since 2000, about half the reduction in the Colorado River’s flow has been due to warmer temperatures. For every degree Celsius of warming, the river’s flow is expected to shrink by 9%, according to another study.