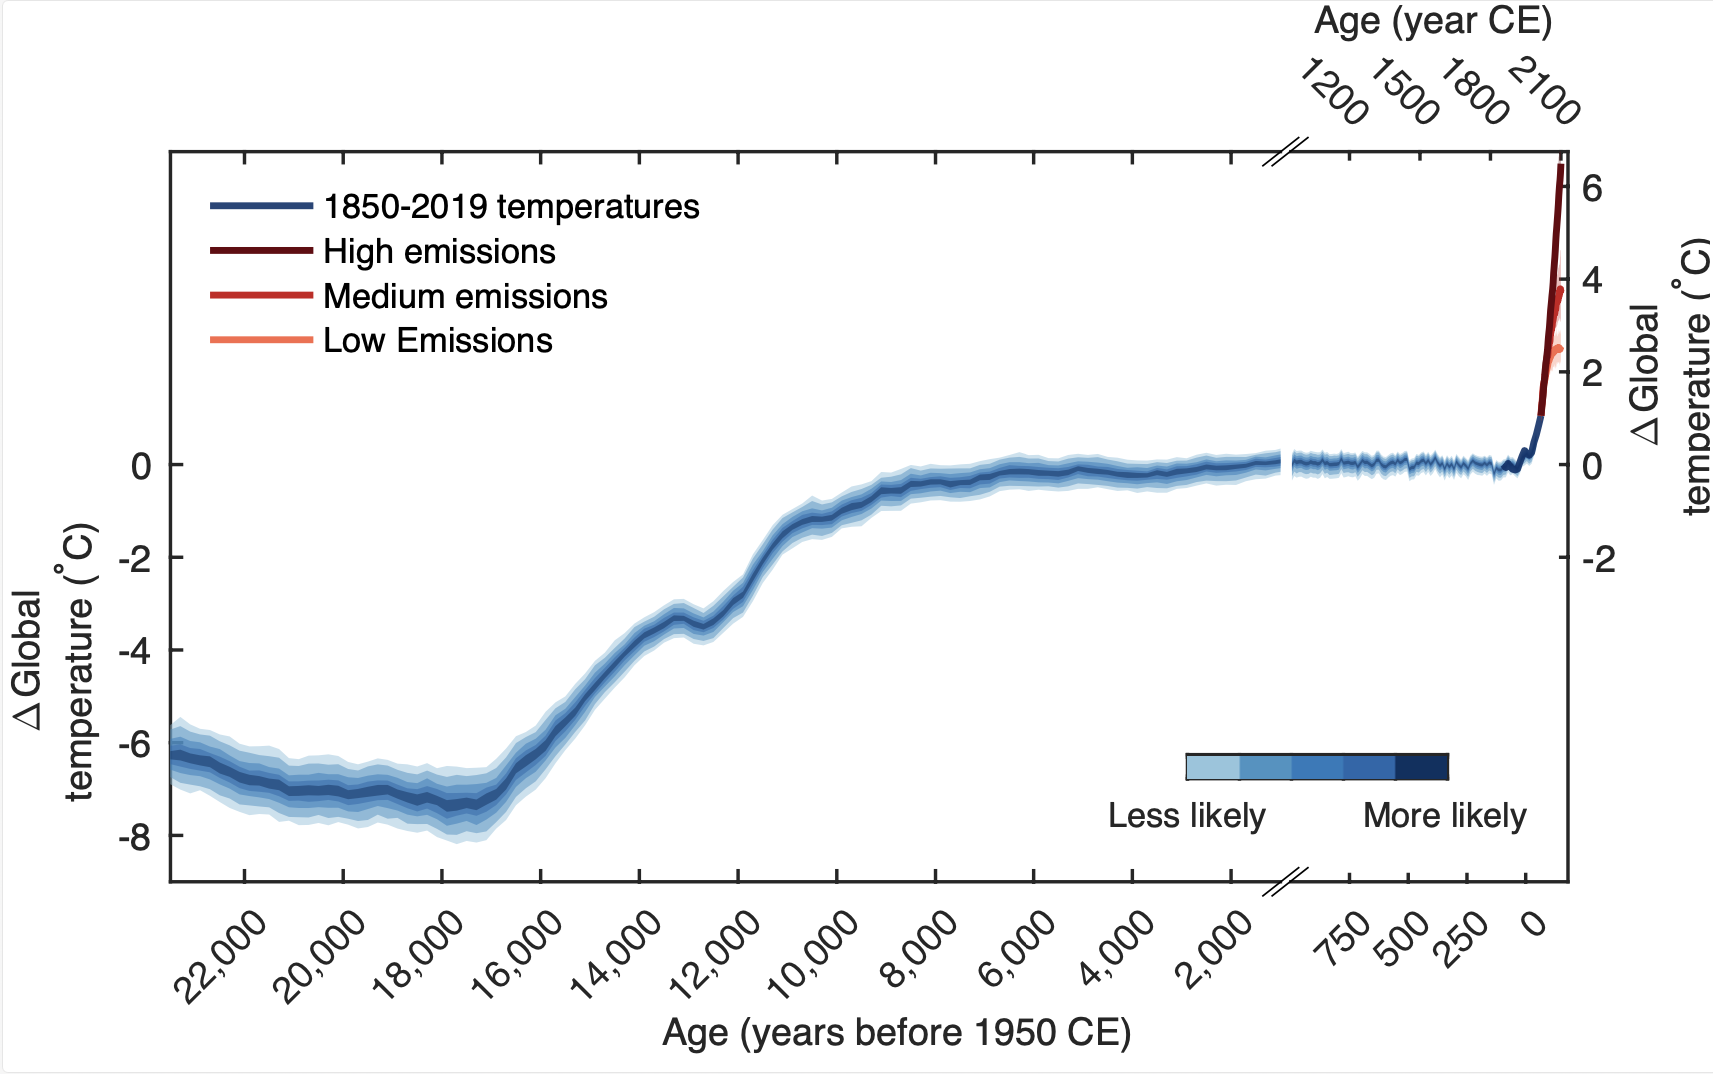
The climate “hockey stick” refers to a reconstruction of temperatures over the past 1,000 years. The data shows flattish temperatures over the last millennium, like the handle of a Hockey stick, ending in a “blade” of rapidly rising temperatures since the industrial revolution. The idea first appeared in a paper by Michael Mann and Raymond Bradley of the University of Massachusetts and Malcolm Hughes of the University of Arizona. The work became famous after appearing in a UN climate report, after which it was the focus of climate denial, hacking, defamation, and disinformation, all of which was dramatized in a recent BBC TV drama called “The Trick.”
Today, in a paper published by Nature, scientists show that the “handle” of the “hockey stick” extends back 9,500 years, while its “blade” is taller—the last decade was 1.5° C hotter than the average temperature over the last 11,700 years. “Human-caused global temperature change during the last century was likely faster than any changes during the last 24,000 years,” said lead author Dr. Matt Osman of the University of Arizona.
An animation showing the warming that ended the last ice age. Credit: ARS Technica
Taking the temperature of times before thermometers
To measure temperatures at times long before the invention of thermometers, scientists must use indirect proxies. For the new study, scientists carefully vetted over 500 proxy records from oceans around the world; the data shows the fossilized remains of plankton and microbes in sediments where the age is known from radiocarbon dating.
Researchers then used statistical methods to calculate sea surface temperatures from the chemical properties of those remains. “We spent seven years developing the models for the different kinds of marine temperature proxies, incorporating knowledge from biology and geochemistry and using the best statistical practice,” explained coauthor Dr. Jessica Tierney of the University of Arizona and leader of the lab in which this research was conducted.
The researchers combined the proxy temperatures with climate model simulations to account for the incomplete geographic distribution of data, and they cross-checked their results with independent records such as ice drilled from polar regions and stalagmites in caves.
Resolving a conundrum
The researchers’ work allowed them to produce maps and graphs of global temperatures as Earth emerged from the last ice age, providing 200-year time slices going back 24,000 years.
The authors find that the ice age was 7° C colder than the preindustrial era, about a degree colder than an earlier estimate had shown. Warming began 16,900 years ago, and by 11,000 years ago, Earth was enjoying a relatively warm “interglacial” climate. These findings refine the details but match the broad outline revealed in earlier work.
Resolving the Holocene Climate Conundrum: Proxies aren’t evenly distributed around the planet, so a simple average shows Holocene cooling (red). The new work by Osman and colleagues corrects for geographic unevenness, and the result is a slight warming trend (blue).
But unlike earlier studies, the new work shows that, prior to our current warming, there was a slow, long-term warming of 0.5° C that started 9,500 years ago. It also shows that the “handle” of the climate “hockey stick” is straight, whereas in prior studies, the “handle” was warped, with early warming followed by cooling into preindustrial times.
The new results resolve a disagreement between climate models (which simulated warming) and proxy studies (which showed cooling). The problem was known as the “Holocene Temperature Conundrum.”
Dr. Samantha Bova of San Diego State University, who published a reconstruction of temperatures for the same time period earlier this year, agreed, saying, “Both reconstructions show no evidence for an early Holocene warm period.” She pointed out that her paper used a completely different method, so the fact that her research came to the same conclusion as the Tierney team “leaves little room for doubt that the Holocene was a period of long-term warming,” she said.
So what changed?
Osman and colleagues concluded that most of the conundrum’s resolution is due to the sophisticated handling of geographic unevenness in their data compared to prior work. “Older reconstructions are just binned latitudinal averages,” said Tierney. “[That] method has a downside in that it doesn’t account for temperature changes in regions that are unsampled.”
Tierney’s team also found the conundrum could not be explained by seasonal growth of the plankton and algae used to reconstruct temperatures. “Even after accounting for seasonal bias, we still could not reconcile the [results] with reconstructions based on proxies alone,” said Tierney. “This led us to conclude that spatial representation was the most important factor.”
We already have a hockey stick, but future warming will only make the contrast with the rest of the post-glacial period more extreme.
Dr. Shaun Marcott of the University of Wisconsin-Madison, who led a proxy reconstruction of Holocene climate in 2013, told Ars that the new work is a significant step forward. “The full field surface temperature reanalysis… is well beyond prior papers and has taken this team of scientists close to a decade to build,” he said, adding, “It is a triumph, and what this group has been doing is spectacular!”
For Mann, who had to go all the way to the US Supreme Court to defend his work and reputation, this work represents yet another vindication. “It’s become clear that the hockey stick ‘handle’ is much longer, and the ‘blade’ is sharper as we’ve warmed substantially since 1998 when we first published the ‘Hockey Stick,’” he told Ars.
Howard Lee is a freelance science writer focusing on geology and climate change in deep time. He holds a B.Sc. in Geology and M.Sc. in Remote Sensing, both from the University of London, UK. When not writing, he’s probably gardening, hiking, or kayaking near his home in rural Massachusetts.
States in the lower Colorado River basin are developing a $100 million plan that will leave more water in Lake Mead over the next couple of years.
The goal is to keep the lake from hitting a critical level that would leave the reservoir more vulnerable to rapid decline.
“You don’t have much of a buffer left to deal with that (rapidly declining water level) if you have a bad year of runoff in the system,” said Tom Buschatzke, director of the Arizona Department of Water Resources.
The negotiations between Nevada, Arizona, California and the U.S. Bureau of Reclamation for additional reductions in water use come just months after the federal government declared Lake Mead’s first water shortage. That declaration forces Nevada and Arizona to take cuts to their allocation of water next year.
The water level projections that led to those cuts also triggered a provision in a 2019 drought response agreement that forces the lower basin states to discuss ways to prevent the lake from falling below an elevation of 1,020 feet, Buschatzke said.
As of Thursday, the water level was just below 1,066 feet…
The states have not finalized how they will reach the 500,000 acre-foot goal for the next two years, but Buschatzke said the preference is voluntary conservation over forced cuts.
He said the effort is going to cost about $100 million, with his department committing $40 million. Next week, the Southern Nevada Water Authority board is scheduled to consider approving the use of $20 million over the next two years to continue fighting lake level decline.
One way to meet the conservation goal is to pad reserves and keep them in the lake through 2026. The states are also looking at leaving reserves in the lake that were scheduled to be released next year.
Buschatzke said the federal government could also look at making delivery of water to the lower basin more efficient.
Another path is new system conservation, a process of making water use more efficient and using the saved water to bolster Lake Mead’s elevation. A portion of Southern Nevada’s spending may go toward this, a spokesman said…
Buschatzke said the goal is to finalize the two-year agreement next month, then get to work on filling out the remaining three years of the plan.
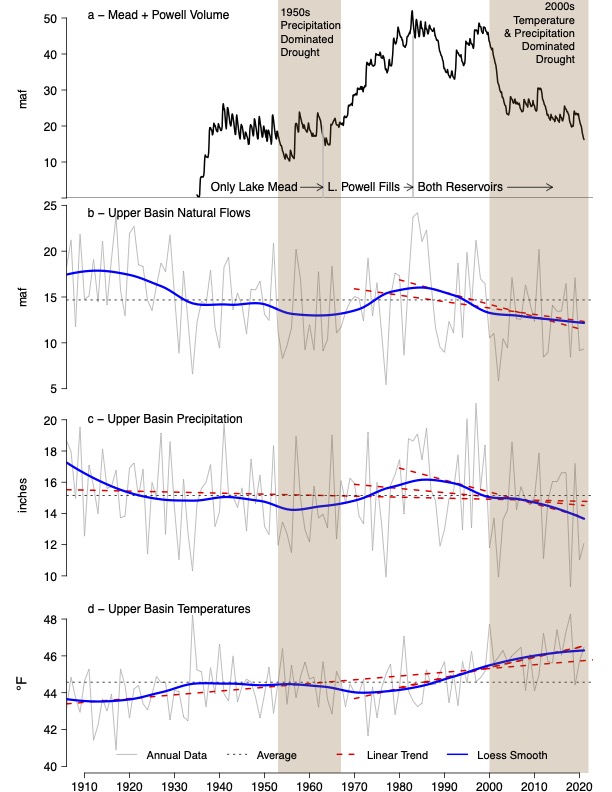
Brad Udall: Here’s the latest version of my 4-Panel plot thru Water Year (Oct-Sep) of 2021 of the Colorado River big reservoirs, natural flows, precipitation, and temperature. Data (PRISM) goes back or 1906 (or 1935 for reservoirs.) This updates previous work with @GreatLakesPeck.