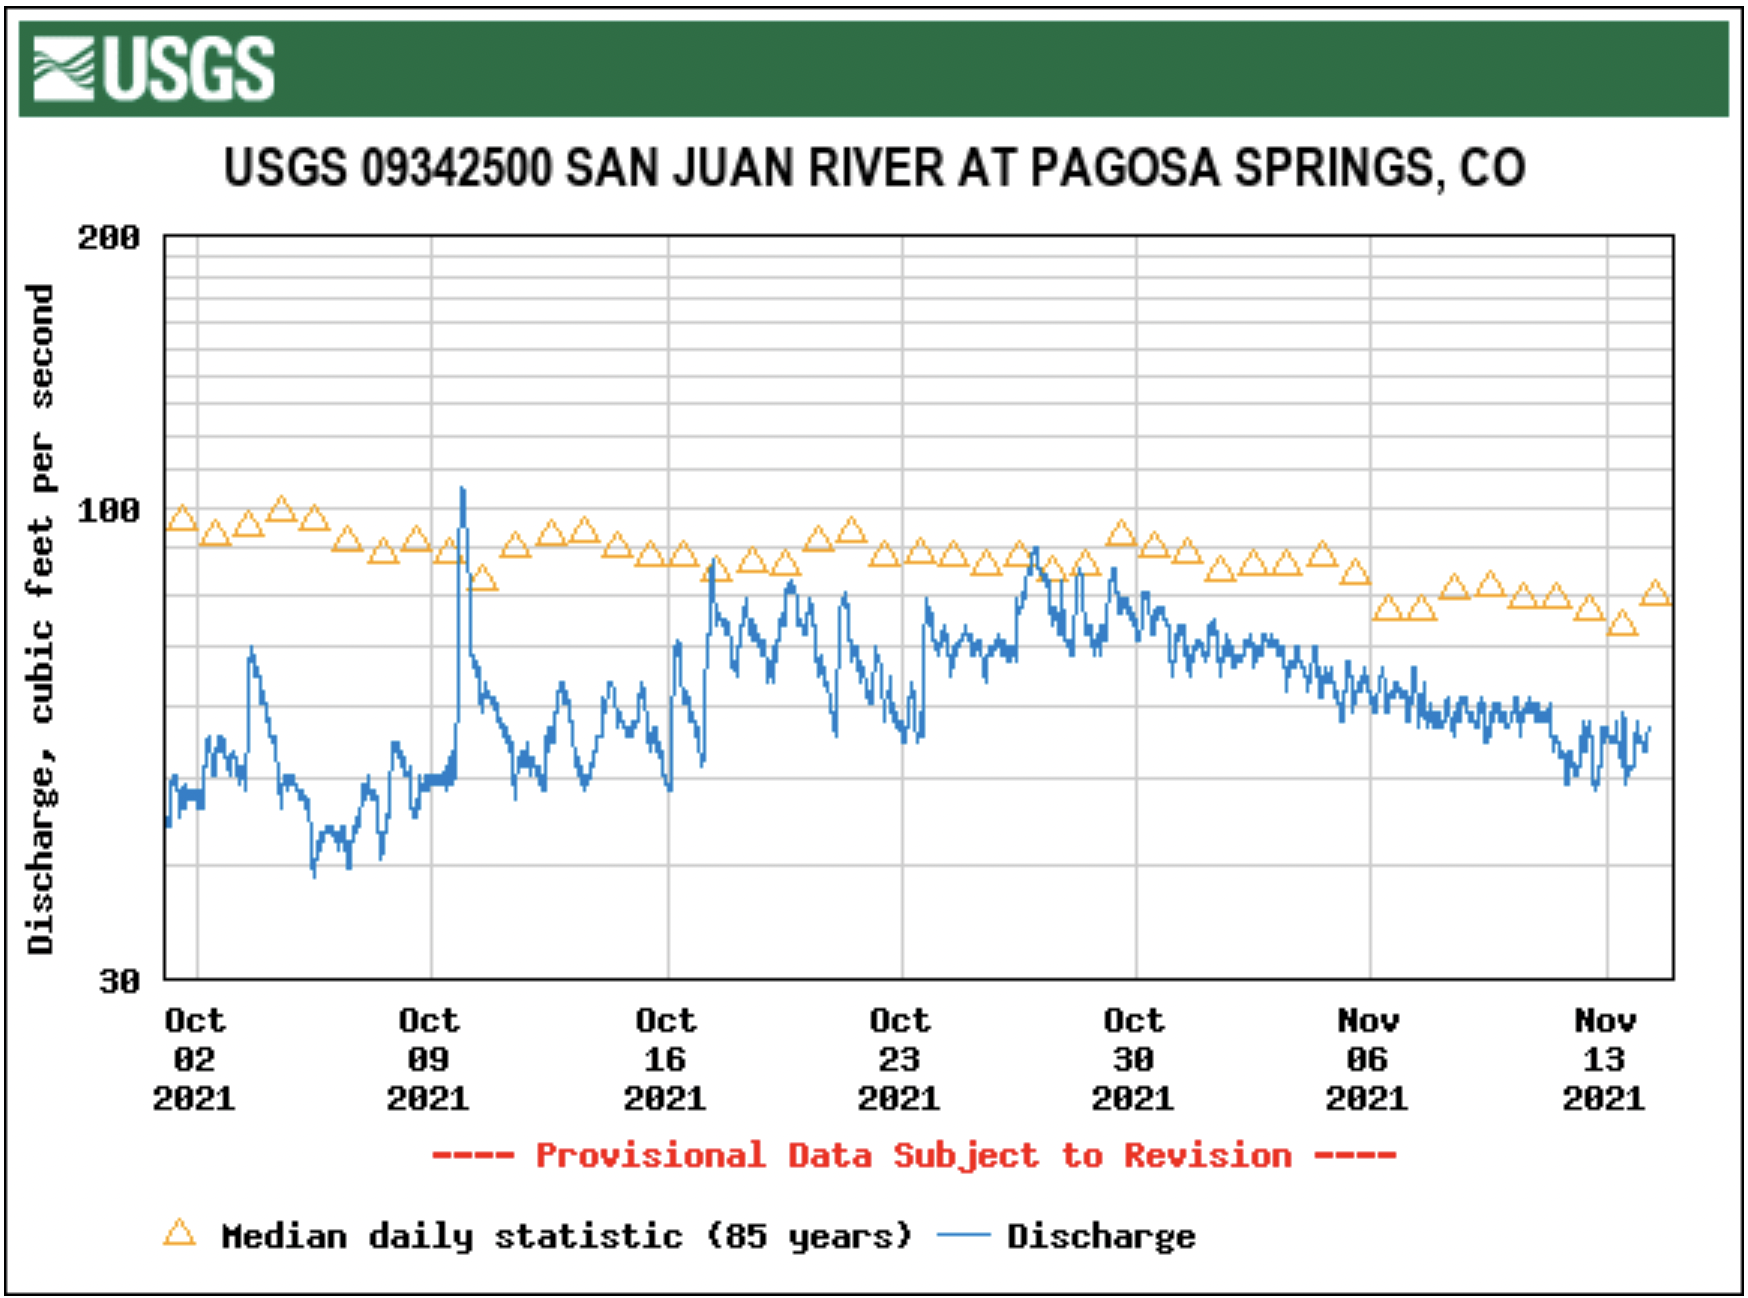
According to the U.S. Geological Survey (USGS), the San Juan River was flowing at a rate of 59.2 cfs in Pagosa Springs as of 1 p.m. Wednesday, Nov. 10.
Based on 86 years of water records at this site, the lowest recorded flow rate for this date is 20 cfs, recorded in 1951.
The highest recorded rate for this date was in 1987 at 348 cfs. The average flow rate for this date is 98 cfs.
As of 1 p.m. Wednesday, Nov. 10, the Piedra River near Arboles was flowing at a rate of 51.4 cfs.
The highest recorded rate for this date was 460 cfs in 1987.
The lowest recorded rate for this date was 50 cfs in 1965.
Based on 59 years of water records at this site, the average flow rate for that date is 122 cfs.
Snow report
Pagosa’s high country received a small dusting this past week, with Wolf Creek Ski Area reporting 2 inches of fresh snowfall Wednesday morning.
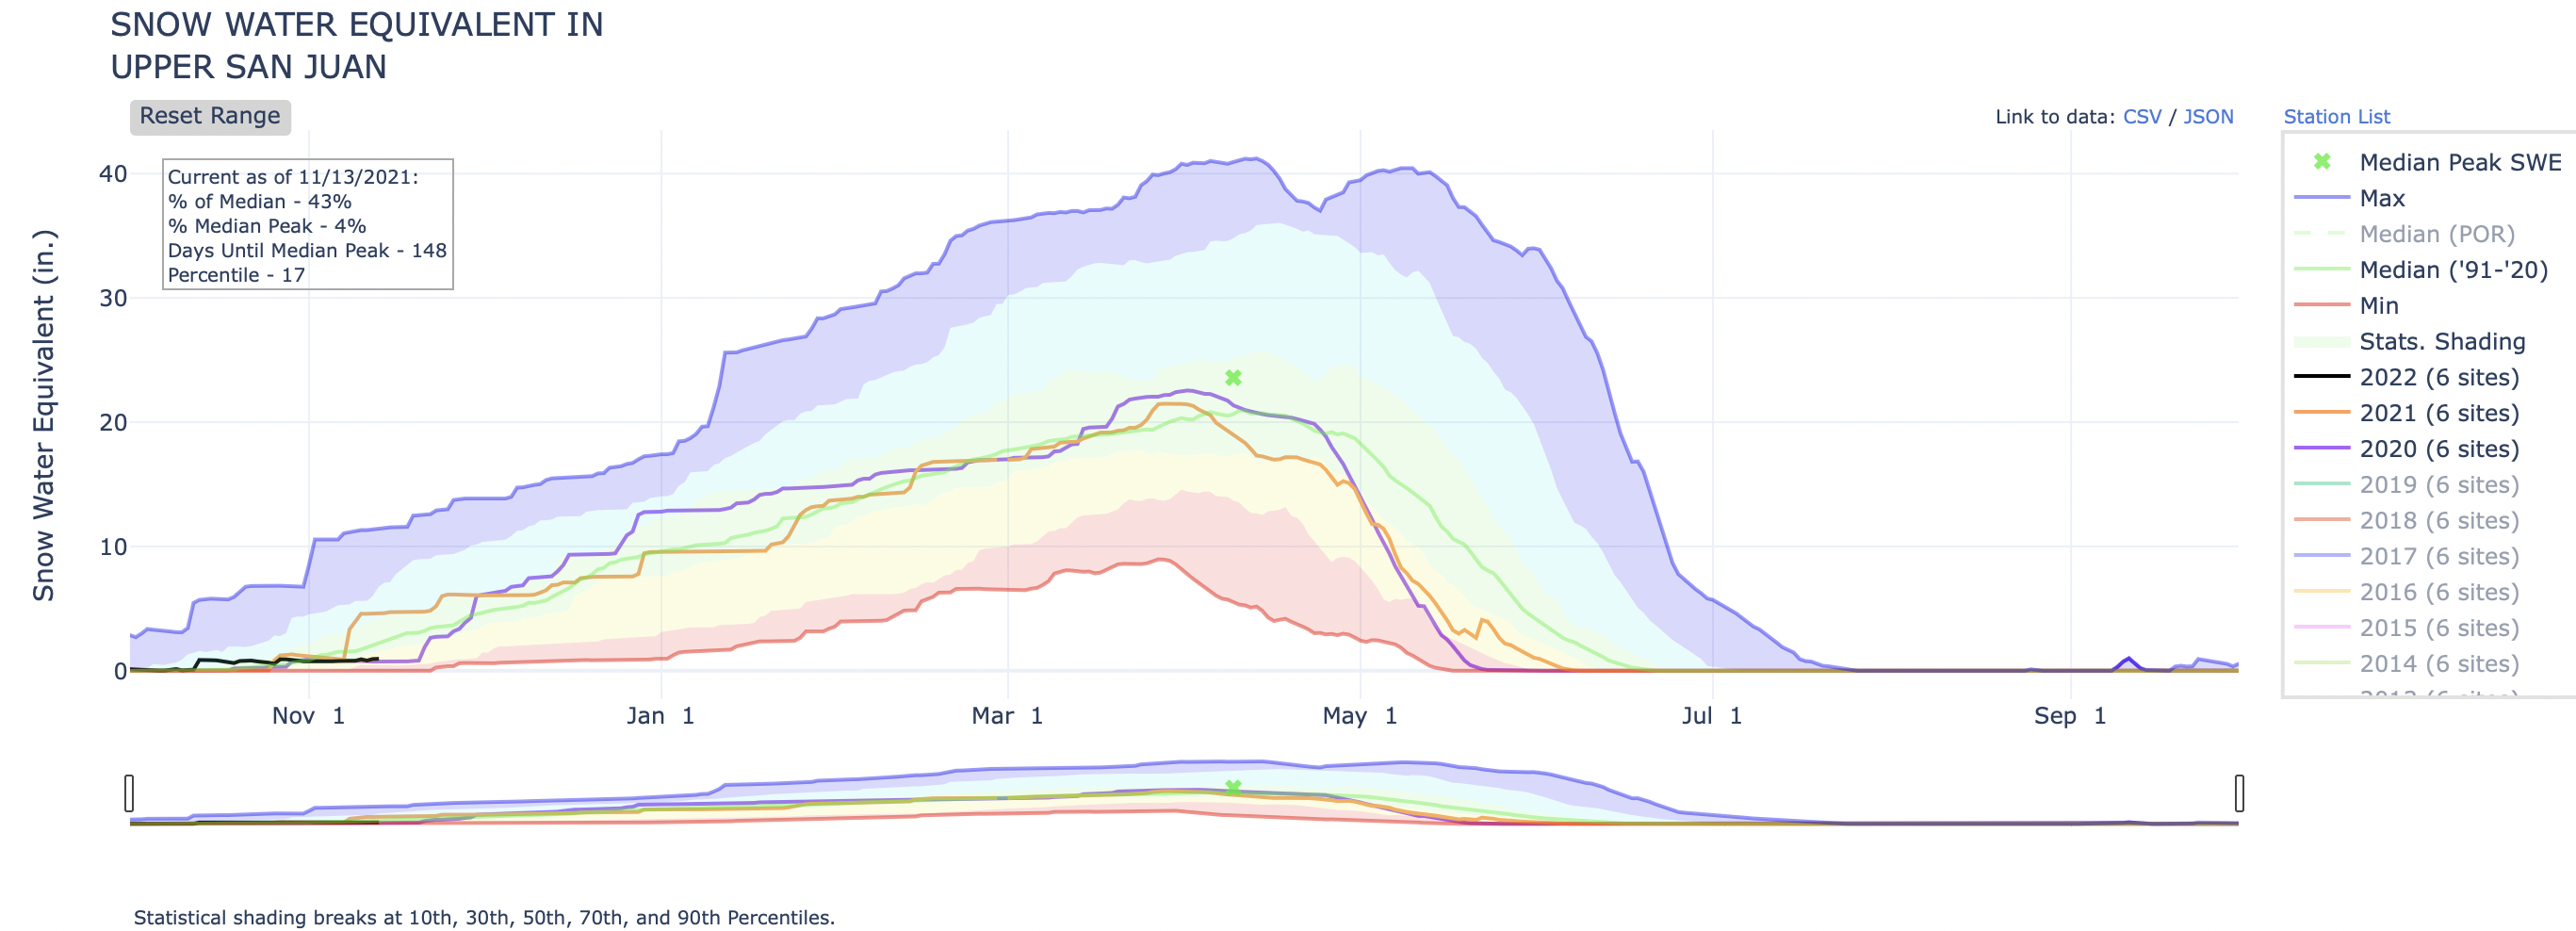
According to the U.S. Department of Agriculture (USDA) National Water and Climate Center’s snow pack report, the Wolf Creek summit, at 11,000 feet of elevation, had 3.5 inches of snow water equivalent as of 1 p.m. on Nov. 10.
The San Miguel, Dolores, Animas and San Juan River basins were at 69 percent of the Nov. 10 median in terms of snow pack.
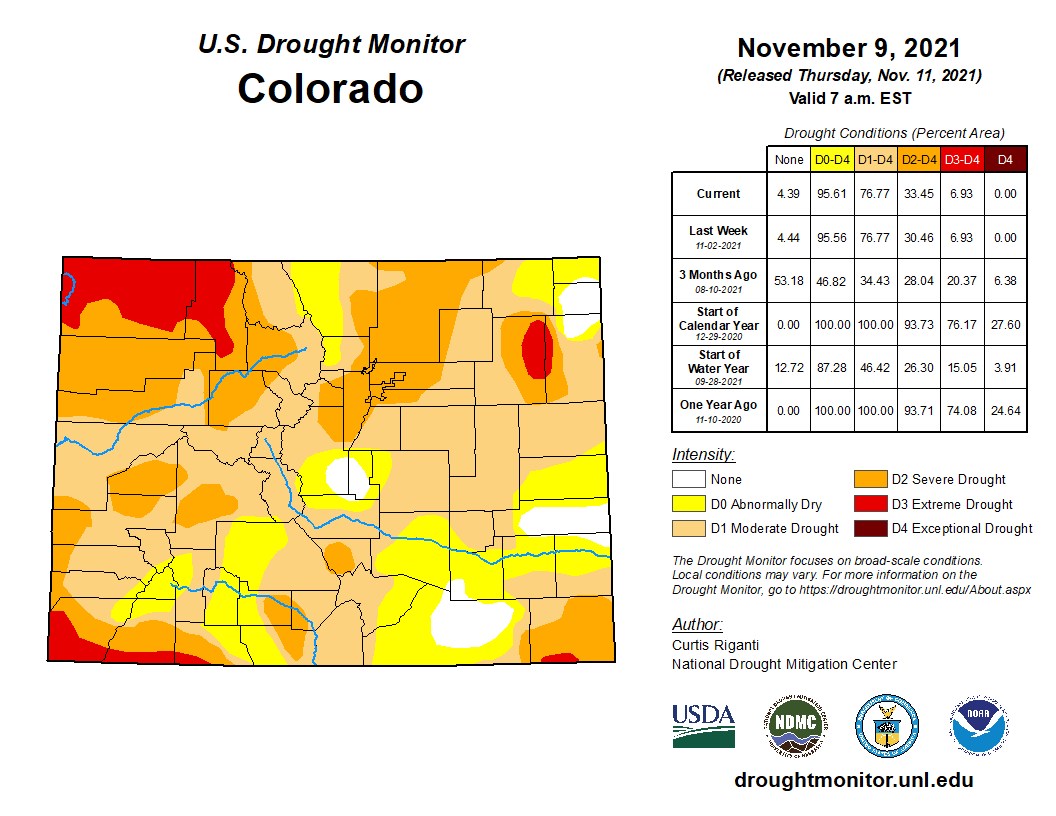
Colorado Drought Monitor map November 9, 2021.
Drought report
The National Integrated Drought Information System (NIDIS) was last updated on Nov. 2.
The NIDIS website indicates 100 percent of Archuleta County is abnormally dry.
The percentage of the county in a moderate drought is listed at 70.86, which is up slightly from the previous report of 70.79 percent.
The NIDIS website also notes that 47.66 percent of the county is in a severe drought stage, consistent with last week’s report.
Additionally, the NIDIS website notes that 10.33 of the county remains in an extreme drought, consistent with last week’s report.
No portion of the county is in an exceptional drought.
Improved agricultural practices and widespread irrigation may stave off another agricultural calamity in the Great Plains. But scientists are now warning that two inescapable realities — rising temperatures and worsening drought — could still spawn a modern-day Dust Bowl.
Growing up in rural Iowa in the 1990s, Isaac Larsen remembers a unique herald of springtime. The snowbanks piled along roads, once white or gray, would turn black. The culprit was windblown dust, stirred from barren farm fields into the air.
Even as some of the region’s farmers have adopted more sustainable practices, the dust still flies. Not long ago, Larsen’s mother told her son about an encounter with a dust storm, saying “the soil was just blowing across the road — almost like a blizzard, but black.”
Larsen, a 42-year-old geoscientist at the University of Massachusetts-Amherst, recently published a paper on soil loss in the U.S. Corn Belt. Since farming began, Larsen and his coauthors estimate that more than one-third of the Corn Belt — nearly 30 million acres — has lost all of its nutrient- and carbon-rich topsoil. Similar processes also are taking place on the neighboring Great Plains, a sprawling region that includes Kansas, Nebraska, and the Dakotas, as well as parts of Texas, Oklahoma, Missouri, Montana, and Colorado.
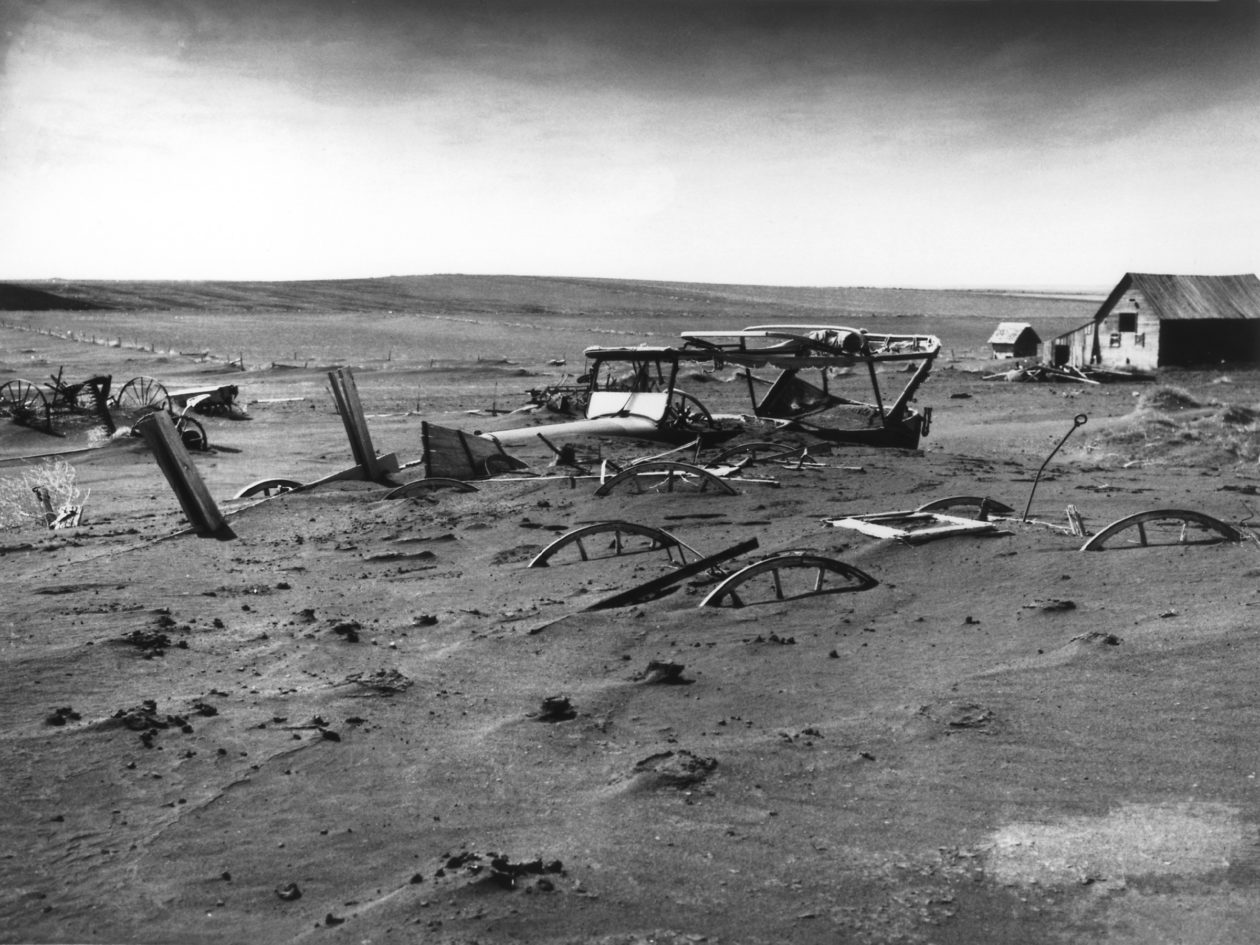
Each dust storm represents a thin layer of the earth, exfoliated by the atmosphere and relocated. Over time, as countless such storms have swept across the Midwest and Great Plains, they have removed the legacy of thousands of years of plant life and death there. The most striking example was the 1930s Dust Bowl, the environmental and agricultural catastrophe that stripped topsoil from millions of acres across the American interior, plunging farmers into bankruptcy, destroying crops, and fundamentally reshaping the heartland.
Much has changed in the U.S. heartland since the 1930s, with widespread irrigation and — on some farms — improved agricultural practices. But given the rising temperatures and worsening droughts caused by gobal warming, some scientists are asking whether the U.S. breadbasket is headed for another Dust Bowl.
In a 2018 National Climate Assessment, U.S. scientists warned that under current warming scenarios, temperatures in the southern Great Plains could increase by 3.6 to 5.1 degrees F by 2050 and by 4.4 F to 8.4 F by 2100, compared to the 1976-2005 average. The region is projected to be hit by dozens more days with temperatures above 100 degrees F. Temperature increases are likely to be less severe in the northern part of the region, but the entire Great Plains is nevertheless expected to weather both more heatwaves and periods of extreme drought, according to the National Climate Assessment.
The seeds of the Dust Bowl were sown when farmers in the early 20th century tore out millions of acres of hardy native grasses to plant wheat and corn during a relatively wet period. Then, when a historic, multi-year drought and heatwave occurred in the 1930s, the crops died and the exposed topsoil was left dry and loose, ripe to be swept away by strong winds. The ensuing storms could be immense: On April 14, 1935, the “Black Sunday” dust storm lofted central plains topsoil all the way to the cities of the East Coast. By the time the Dust Bowl was over, millions of migrants had fled the once-promising Great Plains for California and other western states.
A buried barn lot in South Dakota at the height of the Dust Bowl in 1936. WIKIMEDIA COMMONS
But the catastrophe spurred innovation, too. In the midst of the Dust Bowl, the government acted quickly to establish the Soil Conservation Service, which helped promote more sustainable techniques like no-till agriculture and cover cropping, which reduce the amount of exposed soil. Many of the heartland’s industrial-scale farming operations, however, did not adopt these practices, though in recent years no-till agriculture has become more widespread.
The Ogallala aquifer, also referred to as the High Plains aquifer. Source: National Oceanic and Atmospheric Adminstration
Since the 1940s, many farmers on the Great Plains also have extensively irrigated their crops, allowing them to weather dry periods and further preventing topsoil erosion. But that reliance on irrigation has left the Great Plains open to new dangers. The Ogallala Aquifer — which makes up most of the High Plains Aquifer System and supplies the water for 30 to 46 percent of irrigated land in some Great Plains states — has been steadily overdrawn in recent decades; by some estimates, the Ogallala Aquifer could be 70 percent depleted within 50 years.
“There comes a point where if you’re not replenishing those resources like aquifers, then all you need is the next minor drought to come along, and if you don’t respond, then you run the risk of another Dust Bowl-like event,” says Tim Cowan, a senior research fellow at the University of Southern Queensland who studies the effects of climate change on precipitation and heatwaves.
Heat and drought are intimately linked, meaning that worsening heatwaves mean more droughts and vice versa. That one-two punch has many scientists concerned. “Dry soils have this exacerbating effect,” says Wim Thiery, a climate scientist at the University of Brussels. “There is this positive feedback where dry soils lead to more warmth.”
When the soil contains a lot of moisture, incoming energy from the sun gets absorbed by the water as it turns from a liquid into a gas. But when the soil contains little water, that energy is converted directly into heat. The result is that droughts lead to more severe heatwaves, and those heatwaves in turn lead to drier conditions.
Data shows that both drought and heat are becoming more common — and perhaps increasing the feedback effects between them. In a recent study in Nature, Cowan and his coauthors found that greenhouse gas emissions have made a period of Dust Bowl-like heatwaves more than two-and-a-half times more likely compared to the 1930s.
Ben Cook, a climate scientist at the NASA Goddard Institute for Space Studies, says the same goes for drought. “What we’re seeing in a lot of regions is this kind of amplified evaporation effect that’s making it … easier to get into drought, a little bit harder to get out of drought, and making the droughts themselves a bit more intense than they would have been in a colder world.”
Meanwhile, agriculture continues to thrive in the Midwest and Great Plains. The combined regions are top producers of crops like corn, wheat, and soybeans, as well as livestock. That level of agricultural intensity, paired with increasingly hotter weather, raises the stakes for the United States should another historic drought occur.
One paper in 2016 relied on computer simulations to model the effects of Dust Bowl conditions on modern agriculture. Corn and soy crop yields would decline by around 40 percent, the authors estimate, and wheat yields would drop 30 percent. And every one degree Celsius (1.8 F) increase in temperature would cause the effects to worsen by 25 percent.
In a world where drought and heatwaves become routine, the two might combine to tip the country into a situation where agriculture becomes increasingly threatened, with profound impacts on U.S. food supplies.
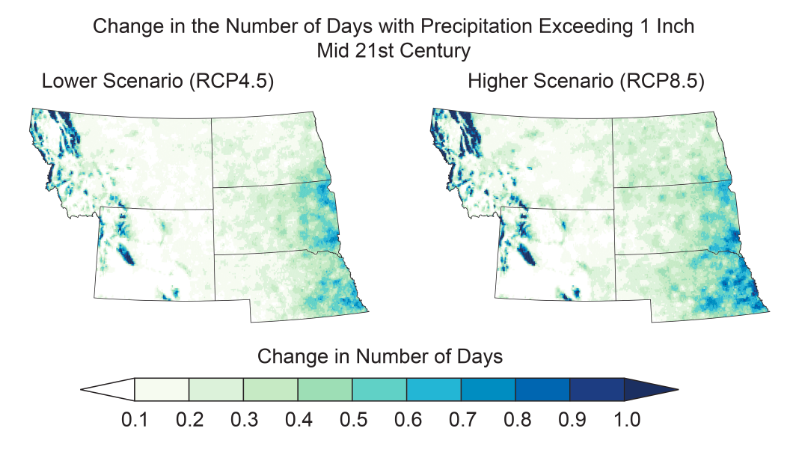
Projected changes are shown for the annual number of very hot days and heavy precipitation events in the mid-21st century. GLOBALCHANGE.GOVProjected changes are shown for the annual number of very hot days and heavy precipitation events in the mid-21st century. GLOBALCHANGE.GOV
The United State got a recent taste of Dust Bowl-like conditions. In 2012, the country experienced one of its worst droughts on record, along with a sizzling heatwave. La Niña conditions in the Pacific Ocean, combined with the lingering effects of a dry 2011, resulted in the driest summer in the U.S. since 1988. By July, nearly two-thirds of the country was in drought conditions, according to the U.S. Drought Monitor. Meanwhile, July 2012 was the second-hottest month on record at the time.
The effects on the nation’s farmers were substantial. Estimates put agricultural losses at around $30 billion, and corn yields declined by 26 percent. But even though the 2012 drought was similar in character to the Dust Bowl, billowing dust storms and wholesale agricultural collapse were absent. Similarly, a severe drought in the 1950s also failed to kick off another Dust Bowl.
“We’ve had bad droughts in the Central Plains since the Dust Bowl, but we haven’t had the same level of land degradation and dust storm activity,” Cook says. “And part of the reason for that is because our land use practices have changed.”
For the time being in the Great Plains, irrigation allows farmers to weather even severe droughts by drawing on water stored in underground aquifers. But the overuse of the High Plains Aquifer System, especially the Ogalalla Aquifer, is taxing the region’s groundwater supplies. Since 1987, the U.S. Geological Survey (USGS) has been gathering yearly data on water levels in the High Plains Aquifer by monitoring thousands of wells.
Though changes vary across the region, the overall picture is one of persistent decline, says Virginia McGuire, a hydrologist with the USGS who’s been monitoring the aquifer for more than two decades. The volume of water in the aquifer in 2015 had fallen by 273.2 million acre-feet since irrigation began in the 1940s, according to a USGS report she authored. A map in the report shows red blotches spread across Texas, Oklahoma, and Colorado, revealing stark declines in the amount of water infusing the soil. Water levels in some places are less than half of what they were a century ago, McGuire says.
“If that trend doesn’t change, at some point there’s going to have to be a reckoning,” she says.
So much irrigation is taking place on the Great Plains and in other global agricultural zones that the added water is actually cooling regional temperatures. In a 2020 paper in Nature Communications, Thiery and his colleagues compared average temperatures in heavily irrigated regions to those in the rest of the world. “We found that irrigation has a pretty pronounced cooling effect,” he says. Regions that were irrigated warmed on average by 0.8 C (1.5 F) less on hot days than the rest of the world, they found. But the cooling effect of large-scale irrigation is ultimately unsustainable.
“We are putting massive pressure on our groundwater resources by irrigating,” Thiery says. “At some point you will reach the point at which there is no more water coming from the wells.”
Water managers and farmers are already making changes to reduce water use, such as irrigating just half of their fields, or using multiple smaller wells to increase water yields from parched groundwater reserves, according to McGuire. But depleted aquifers take a long time to recharge, especially in areas like the southern Plains, where the water table is far below the surface. Meanwhile, dry years continue to stress the aquifer. During the three-year period between 2011 and 2013, the aquifer lost nearly as much water as it did between 1980 and 1995.
In 2012, says Cook, “the system was resilient enough to deal with a single year of really bad drought in the central U.S. Now, if that 2012 drought had lasted three, four, or five years, would our system have been able to handle that? That I don’t know.”
Eastern Colorado farmer Jay Sneller watches the mowing of his drought-ravaged corn crop during the drought of 2012. JOHN MOORE / GETTY IMAGES
A key reason for the resilience of U.S. agriculture is the government’s ability to provide aid to farmers when times are tough, Cook says. But climate change is affecting the entire world, with hotter, drier conditions predicted to increase in regions — such as South Asia and East Africa — that may have little ability to cope with more extreme weather. In the Indian state of Punjab, where more than 80 percent of the land is used for agriculture, water tables are dropping quickly. A 2019 heatwave in India saw temperatures climb above 120 F, while water shortages led to violent clashes.
A European drought has also strained groundwater resources across much of the continent. Data from NASA’s GRACE-FO satellite from June 2020 revealed dangerously dry soils in Germany, Poland, the Czech Republic, Ukraine, and parts of Russia. Similarly, a record-setting drought in Australia from 2017-2019 battered farmers, with extreme heat also sweeping across the country. Even if nations — particularly developing nations — adopt more sustainable irrigation and agricultural practices, a rapidly changing climate means they could still face crop failures that imperil food supplies.
The Dust Bowl is a uniquely American touchstone, a story of hardship and eventual triumph that has come to define both our country’s historical narrative and physical reality. But in a world where climate conditions grow steadily more extreme, that unparalleled disaster could become far more common.
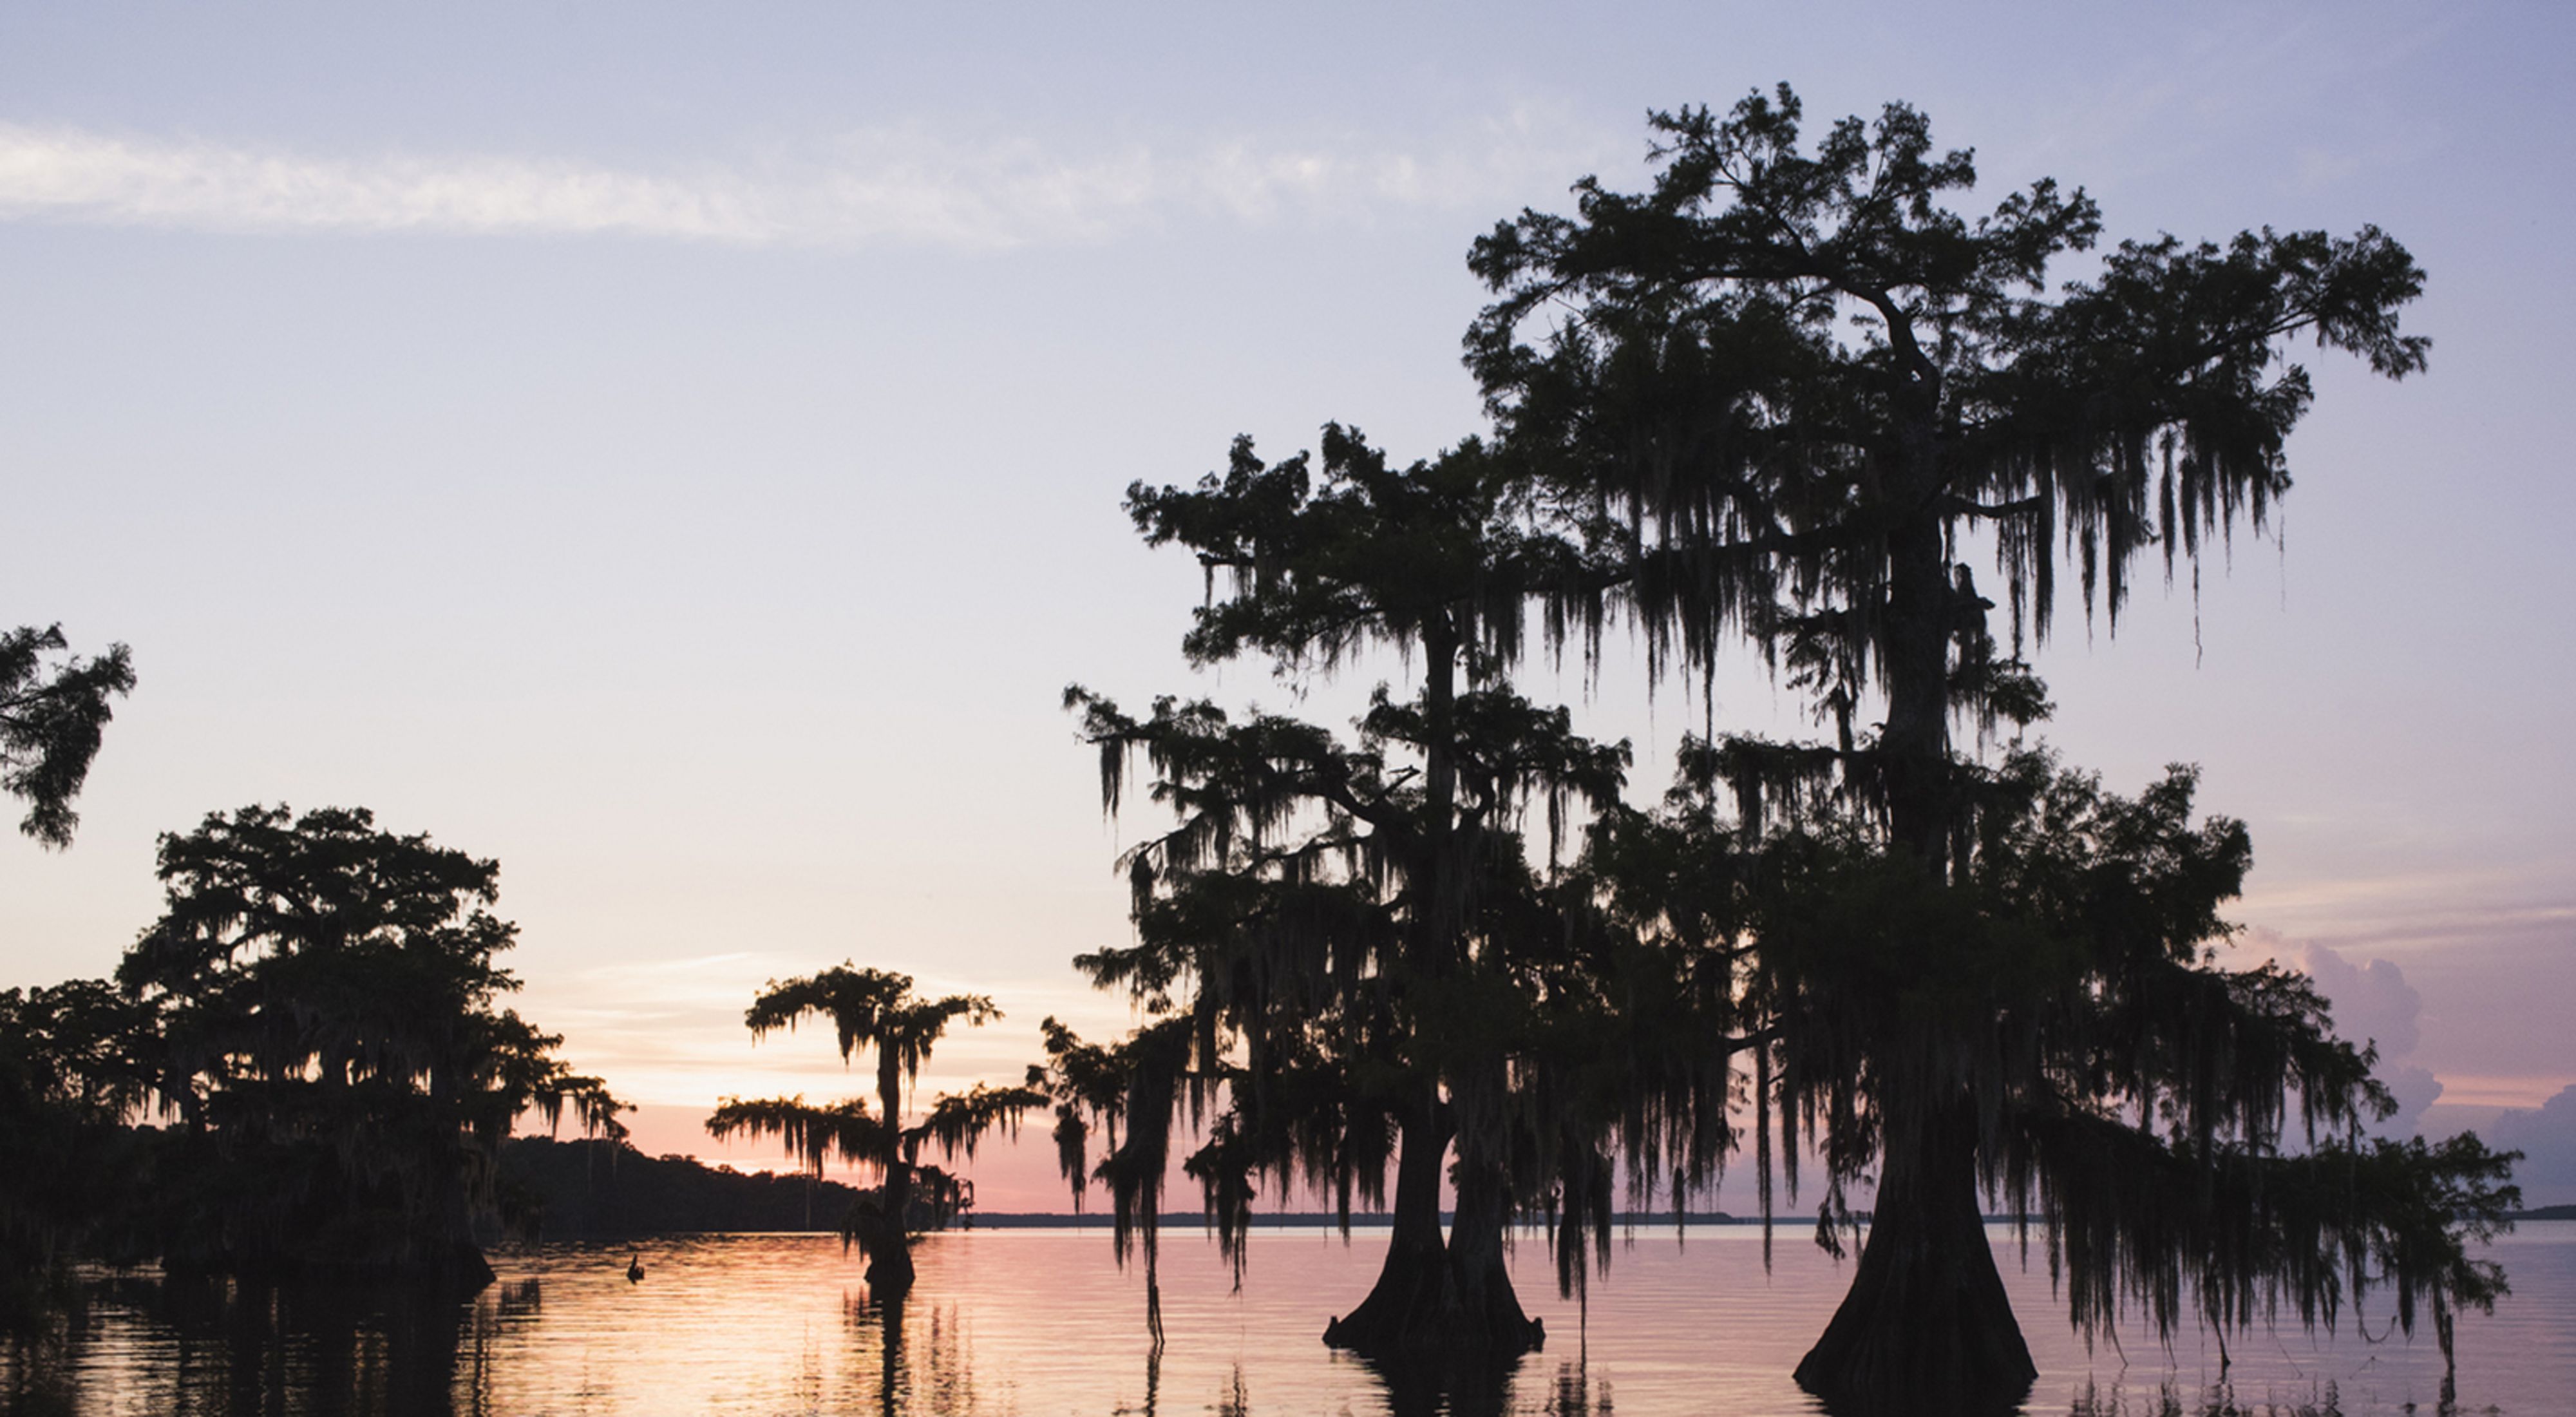
Lousiana Gulf Marsh. Photo credit: The Nature Conservancy
From The Nature Conservancy (Tom Jennings and Ciaran Clayton):
After numerous last-minute delays and attempted derailments, the United Nations Climate Change Conference COP26 finally concluded this afternoon in Glasgow, UK. As COP President Alok Sharma’s gavel fell on the closing session, The Nature Conservancy’s Director of International Climate Policy, John Verdieck, commented:
“Six years ago, the world came together in Paris to declare a shared intent to keep global warming below +2°C, and – if possible – to restrict temperature rise to +1.5°C. The plaudits for this historic agreement were justified at the time – but building that framework was just the start. Despite the various pledges and initiatives revealed in Glasgow, it’s still unclear whether the +1.5°C goal is now within reach.
“At heart, the COP process is a goal-setting mechanism – and in this respect, there’s reason to remain optimistic. Major announcements from multinational coalitions delivered significant promises of methane reduction; actions to reduce or eliminate deforestation; provide critical financial support for the most vulnerable countries; and, perhaps most surprisingly, increased collaboration between the world’s two leading emitters, China and the United States.
“Analysis of these latest commitments by the respected Climate Action Tracker (CAT) and International Energy Agency (IEA) project that the fresh pledges made over the past fortnight have the potential to reduce global warming by 0.5°C – a significant stride toward the +1.5°C target.
“The Glasgow Climate Pact represents the first time the world has formally agreed that tackling fossil fuel subsidies is a goal worth pursuing, and that the +1.5°C goal should be a Northstar for the global community moving forward. These philosophical shifts also represent is a major step towards driving the decarbonization of global economies and accelerating the clean energy transition.
“Perhaps the best news out of Glasgow was the focus and attention paid to the role that nature – and the rights of Indigenous communities whose lands play host to so much of the world’s remaining wildlife habitat – can play in addressing the interconnected climate and biodiversity emergencies. Nature was on the agenda at COP26 like never before. Unlocking the potential of forests, farms, and wetlands to deliver up to a third of the emissions reductions needed by 2030 must be prioritized.
“So, despite suggestions to the contrary, I believe we can leave COP26 with some hope still intact. Major economies like China, the E.U, and the U.S. are beginning to show serious climate ambition and – crucially – the finance to back it up. But still too few have turned ambitious rhetoric into tangible actions. It is imperative, as we look towards COP27 in Egypt and the threats facing its African neighbors, that on-the-ground implementation of proven climate strategies accelerates this year. As UN Secretary-General Antonio Guterres put it, we have now reached “code red for humanity.” There is no more time to waste.
“For all the celebrations at the time, in policy circles we understood that the Paris Agreement only ever provided a scaffolding of sorts – a frame around which to build a safer, more prosperous and lower-carbon planet for our children and our grandchildren. Progress on laying the foundations for the future has been made. Now, the hard work toward accelerating commitments into real-world action must begin.”
La Niña conditions reign in the tropical Pacific, with about a 90% chance of remaining through the winter. Get your popcorn and settle down on the couch—it’s time for this month’s ENSO cinema.
Romantic comedy
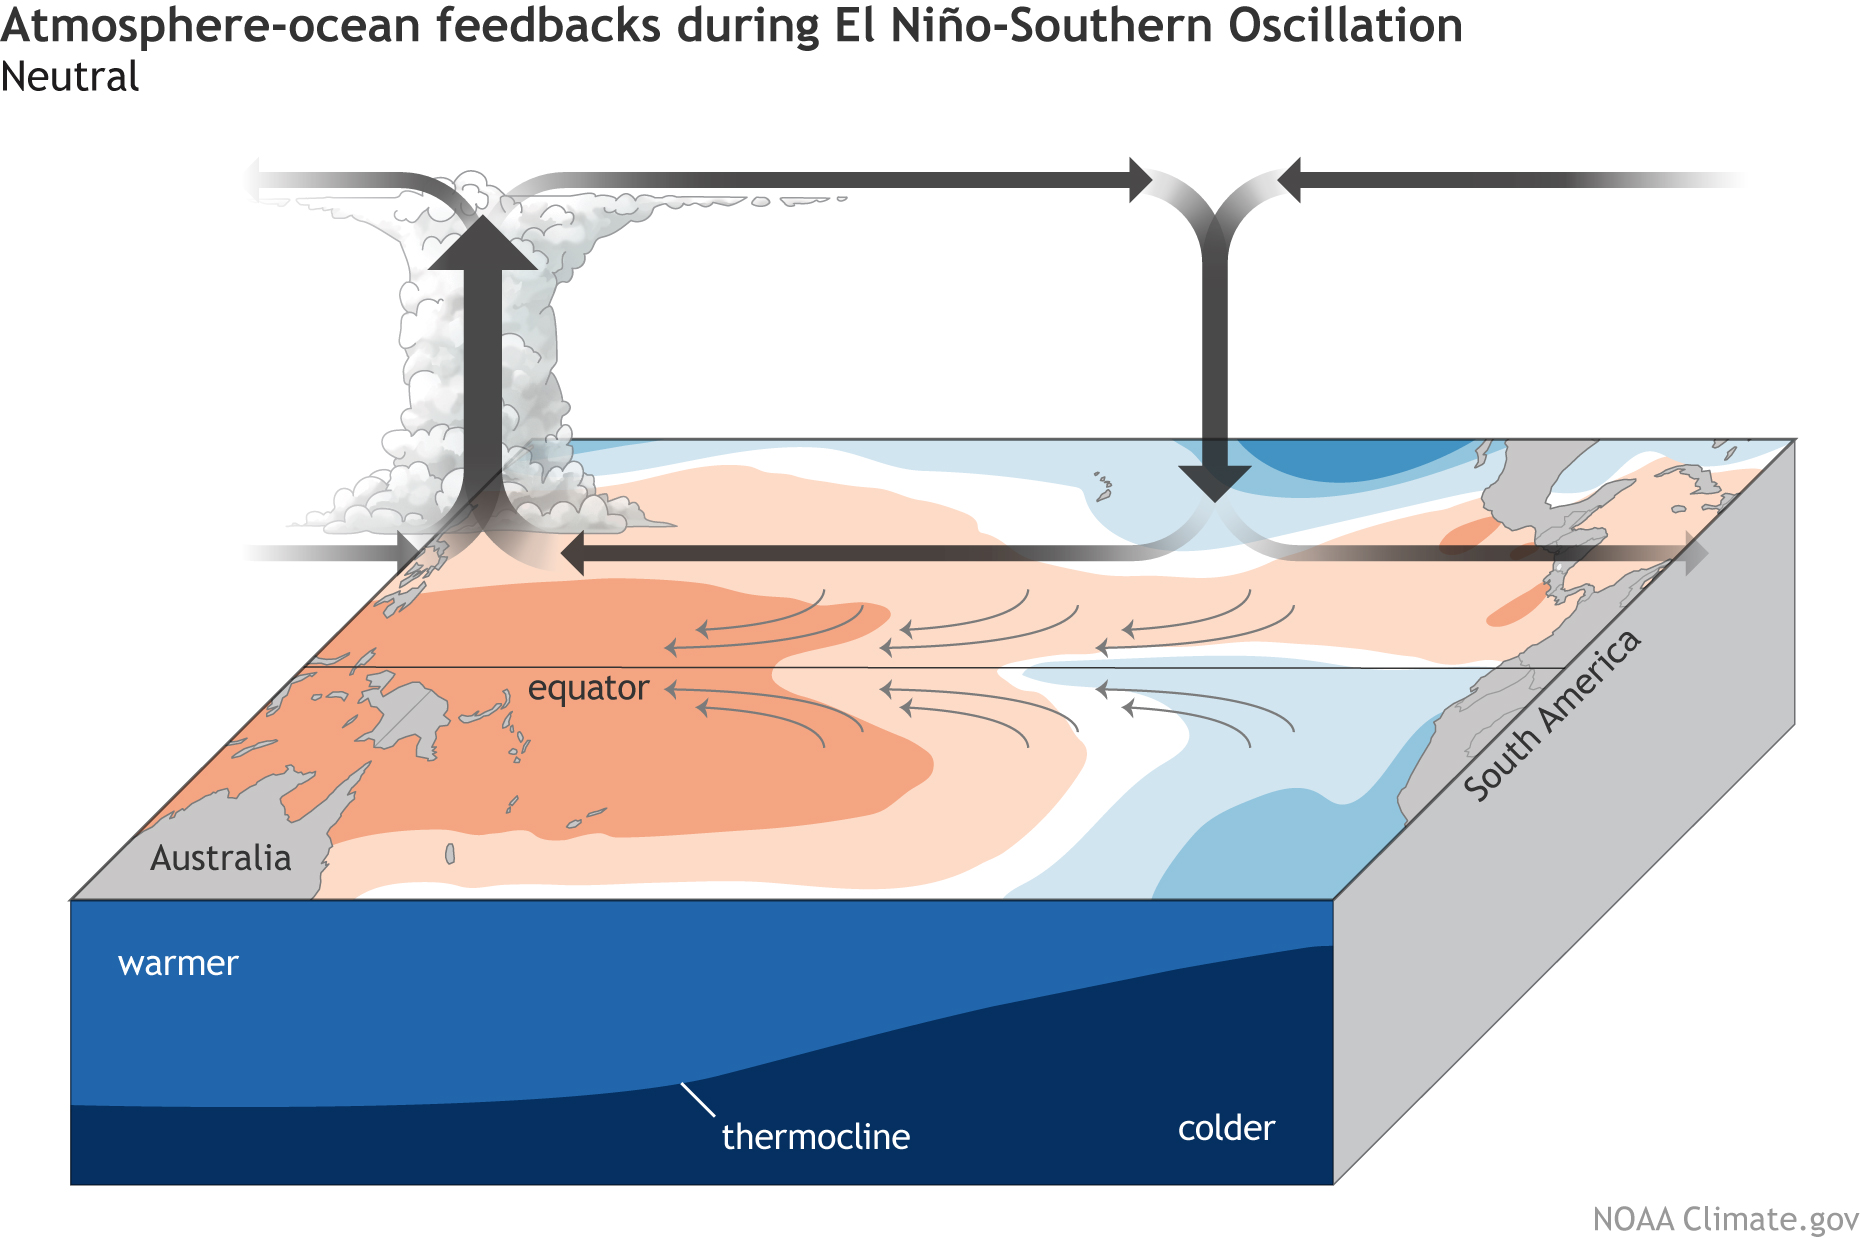
A recurring theme here at the ENSO Blog is the on-again, off-again relationship between the tropical Pacific Ocean and atmosphere. ENSO (short for El Niño-Southern Oscillation, the entire El Niño–La Niña system) relies on the interaction between the ocean and the atmosphere. Average conditions in the tropical Pacific (see the drawing below) consist of relatively warmer surface water in the west and relatively cooler surface in the east. Air rises over the warm western water, forming clouds and rain; winds blow west-to-east high up in the atmosphere; air descends over the cooler east; winds blow east-to-west near the surface. Dun-dun-dunnn… it’s the Walker circulation!
ENSO-Neutral or average conditions across the tropical Pacific Ocean. Climate.gov schematic by Emily Eng and inspired by NOAA PMEL.
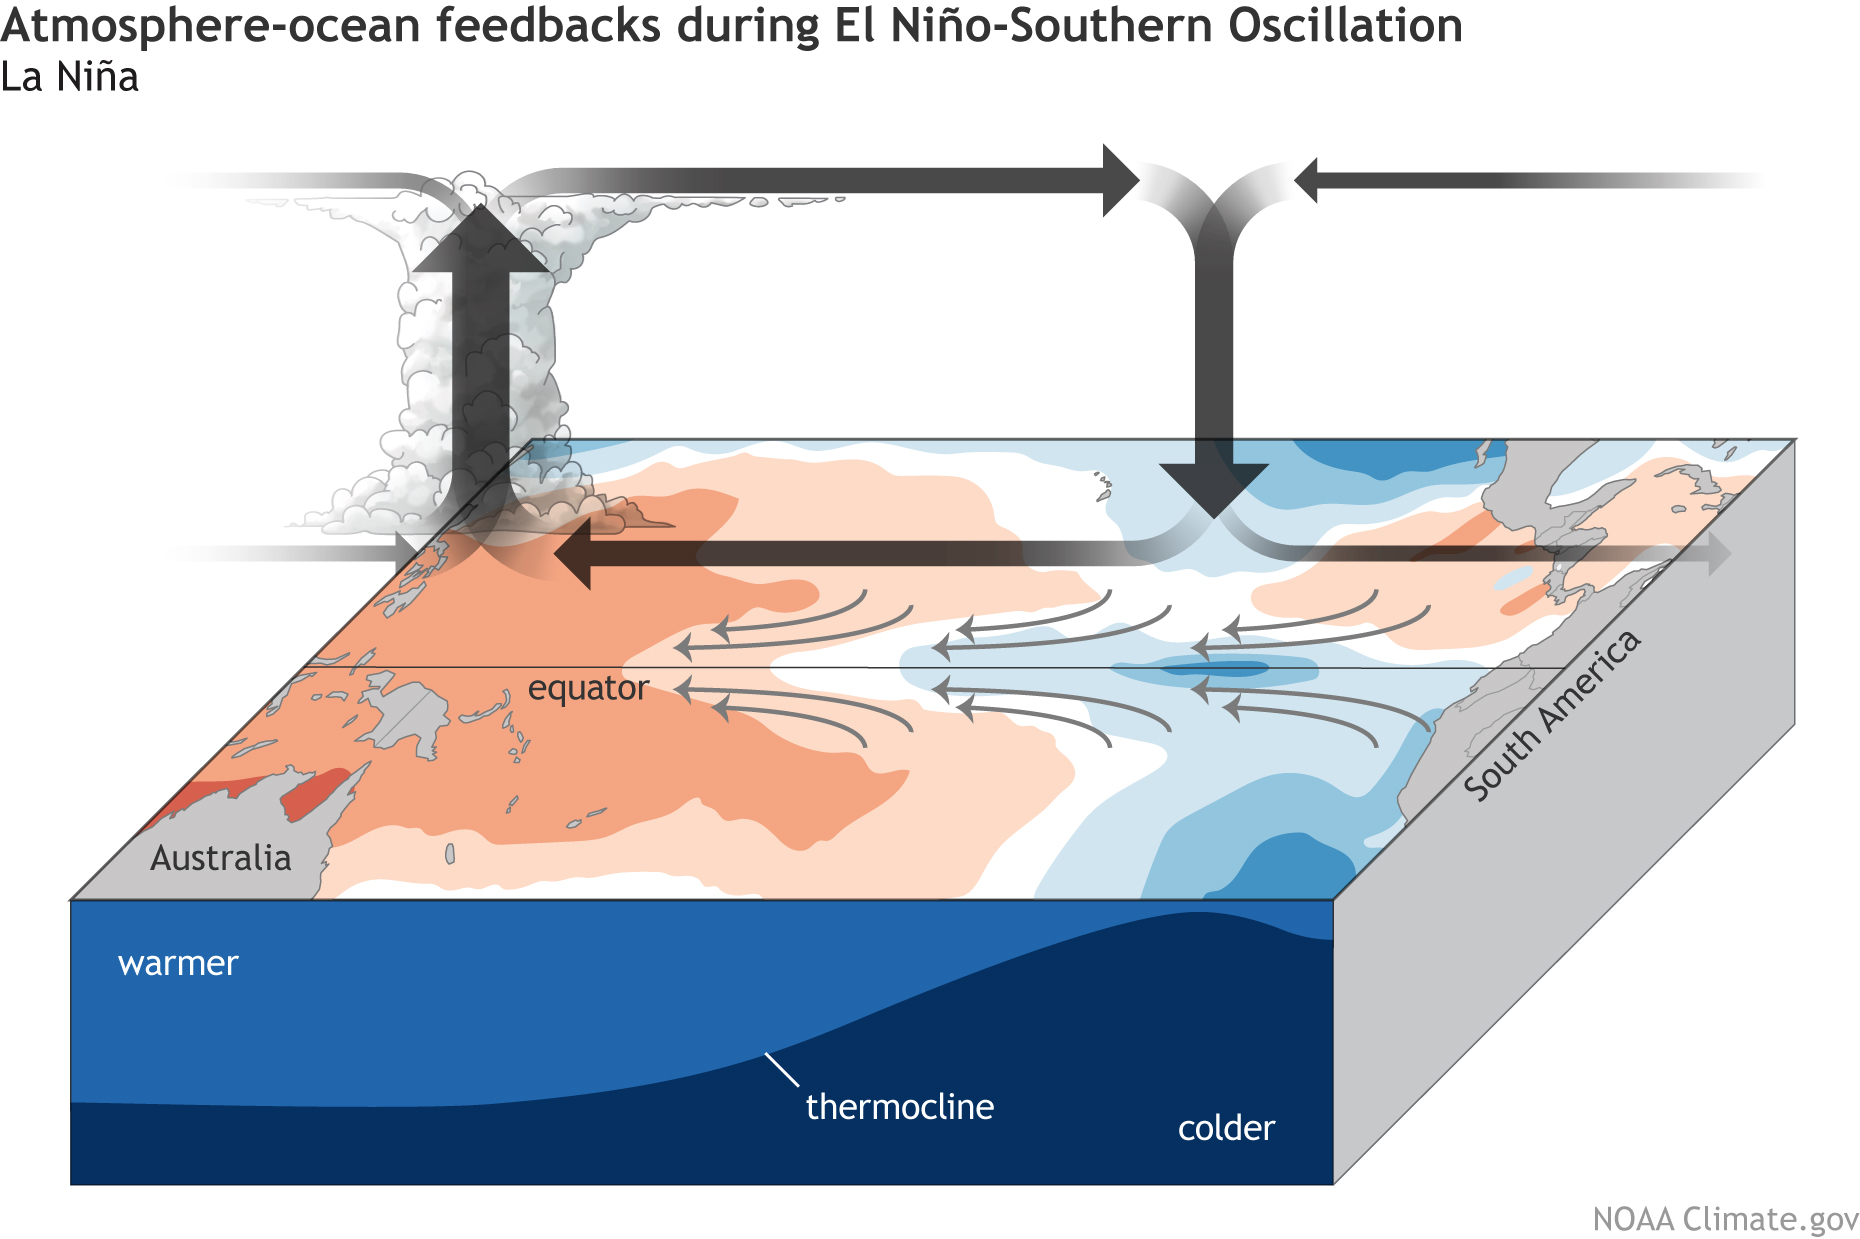
When La Niña is present, the atmosphere takes one look at that characteristic cooler-than-average central/eastern Pacific ocean surface and gets all amped up. I haven’t yet seen the Walker circulation standing outside La Niña’s house holding a boombox aloft, but ENSO is always full of surprises.
La Niña feedbacks between the ocean and atmosphere. Climate.gov schematic by Emily Eng and inspired by NOAA PMEL.
The resulting stronger near-surface winds (the trade winds) reinforce the cooler ocean surface—the feedback mechanism fundamental to ENSO. For more on how this works, and a delectable bread analogy, check out Michelle’s Oscar-winning post.
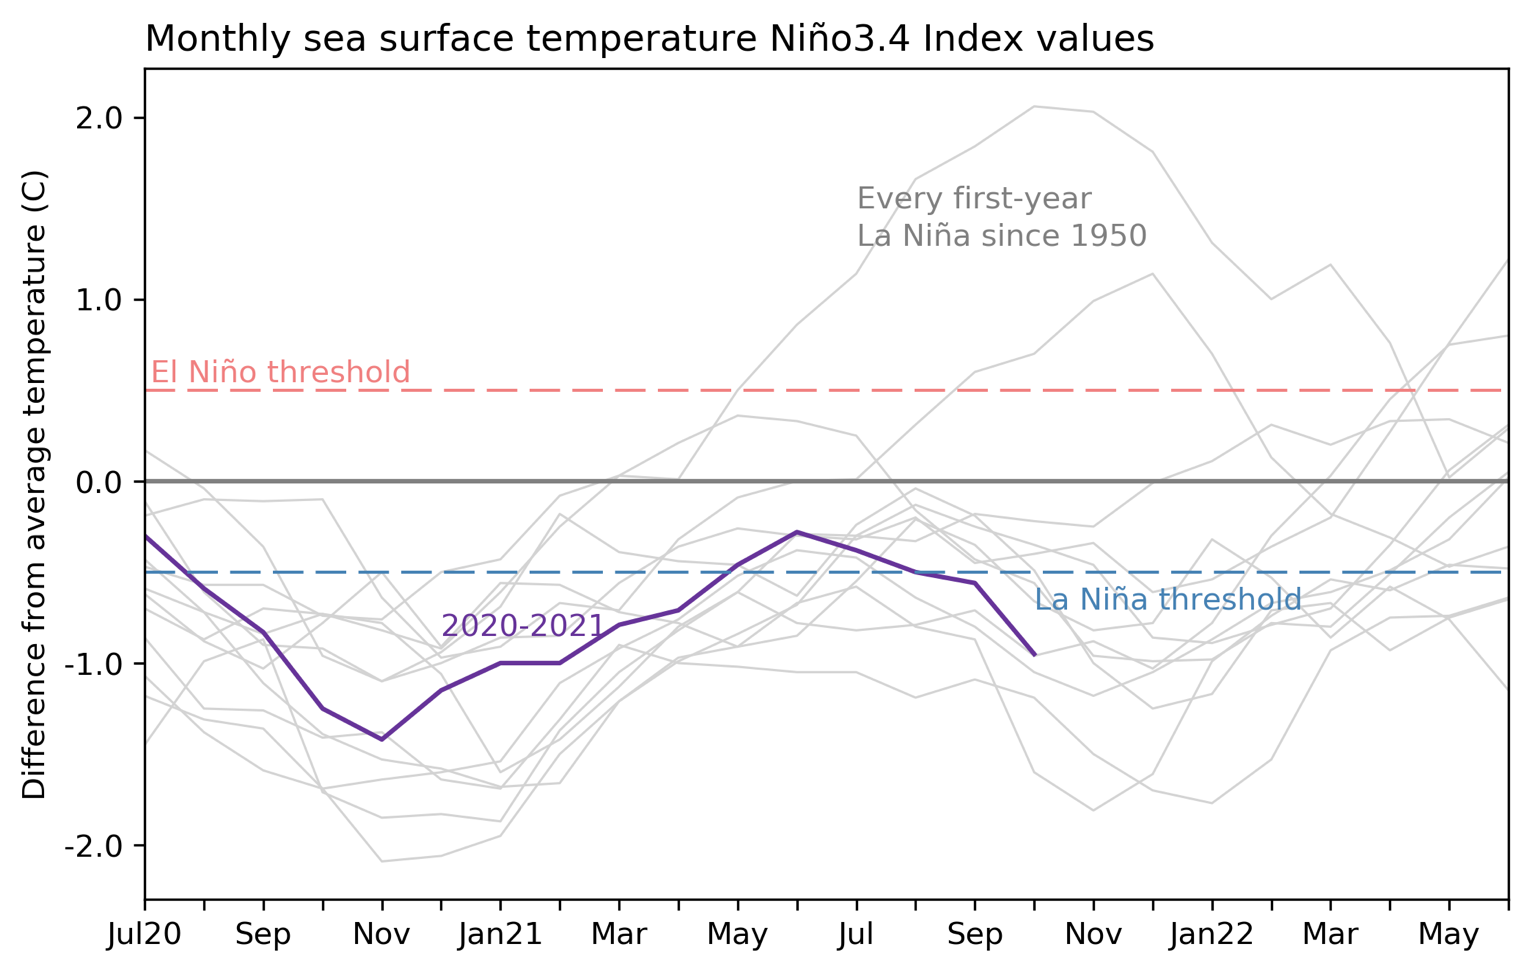
All this is to say that La Niña conditions, after developing in September, continued in October. The surface of the ocean in the Niño-3.4 region, our primary ENSO-monitoring region, was about 1.0˚ C (1.8˚ F) cooler than the long-term average, via the ERSSTv5, our primary ENSO-monitoring dataset.
This graph shows monthly sea surface temperature anomalies (difference from average) in the Niño 3.4 region of the tropical Pacific for 2020-21 (purple line) and all other years (gray lines) starting from first-year La Niña winters since 1950. While two La Niña winters in a row is pretty common, three-peats have occurred only twice. Climate.gov graph based on ERSSTv5 temperature data.
October featured La Niña’s atmospheric conditions—more rain than average over Indonesia, less over the central Pacific, and stronger-than-average trade winds over portions of the equatorial Pacific. As in all relationships, there are ups and downs, and these patterns were a bit weaker in October than September. However, these two crazy kids are working on their relationship already, with a batch of stronger trade winds currently taking over much of the tropical Pacific.
Action-adventure
“Predictable” isn’t high praise for a movie plot, but certainly is when it comes to the weather and climate. La Niña-related changes to global atmospheric circulation, including its effect on the jet stream, give us a picture of the average weather conditions expected over the next several months. To be clear, we mean the overall average, not that every day will exhibit the same weather!
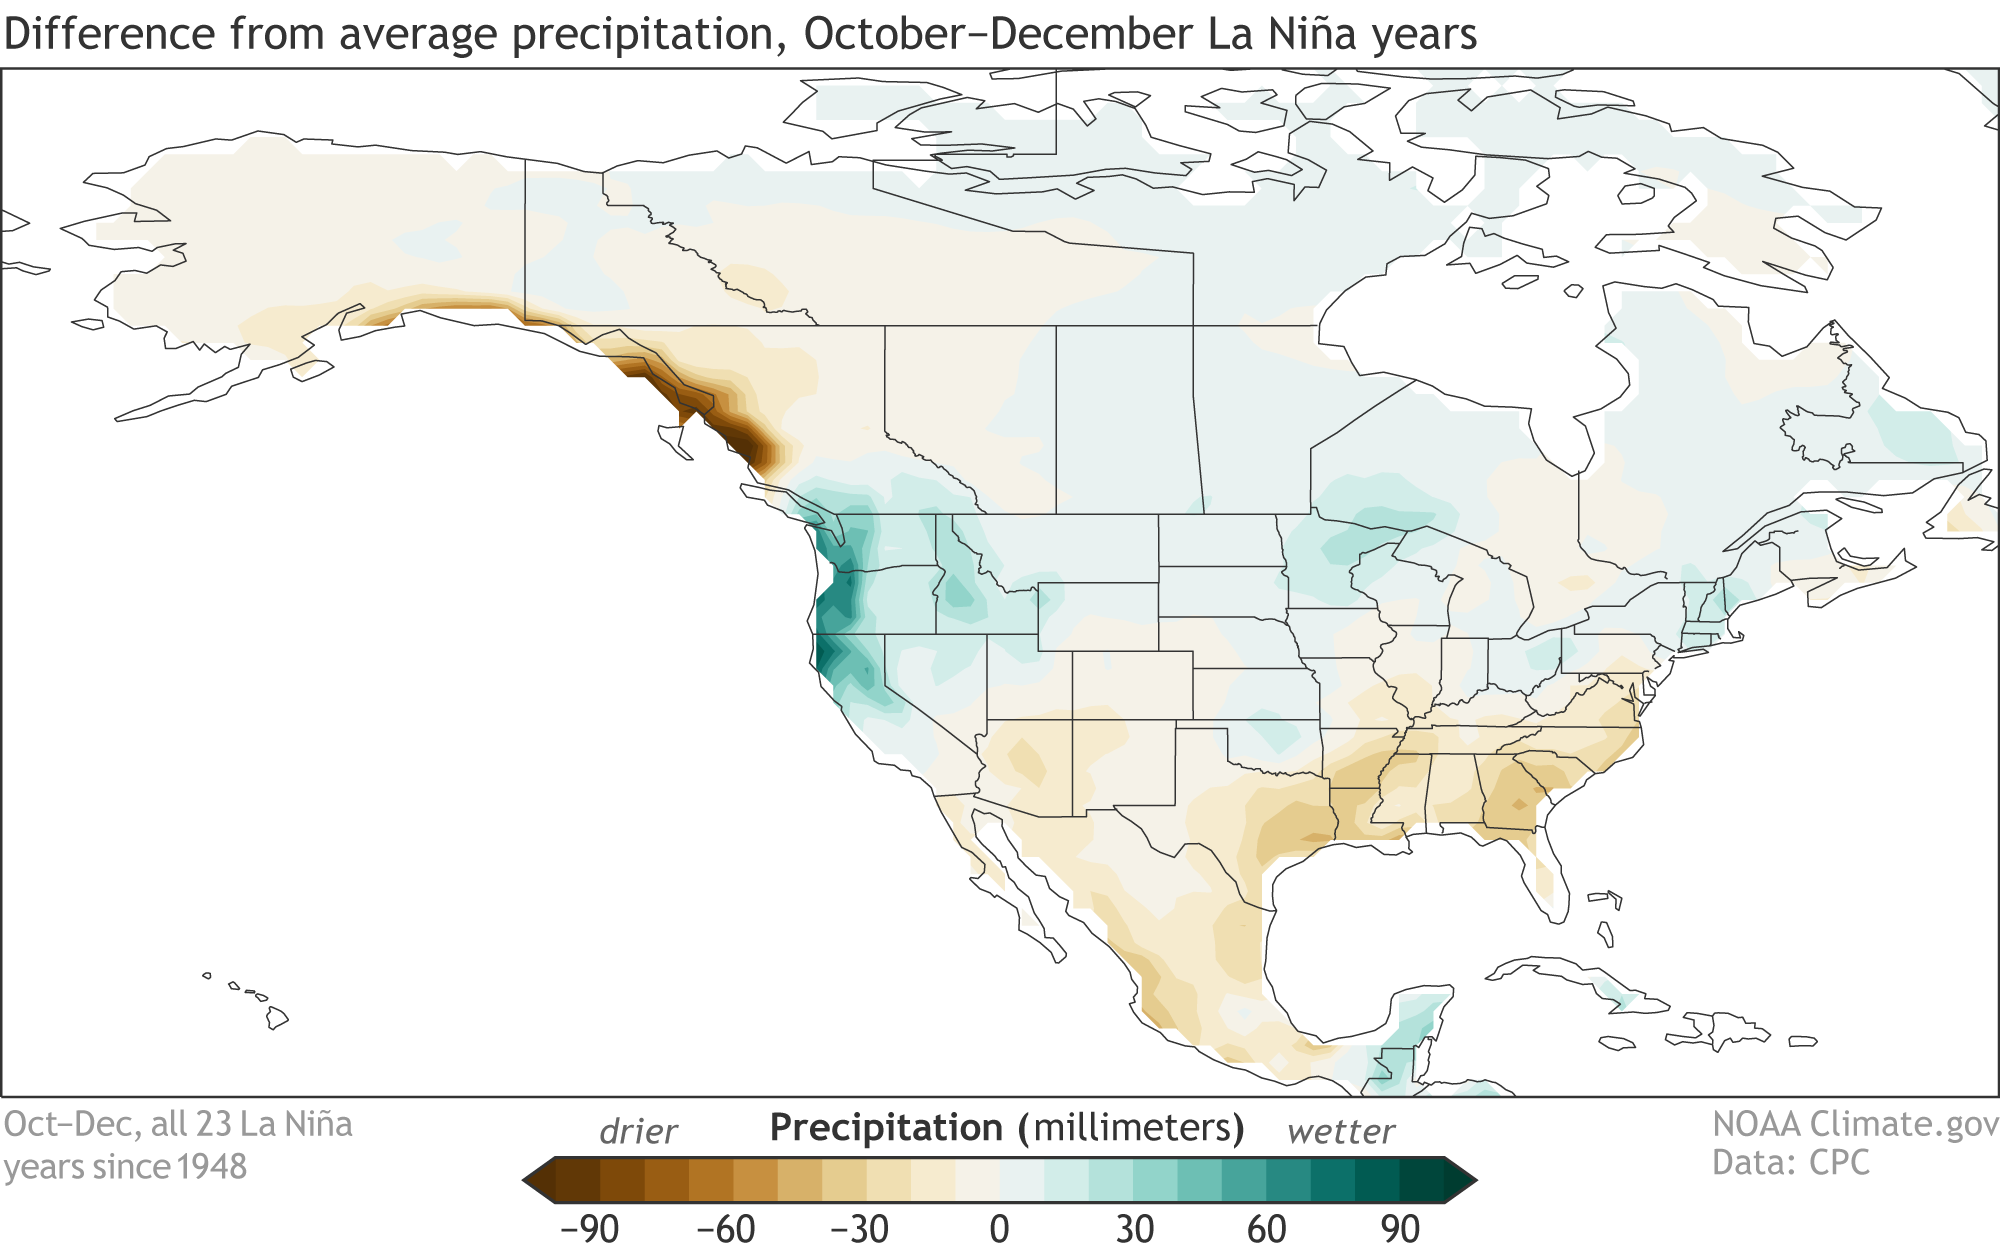
There have been 23 La Niña events (24 counting this one!) in our historical record, which goes back to 1948. If we look at the October–December rainfall patterns during those La Niñas, we find more rain than average in northern California and the Pacific Northwest, and less than average through the Gulf coast and Southeast.
Composite of October–December precipitation during the 23 La Niña years since 1950, compared to the 1950–2020 average. Composites for other seasons and temperature are available here. Climate.gov image from CPC data.
While La Niña tends to be linked to dry conditions and drought through California and the Southwest, that pattern usually develops in December–February through the early spring. You can step through the seasons to see ENSO impacts here. The strong atmospheric river that brought so much rain and snow to northern California last month was not atypical for a La Niña autumn. Overall, the October and early November North American rainfall map looked a lot like what we might expect this time of year during La Niña.
Documentary feature
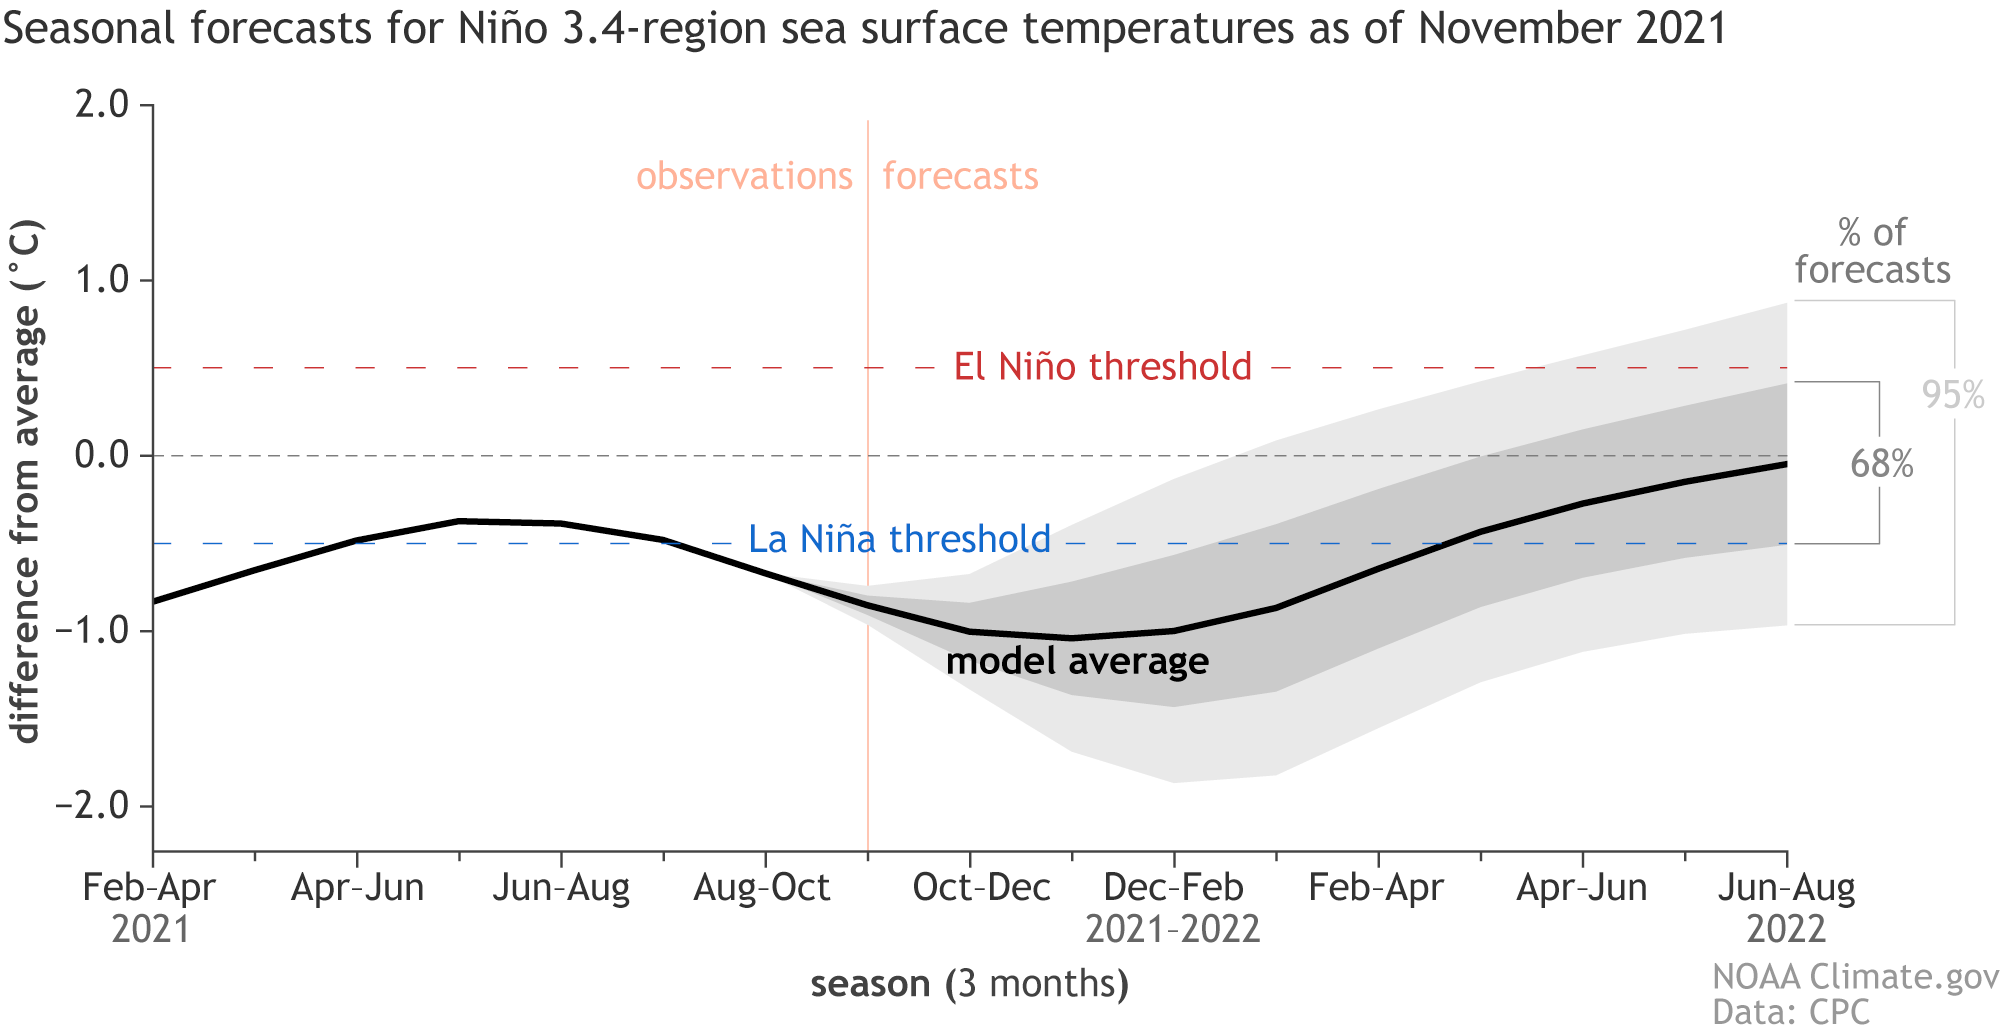
Spoiler alert! There’s about a 50% chance that La Niña will last into spring 2022 (March–May).
Climate model forecasts for the Niño3.4 temperature anomalies in late 2021 and 2022 . Average dynamical model data (black line) from the North American Multi-Model Ensemble (NMME): darker gray envelope shows the range of 68% of all model forecasts; lighter gray shows the range of 95% of all model forecasts. Most of the plume—that is, most of the model runs—stay beneath the La Niña threshold this winter. NOAA Climate.gov image from University of Miami data.
Will this La Niña, already a sequel itself, end up part of a trilogy? Three La Niña winters in a row isn’t unprecedented—that happened in 1973–1976, and 1998–2001—but it is relatively unusual. We will have a better idea by the late spring about what may happen with ENSO in 2022–2023.
Getting back to our current event, there’s about a 2-in-3 chance that this La Niña will be at least moderate in strength, meaning the peak Oceanic Niño Index (the 3-month-average Niño-3.4 anomaly) will be greater than 1.0°C cooler than average. The stronger the ENSO event, the more predictable the weather and climate impacts. More info about how we forecast the strength of an El Niño or La Niña event here.
Post-credits scene
Regardless of the critical reception, ENSO will always be bringing the drama, and your trusty ENSO bloggers will be here to watch and report!