
Click on a thumbnail graphic to view a gallery of drought data from the US Drought Monitor website.


Click the link to go to the US Drought Monitor website. Here’s an excerpt:
This Week’s Drought Summary
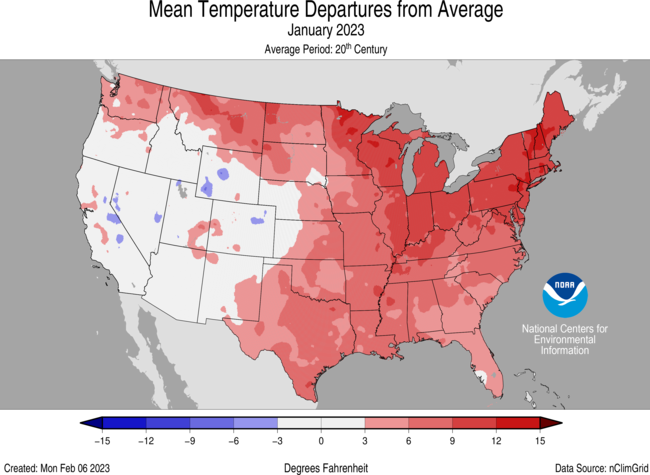
The vast majority of the country was drier than normal for the week with only areas of the southern Plains, South, and Southeast seeing precipitation that was well above normal. Dry conditions were prominent over the central and northern Plains, Midwest, Northeast and Southwest. Most of the country experienced cooler-than-normal temperatures with the greatest departure from normal over the central Rocky Mountains. Warmer-than-normal conditions were observed over the northern Rocky Mountains and in the Southeast with departures of 5-10 degrees above normal. A reassessment of conditions took place for many locations in the West to analyze the current drought intensity levels compared to the suite of indices and indicators used each week. Some adjustments were made based on this analysis and not directly related to anything that took place during the last week…
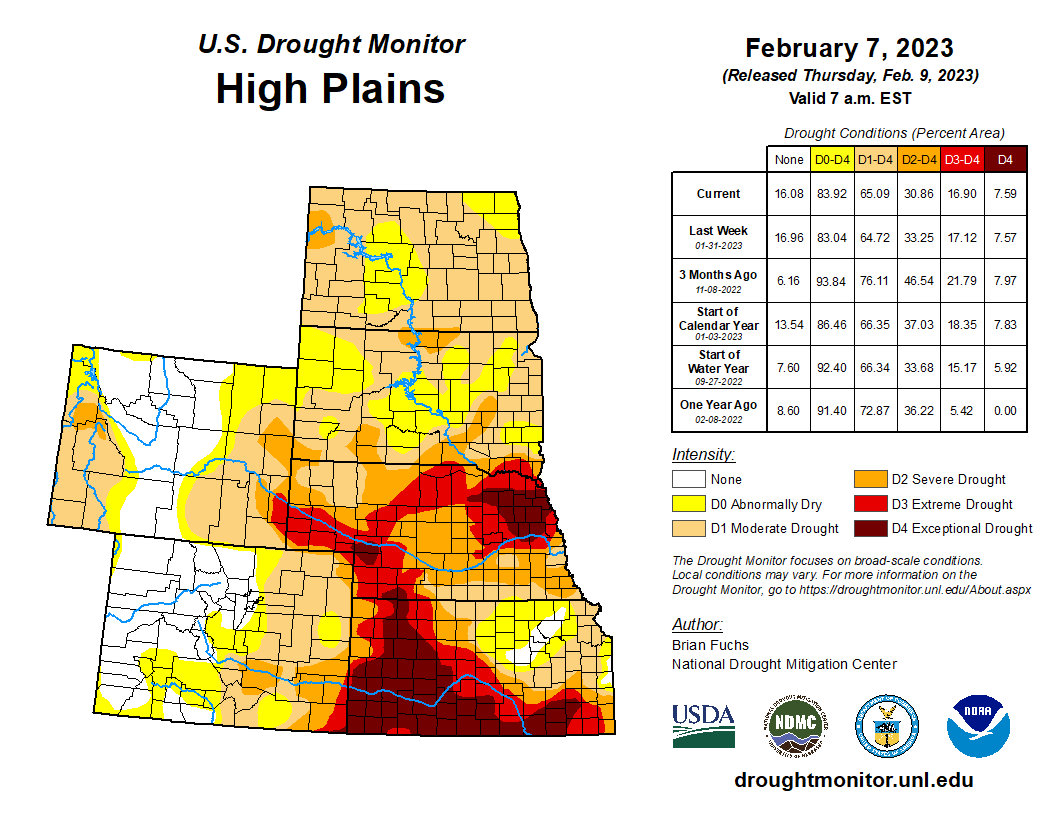
High Plains
Most of the region was dry for the week with just some light precipitation over eastern Wyoming and surrounding areas. Temperatures were cooler than normal from eastern Colorado through western Kansas and into Nebraska as well as the eastern areas of the Dakotas where temperatures were up to 5 degrees below normal. Temperatures were near normal to slightly above normal through the central to western Dakotas, eastern Wyoming and eastern Kansas. Minimal changes were made this week as only areas of southeast Wyoming improved with a reduction of severe and exceptional drought. Some improvements to severe drought were brought into western North Dakota based on reassessing the data going back a couple of years…
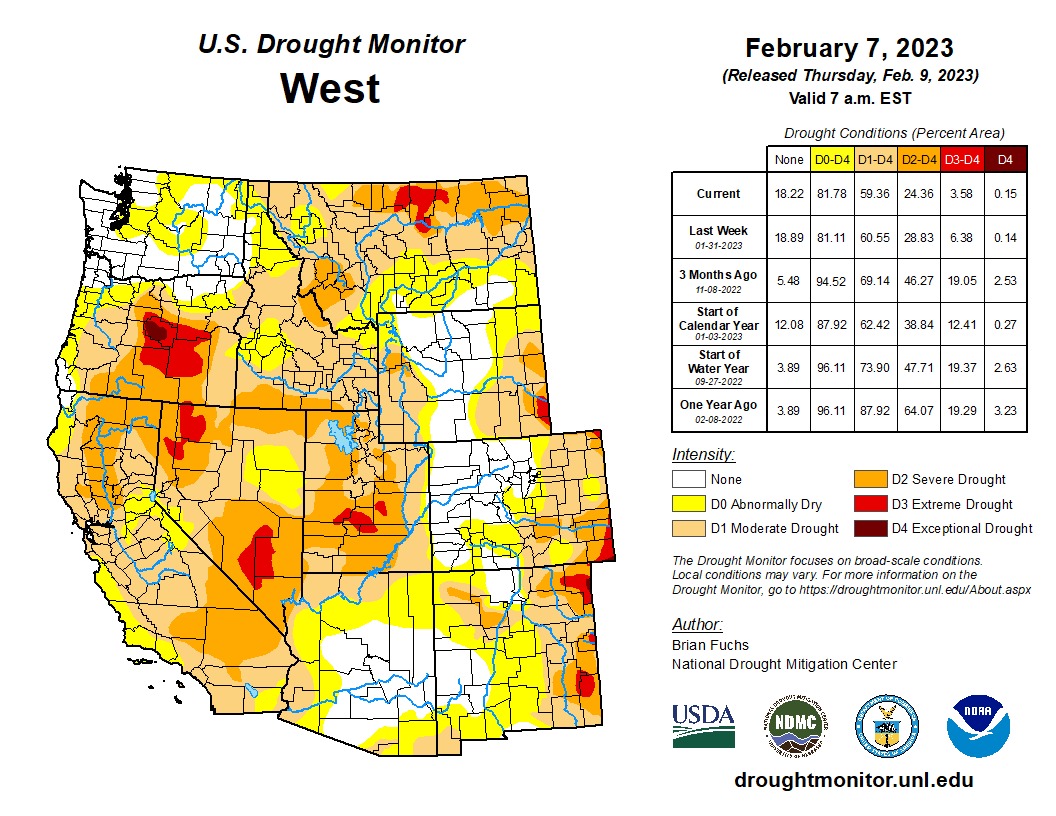
West
Most of the region had a dry week with below-normal precipitation. The exceptions were in California and Nevada with the Sierras picking up above-normal precipitation. Some coastal areas of California were at to slightly above normal from the central to northern portions of the coast. Areas of northwest Washington as well as south-central Washington into northeast Oregon also recorded above-normal precipitation. Temperatures were cooler than normal over much of the region with departures of 10-15 degrees below normal over Nevada, Utah and southern Idaho. Warmer-than-normal temperatures were observed over much of Montana with departures of 5-10 degrees above normal. With a quieter week in the West, a reassessment of drought intensity levels was made over portions of the region where data and indicators were analyzed going back to the last 3-5 years. In areas where there was not a consensus of support for the current drought intensity levels, improvements were made to better reflect where the data were pointing. For the reassessment, severe and extreme drought levels were reduced in Montana and Utah while moderate drought was improved over portions of California and Nevada. Acknowledging that some of these areas are still being impacted by long-term drought issues, the new depiction is better supported by the data. Some of these areas had minimal data support for the new drought intensity levels and this process may need to continue. Improvements were made in western Wyoming based on the short-term while degradation took place in portions of western and northern Oregon as the short-term has been especially dry…
South
Cooler-than-normal temperatures dominated the region from south Texas into Arkansas and Louisiana. Departures in south Texas were 8-10 degrees below normal. Portions of central Oklahoma as well as the panhandle regions of Oklahoma and Texas were normal to above normal and departures were only 2-4 degrees above normal. The same areas that were the warmest were also the driest as west Texas into the panhandles of Oklahoma and Texas did not receive any precipitation. The coastal areas of south Texas and into southern Louisiana were also drier than normal. Central Texas into northern Louisiana and southern Arkansas recorded the most precipitation with up to 200% of normal observed. In the Big Bend area of Texas, well above-normal precipitation was also recorded. In eastern Texas where the most precipitation took place, some improvements to abnormally dry conditions were made. With the continued warm and dry conditions over the Oklahoma panhandle, there was an expansion of extreme and exceptional drought this week with dryness going back 18-24 months. Short-term dryness over portions of west Texas allowed for the reintroduction of abnormally dry conditions. The coastal areas of southern Louisiana are being monitored for degradation…

Looking Ahead
Over the next 5-7 days, an active pattern is expected to develop over the Midwest and into the Southeast, with the greatest precipitation anticipated over Arkansas and southern Missouri as well as throughout the Southeast into the Mid-Atlantic. Temperatures are expected to be above normal over much of the northern Plains into the Midwest and Northeast, with departures of up to 10 degrees above normal. Cooler-than-normal temperatures are anticipated over the West with departures of 8-10 degrees below normal over Utah, Nevada and western Wyoming.
The 6–10 day outlooks show that temperatures are expected to be above normal over the eastern half of the country with the greatest probabilities of above-normal temperatures over the Northeast. Temperatures are anticipated to be cooler than normal over much of the West and Alaska. Much of the country is showing a high probability of above-normal precipitation, with the best chances of above-normal precipitation anticipated to be over the upper Midwest and Great Lakes region. There are above-normal chances of below-normal precipitation over northern Alaska and the Big Bend region of Texas…
Just for grins here’s a gallery of early February US Drought Monitor maps for the past few years.
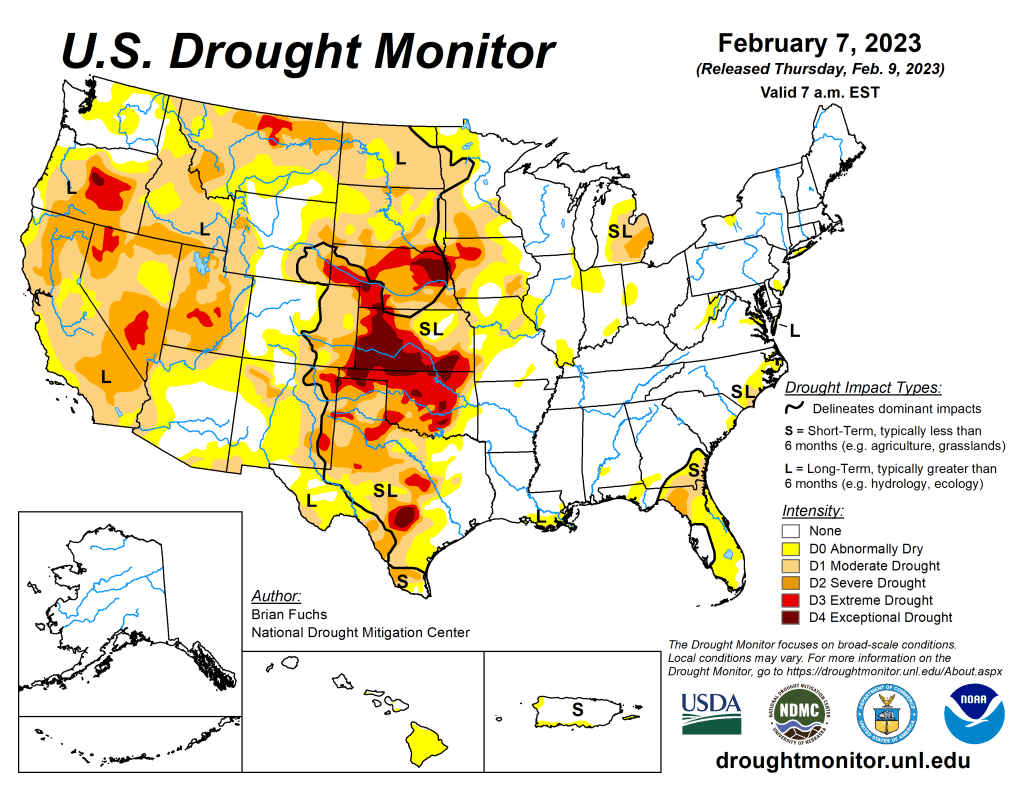
US Drought Monitor map February 7, 2023. 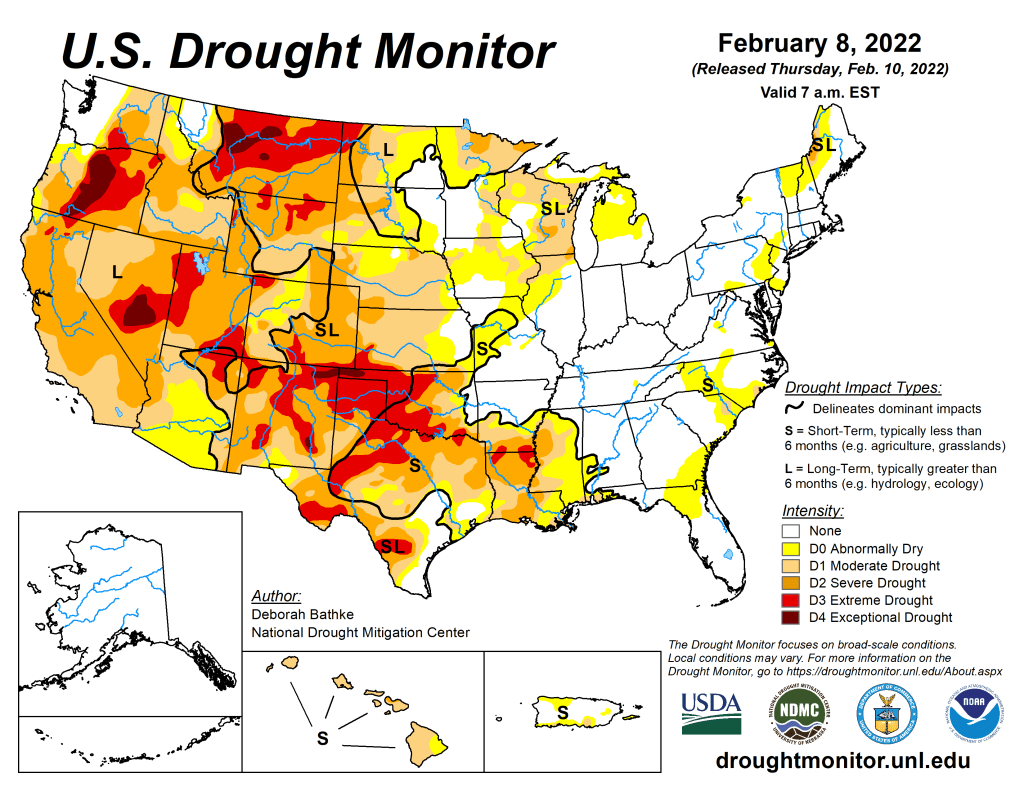
US Drought Monitor map February 8, 2022. 
US Drought Monitor February 2, 2021. 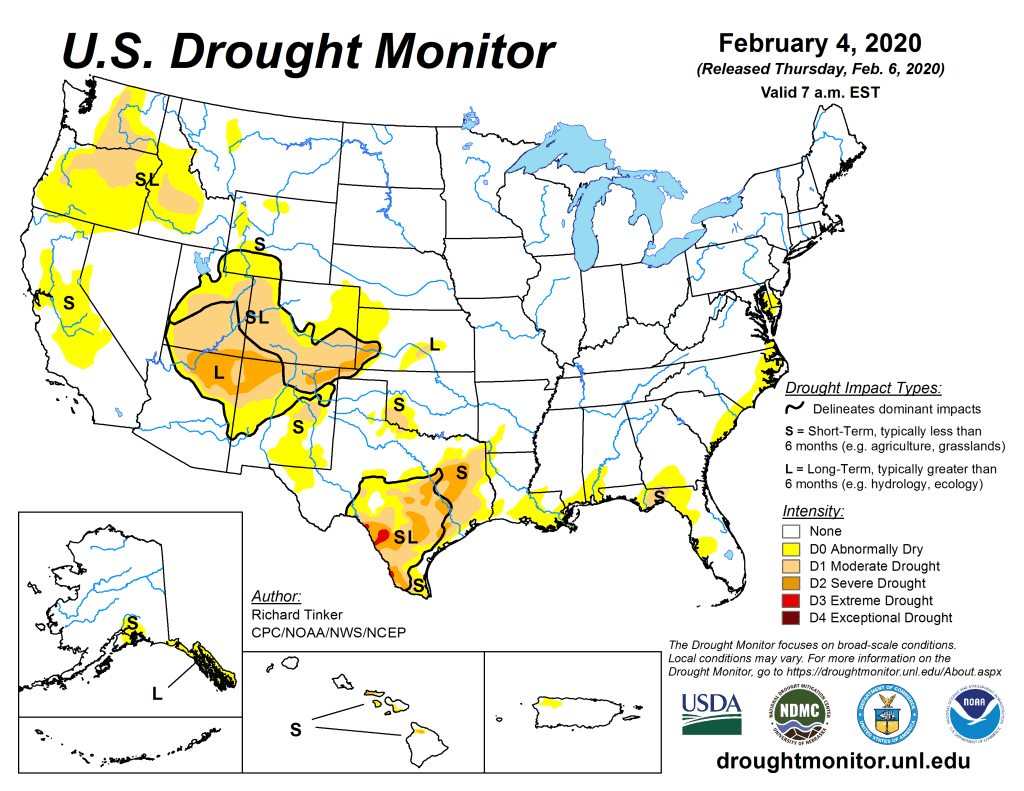
US Drought Monitor February 4, 2020. 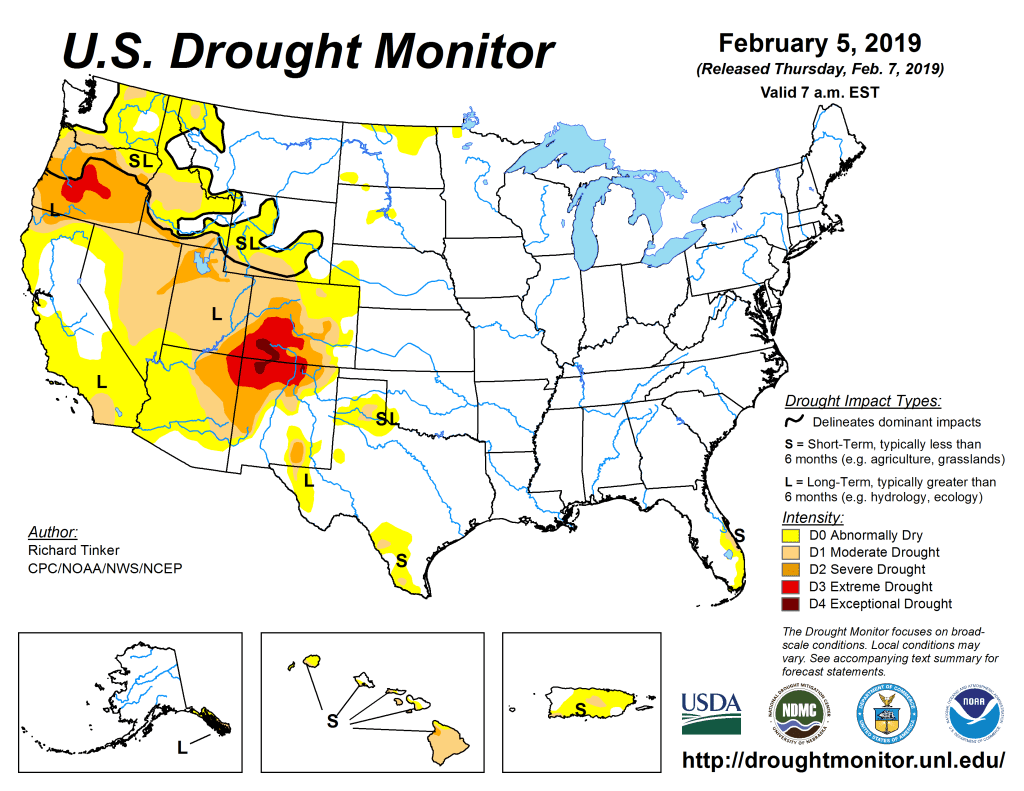
US Drought Monitor February 5, 2019. 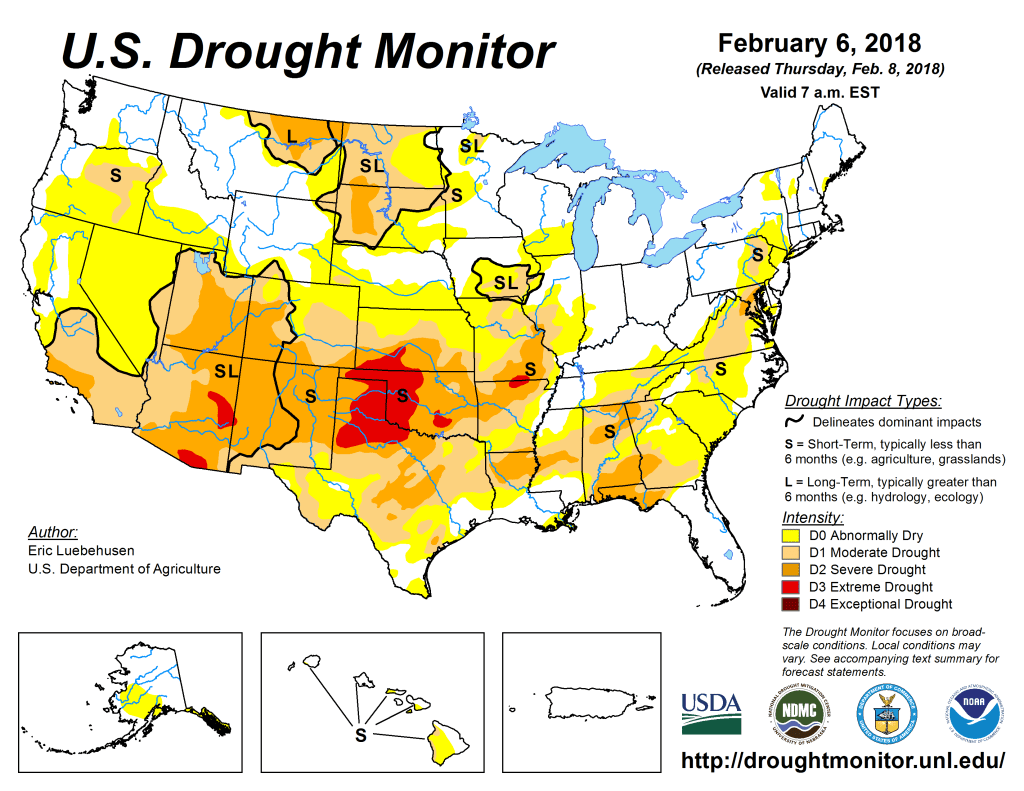
US Drought Monitor February 6, 2018. 
US Drought Monitor February 7, 2017. 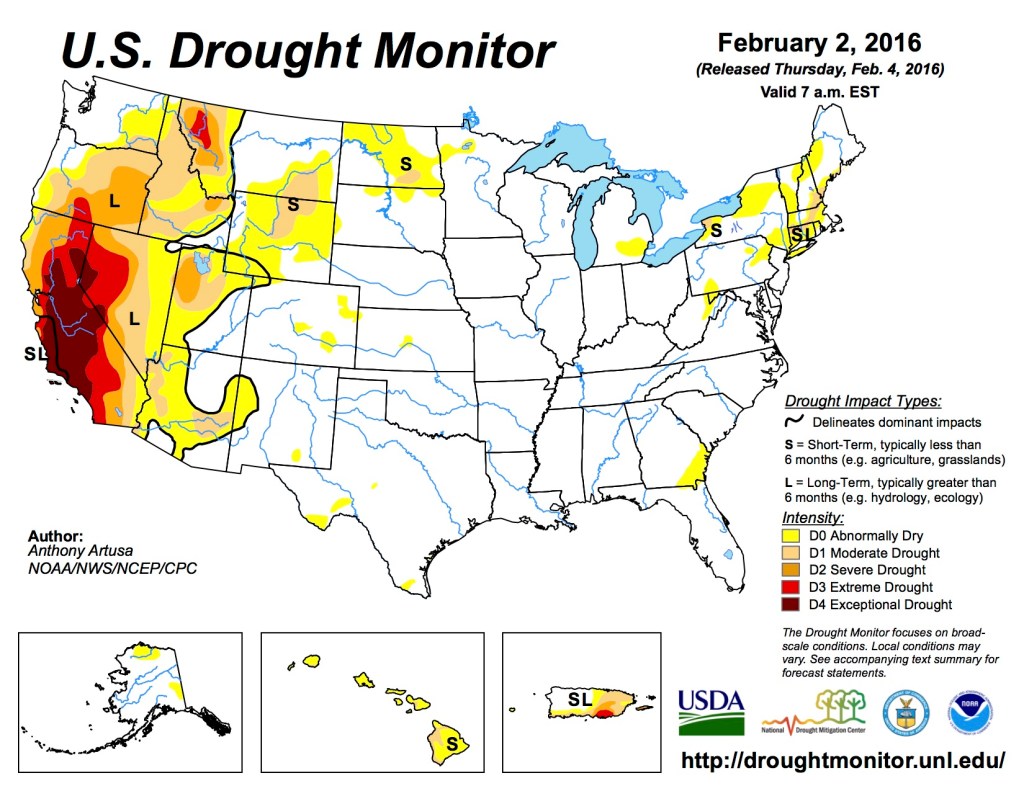
US Drought Monitor February 2, 2016 
US Drought Monitor February 3, 2015 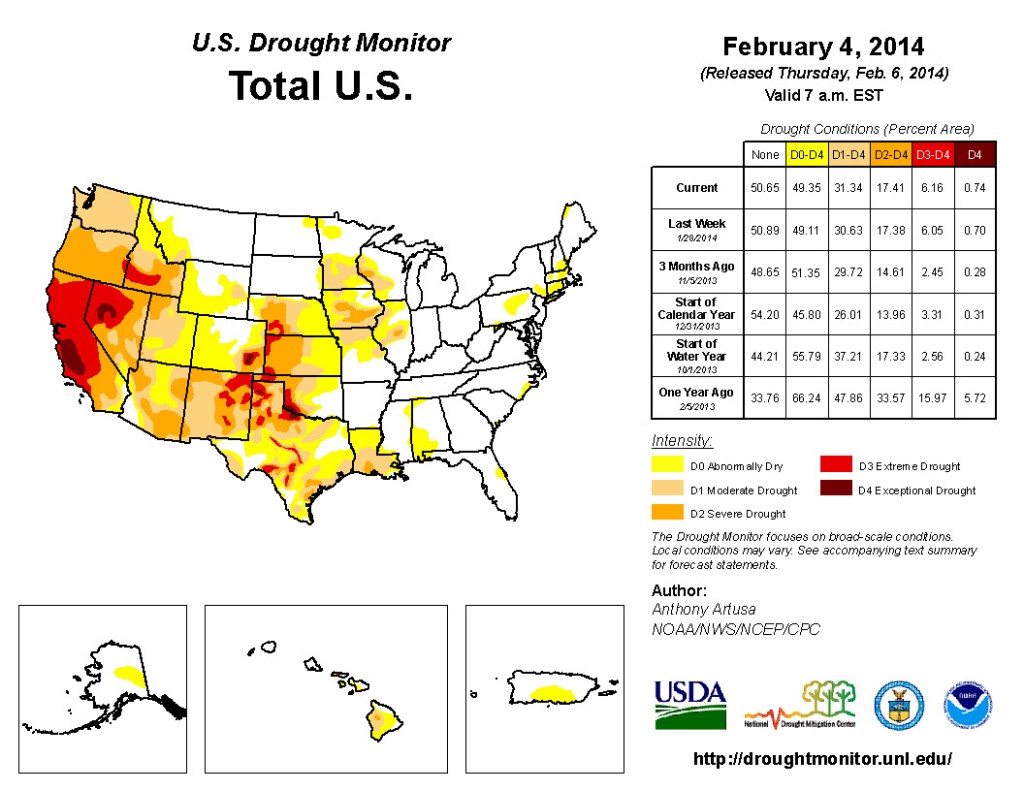
US Drought Monitor February 4, 2014 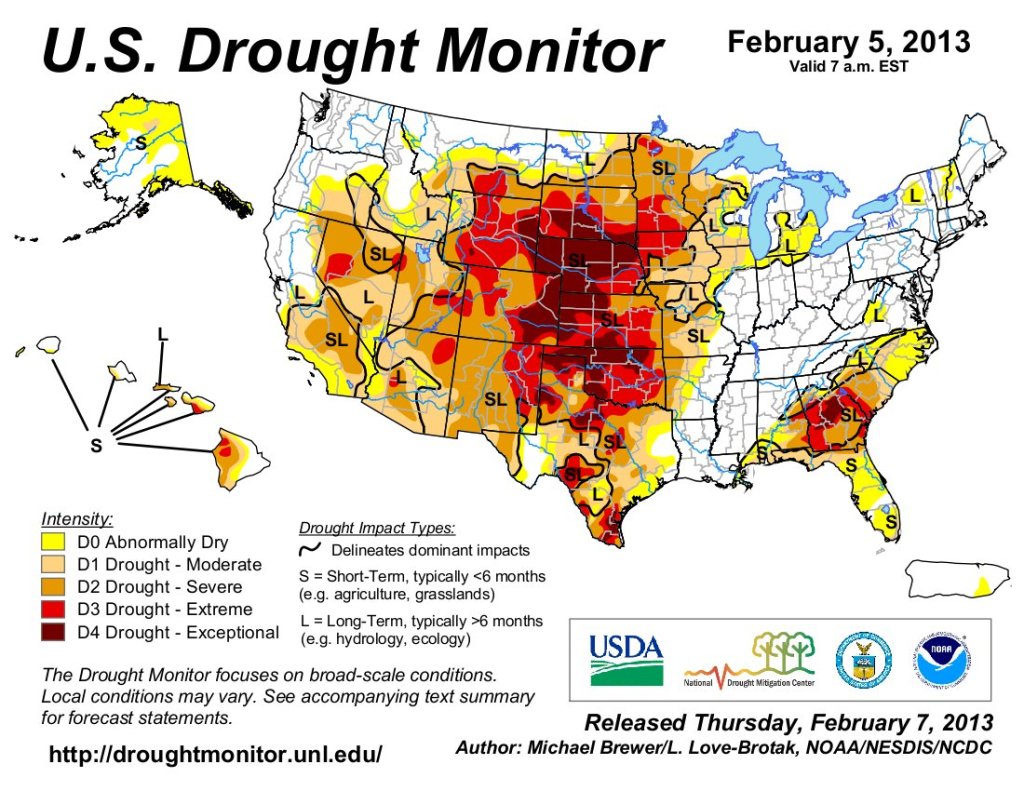
US Drought Monitor February 5, 2013 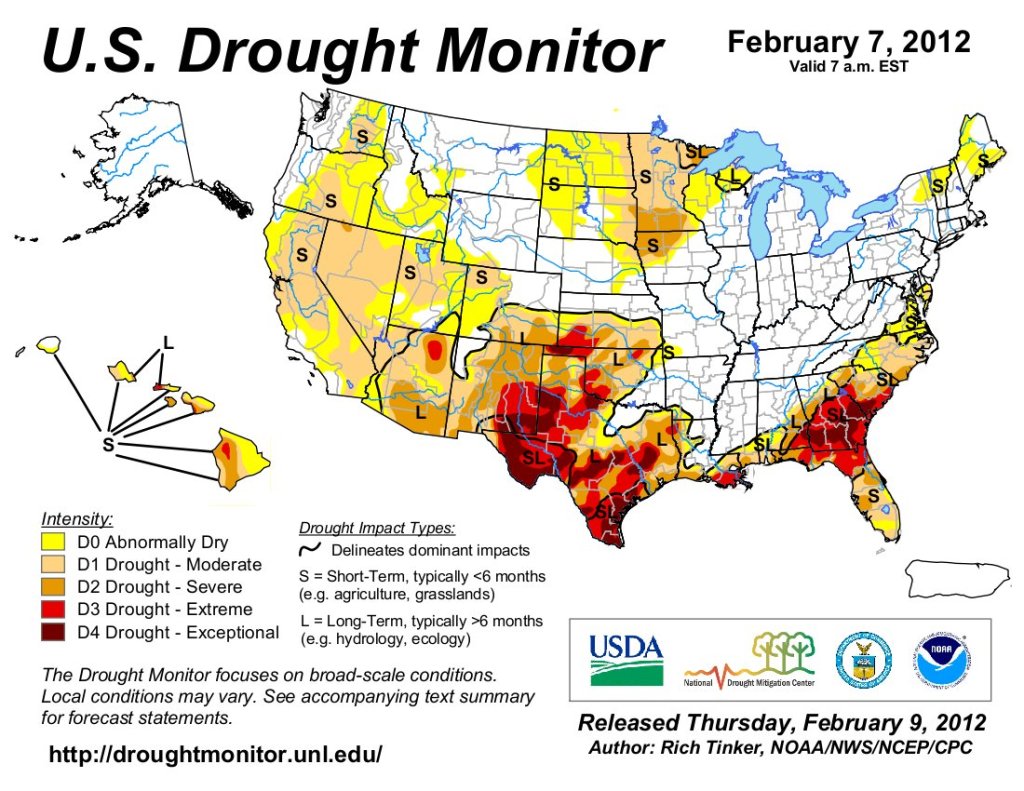
US Drought Monitor February 7, 2012 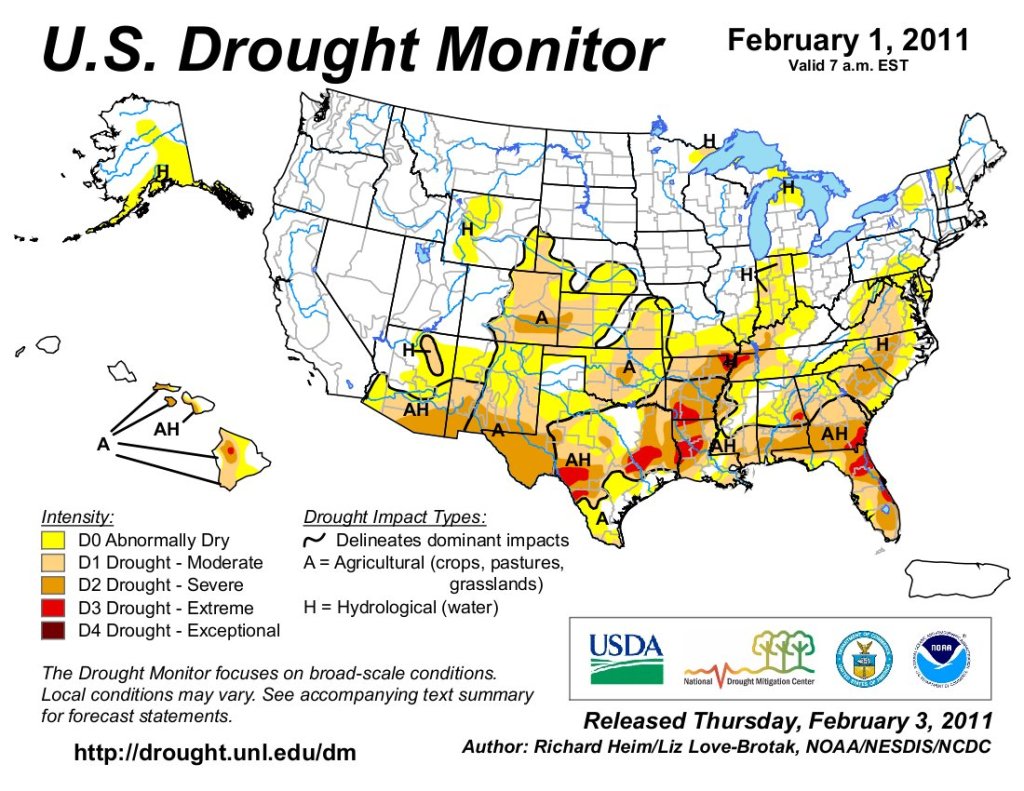
US Drought Monitor February 1, 2011 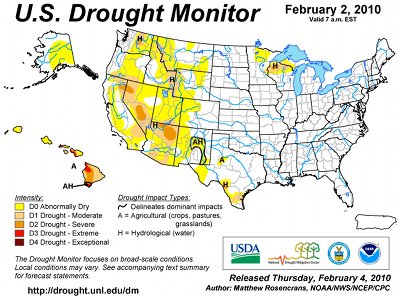
US Drought Monitor February 1, 2010


