Re-engineering #GlenCanyonDam — The Land Desk

Glen Canyon Dam during high flow experimental release about a decade ago. These occasional releases are just about the only time the river outlet works (where water is gushing out above) operate. Photo credit: Jonathan P. Thompson/The Land Desk

Click the link to read the article on The Land Desk website (Jonathan P. Thompson):

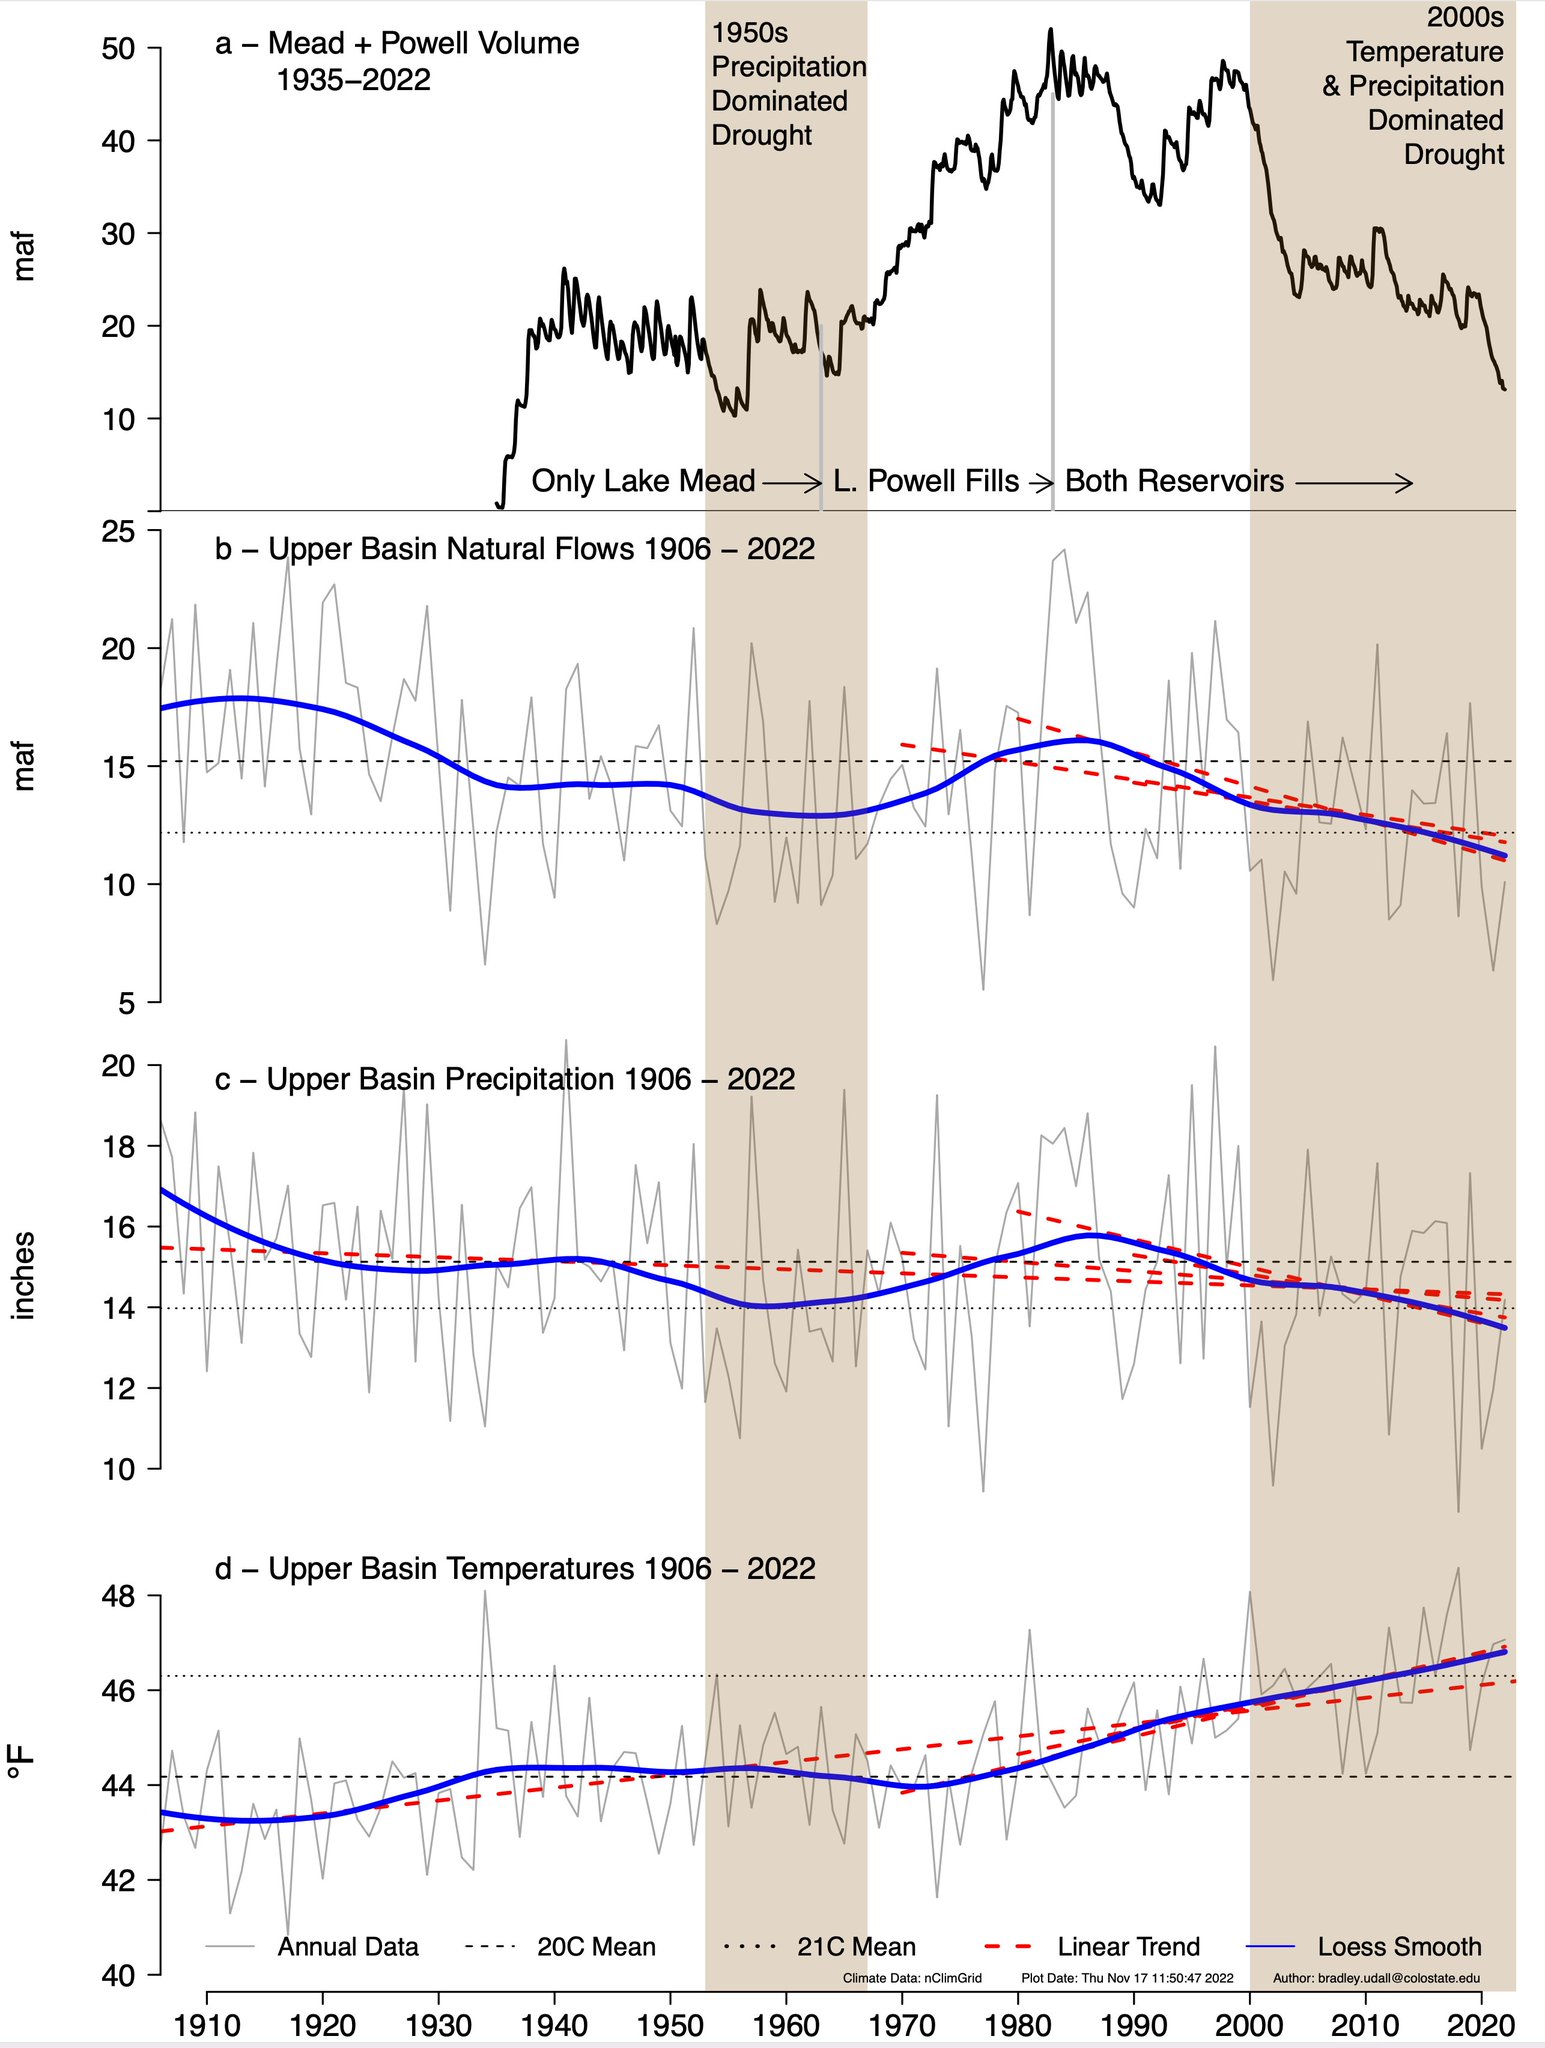
For the last two years or so, federal Bureau of Reclamation officials have been fretting publicly about what might happen to Glen Canyon Dam as water levels continue to drop. Currently the surface of Lake Powell is perilously close to the penstocks, or the water intakes that lead to the hydroelectricity turbines. Once those are rendered inoperable, the only way to get water through the dam is via the river outlet works, or ROW.

The back of Glen Canyon Dam circa 1964, not long after the reservoir had begun filling up. Here the water level is above dead pool, meaning water can be released via the river outlets, but it is below minimum power pool, so water cannot yet enter the penstocks to generate electricity. Bureau of Reclamation photo.

That could be a problem. First off, there are no turbines on the ROWs, so there would be no hydropower generation. And as Tanya Trujillo, the Interior Department’s assistant secretary for water and science, noted last year, the dam was not built “to operate solely through the outworks for an extended period of time.” Bad things could happen, like cavitation of the ROWs, which could then threaten the very integrity of the dam. Something needs to be done.

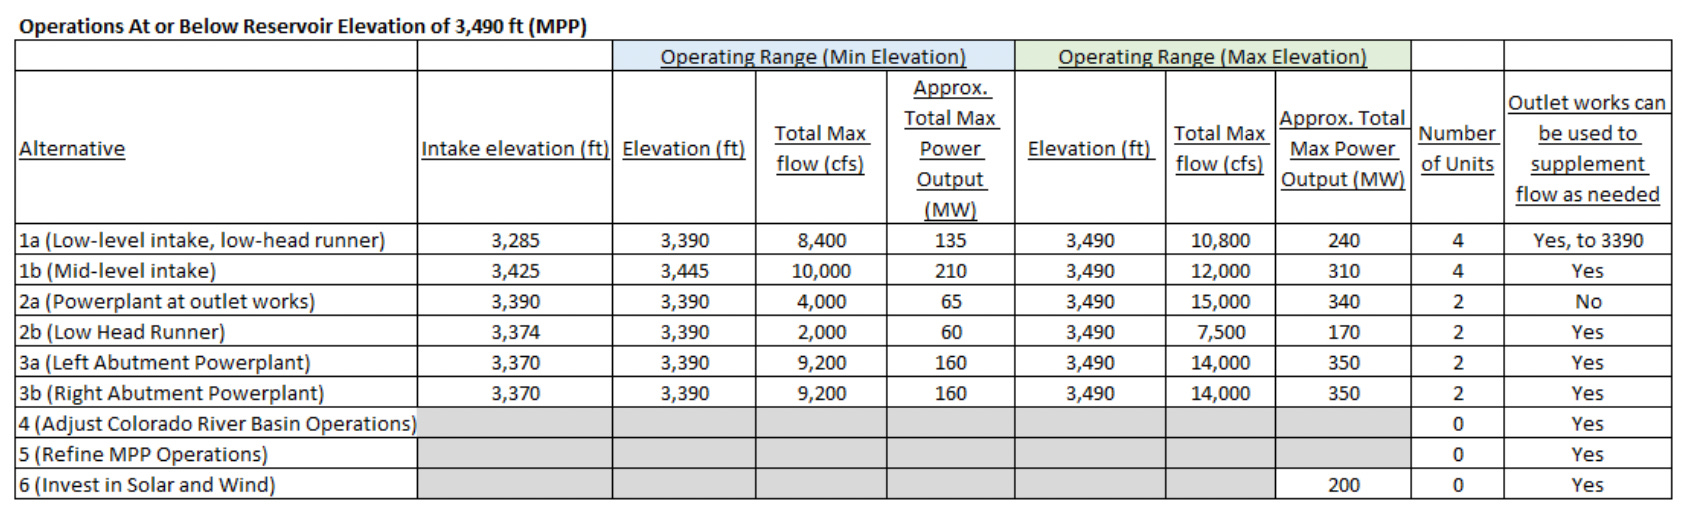
Last week, the Bureau for the first time made public six alternatives the agency is considering:

  • Construct new, low- (3,245 feet) or mid-level (3,445 feet) power intakes through the dam that would utilize existing turbines, essentially lowering the “minimum power pool” level as much as 200 feet.
  • Connect the current ROWs — at 3,374 feet — to the current turbines or install new turbines so hydropower generation could continue until the lake reached “dead pool,” or falls below the ROWs (at which point no water can be released and the Grand Canyon will dry up).
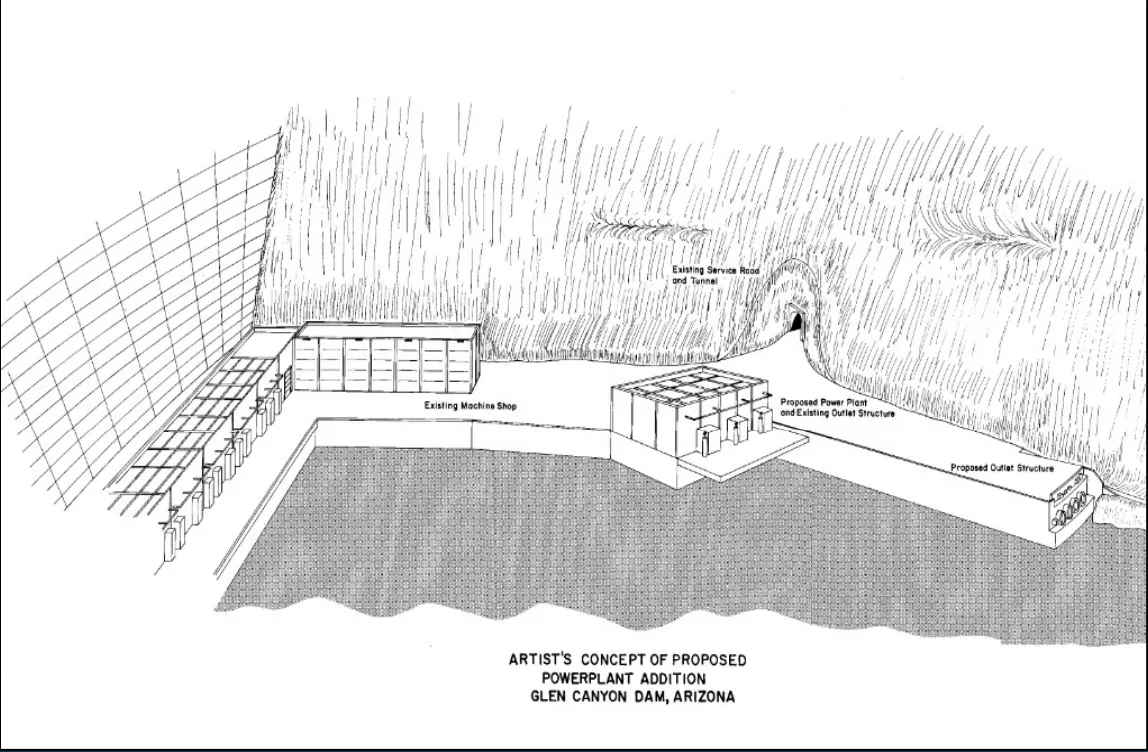
  • Build a low-level bypass tunnel through the sandstone around the dam and install new turbines/power plant to allow for low-water releases with hydropower generation. (Simply reopening the original river diversion tunnels, built to allow for the construction of Glen Canyon Dam, was dismissed due to the fact that the openings are completely buried in silt. This bypass would be above the siltation level.)
  • Adjust Colorado River operations (e.g. release less water from Glen Canyon Dam, get people to stop using so much water, etc.)
  • Retrofit dam to allow it to generate hydropower through existing penstocks at slightly lower levels.
  • Invest in other power sources to offset hydropower losses.
Proposed powerplant addition Glen Canyon Dam. Credit: The Land Desk

Any of the first three options would be a major and expensive undertaking. And any of them would also allow Glen Canyon Dam to be operated at much lower lake levels, which would have consequences for Lake Powell, too. Already the reservoir looks radically different than it does at “normal” levels; try to imagine it 130 feet lower?

Currently, the surface of Lake Powell is sitting at 3,522 feet. Minimum power pool is 3,490. Dead pool is 3,370. The alternatives being considered would allow the minimum power pool level to drop to 3,390, according to the chart below (although, theoretically, a 3,285 foot intake would allow the level to drop another 100 feet before hitting dead pool).

Operations at or below reservoir elevation of 3,490′ (MPP). Credit: The Land Desk

That would not only reveal more hidden wonders, but would also cause the big slug of silt that is concentrated in the upper reaches of the reservoir to migrate further downstream. And it would wreak more havoc on recreation. I’ll leave you with a good Twitter thread from Zak Podmore mapping out Lake Powell at 3,285 feet.

A look at all 173 of NOAA’s new global temperature maps #ActOnClimate

Click the link to read the article on the NOAA website (Rebecca Lindsey):

Last week, NOAA National Centers for Environmental Information released a major update to the agency’s global surface temperature dataset. The new product tracks temperatures back to 1850, adding 30 additional years to the historical record, and it has complete geographic coverage over data-sparse areas at the poles.

In honor of the new release, Climate.gov has made a poster-size image showing global temperature patterns for every year in the new data set. Each year’s annual average temperature is compared to the 1991-2020 average, which makes it clear how long-term global warming has affected Earth’s temperature. The farther back in time you look, the colder the temperatures were (darker blues over larger areas) compared today.

Scattered among the blue globes in early decades are years with a wash of red across the eastern tropical Pacific, likely linked to El Niño, the warm phase of the El Niño-Southern Oscillation climate pattern. At the other end of the record, the pattern reverses, with the colder-than-average waters of La Niña standing out on maps that are otherwise dominated by warmer-than-average conditions. Now here’s a question for other map geeks: what would the series look like if we had compared each year to the 1851-1880 average? To the 20th-century average?

Global average surface temperatures each year from 1850 to 2022 compared to the 1991-2020 average. Blue colors mean cooler-than-average annual temperatures, and red means warmer-than-average temperatures. Image by NOAA Climate.gov, based on data from NOAA National Centers for Environmental Information.

Changes needed to save second-largest U.S. reservoir, experts say — The Washington Post #LakePowell #ColoradoRiver #COriver #aridification #snowpack

Updated Colorado River 4-Panel plot thru Water Year 2022 showing reservoirs, flows, temperatures and precipitation. All trends are in the wrong direction. Since original 2017 plot, conditions have deteriorated significantly. Brad Udall via Twitter: https://twitter.com/bradudall/status/1593316262041436160

Click the link to read the article on The Washington Post website (Anumita Kaur). Here’s an excerpt:

“There’s too little supply and too much demand,” said Brad Udall, a water and climate scientist at Colorado State University. “Ultimately, I think what we’re going to see here is some major rewriting of Western water law.”

“We’re seeing a collision right now between 19th century water law, 20th century infrastructure and 21st century population and climate change,” Udall added. “And how this works out is anybody’s guess.”

[…]

West snowpack basin-filled map February 20, 2023 via the NRCS.

The snow and rain seen in the west this year isn’t enough to stabilize Lake Powell either, Andrechak said. “Now, the reality is, they’re all going to get a cut. Everybody should give,” he said.

“There’s no time left. The crisis is here. They don’t necessarily have to give it up forever. It might be temporary for several years until there’s improvements,” he said. But even if water levels do improve in the future, states cannot expect to return to former water usage entirely.

“Climate change is making sure that it’ll never get back to those levels,” Andrechak said.