
Click the link to read the article on The Land Desk website (Jonathan P. Thompson):
There’s some crazy s$#%t going down out there. Or perhaps I should say, falling down out there, from the sky, as in precipitating. Moisture-laden storm after moisture-laden storm has pounded a good portion of the Western United States all winter long. Equally remarkable is that the snowpack-building precipitation and snowpack-preserving cold temperatures have continued up to the end of March and look like they will persist into April, at least (it’s snowing in Colorado as I write this). That will extend the longevity of the snowpack and make a robust runoff more likely.
How robust will the runoff be? That’s anyone’s guess, honestly. I had imagined I simply could find a year when snowpack levels were similar to today’s, and then look at that year’s runoff peak, and voila, I’d be able to ballpark this year’s peak date and flow. And then I’d be able to win the San Juan Citizens Alliance’s “Predict the Peak” contest. But when I looked back on the Animas River, for example, I found that runoff peaks and April 1 snowpack levels corresponded only loosely. The timing of the snowpack peak, which determines how quickly the snow melts, also plays a big role in runoff levels. And we don’t know yet when the snowpack will peak in most watersheds.
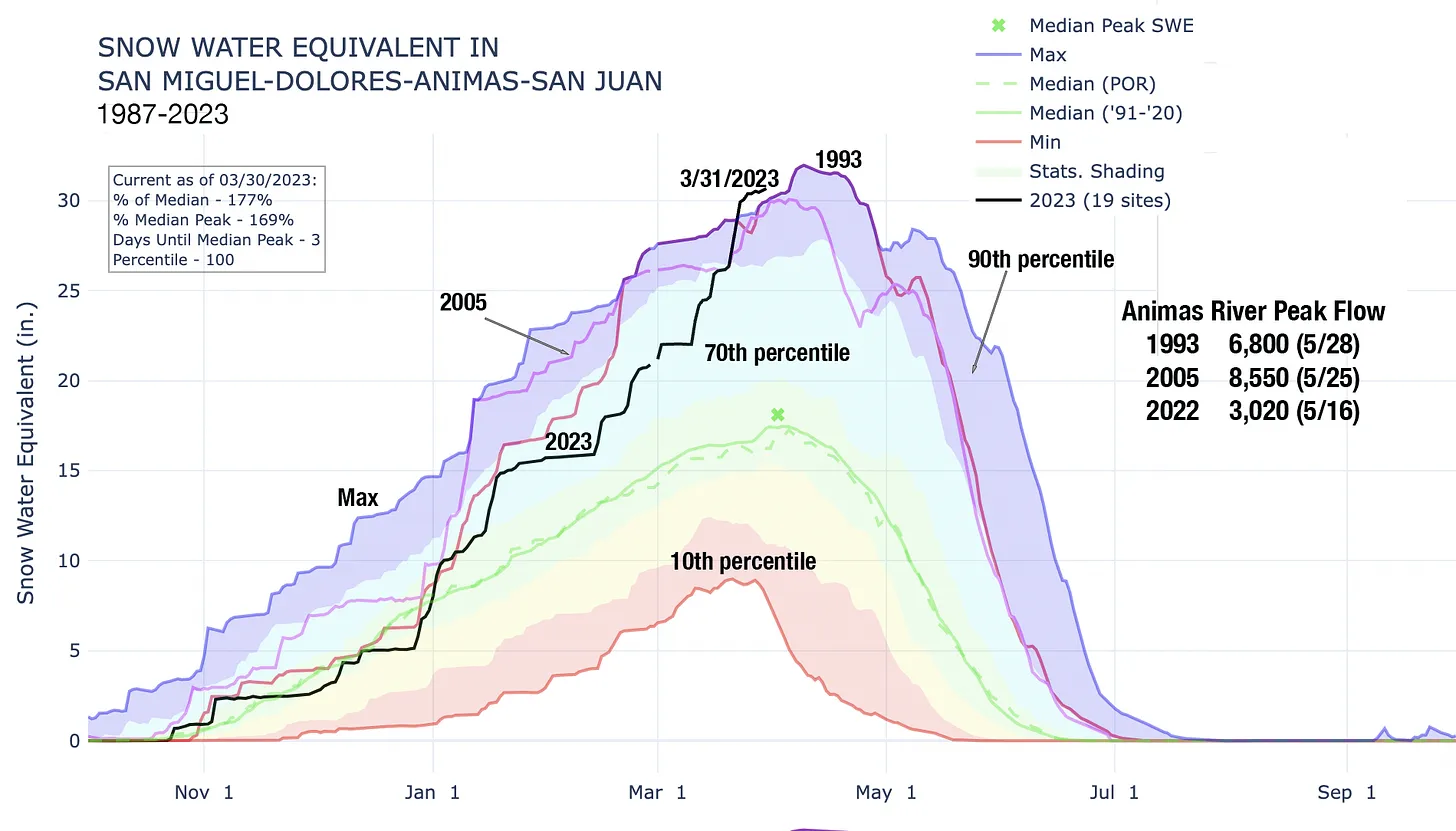
And even if we did, there’s just some strange stuff going on, as this graph from the USDA reveals. Notice how in 1993 the snowpack at its peak was far greater than in 2005, and yet the peak runoff in 1993 was significantly lower than in 2005, even though the peak date was nearly identical. So trying to use the past snowpacks to predict the peak runoff this year isn’t as straightforward as I hoped. That said, I’m going to guess the Animas River will peak above 7,000 cfs in late May this year.
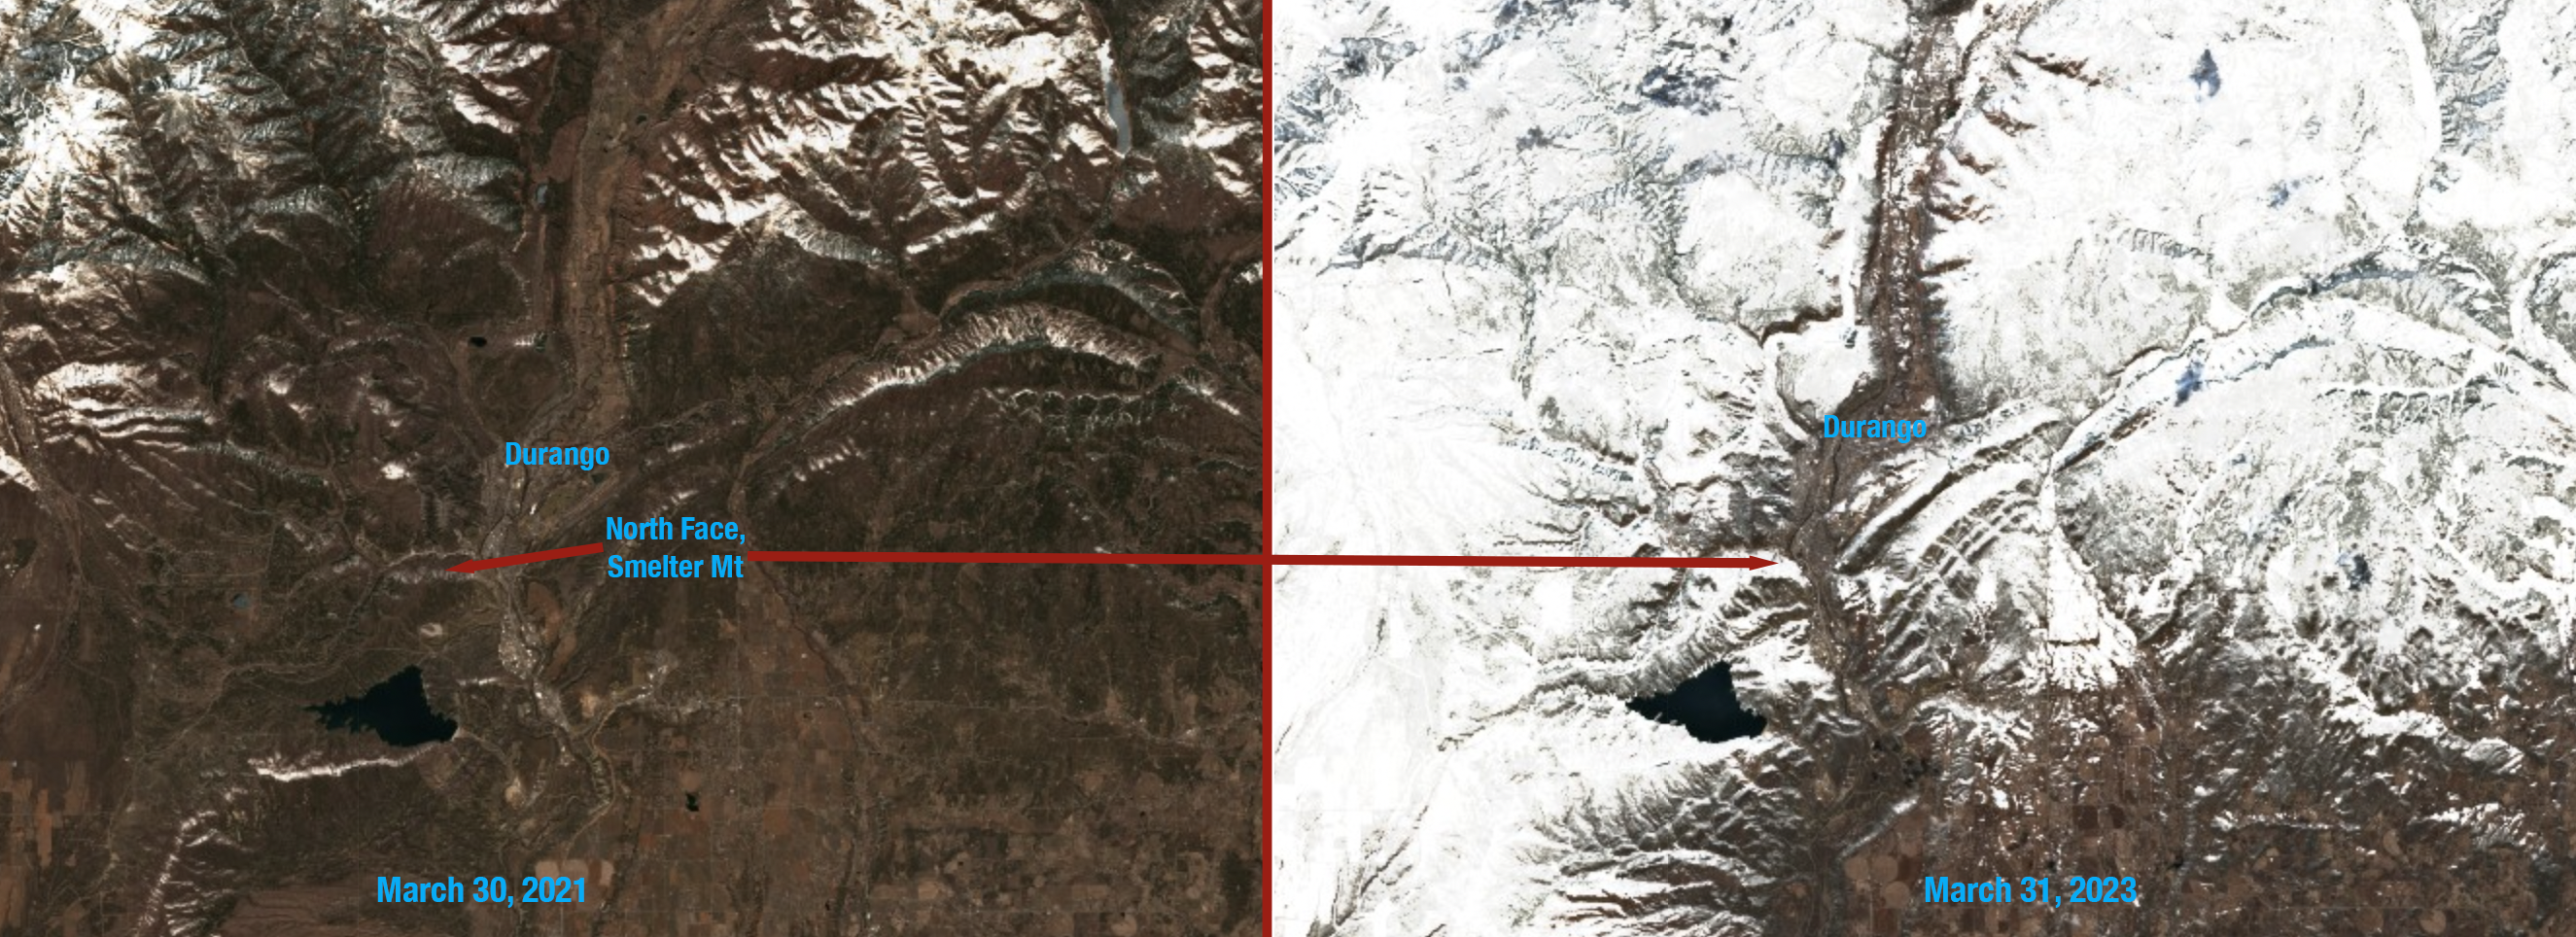
Graphs and statistics aside, let me just assure you that there is a sh¶§t ton of snow in the Animas River watershed right now. That’s just a personal observation, but damn …
Predicting the total annual inflows into Lake Powell using snowpack levels is easier, it turns out, than predicting the peak streamflow of a given river. Which makes sense, when you think about it. Here’s the chart for the watersheds that feed Lake Powell, with inflows for selected years. Keep in mind that the records don’t go back to the whopper years of 1983 and 1984, when Lake Powell inflows exceeded 20 MAF:

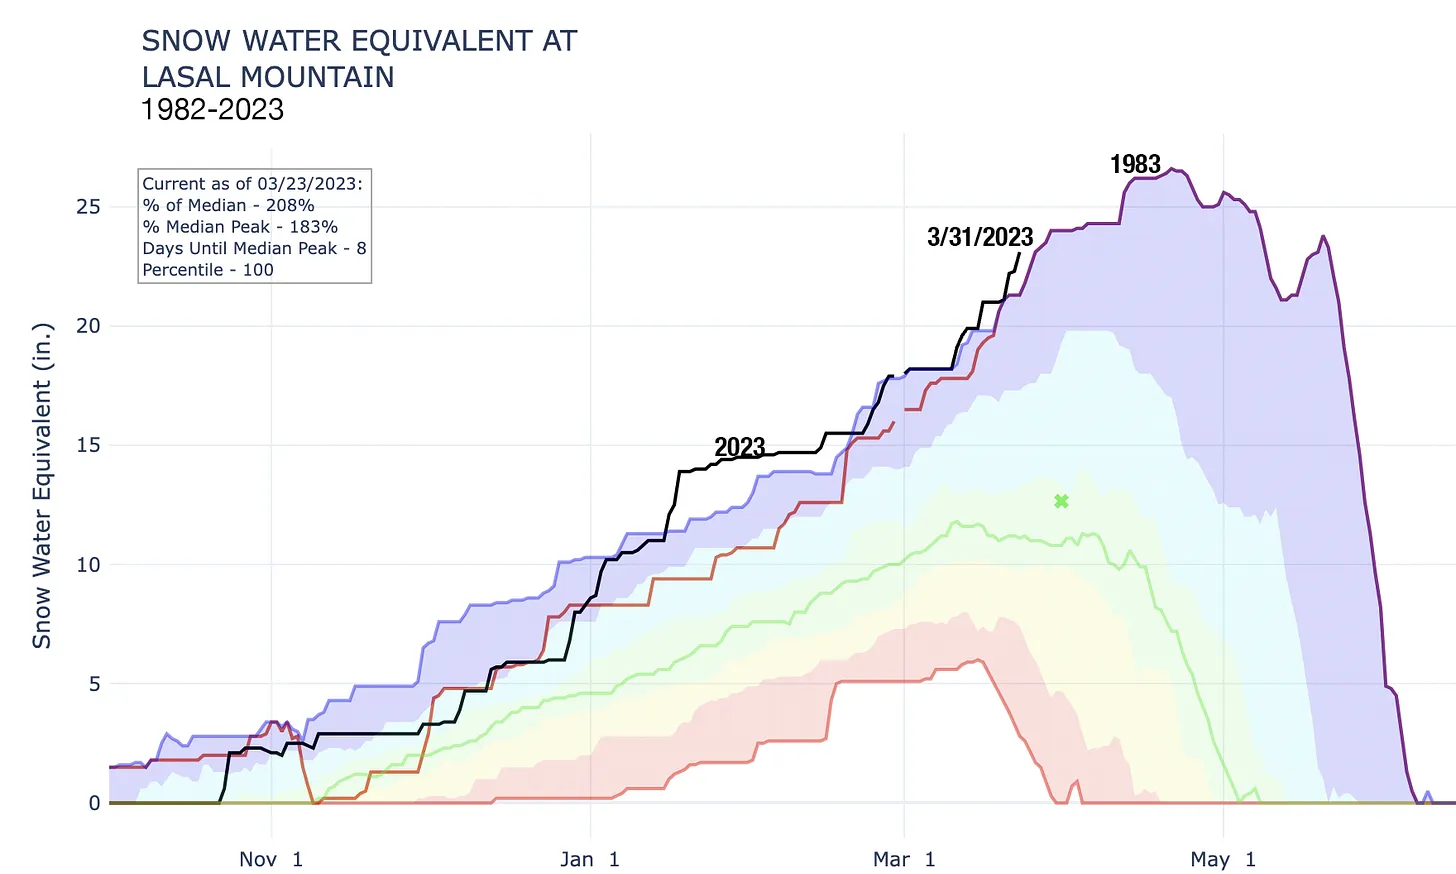
And, just one more chart, this one from the La Sal Mountains in southeastern Utah. I include it here because it’s one of the few charts in the region that goes back before 1983, which was a huge year in the Colorado River Basin (as were 1980 and 1984). And because this SNOTEL site has had near record high snowpack levels all winter, and are now exceeding even those from 1983. This bodes well for flows in Mill Creek that runs through Moab as well as the Lower Dolores River.
So am I going to win this year’s predict the peak contest? Probably not. But I will predict this: If you’re one of the lucky 2% who got a permit to float one of the West’s rivers this year, you’re probably going to have some big, big water to contend with. So if you wanna give that permit up, I know a few folks who would gladly accept it.
Intrepid boaters in Arizona didn’t even have to wait until spring runoff for some monster water: Heavy rains and snowmelt combined to swell up that state’s rivers on March 22. Some sample flows:
- Salt River near Chrysotile: 16,700 cubic feet per second on 3/22;
- Verde River below Tangle Creek: 99,100 cfs on 3/22;
- Fossil Creek near Strawberry: 6,800 cfs on 3/22;
- Oak Creek near Sedona: 17,500 cfs on 3/22.