Assessing the U.S. #Climate in January 2024 — NOAA

ChatGPT 4’s image of a fox crossing the Yampa River February 11, 2024

Click the link to read the assessment on the NOAA website:

FEBRUARY 8, 2024

An arctic air mass brought bitter cold and snow to much of the nation in mid-January; powerful storms brought heavy rainfall and flooding to parts of the southern Plains

Key Points:

  • The arctic air mass from January 14–18 broke nearly 2,500 daily minimum temperatures county records from the Northwest to the Lower Mississippi Valley.
  • On January 22–25, heavy rainfall brought more than a month’s worth of rain and life-threatening flooding to parts of Texas and Louisiana.
  • January 2024 was the 10th-wettest January on record for the nation, and temperature ranked in the middle third of the historical record for the month.

Other Highlights:

Temperature

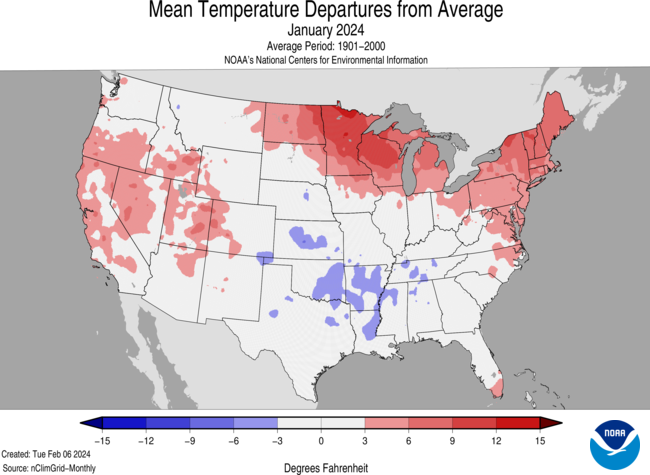
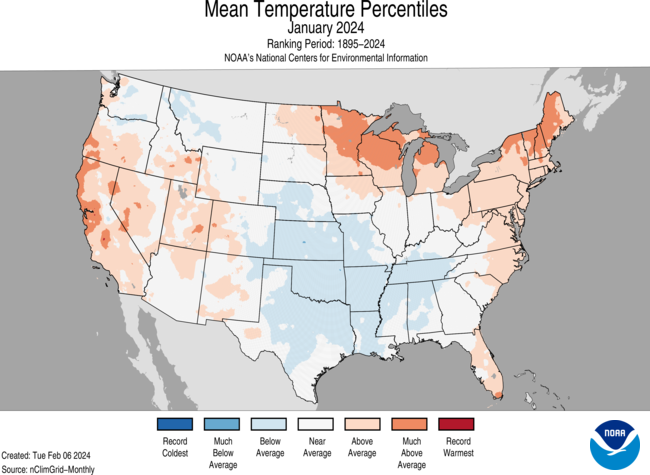
The average temperature of the contiguous U.S. in January was 31.8°F, 1.6°F above average, ranking in the middle third of the 130-year record. Generally, January temperatures were above average from the Carolina Coast to the Northeast and across parts of the West Coast, central Rockies, Upper Midwest and Great Lakes, with below-normal temperatures extending from parts of the Northwest to the Gulf of Mexico. Wisconsin had its 10th-warmest January on record.

The Alaska statewide January temperature was 2.9°F, 0.7°F above the long-term average, ranking in the middle third of the 100-year period of record for the state. Near-normal temperatures were observed across much of the state with above-normal temperatures observed in parts of the North, West and the Aleutians. Below-normal temperatures were observed in parts of the Interior and East.

Precipitation

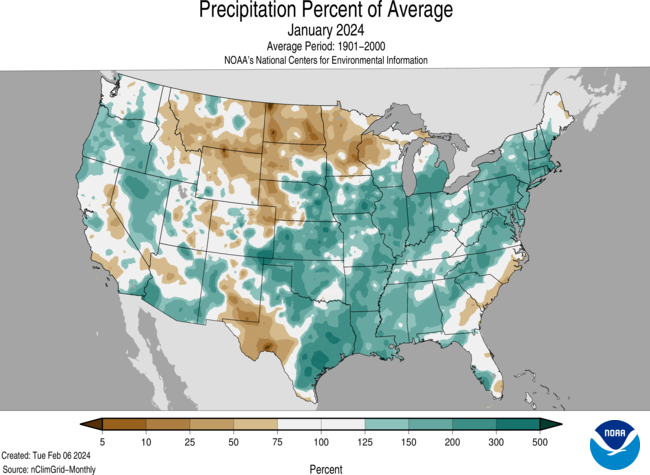
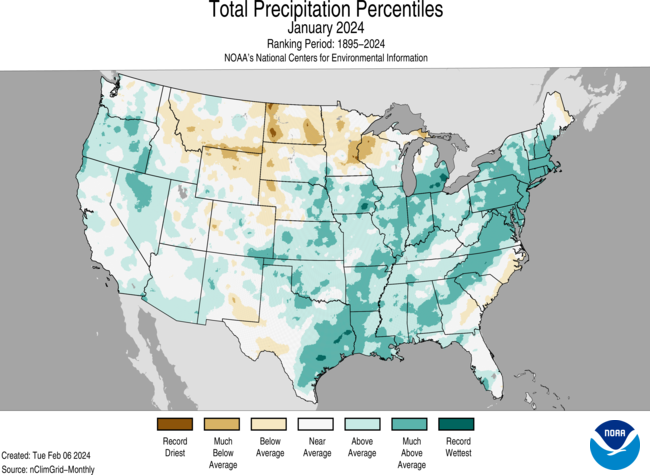
January precipitation for the contiguous U.S. was 3.18 inches, 0.87 inch above average, ranking as the 10th-wettest January in the historical record. Precipitation was above average across much of the eastern U.S. and in parts of the West. Massachusetts and Connecticut ranked third wettest. Conversely, precipitation was below average from parts of the northern Rockies to portions of the Upper Midwest and in parts of the Southwest and coastal Carolinas. North Dakota had its 10th-driest January on record for this period.

Alaska’s average monthly precipitation ranked in the middle third of the historical record. Precipitation was below average across much of the state, while above-normal precipitation was observed in parts of the southeast Interior, Panhandle and the Aleutians during the month.

Other Notable Events

  • An arctic air mass brought record-breaking cold temperatures and snow to much of the contiguous U.S. during mid-January:
  • The mid-January arctic air mass dropped temperatures to 20 to 35°F below normal over parts of the northern and central Plains, while heavy snow fell over portions of the Great Lakes and the Northeast. The lowest temperature in the country occurred in Briggsdale, Colorado, with a low temperature of −35°F the morning of January 16.
  • Heavy snow fell over much of the Northeast, while New York City reported over an inch of snow for the first time in nearly two years on January 16. 
  • Nashville received over six inches of snow on January 15—more than an entire winter’s worth of snow for the city.

A powerful bomb cyclone brought cold temperatures, strong winds and heavy snow to portions of the Northwest on January 8–10, resulting in the Seattle NWS issuing the first blizzard warning in over 11 years for the region.

Historic snowfall continued across portions of Alaska. Anchorage has received over 100 inches of snow since October—the snowiest water year (October 2023–September 2024) to date. In Juneau, the airport received more than 76 inches of snow in January, the highest January total on record and second highest monthly total.
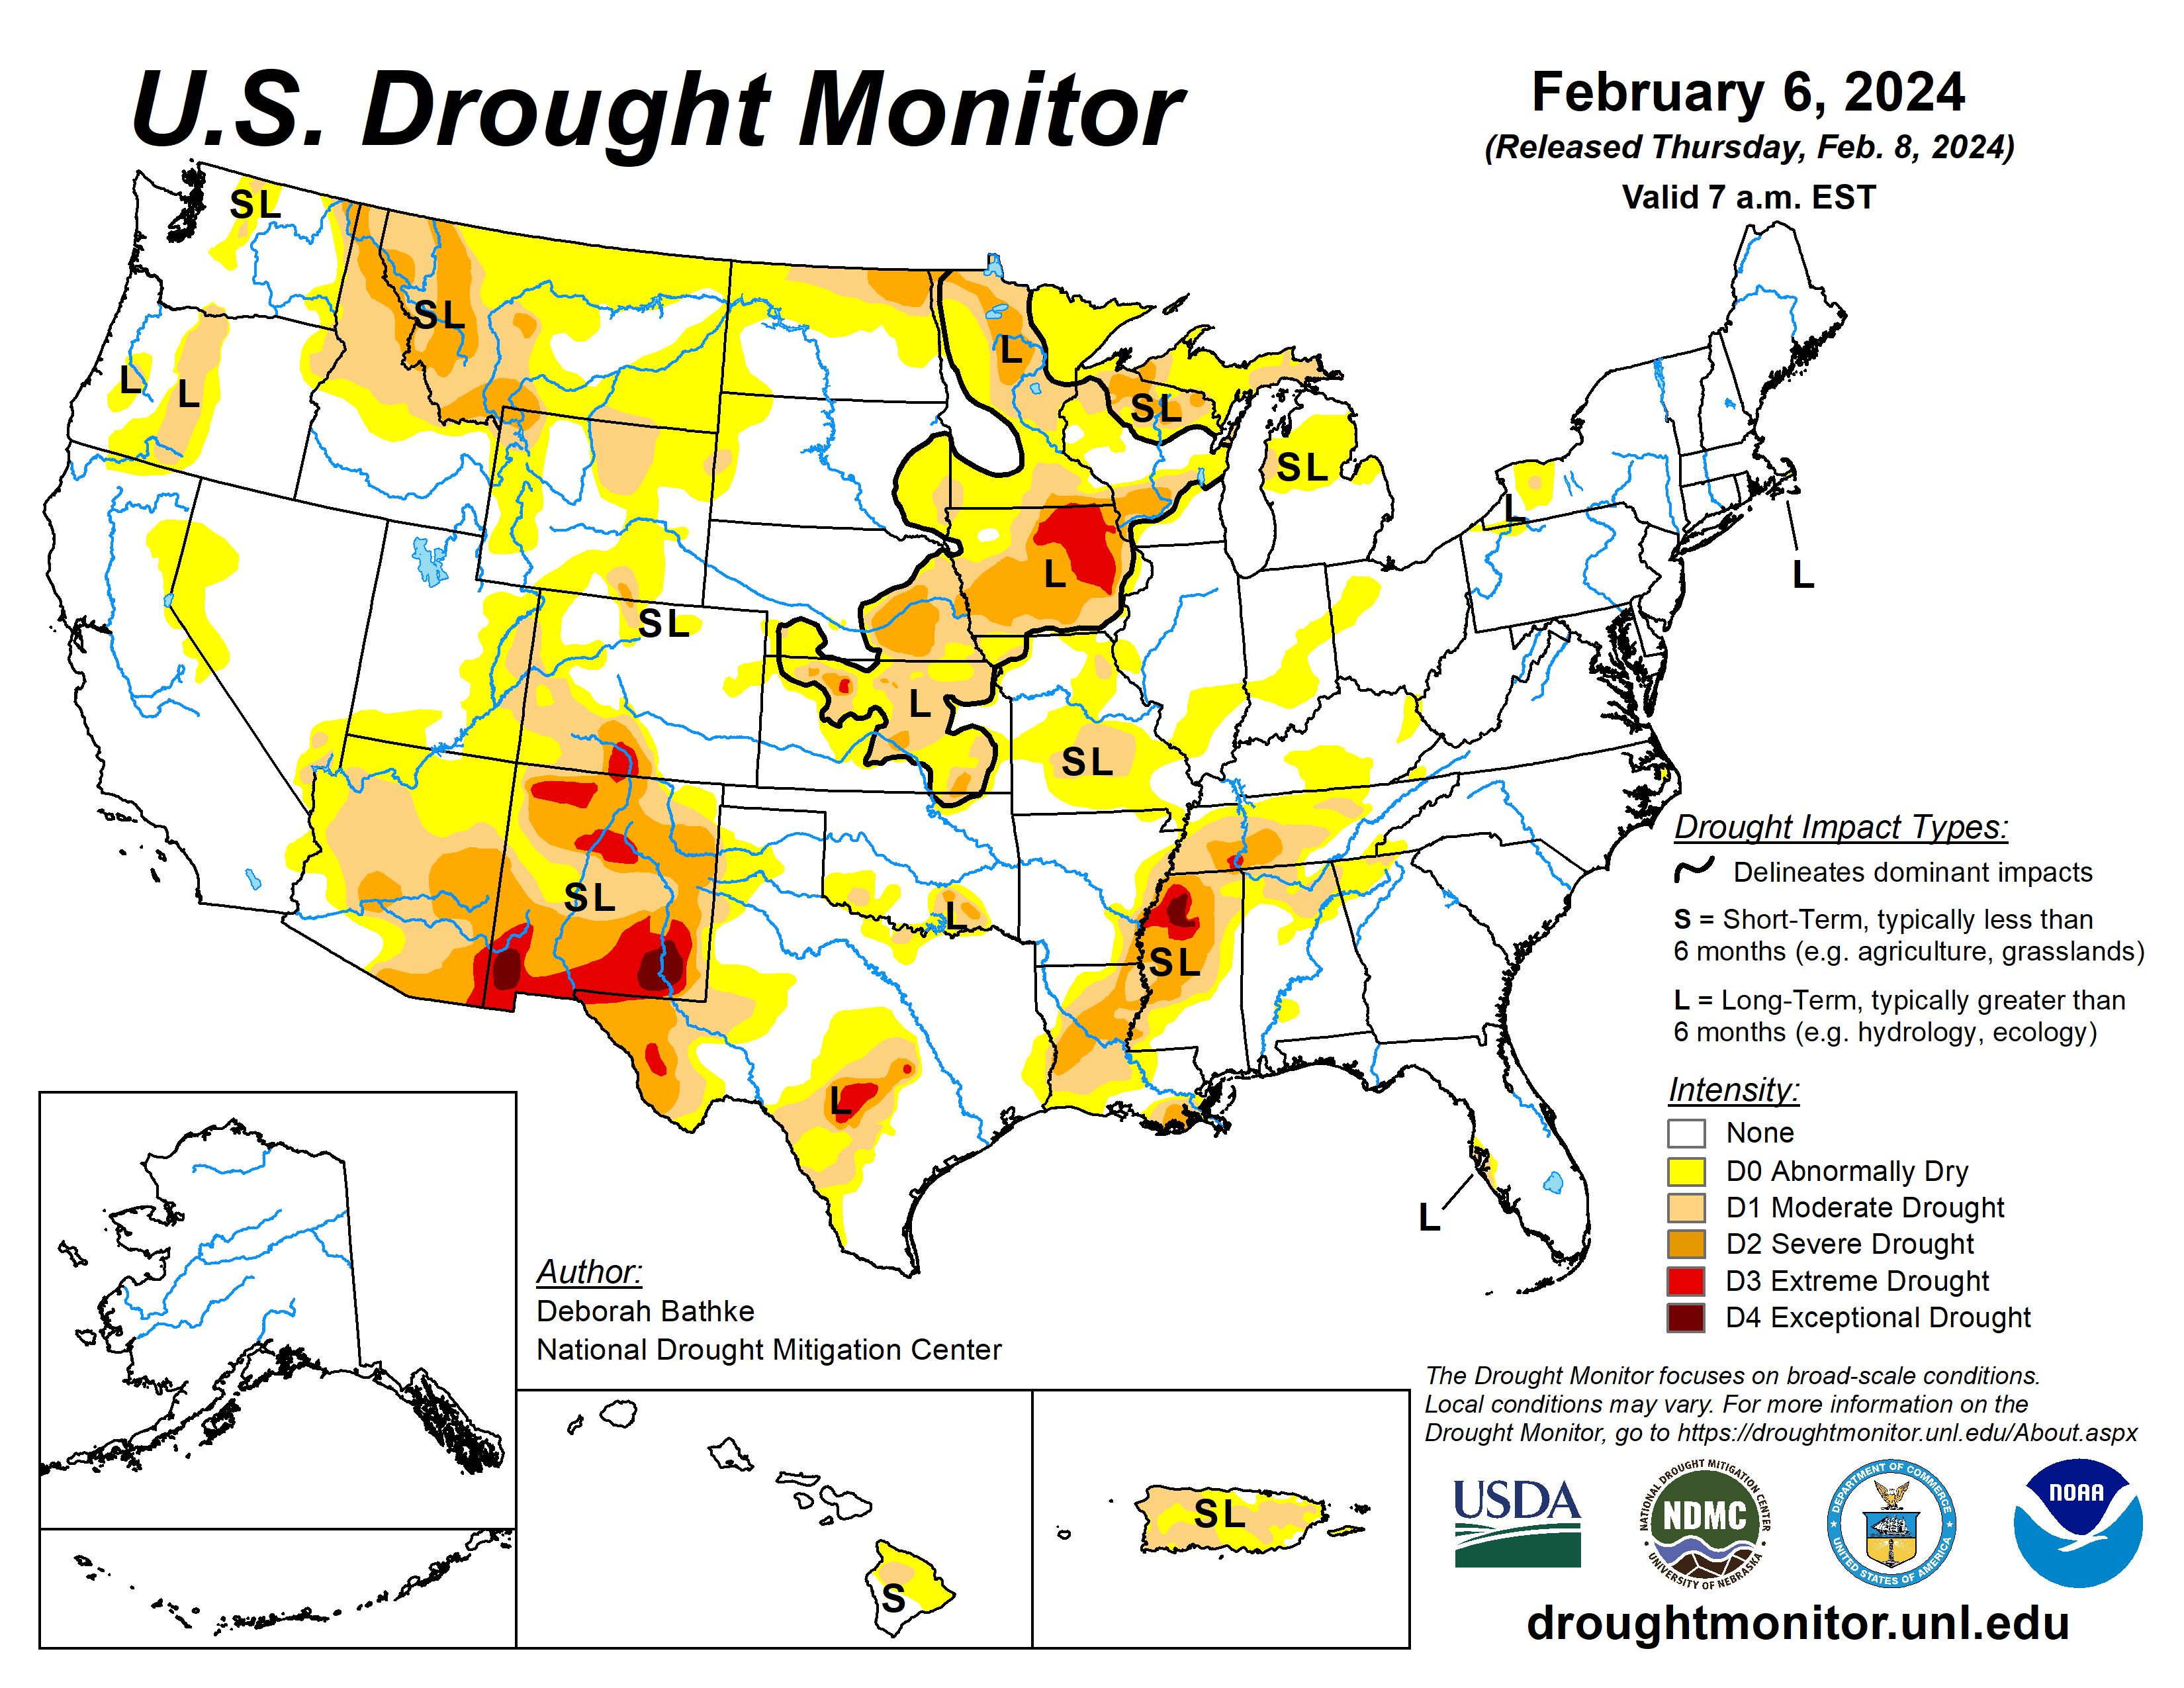
US Drought Monitor map February 6, 2024.

Drought

According to the January 30 U.S. Drought Monitor report, about 23.5% of the contiguous U.S. was in drought, down about 9.5% from the beginning of January. Drought conditions expanded or intensified across northern parts of the Rockies and Plains and in parts of the Northwest, Southwest and Puerto Rico this month. Drought contracted or was reduced in intensity across much of the Great Plains to the East Coast, parts of the Northwest, Southwest and Hawaii.

Monthly Outlook

Above-average temperatures are favored to impact northern portions of the U.S. in February while precipitation is likely to be above average across portions of the southwestern U.S. and Southeast Coast. Drought is likely to persist across portions of the Northwest, Southwest, Midwest, Hawaii and Puerto Rico. Visit the Climate Prediction Center’s Official 30-Day Forecasts and U.S. Monthly Drought Outlook website for more details.

Significant wildland fire potential for February is above normal across Puerto Rico. For additional information on wildland fire potential, visit the National Interagency Fire Center’s One-Month Wildland Fire Outlook.


This monthly summary from NOAA’s National Centers for Environmental Information is part of the suite of climate services NOAA provides to government, business, academia and the public to support informed decision-making. For more detailed climate information, check out our comprehensive January 2024 U.S. Climate Report scheduled for release on February 13, 2024. For additional information on the statistics provided here, visit the Climate at a Glance and National Maps webpages.

The Story Behind the Numbers — #Colorado Water Trust (@COWaterTrust) #YampaRiver #aridification

Yampa River in Steamboat Springs at low water. Photo credit: Colorado Water Trust

Click the link to read the release on the Colorado Water Trust website (Tony LaGreca):

February 7, 2024

As the Stewardship Manager for Colorado Water Trust, I am lucky to have several interesting jobs outside of developing new projects. I write a monthly forecasting memo that helps our staff plan for the upcoming season’s operations. I travel around the state and visit our projects to ensure they are still operating as designed. I collect streamflow and water temperature data to inform project design. It’s all great work but there is one job that is arguably the most important; I maintain and update (read the next words in an important sounding voiceThe Master Dashboard Accounting Spreadsheet.

This spreadsheet tallies the streamflow volumes and the number of river miles with improved flows. Volume and miles restored are the primary metrics that describe our impact. We must report accurate records to the Division of Water Resources, and our funders like to see our volume and mileage metrics, as well. Heck, the first thing you see on our website is a cool animation tallying up our volumes and stream miles. Just looking at the site now, I see that we have restored 73,242 acre-feet of water to 612 miles of Colorado’s rivers, which is very impressive… or is it? Honestly what do those numbers mean? Is our work important? Impactful? Let’s dig a little deeper to find a better way to highlight the benefits our work. 

Let’s start with terms. Acre-feet is a weird one—it’s a very important term in the water world but doesn’t translate well to a general audience. Us water nerds often try to better explain the term. “An acre-foot of water is enough water to supply two average households for one year” we will say in a very serious tone. Great, so now we can visualize how many showers and toilet flushes the Water Trust has restored. Hmm… perhaps if we convert it to gallons it will make more sense. I see that we have restored 22.6 billion gallons—that sounds impressive! Let’s convert it to metric tablespoons to get a truly enormous number. Unfortunately, the human brain is epically bad at comprehending large numbers so perhaps we should look at this another way.

Rivers and streams are not simple units easily counted and categorized. Rivers are homes for fish, drinking water for towns, irrigation water for farmers, places of recreation, and focal points for communities in the arid west. Rivers are local and personal. Our Yampa River Project is a great example for examining the alternative metrics we can use to measure our impact on the river and the community that depends on it. Low summertime flows on the Yampa lead to high water temperatures that are unhealthy or even deadly to the trout who call the river home. To help protect the trout, Colorado Parks and Wildlife (CPW) is often forced to close the river to extremely popular recreational activities like angling and tubing. While the closures help keep fish alive, they severely impact summer tourism and the local economy. Since 2012, the Water Trust has partnered with the Upper Yampa Water Conservancy District, Colorado Water Conservation Board, City of Steamboat Springs, and the Yampa River Fund to release additional water from Stagecoach Reservoir 18 miles upstream of Steamboat. These releases help cool temperatures for the fish and keep the river open for recreation. Now, let’s take a closer look at some of the metrics that tell the story of our impacts to the Yampa and the Steamboat community.

Take a look at the plot below, which shows the flows in the Yampa River in Steamboat during the late summer of 2023. The blue shading shows the flows that the Water Trust released. Last summer, Water Resources Specialist, Blake Mamich, saw that dropping flows and high river temperatures were exceeding regulatory thresholds (which lead to river closures) so he acted quickly, coordinating releases to boost stream flows and keep the river cool.

Graphic credit: Colorado Water Trust

Let’s look at some of the metrics that help tell the story of this successful project. In 2023, the Yampa River Project:

  • Released water for 60 days, keeping the river cool to keep the city compliant with regulations.
  • Boosted flows for fish for nearly two months.
  • Averted 38 days of river closures, keeping the river open when it would have otherwise been closed for over a month during the busy tourism season.
  • Water Trust releases often accounted for over 30% of the entire flow in the Yampa River, and has accounted for over half of the flow in years past.

Now there are some metrics that show the impact of our work a little better than 3,288 acre-feet or one billion gallons. Let’s look beyond the flow numbers to see how the project is providing benefits to the upper Yampa communityA 2019 study by the Steamboat Chamber of Commerce found that summer tourism has a $166 million-dollar impact on the city which supports over 2,000 jobs. While I am not an economist, it’s not unrealistic to imagine that a 38-day closure of the river flowing through the heart of town would reduce those numbers. It’s also interesting to note that less than 2% of the economic benefits would easily pay for this project to run in perpetuity. Looking beyond the tourism impacts, the water continues to flow downstream of Steamboat where it is available to agricultural users along the length of the river. This project is also a long-term investment in sustainable river health as the Water Trust has operated this project in 10 of the last 12 years, providing a decade of benefits.

Digging more deeply into the impact of our projects really shows why our work is so important. They go beyond just putting flows into the river—they make tangible and long-term impacts on the habitats and communities that rely on healthy rivers across the state.

I will keep updating the Master Dashboard Accounting Spreadsheet and reporting our volume numbers since they are still very important to our work, but I promise to chime in here on occasion to highlight all of the benefits that our projects generate. So next year when you are reading the annual report and you see we have restored enough water to cover Manhattan Island to a depth of 5 feet*, know that there is a story behind the numbers. 

*That is true by the way.

The Yampa River emerging from Cross Mountain Canyon in northwest Colorado had water in October 2020, but only the second “call” ever was issued on the river that year. Photo/Allen Best

Growing Rural Renewables — Colorado Farm & Food Alliance (@ColoFarmFood)

Vegetable harvest at an agravoltaic operation. Photo credit: Colorado Farm & Food Alliance

Click the link to read the blog post on the Colorado Farm & Food Alliance website:

February 11, 2024

What are agrivoltaics?

Agrivoltaics are the pairing of solar energy—also known as photovoltaics—and agriculture. Some experts think it offers solutions that can help renewables better integrate with rural livelihoods and might also provide some enhancements for farming as we head into a hotter, drier, less predictable weather future.

As an example,  Jack’s Solar Garden, on Colorado’s Front Range, has been a real leader modeling how agrivoltaics, farming and community can support each other.  And now, such systems are beginning to sprout on the Western Slope as well. 

As the need for fast deployment of renewables impacts rural communities, issues such as siting and who benefits become central concerns.

Smart co-location, including agrivoltaics where it makes sense, is one way to smooth the way for more clean energy to power farms and rural places. Community-solar is another way to ensure that communities are centered in the expansion of renewable energy. 

Row crops underneath solar panels. Photo credit: Colorado Farm & Food Alliance

Community-Solar can help put rural people at the center of the clean energy build-out.

Community-solar—think “solar garden”—is a shared solar system that provides a direct benefit from the power production at that facility to a group of community-based members or subscribers. Community-solar can increase energy equity by sharing the benefits of clean energy production and savings among a number of users, and can support the expansion of  renewables by putting more members from impacted communities in the driver’s seat. It often is used to assist households that otherwise would be unable to afford or obtain individual solar systems in benefiting from the growth of clean energy.

In Delta County, the Colorado Farm & Food Alliance is part of a team of local leaders bringing agrivoltaics together with community-solar in a project at Thistle Whistle Farm on Hanson Mesa, outside the town of Hotchkiss. The Thistle Whistle project got a kick-start last spring when the Colorado Farm & Food Alliance and the team were awarded a stage 1 Community Solar Power Accelerator Prize, sponsored by the National Renewable Energy Laboratory. That competition is still on-going even as the Thistle Whistle project proceeds.

Photo credit: Colorado Farm & Food Alliance

National Community Solar Prize spurs project along.

Project proponents hope the latest submission will unlock the stage 2 funding award this spring, keeping things on track to put a community-owned, farm-integrated energy system into operation before next year. In any case, the National Community Solar Partnership, which helps administer the competition through the Hero X platform, also provides in-depth training, technical assistance, and a supportive cohort that has already moved this project forward.

You can learn more about this project and the inspiration behind it on this episode of Crisis to Comeback, a podcast by Kori Stanton and Citizens for a Healthy Community. She interviews Mark Waltermire, owner of Thistle Whistle Farm and a western Colorado agricultural leader.

To  read more about how renewables can integrate with rural communities, check out this guest column by our director that recently ran in the Grand Junction Daily Sentinel: “Renewable energy: Get it right, but get it going”. And watch our blog, our social media, and in other outlets for updates as this and other projects progress.