Quantifying the interconnected impacts of climate change and irrigation on surface water flows is critical for the proactive management of our water resources and the ecosystem services they provide. Changes in streamflow across the Western U.S. have generally been attributed to an aridifying climate, but in many basins flows can also be highly impacted by irrigation. We developed a 35-year dataset consisting of streamflow, climate, irrigated area, and crop water use to quantify the effects of both climate change and irrigation water use on streamflow across 221 basins in the Colorado, Columbia, and Missouri River systems. We demonstrate that flows have been altered beyond observed climate-related changes and that many of these changes are attributable to irrigation. Further, our results indicate that increases in irrigation water use have occurred over much of the study area, a finding that contradicts government-reported irrigation statistics. Increases in crop consumption have enhanced fall and winter flows in some portions of the Upper Missouri and northern Columbia River basins, and have exacerbated climate change-induced flow declines in parts of the Colorado basin. We classify each basin’s water resources sustainability in terms of flow and irrigation trends and link irrigation-induced flow changes to irrigation infrastructure modernization and differences in basin physiographic setting. These results provide a basis for determining where modern irrigation systems benefit basin water supply, and where less efficient systems contribute to return flows and relieve ecological stress.
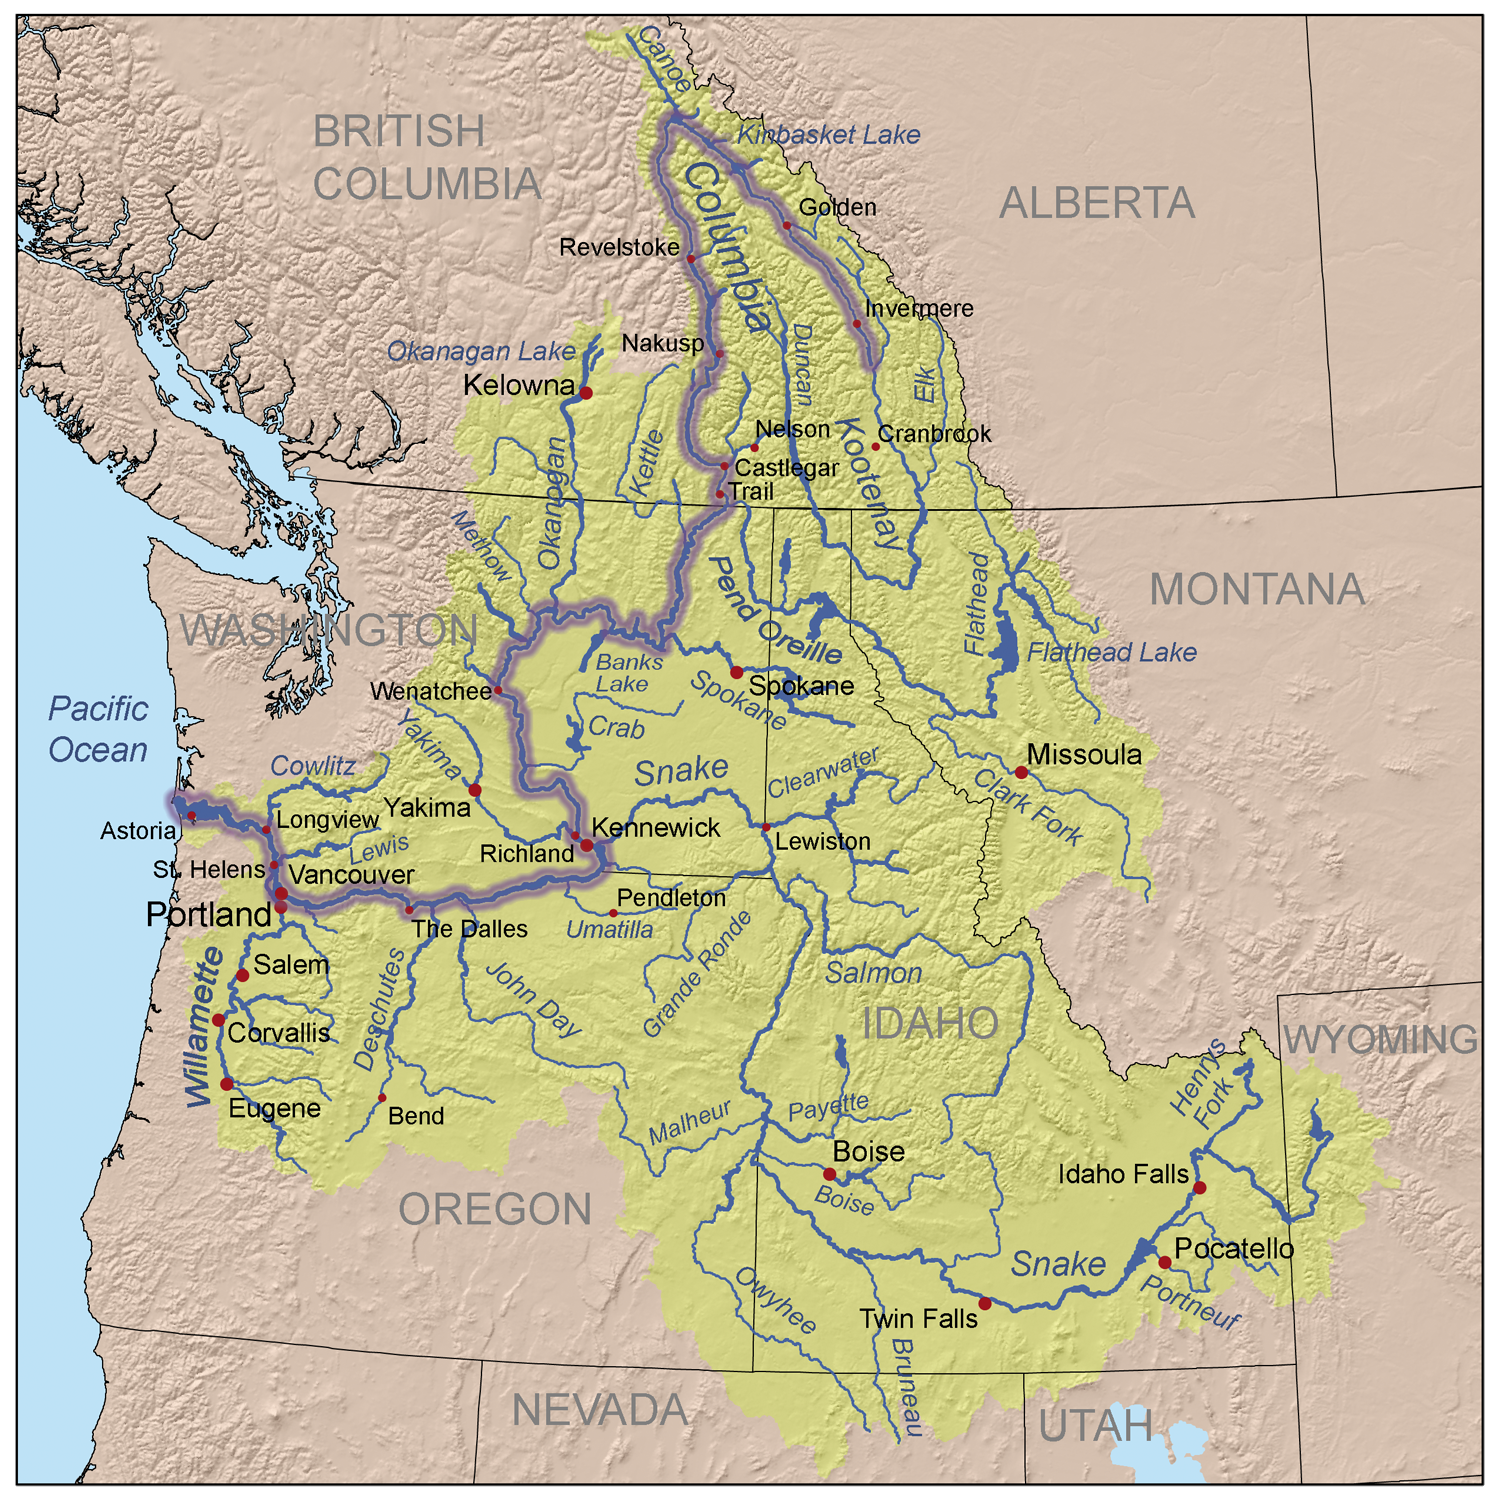
Map of the Columbia River watershed with the Columbia River highlighted. By Kmusser – self-made, based on USGS and Digital Chart of the World data., CC BY-SA 3.0, https://commons.wikimedia.org/w/index.php?curid=3844725Map of the Colorado River drainage basin, created using USGS data. By Shannon1 Creative Commons Attribution-Share Alike 4.0
LONGMONT: It is 10:16 a.m. on Valentine’s Day. More than 100 people are gathered in a sprawling room at the Boulder County Fairgrounds. Pencils, notebooks, calculators, auction catalogs and heart-shaped chocolates lie on tables as buyers begin bidding for some of the most sought-after and pricey water in Colorado.
In less than an hour, they will have spent some $4.7 million to buy shares of water in the Colorado-Big Thompson (C-BT) Project, a federal water system whose construction began after the Dust Bowl, which now serves more than 1 million people on the northern Front Range and which helps irrigate thousands of acres of farmland in the South Platte River Basin. It is operated by Northern Water.
This liquid, in some ways, is the Saks Fifth Avenue of water — high quality, clean, neatly packaged and easily delivered within the boundaries of Northern Water’s eight-county district. Another major attraction is that transactions involving C-BT shares don’t have to be approved by Colorado’s water courts, as most water sales do.
Under the contract between Northern Water and the U.S. Bureau of Reclamation, transfers of C-BT Project shares are instead approved by the Northern Water Board of Directors.
Some 90 shares were for sale on that morning, a tiny fraction of the 310,000 shares that comprise the entire project, according to Jeff Stahla, a spokesman for Northern Water, which operates the system for the U.S. Bureau of Reclamation.
And the sales prices were low, averaging just over $52,000 per share, well below the $70,000-plus the water has fetched in recent years, Stahla said.
Jim Docheff is a retired dairyman from Weld County. He sits in the front row, in a Western red felt jacket and tan cowboy hat, one of his sons by his side.
Ultimately he will buy six shares of the water. “It’s all I could afford,” he said, smiling.
How much water is conveyed in a share of the Colorado-Big Thompson system varies from year to year and is tied to how much water the system gathers from the headwaters of the Colorado River and how much irrigators need, Stahla said. Each spring, Northern’s board decides how much water will be allotted to its shares, which are designed to supplement native supplies in the South Platte River Basin.
Some years, the board sets a quota as high as 100% per share, which is one-acre foot. The lowest it has set is 50%. In a dry year, the board might set the quota higher to help growers, and in a wet year, it may be lower because less water is needed.
An acre-foot of water equals about 326,000 gallons.
This purchase will add water security to Docheff’s dairy operations for years to come, he said, as his sons continue the work the family has been doing for 89 years.
But the deal must be approved by Northern Water, which will certify that the water will stay in its district, that it will be put to beneficial use, and that it will serve as a supplemental rather than a sole source of water, a requirement under its federal operating rules.
Docheff and others were surprised by the numbers. “Honestly, I thought the prices were low,” Docheff said.
In recent years, Colorado-Big Thompson shares have topped $70,000. And in fact, one share did sell for $79,200 on Valentine’s Day, but most sold for less, trading in the $50,000 to $72,600 range, according to Scott Shuman of Hall and Hall Auctions, which ran the morning’s proceedings.
And that was good news for farmers, who dominated the bidding. They were able to afford to buy shares in a system in which fast-growing cities from Broomfield north to the Wyoming state line once dominated the sales, often pricing farmers out.
“I think it actually speaks to the fact that there is a robust market for agriculture and you have producers who are looking to firm up their [water] portfolios,” Stahla said.
The lower prices may also be tied to a softening in the housing market in northern Colorado, Shuman said.
“We had an auction in 2019 and we had tons of cities participating,” Shuman said. But not this time around.
“In 2019 there were new subdivisions being built everywhere and we’re not seeing that kind of building now,” he said.
Throughout the proceedings, Carol Yoakum and her family, the sellers of the C-BT shares, sat at the back of the room, watching bid prices post on a huge screen behind the auctioneer.
“I think it went just fine,” she said, after the bidding closed. “I hope it makes everybody happy.”
More by Jerd SmithJerd Smith is editor of Fresh Water News. She can be reached at 720-398-6474, via email at jerd@wateredco.org or @jerd_smith.
Colorado-Big Thompson Project map. Courtesy of Northern Water.
Concerns that California might remain in a “snow drought” this winter have eased after a series of storms this month blanketed the Sierra Nevada with a near-average amount of snow for this time of year. The snowpack across the mountain range now measures 86% of normal for the date, according to state data, up from 28% of normal at the start of the year. The latest storms have also brought enough rain to push the state’s total precipitation to slightly above average for this time of year. And California’s major reservoirs, which were filled spectacularly by last year’s historic wet winter, are still at 118% of their average levels…
“We have a fairly good snowpack right now — not great, but it’s not unusually dry,” [Jay] Lund said. “And even if it were to get dry, we’re coming into it with a full set of reservoirs.”
[…]
Shasta Lake, the state’s largest reservoir, is now 87% full, while Lake Oroville stands at 82% of capacity.
A federal appeals court has overturned an Obama-era moratorium for new coal mine leasing on public lands — an “unequivocal win” for Wyoming’s coal industry, according to Gov. Mark Gordon. Yet the decision, which the 9th Circuit Court of Appeals handed down on Wednesday, likely will not result in a rush on new federal coal leases in Wyoming.
The three-judge panel even noted an apparent “de facto moratorium” dictated by markets that has all but erased demand for major new federal coal tracts — a trend that particularly applies to Wyoming coal, which has lost nearly half its market among coal-burning electric power producers in the U.S over the past 15 years.
Nonetheless, the court’s ruling does away with “duplicative” environmental analysis introduced by the Obama moratorium and is a clear charge to the Department of Interior that it must be responsive to federal coal lease requests, according to Gordon.
“The Department of Interior now has one less excuse to thwart its federal coal leasing responsibilities,” he said in a prepared statement Wednesday.
Volley among administrations
In 2016, then-President Barack Obama directed the Interior and Bureau of Land Management to issue a moratorium on federal coal leasing and conduct a review of the program to better account for a fair rate of return to taxpayers, as well as coal’s impact on human health and the environment.
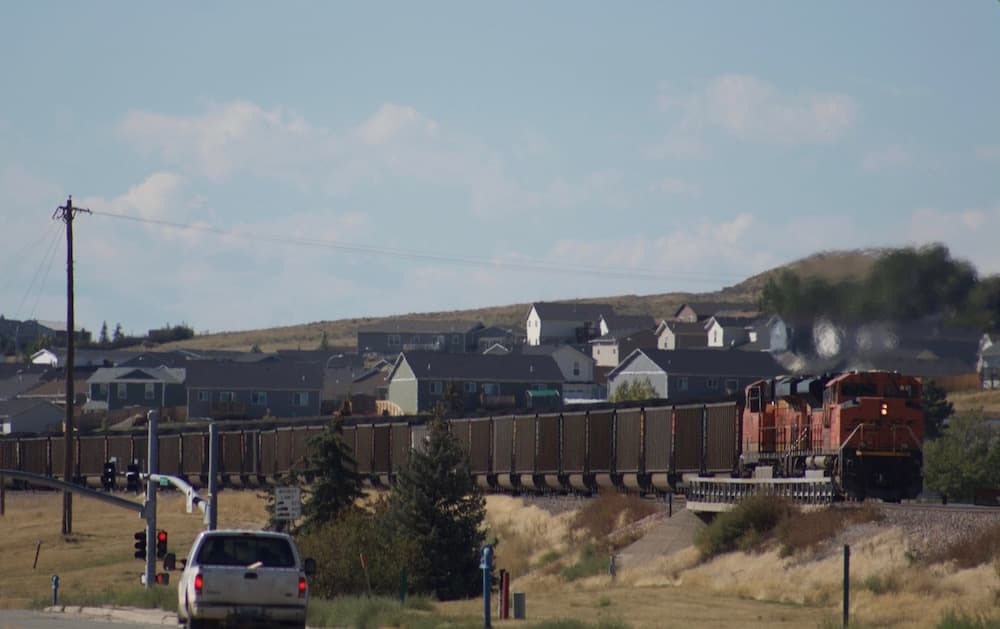
A coal train rolls out of Gillette in 2016. (Andrew Graham/WyoFile)
But then the Trump administration rescinded the order before the federal agencies completed the work. The conflicting administrative policies set off a series of legal volleys and prompted Wyoming to join the battle in support of the Trump administration’s actions on the matter.
The appellate court ruling this week nullifies a 2022 federal district court ruling that temporarily reinstated the original moratorium.
“With this ruling, important projects can once again advance and support the production of affordable, reliable power to the grid, while creating jobs and economic development across the country, helping federal, state and localities with necessary funding by contributing hundreds of millions each year in revenues to state and local governments,” National Mining Association President and CEO Rich Nolan said in a prepared statement.
However, the Northern Cheyenne Tribe and several conservation groups that brought the lawsuit say the Biden administration can still take meaningful action regarding federal coal reserves.
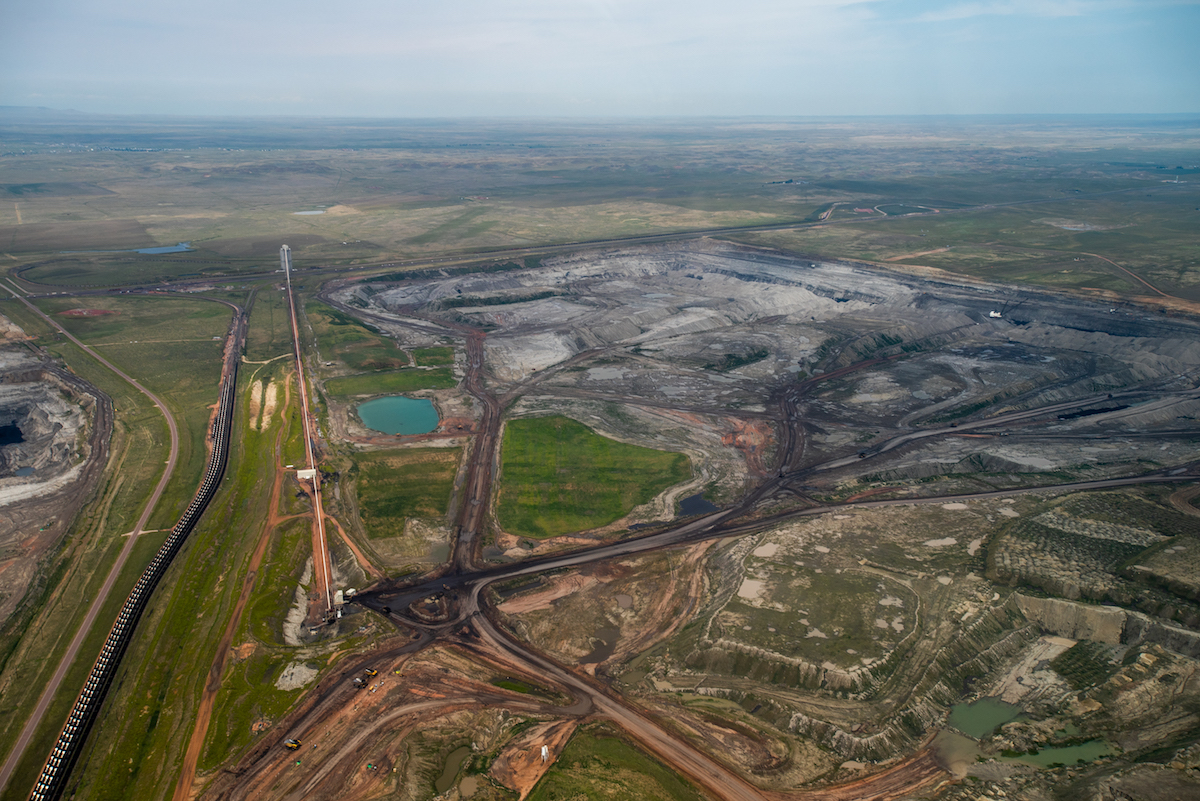
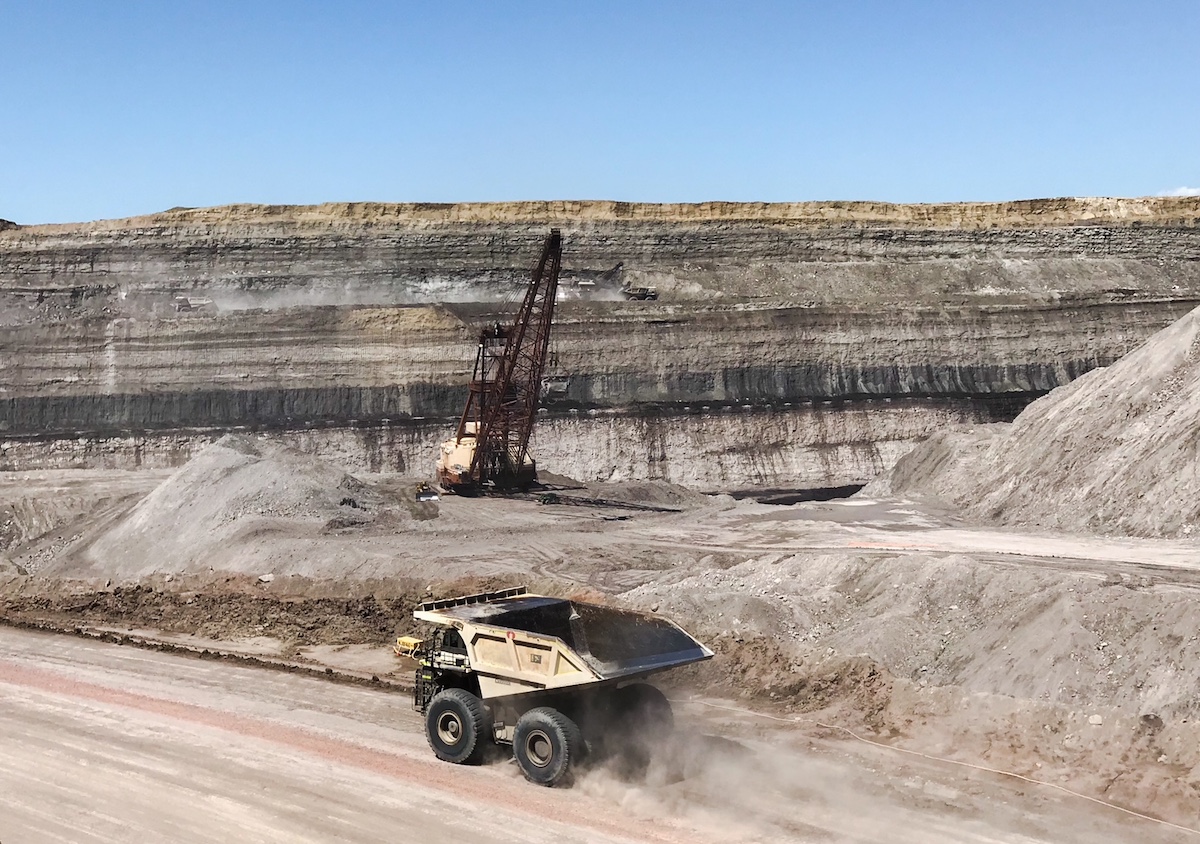
A coal haul truck at Peabody Energy’s North Antelope Rochelle mine heads to the pit for another load in July 2019. (Alan Nash/WyoFile)
“Almost 10 years ago under President Obama, we were promised there would be an honest conversation with the American people about the real costs of the federal coal program on our public lands and public health. We’re still waiting for that conversation,” Wyoming Sierra Club Acting Director Rob Joyce said. “Now we have less than a decade to make significant cuts to climate pollution to avoid the worst impacts of climate change. Instead of leasing coal to the highest corporate bidder, BLM needs to focus on helping coal communities transition to clean energy jobs and setting a conservation-minded course that preserves public lands for future generations.”
Dwindling demand
Wyoming became the nation’s largest coal producer in the 1980s, and at its peak, in 2008, produced 466 million tons. The annual volume of coal that’s shipped out of state has fallen by nearly half since then.
Powder River Basin mines, which account for the bulk of Wyoming’s coal production, shipped about 230.4 million tons in 2023 — a decline of 7 million tons compared to 2022, according to the Gillette News-Record.
Demand for new federal coal tracts has followed suit.
The most recent large federal coal leases sold in the Powder River Basin went to Peabody Energy and Arch Coal (now Arch Resources) in 2012. Peabody paid $1.24 billion for the rights to mine 1.12 billion tons of coal to extend operations at its North Antelope Rochelle mine, according to the BLM. Arch paid more than $300 million for 222.67 million tons of federal coal for its flagship Black Thunder mine.
All told, some 2.5 billion tons of federal coal reserves were leased in the Powder River Basin during the first seven years of the Obama administration prior to the coal leasing moratorium in 2016.
Since then, coal producers in Wyoming — responding to softening market demand — have pulled back on earlier plans to acquire large tracts of federal coal to last them decades into the future. Aside from leasing small “maintenance” coal tracts at existing mining operations — which was allowed to continue under the Obama moratorium — there are just two pending lease applications for major new federal coal tracts in Wyoming, according to the BLM.
Cloud Peak Energy applied for a 441 million-ton federal coal lease in 2015, but the company filed for bankruptcy in 2019. Its Powder River Basin mines were acquired by Navajo Transitional Energy Company LLC, which still maintains the lease application. NTEC, however, has scaled back production at the mines.
A subsidiary of Arch applied for a 468 million-ton federal coal tract in 2005, a request that was not subject to the moratorium. However, Arch has also scaled back its mining operations in Wyoming and plans to sell or close its mines in the state.
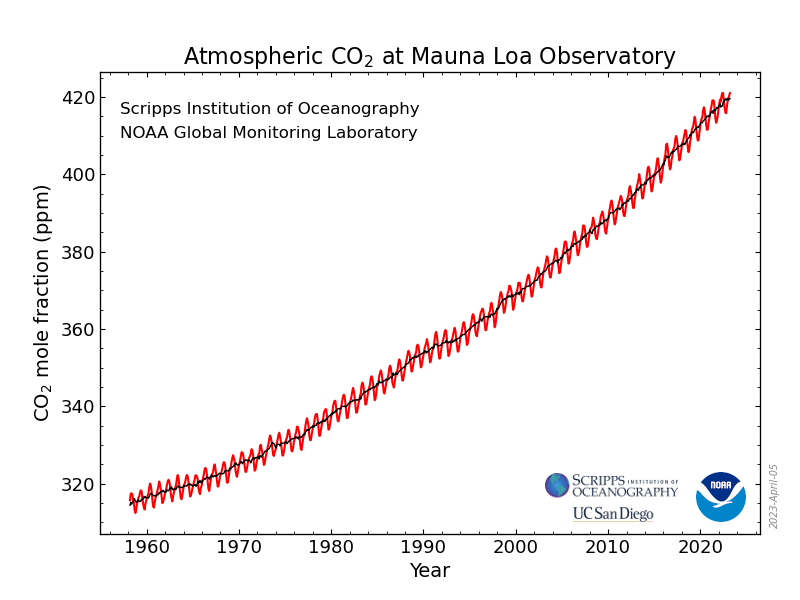
Mauna Loa is WMO Global Atmosphere Watch benchmark station and monitors rising CO2 levels Week of 23 April 2023: 424.40 parts per million Weekly value one year ago: 420.19 ppm Weekly value 10 years ago: 399.32 ppm 📷 http://CO2.Earthhttps://co2.earth/daily-co2. Credit: World Meteorological Organization
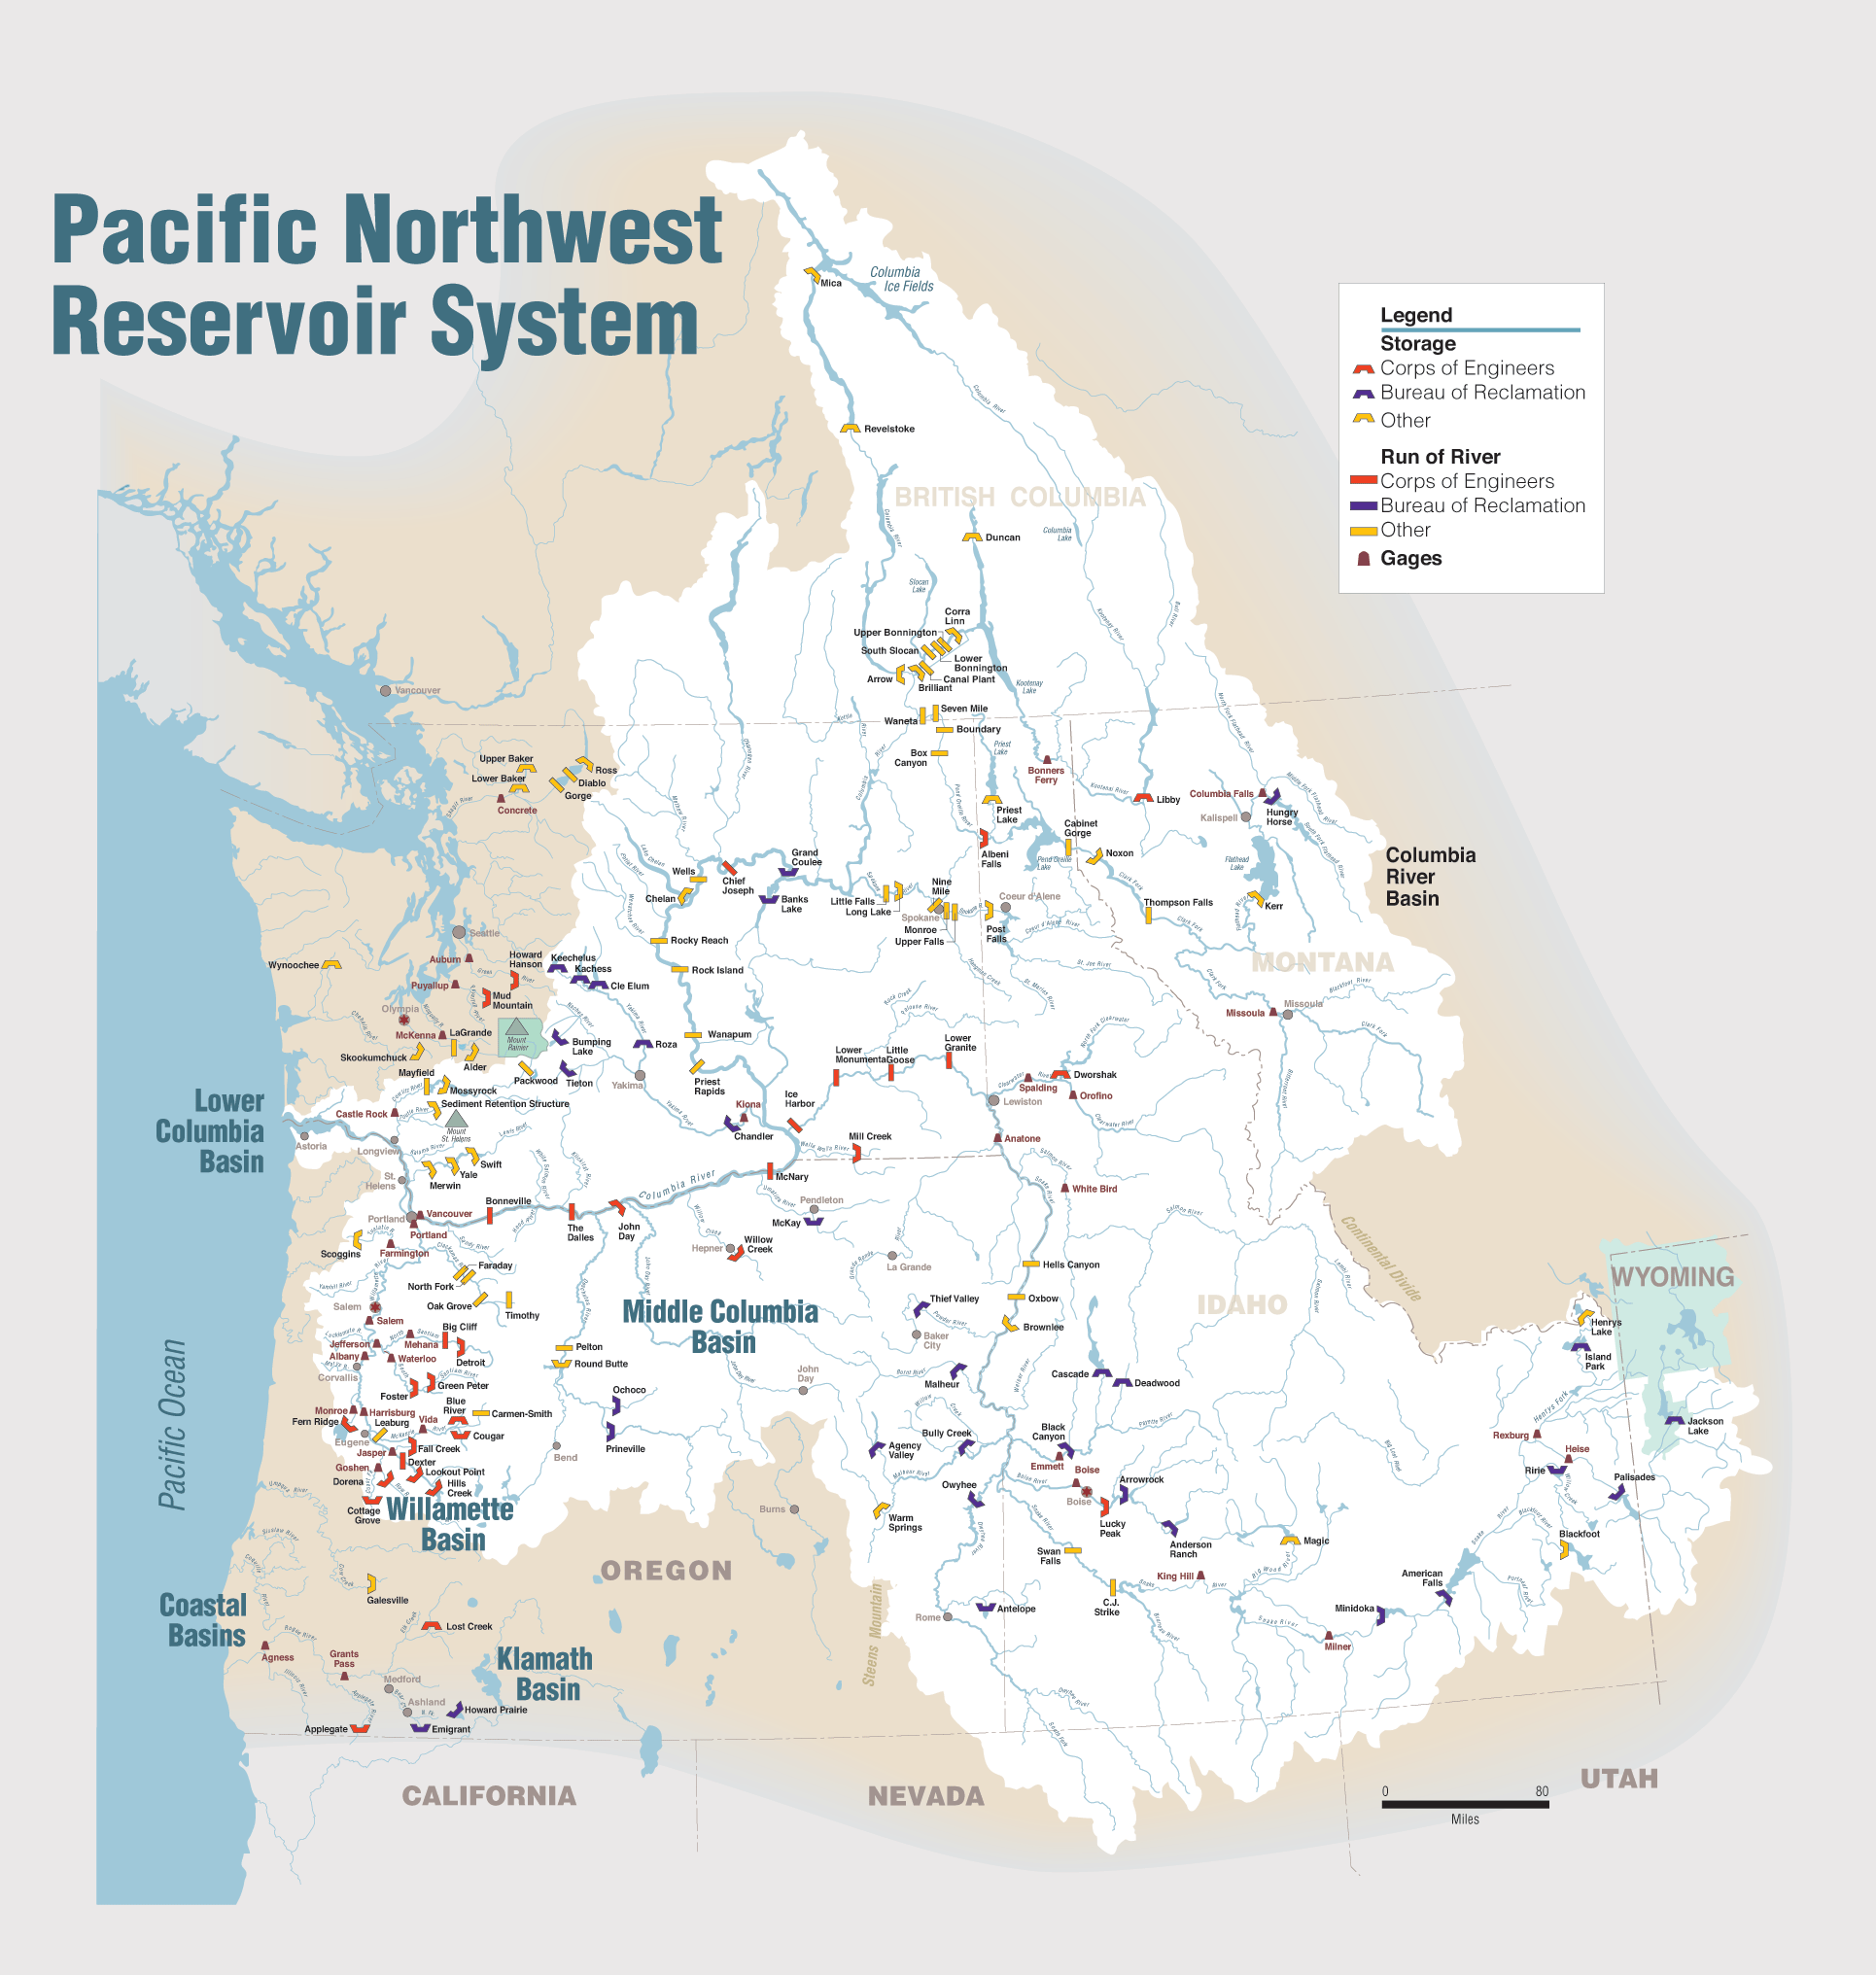
Leaders of four Pacific Northwest tribal nations indigenous to the region on Friday inked a historic agreement with the U.S. that lays out the future of the operations of hydropower dams in the Columbia River Basin, including the dams on the Lower Snake River. At the White House on Friday, the Nez Perce, Umatilla, Warm Springs and Yakama tribes, and the states of Washington and Oregon, signed a memorandum of understanding, outlining a series of commitments from the federal government. It’s not an agreement for dam removal; in fact, removal of the Lower Snake dams, a long-running and controversial goal of tribes and other groups, is put off for years. But it’s the end of an era.
“We need a lot more clean energy, but we need to develop it in a way that’s socially just,” Yakama Nation Chair Gerald Lewis said at the White House. “The last time energy was developed in the Columbia Basin it was done on the backs of tribal communities and tribal resources.”
[…]
Tribal nations helped draw up a road map for the future of the region’s energy and salmon. Under the $1 billion-plus agreement announced in December and approved by a federal judge this month,tribes will help restore wild fish and lead in the construction of at least 1 to 3 gigawatts of clean-energy production. The agreement stems from years of mediated negotiations in a decadeslong court battle over dam operations. A stay of litigation is in place for up to five years and could continue for as long as 10. In a key compromise, the agreement also reduces water spilled over the dams for summer and fall run fish, including fall Chinook, one of the more robust salmon runs on the river, and a mainstay of tribal and sport fisheries. That allows the Bonneville Power Administration to sell more power from the dams into the lucrative California power market. However, spring spill would be boosted, to help spring Chinook by providing something more like a spring freshet for young fish migrating to the sea.
Click the link to read the article on the NOAA website:
Highlights
Temperatures were above average over much of the globe, but the eastern United States, most of Europe and a few other areas were cooler than average.
There is a 22% chance that 2024 will be the warmest year in NOAA’s 175-year record and a 79% chance that El Niño will transition to neutral conditions by mid-year.
Northern Hemisphere snow cover was near average, but Antarctic sea ice extent was fifth lowest on record for January.
Global precipitation was nearly record-high in January, following on the heels of a record-wet December.
Temperature
The January global surface temperature was 2.29°F (1.27°C) above the 20th-century average of 54.0°F (12.2°C), making it the warmest January on record. This was 0.07°F (0.04°C) above the previous record from January 2016. According to NCEI’s Global Annual Temperature Outlook, there is a 22% chance that 2024 will rank as the warmest year on record and a 99% chance that it will rank in the top five.
(map) Global surface temperatures for January 2024 compared to the 1991-2020 average, showing a few colder-than-average locations (blue) scattered among mostly warmer-than-average temperatures (red). (graph) January temperatures each year from 1850-2024 compared to the 20th-century average. It’s been several decades since we’ve had a January that was colder than average (blue bars, below the zero line). January 2024 (final red bar) was the warmest January on record. Januarys are getting warmer at a rate of 1.09 ˚F (0.61 ˚C) per century. NOAA Climate.gov images, based on data from NOAA National Centers for Environmental Information (NCEI).
January saw a record-high monthly global ocean surface temperature for the 10th consecutive month. El Niño conditions that emerged in June 2023 continued into January, but according to NOAA’s Climate Prediction Center it is likely that El Niño will transition to ENSO-neutral by April–June 2024 (79% chance), with increasing odds of La Niña developing in June–August 2024 (55% chance).
Temperatures were above average throughout the Arctic, most of northeastern North America, central Russia, southern and western Asia, Africa, South America, eastern and southeastern Asia and Australia. Much of northwestern North America, the central and southern United States, northern and eastern Europe, northeastern Asia and Antarctica experienced near-to- cooler-than-average temperatures during January. Sea surface temperatures were above average across much of the northern, western and equatorial Pacific Ocean, as well as parts of the western Indian Oceans.
Precipitation
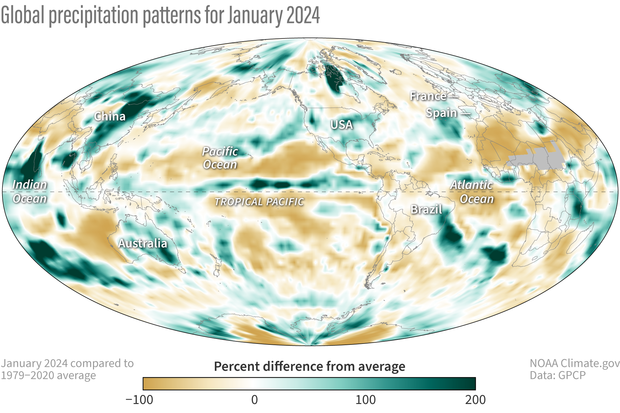
The El Niño rainfall anomaly pattern over the central and western Pacific Ocean and Maritime Continent has weakened.
Further afield the patterns over the Indian Ocean, Africa and the southern U.S. are more clearly El Niño-like.
Overall the pattern correlation between this January’s rainfall anomaly pattern and the El Niño composite plummeted from a high of +0.59 last month to only +0.19.
Global total precipitation for this January is nearly a record high following December’s record high for that month of the year.
Percent difference from long-term average (1979-present) precipitation in January 2024. Places that were drier than average are brown; places that were wetter than average are green. NOAA Climate.gov map, based on data provided by the Global Precipitation Climatology Project.
The current El Niño continues through January, but the departures from average on the global map show a mixed pattern, with some rainfall excess/deficit features typical of El Niño situations and others differing from the expected pattern. In the central and eastern Pacific along the Intertropical Convergence Zone, there is still a narrow, strong positive anomaly as typical of El Niño, with a rainfall deficit just to the north and south. But just to the west the wide positive feature expected at ~180° longitude at the Equator is weak this month, despite the Niño 3.4 Index being +1.9, easily within strong El Niño range. [The “Niño 3.4 Index” tracks sea surface temperatures in the central-eastern tropical Pacific Ocean: the key ENSO monitoring region].
The match between this January and the El Niño composite becomes even more fraught over the Maritime Continent to the west where generally very dry conditions are typical of El Niño, but rainfall is in excess over Borneo and Malaysia, although deficit features exist over some surrounding areas, especially between Sumatra and Australia. Australia itself is typically very dry during El Niños, but for this January it is mostly wetter than normal across the continent, and there was even flooding first in Victoria and then heavy rains in northern and northeastern parts of the country later in the month.
Northern South America is mostly dry, as is typical of El Niño, but the rest of the pattern does not match well. The spatial correlation of January’s anomaly pattern with the El Niño composite has plummeted to +0.19 from a high of +0.59 in December, seemingly indicating a weakening of El Niño at core tropical locations. It will be interesting to see if that type of change continues next month, or if this is a temporary change. Models are predicting an end to the El Niño over the next few months. [Read more about what we can expect from the El Niño-Southern Oscillation this spring in Climate.gov’s latest ENSO Blog post.]
For a deeper dive on January 2024 climate, including circulation patterns, major events, and separate statistics and rankings for Earth’s land and ocean areas, see the full January 2024 monthly report from NOAA NCEI.
Click the link to read the article on the InkStain website (Eric Kuhn):
February 22, 2024
One of the commentors to our January 19th, 2024, blog post titled “Are We headed for the First Colorado River Compact Tripwire?” – John C. (who, by-the-way runs a very talented water resources engineering firm) raised several finer points to explore further:
The first point deals with obligations of each Basin to contribute water needed to meet U.S. obligations to Mexico under the 1944 Treaty. The second deals with the question of how to measure, and therefore manage, in the context of overall Colorado River Basin management, the use of tributary water in the Lower Basin. Both represent unresolved legal questions with enormous potential impacts on the allocation and distribution of the shrinking Colorado River – questions we have avoided dealing with by draining the Basin’s reservoirs. We no longer have that option.
The two issues have been disputed for decades. They are, of course, totally inter-related, and when one peels back the layers of each, the problems get so complicated that the only real solution may be for the Basin’s states and other stakeholders to ignore their past positions and grievances and negotiate a river management approach that works on the river we have today, even if that means changes to the foundation of the Law of the River, the 1922 Compact.
MEXICO OBLIGATION
The different interpretations of the Upper Basin’s delivery obligations to Mexico under Article III(c) are well understood throughout the Basin. III(c) says that water for Mexico should be provided from “surplus”. If there is no surplus, the Upper and Lower Basins much each provide half the necessary water. But there has never been agreement on what that language means in practice. This unresolved uncertainty has enormous implications for how much water is available to each basin in the future.
The Lower Division States take the position that there’s no current “surplus,” as defined by Article III (c), thus the Upper Division States must deliver at Lee Ferry 50% of however much water is required to be delivered under the Treaty. The annual delivery is normally 1.5 maf/year, but under either the “extraordinary drought” provision of the Treaty, or Minutes, it could be less. In 2023, it was 1.4 maf.
The Lower Division States’ position would dictate an average annual delivery of 8.25 maf/year at Lee Ferry, 7.5 maf under Article III(d) + 750,000 af under Article III(c). The 8.25 maf includes an average contribution of 20,000 af/year from the Paria River and would be adjusted for the occasional annual delivery of less than 1.5 maf. Veterans of the negotiations that led to the 2007 Interim Guidelines will recall that Arizona’s Herb Guenther always brought with him to the meetings a posterboard sign with “8.25” written on it.
Going back to the 1970 decision by the Secretary of the Interior to set the “minimum objective release” from Glen Canyon Dam at 8.23 maf/year, the Upper Division States have consistently taken the position that their annual obligation Mexico has never been formally defined and, whatever it is, it is not 750,000 af/year, every year. While they vigorously complained, they never chose to formally challenge the issue in court or in Congress, perhaps because they concluded that they couldn’t show that any of their interests were injured. Today, based on post-2000 hydrology, that dynamic may have fundamentally changed.
The basic position of each basin has not changed. If anything, because the stakes are much higher, the positions have hardened. In a December 20, 2022, scoping letter to Reclamation, Arizona’s Tom Buschatzke, and Ted Cooke, wrote: “Article III(d) and (c) prohibits the Upper Division States from depleting the flow of the river at Lee Ferry below a rolling 10-year aggregate of 75 maf plus one-half of the Mexico delivery obligation. With reduced releases from Glen Canyon Dam potentially analyzed under the SEIS, if the 10-year rolling aggregate falls below the required aggregate volume, the Upper Division States could be subject to a “Compact call” that would require a reduction in consumptive use in the Upper Basin. In footnote 1, they add “A “surplus” currently does not exist because natural flows in the Colorado River have not exceeded 16 maf in the past 10 years.” In their August 15, 2023, scoping letter, the three Lower Division States write: “The Post-2026 EIS must analyze whether alternatives are consistent with the 1922 Colorado River Compact non-depletion obligations and delivery obligations to Mexico. Alternatives should include actions necessary to ensure compliance with such obligations.”
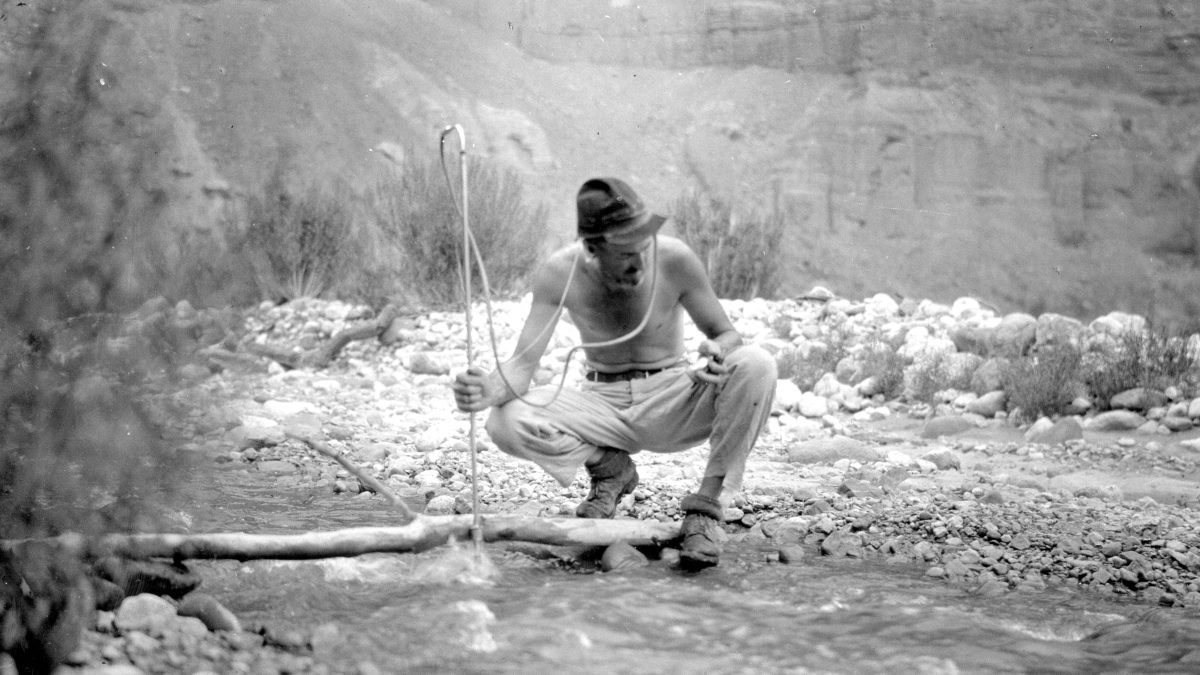
Eugene Clyde LaRue measuring the flow in Nankoweap Creek, 1923. Photo credit: USGS
The Upper Division States are equally adamant that because of overuse in the Lower Basin, they currently have no annual obligation to Mexico under Article III(c). Note that I used the term “Lower Basin” because under the 1922 Compact, the Lower Basin includes the upper Gila River in New Mexico, where uses are small, Kanab Creek in Utah and Arizona, again uses are small, and the Virgin River, shared by Nevada, Arizona, and Utah, where uses are not small. The Virgin River is the water supply for the rapidly growing St. George area. As a state, Utah consumes the second largest amount of Lower Basin tributary water, about 150,000 af/year, albeit much less than Arizona.
In recent public presentations, Colorado Commissioner Becky Mitchell has stated that the Lower Basin’s total annual use, including tributaries and reservoir evaporation, were 10.5 maf in 2020, 10.8 maf in 2021, and 10.4 maf in 2022, far more than the Lower Basin’s compact apportionment (7.5 maf under Article III(a) plus 1.0 maf under Article III(b)). Their position is that the Lower Basin’s overuse is “surplus” water that must first be used to meet the 1944 Treaty obligations to Mexico before the Upper Division States have any obligation to Mexico, a position the Lower Division States do not agree with.
The situation is messy. As I explain below, Mitchell’s 10-plus million acre foot calculation is based on analysis that contains a hidden assumption about the correct way to measure water use, an assumption at odds with the method the Upper Basin has traditionally used to measure its own water use. But when one peels back the layers, it’s even messier. First, there is no agreement on whether the obligation of the Upper Division States to Mexico is calculated on an annual basis, a ten-year rolling aggregate basis, or something else (I’m in the something else camp). The predominant position the Upper Division States is, as mentioned in John’s comments, that the since the 1944 treaty provides for an annual delivery to Mexico (which can change), therefore, the obligation of the Upper Division States is determined annually. As can be seen by the language in the Arizona and Lower Division States letter, the Lower Basin states’ position is based on a ten-year rolling aggregate. The logic of this position is that the last sentence of Article III(c) states: “whenever necessary the States of the Upper Division shall deliver at Lee Ferry water to supply one-half of the deficiency so recognized in addition to that provided in paragraph (d).” Paragraph (d) is a ten-year requirement; does it make sense to add an annual requirement to a ten-year requirement? Further, the data necessary to determine whether a deficiency exists (and thus the obligation of each basin) would not be available until well after the water year is over.
My reading of the reports of the compact commissioners, their Congressional testimony, and the minutes of both the 1922 and 1948 suggests a third possible alternative. The negotiators of the 1922 Compact, the 1944 Treaty, and the 1948 Compact considered the surplus to be the difference between the average long-term natural flow of the river at the international boundary and 16 million acre-feet, the aggregate of the apportionments made by Articles III(a) and III(b). During the negotiations of the 1948 Compact, Colorado’s Royce Tipton and Arizona’s Charles Carson laid out the logic. Based on the comprehensive hydrologic analysis conducted by Reclamation (Appendix I of the 1947 Comprehensive Report), the estimated long-term natural flow below the confluence of the Colorado and Gila Rivers was 17.7 maf/year. Subtracting 16 maf left an average surplus of 1.7 maf, 1.5 maf for Mexico and about 200 kaf for surplus uses within the United States. Upper Division State officials argued that with this hydrology there was no deficiency. Colorado’s Tipton and Clifford Stone (its 1948 Compact Commissioner), however, did acknowledge that the location of the surplus was an important factor.
With their 1940s understanding of the river hydrology, the Upper Division States did not want the deficiency calculated either on an annual basis or a ten-year running average. They understood that in both cases, they would be required to deliver more water to Mexico than using the long-term average. Under an annual determination, there would be many years (~50%) when there was a deficiency. Under the ten-year rolling average, there would be long periods when it would be below 16 maf/year and there would be a deficiency (the 1930s drought period for example) but provided the long-term average was more than 17.5 maf/year, there would be no deficiency. Tipton also made the point that in the future, the construction of additional storage reservoirs (like Lake Powell) would effectively “equate” the river. Today’s problem with this approach is that in the 1940s, the basin’s water managers assumed a level of “stationarity” (future river flows can be predicted by what happened in the past) that because of climate change does not exist today.
An additional problem we have today is the calculation of the deficiency is based on the natural flow at the international border with Mexico, not Lee Ferry. Note that the Arizona letter states, “natural flows in the Colorado River have not exceeded 16 maf/year.” That statement is very likely true, but there are no data to back it up. Unlike Lee Ferry, there are no recent calculations of annual natural flows at the international border. There is no Colorado River system natural flow database. The existing database includes natural flows to Lee’s Ferry, but downstream to the Imperial Diversion Dam, Reclamation acknowledges that they have little confidence in these data and much of it is not based on reconstructed natural flows. Importantly, the existing natural flow database does not include the Gila River system.
The last widely published estimate of natural flows at the international border was completed by the Bureau of Reclamation nearly eighty years ago (Appendix I). These data were used during the 1944 Treaty ratification hearings and, to a lesser extent, by the 1948 Compact negotiators. Appendix I shows an average natural flow at the border of 17.72 maf/year. At Lee Ferry, it was 16.41 maf/year (based on1898-1943). Assuming a similar relationship between the flows today, from 2000-2023 the estimated natural flow at the border, including the Gila, would be approximately 13.5 maf/year (12.44/16.41 x 17.72). Note, because of climate change, which appears to have a greater impact on the southern tributaries of the Colorado River system, the relationship may no longer be reasonable.
Gila River watershed. Graphic credit: Wikimedia
Updating the natural flow database to include the Gila River has been suggested by Upper Division State officials, but Arizona has historically objected. Clearly this would not be an easy task and there would be large uncertainties, especially estimating with any certainty natural losses on the Colorado River below Hoover Dam and on the Gila River from the Phoenix area to Yuma under today’s climatic conditions.
LOWER BASIN TRIBUTARY USE
The Gila River is also the central subject of John C.’s second comment that Arizona, California, and Nevada should be concerned that including mainstem consumptive uses, tributary consumptive uses (including those in Utah and New Mexico), reservoir evaporation, and maybe system losses, the Lower Basin total consumptive uses exceed its compact apportionment of 8.5 maf/year. Alternatively, Lower Basin tributary consumptive uses far exceed 1.0 million acre-feet – if one believes Article III(b) was intended to only cover Lower Basin tributaries. The problem with this argument is that there is no 1922 Compact definition of “beneficial consumptive use” (the “commodity” the Compact apportions). This is especially important for the Lower Basin tributaries.
There are different interpretations among the states and between the basins of how “beneficial consumptive use” should be defined and therefore measured. Each has a strong legal argument in its favor. But their approaches result in vastly different numbers, and as my co-author John Fleck has written, “There’s not enough water for all the lawyers to be right.”
Article VI of 1948 Compact defines and provides a method measuring compact apportionments for the Upper Basin. The 1964 decree in Arizona v. California defines how to measure the mainstem apportionments made to the Lower Division States under the 1928 Boulder Canyon Project Act. Since the 1963 decision did not interpret the 1922 Compact and there is no Lower Basin Sub-Compact, there is no accepted or defined method for measuring 1922 Compact apportionments on the Lower Basin tributaries (and arguably the entire Lower Basin). The methods used by the 1948 Compact and the 1964 Decree are very different. The 1964 Decree uses the concept of “diversions minus return flows.” It comes from the language of the Boulder Canyon Project Act. Stream losses and reservoir evaporation from Hoover Dam to the points of diversion are not considered a use, but rather a limitation on the available supply.
September 21, 1923, 9:00 a.m. — Colorado River at Lees Ferry. From right bank on line with Klohr’s house and gage house. Old “Dugway” or inclined gage shows to left of gage house. Gage height 11.05′, discharge 27,000 cfs. Lens 16, time =1/25, camera supported. Photo by G.C. Stevens of the USGS.
Source: 1921-1937 Surface Water Records File, Colorado R. @ Lees Ferry, Laguna Niguel Federal Records Center, Accession No. 57-78-0006, Box 2 of 2 , Location No. MB053635.
The 1948 Compact approach for defining and measuring consumptive use under Article VI is based on what was referred to as the “stream depletion” theory. Consumptive uses for the Upper Basin and for the individual states are measured as the net impact of man-made depletions on the natural (AKA virgin) flow of the Colorado River at Lee Ferry using the “input-output” method. The 1948 Compact gives the UCRC the authority to change the method by unanimous approval. The UCRC has instructed its staff to identify an alternative to the input-output method, so this may happen soon. Article VI was one of the most debated and carefully written articles in the 1948 Compact. The negotiators had a clear objective in mind. They wanted to carefully define how to measure compact apportionments so that water made available for consumption through “salvage by use” would not count as compact apportioned use.
The issue of salvaged water was a major dispute among the basin states in the 1940s and 1950s. Simply put, salvaged water is water made available for use by the reduction of natural losses caused by the development of the river. The best example of salvage by use is Arizona’s Gila River. As the Gila River and its two major tributaries, the Salt and Verde Rivers, leave the rim country upstream of Phoenix, they have a combined average natural flow of over 2.0 maf/year (2.3 according to the 1947 report). As the river flows to its confluence at Yuma, in its natural state it loses about 1.0 maf/per year. By diverting and using the entirety of Gila River’s waters upstream, these losses are eliminated. Thus, Arizona can consume a million af/year more water than what the Gila River contributes to the natural flow of the Colorado River system. Under the “stream depletion” theory, which was favored by Arizona and the Upper Division States, Arizona is only charged for a million acre-feet of 1922 Compact apportionment. Under California’s “diversions minus return flows” theory, also favored by Nevada, all 2+ maf/year of Arizona’s Gila River consumptive use would be charged as 1922 Compact apportionment.
The Upper Basin adopted the stream depletion theory during an era when the states were competing for every acre-foot possible. They thought could benefit by 400,000 -600,000 af per year. Simply put, in years when the water was physically available, the Upper Basin could consume 7.9 – 8.1 maf/year while only depleting the natural flow of the river at Lee Ferry by 7.5 maf/year (their compact apportionment). The negotiators never contemplated that 75 years later, the water available to the Upper Basin would be far less than 7.5 maf.
During the negotiations of the 1948 Upper Basin Compact, the decision to use the stream depletion theory was thoroughly debated. Wyoming’s legal advisor, W. J. Wehrli, warned the other states that using this definition would benefit the Lower Basin far more than the Upper Basin. Additionally, he noted that it could reduce the amount of surplus water under Article III(c), potentially increasing the obligation of the Upper Division States to Mexico. Wyoming ultimately fell in line and agreed to the Article VI definition. During the Congressional debate over the authorization of the Central Arizona Project, Upper Division State officials (primarily Tipton and Stone) testified in favor of the stream depletion theory, arguing that the negotiators of the 1922 Compact intended this method to measure apportionments. Note, the compact does not include a definition of “beneficial consumptive use,” they made their case based on an analysis of the minutes and the use of the term “depleted” in Article III(d).
The structural deficit refers to the consumption by Lower Basin states of more water than enters Lake Mead each year. The deficit, which includes losses from evaporation, is estimated at 1.2 million acre-feet a year. (Image: Central Arizona Project circa 2019)
The Upper Division States make a rhetorically powerful public argument that in the face of climate change, overuse in the Lower Basin is the central problem in the Colorado River Basin that must be solved to reach a sustainable future where water use, and the available supply are in balance. The argument is that when mainstem uses, reservoir evaporation, system conveyance losses, and tributary consumptive uses (in Arizona, Nevada, New Mexico, and Utah) are added together, the Lower Basin’s total use exceeds ten maf/year, perhaps as high as eleven maf/year. The Lower Basin’s compact apportionment, however, is only 8.5 maf/year (perhaps 7.5 maf/year depending on how Article III(b) is interpreted), resulting in an overuse of at least 1.5 maf/year. Such an overuse has major policy implications:
If the Lower Basin is overusing its compact entitlement, why should the Upper Basin, which is using far less than its apportionment, reduce its uses to help bring the system into balance?
Should the Lower Basin’s overuse be considered “surplus” water under Article III(c)? If so, should this surplus water be delivered to Mexico before the Upper Division States have any obligation to deliver half of the deficiency to Mexico?
These two questions have implications for Mexico, if the Lower Basin is overusing its compact apportionment, why should Mexico reduce its annual use?
The problem with the Upper Basin’s argument is that it’s based on the diversions less return flow theory. If the Lower Basin’s uses are calculated based on the stream depletion theory – the methodology the Upper Basin adopted in its own 1948 Upper Basin Compact, uses may not be greater than 8.5 maf/year.
Stream Depletion
Diversions less Return Flows
Mainstem uses (a)
6.6 maf/year
6.6 maf/year
Reservoir Evaporation (b)
0.5 maf/year
0.86 maf/year
System Losses (c)
0
0.45 maf/year
Tributary Uses (d)
1.2 maf/year
2.2 maf/year
Total
8.3 maf/year
10.1 maf/year
Explanation:
a) Mainstem uses (deliveries from Hoover Dam) are very similar under both theories. Almost all mainstem uses are either fully consumptive or located low in the system. The average mainstem use by the Lower Division States over the last five years (2019-2023) is approximately 6.6 maf/year.
b) Under diversions less return flows the 0.86 maf/year is the average evaporation (2017-2021) from the December 2023 Reclamation study. Under the stream depletion theory, reservoir evaporation is calculated as surface evaporation less the natural losses in the inundation area that would have occurred had the reservoir not been built. This is how evaporation on Lake Powell is calculated. I estimated natural losses as .36 maf/year.
c) The 0.45 maf/year is from the December 2023 Reclamation study. Under the stream depletion theory, system losses are offset by salvaged water. As a practical matter, we have no idea how much salvaged water is currently generated on the mainstem below Hoover Dam, but we do know that the channel is much smaller today than it was before development. In 1945 during the Mexican Treaty ratification hearings, Colorado’s Royce Tipton estimated the number to be 400,000 af/year. I’ll assume they offset.
d)Under diversion less return flows, tributary uses are 2.2 maf/year, the latest data from the 2001-2005 Consumptive Uses and Losses and Report. Under the stream depletion theory, it’s reduced by 1.0 maf/year, the estimated salvage on the Gila River from the 1947 study. Because of climate change, losses today may be greater, but no data are available.
Thus, using the diversions less return flows theory, the Lower Basin is clearly using more than 8.5 maf/year, but under Upper Basin’s own stream depletion theory, it is not. Since the 1922 Compact neither defines nor prescribes a way to measure “beneficial consumptive use,” the basic question – “is the Lower Basin overusing its compact apportionment?” simply cannot be answered. [ed. emphasis mine]
These disputes also point to the fundamental flaw with the states’ talking point that the 1922 Compact, the 1948 Upper Basin Compact, and the Mexican Treaty will serve as the foundation of the post-2026 operating rules. There is no agreement on what they say or mean. As the states continue their discussions with the goal of agreeing on a state proposal, they need to consider addressing the disputed compact issues in a straight-forward manner. Leaving these critical uncertainties for future generations to handle (like we have in the past) is no longer possible and asking the Supreme Court for a resolution will likely make matters worse, not better.
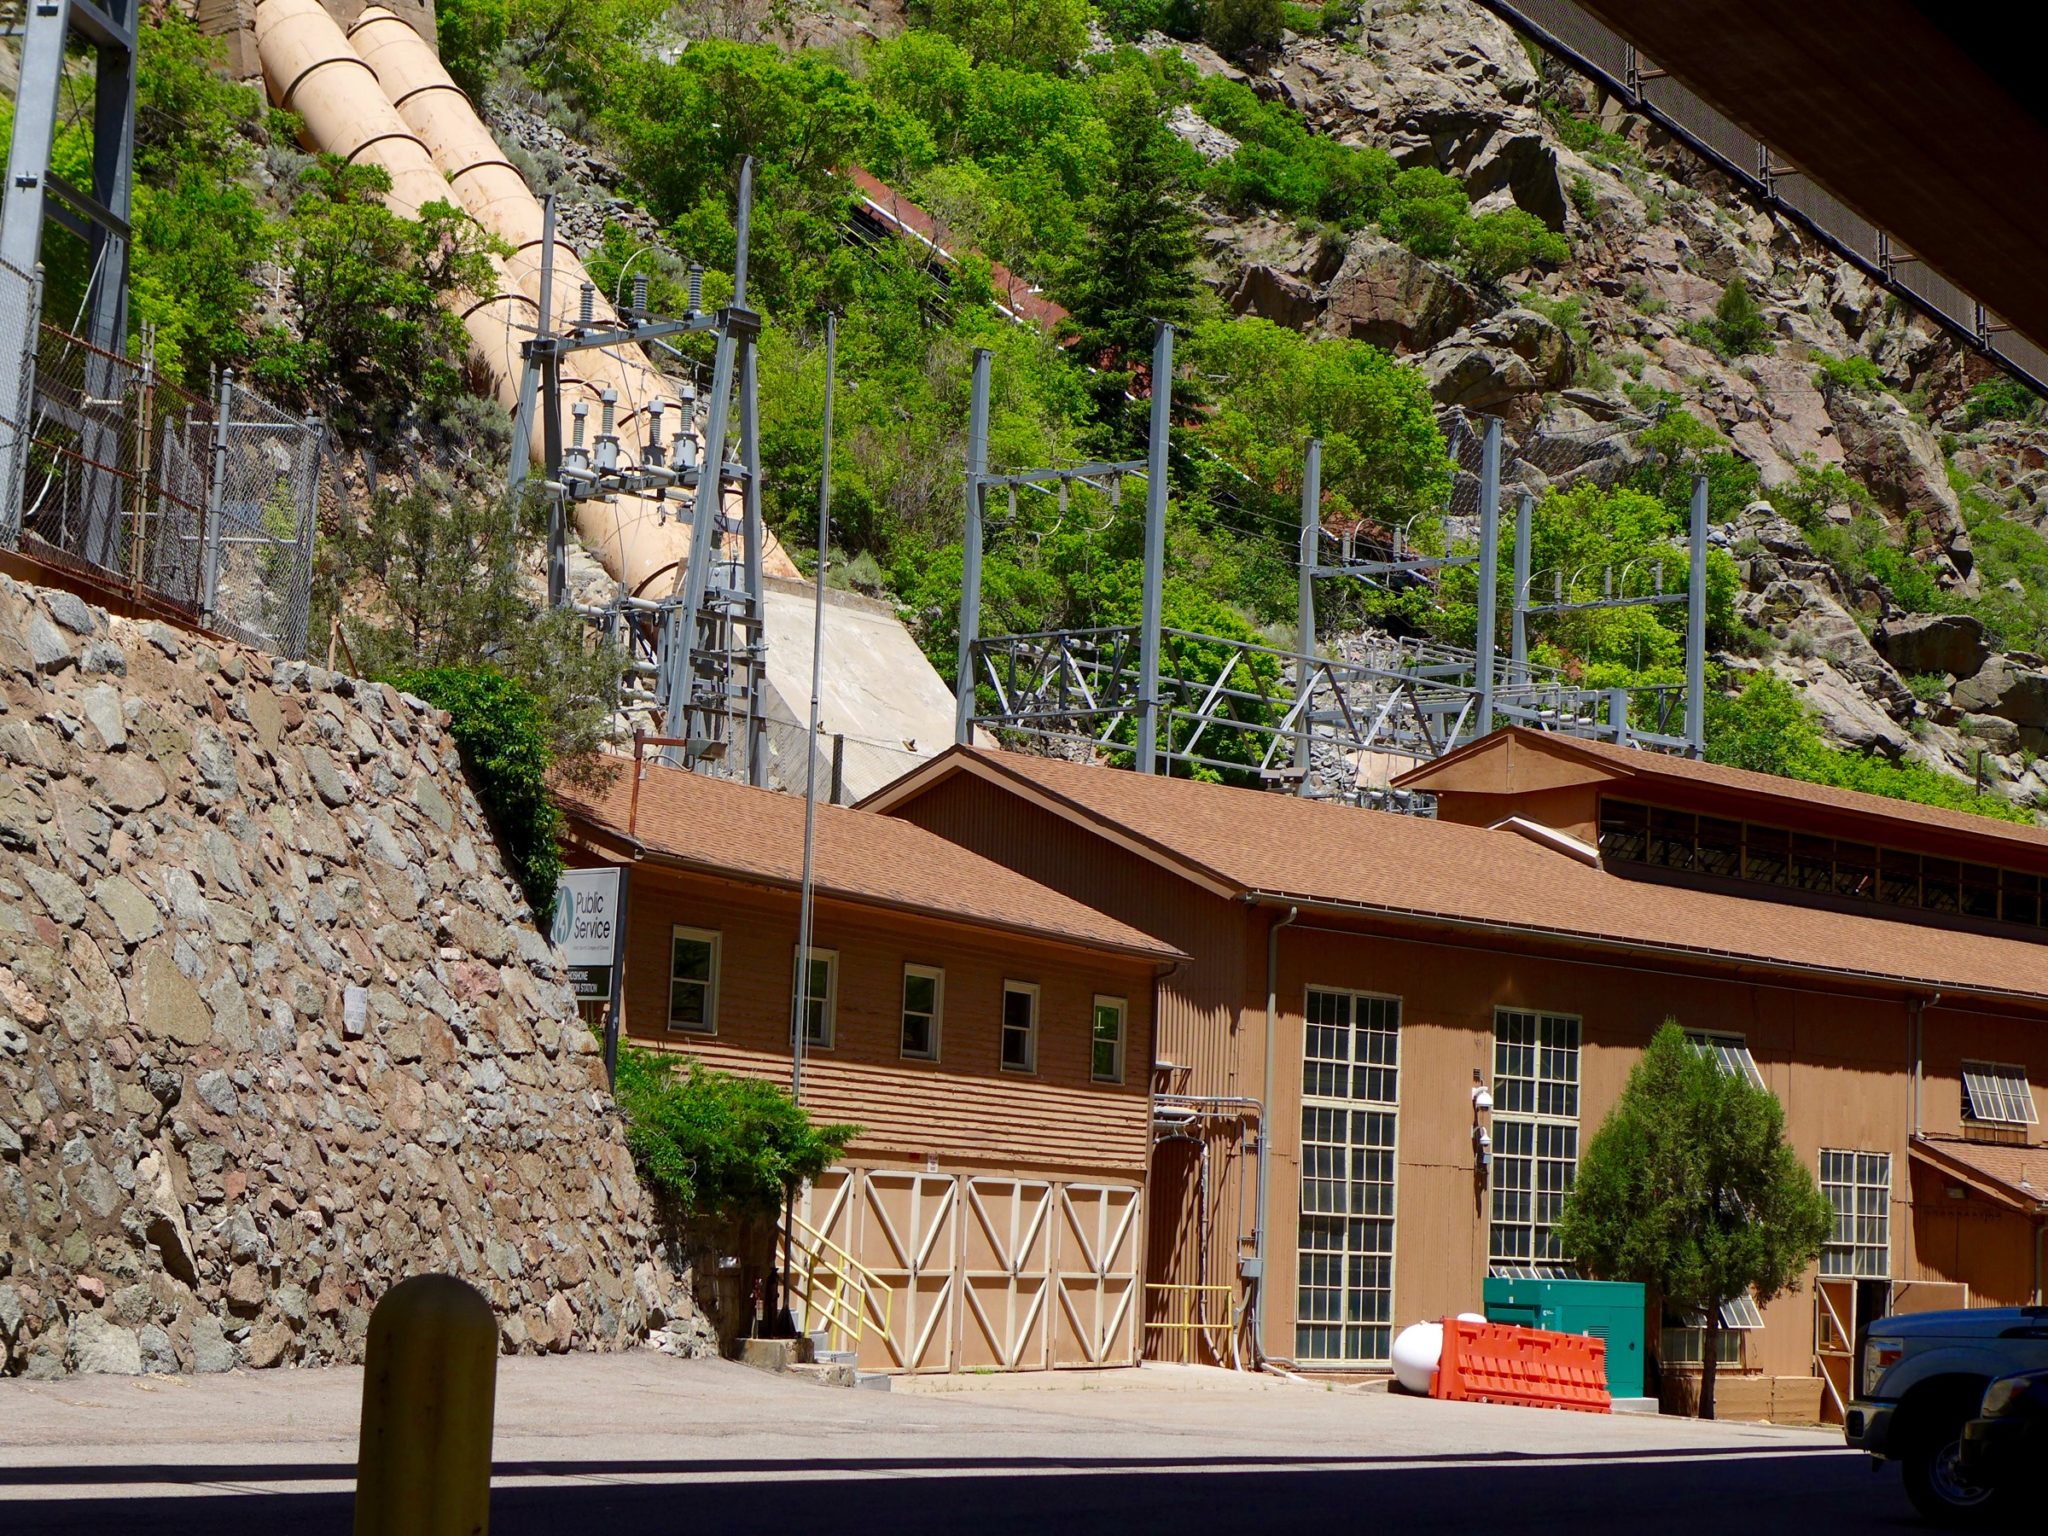
The Shoshone hydropower plant in Glenwood Canyon has one of the oldest non-consumptive water rights on the main stem of the Colorado River and that right is in the process of being acquired by the Colorado River Water Conservation District. Pitkin County is exploring potential impacts the deal might create for the upper Roaring Fork River. CREDIT: BRENT GARDNER-SMITH/ASPEN JOURNALISM
An historic deal to put a senior water right in the hands of the Colorado River Water Conservation District has been celebrated as a victory for the Western Slope. But Pitkin County officials say there’s a chance it could harm the upper Roaring Fork River.
In December, the Glenwood Springs-based River District signed a deal with Xcel Energy to buy water rights associated with the Shoshone hydropower plant in Glenwood Canyon for $98.5 million. As some of the biggest and oldest non-consumptive water rights on the mainstem of the Colorado River, they ensure water keeps flowing west to the benefit of downstream users because the water runs through Shoshone’s power-generating turbines and then returns to the river.
Pitkin County’s concerns have to do with the complex interaction of the Shoshone water rights with another set of big downstream water rights known as Cameo, which are made up of Grand Valley irrigation water rights. These two senior water rights have the ability to command the flow of the Colorado River and force Front Range cities that send water from the Colorado’s headwaters across the Continental Divide to shut their diversions off.
Under Colorado’s cornerstone of water law, known as prior appropriation, oldest rights get first use of the water. When a senior water right isn’t receiving its full amount, it can place a “call.” When Shoshone, which dates to 1902, places a call, transmountain diverters like Denver Water and Northern Water have to shut off. When Cameo places a call, the Twin Lakes Reservoir and Canal Co., which takes water from the top of the Roaring Fork basin to Colorado Springs, Pueblo and Aurora, has to shut off because its 1930s water rights are junior to Cameo’s 1912 water rights.
About 600 cfs of water from the Roaring Fork River basin flowing out of the east end of the Twin Lakes Independence Pass Tunnel on June 7, 2017. Photo: Brent Gardner-Smith/Aspen Journalism
Pitkin County’s concern is that with Shoshone under new ownership — and the proposed addition of an instream flow use for the water along with hydropower — the call for the water through Glenwood Canyon could be on more often, which might delay or reduce the need for the Cameo call. Aspenites like to see the Cameo call come on because it forces the Twin Lakes diversion to shut off, which means more water flowing down the Roaring Fork, typically during a time of year in late summer and early fall when streamflows are running low and river health is suffering.
“The upper Roaring Fork lives and dies on the Cameo call because that’s what curtails Twin Lakes,” Pitkin County Attorney John Ely, who sits on the River District’s board, said in an interview with Aspen Journalism. “If the Cameo call is changed through administration of the river because there is a change in the flow going to satisfy Shoshone, then that could delay Cameo, which would prolong the operation at Twin Lakes and deplete the upper Fork.”
Pitkin County in November hired Golden-based engineering firm Martin and Wood Water Consultants to do a technical analysis and modeling of the Colorado and Roaring Fork rivers. They bill in monthly installments and have charged Pitkin County $6,600 so far, according to Ely; the firm is expected to produce a report after they finish studying the issue, although Ely did not say when that would be.
Graphic credit: Laurine Lassalle/Aspen Journalism
Health of Roaring Fork dependent on Cameo
The River District has said the goal of owning the Shoshone right is to preserve the status quo and keep water flowing west the same way it always has. Xcel representatives have said they intend to keep operating the plant for hydropower, but the facility is old, frequently offline for repairs and located in a treacherous area of Glenwood Canyon.
Ely isn’t so sure that nothing would change. If the Colorado Water Conservation Board (CWCB) was to place a Shoshone instream flow call, it could alter the way the system has historically operated, he said. The CWCB is the only entity allowed to hold an instream flow water right, which is intended to preserve the natural environment to a reasonable degree.
“If it wasn’t going to change the administration of the river, why would anyone pay $98 million for it? … The potential for injury (to the Roaring Fork) is most definitely there,” he said.
River District General Counsel Peter Fleming said the organization is working with Pitkin County to look into the issue.
“The question has arisen and we’re working in good faith with the county to identify and resolve any concerns,” he said. “We’re going to determine whether there is an actual issue that we can accommodate.”
The Cameo call comes on most years in late summer. But it occurs for more days in dry years than wet ones. According to a database maintained by the Colorado Division of Water Resources, in 2019 and 2023 — both years with above-average snowpack and runoff — the Cameo call was on for 22 and 24 days, respectively. In 2020 and 2021 — two back-to-back below-average years — Cameo called for 88 and 75 days, respectively.
The health of the upper Roaring Fork may be more dependent on the Cameo call in drought years.
Wendy Huber is board chair of Pitkin County Healthy Rivers, a taxpayer-funded organization focused on maintaining and improving water quality and quantity in the Roaring Fork watershed that doles out grants and advises the board of county commissioners. She said Healthy Rivers needs more information from engineers about the impacts from any changes to Shoshone on the Cameo call.
“The Cameo call may allow more water to remain in the Roaring Fork to satisfy the call,” Huber said. “We need to understand the potential impact on quantity of water in our Roaring Fork Valley rivers, especially the Roaring Fork and Crystal rivers.”
Ely said he is optimistic Pitkin County will reach a resolution with the River District, at which point the county would be in a position to support the Shoshone permanency campaign. The River District has committed $20 million from its own pocket, and so far has secured $20 million in funding from the CWCB and $2 million from Grand Valley domestic water provider Ute Water Conservancy District toward purchasing the Shoshone rights. It is in the process of seeking funding from other entities in its 15-county district.
“Water is just simply too scarce a resource to not be mindful that you must protect your interests,” Ely said. “We’re not looking to get in the way of Eagle and Garfield and Mesa counties protecting themselves, but we don’t want to sacrifice our river for them to be able to do so.”


