
Click the link to read the article on the NOAA website (Tom Di Liberto):
February 8, 2024
On a brisk early February morning, all of us El Niño-Southern Oscillation (ENSO) forecasters emerged from our burrows and saw our shadows. That can mean only one thing: conditions are favorable for the development of La Niña within the next six months. Yes, the February ENSO Outlook officially announces that we are in a La Niña Watch, even while, at the current moment, the Pacific Ocean remains in an El Niño (this is simultaneous to the ongoing El Niño Advisory—here is an explainer to help sort it out). The outlook gives a 79% chance that El Niño will transition to ENSO-Neutral by the April–June period, and then a 55% chance the Pacific transitions into La Niña in June–August. Confused? I’ll explain it all without the help of any prognosticating rodents (take THAT, Punxsutawney Phil).

El Niño’s current status
Let’s start with the here and now. At the current moment, El Niño remains across the equatorial Pacific Ocean. In January, sea surface temperatures remained above average across most of the Pacific, though temperatures fell a bit across the eastern and central Pacific. Monthly values in the Niño-3.4 region (the key tropical Pacific monitoring region for ENSO and the basis for the Oceanic Niño Index (see below) dropped from just over 2°C above average in December 2023 to 1.87°C above average in January 2024. Overall, the most recent Oceanic Niño Index (ONI) value—how NOAA classifies the strength of events—for November–January places this event’s peak strength at ~2°C, or the fifth highest on records back to 1950 (**).
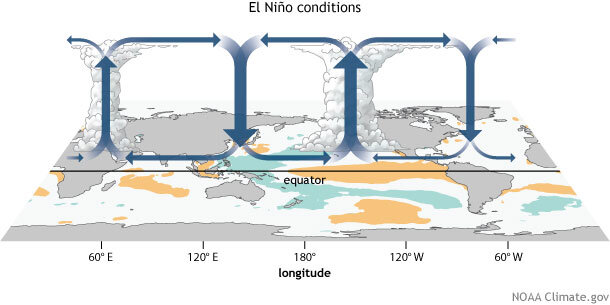
Atmospherically, El Niño weakened a bit as well over the last month. Remember, El Niño is an ocean-atmospheric phenomenon. During El Niño, the atmosphere over the tropics—the Walker Circulation—gets all jumbled up. The result in the Pacific is weakened trade winds, an increase in thunderstorm activity near the Dateline, and a reduction in thunderstorms across the Western Pacific (also, usually, across the Amazon). However, in January, the trade winds were closer to average across the equatorial Pacific, and while thunderstorm activity remained a bit elevated near the Dateline, it was instead closer to average across Indonesia in the western Pacific.
Put together, it looks clear that this El Niño event is past its peak. However, it’s important to remember that El Niño’s impacts on global temperature and precipitation can linger through April.
Is that all?
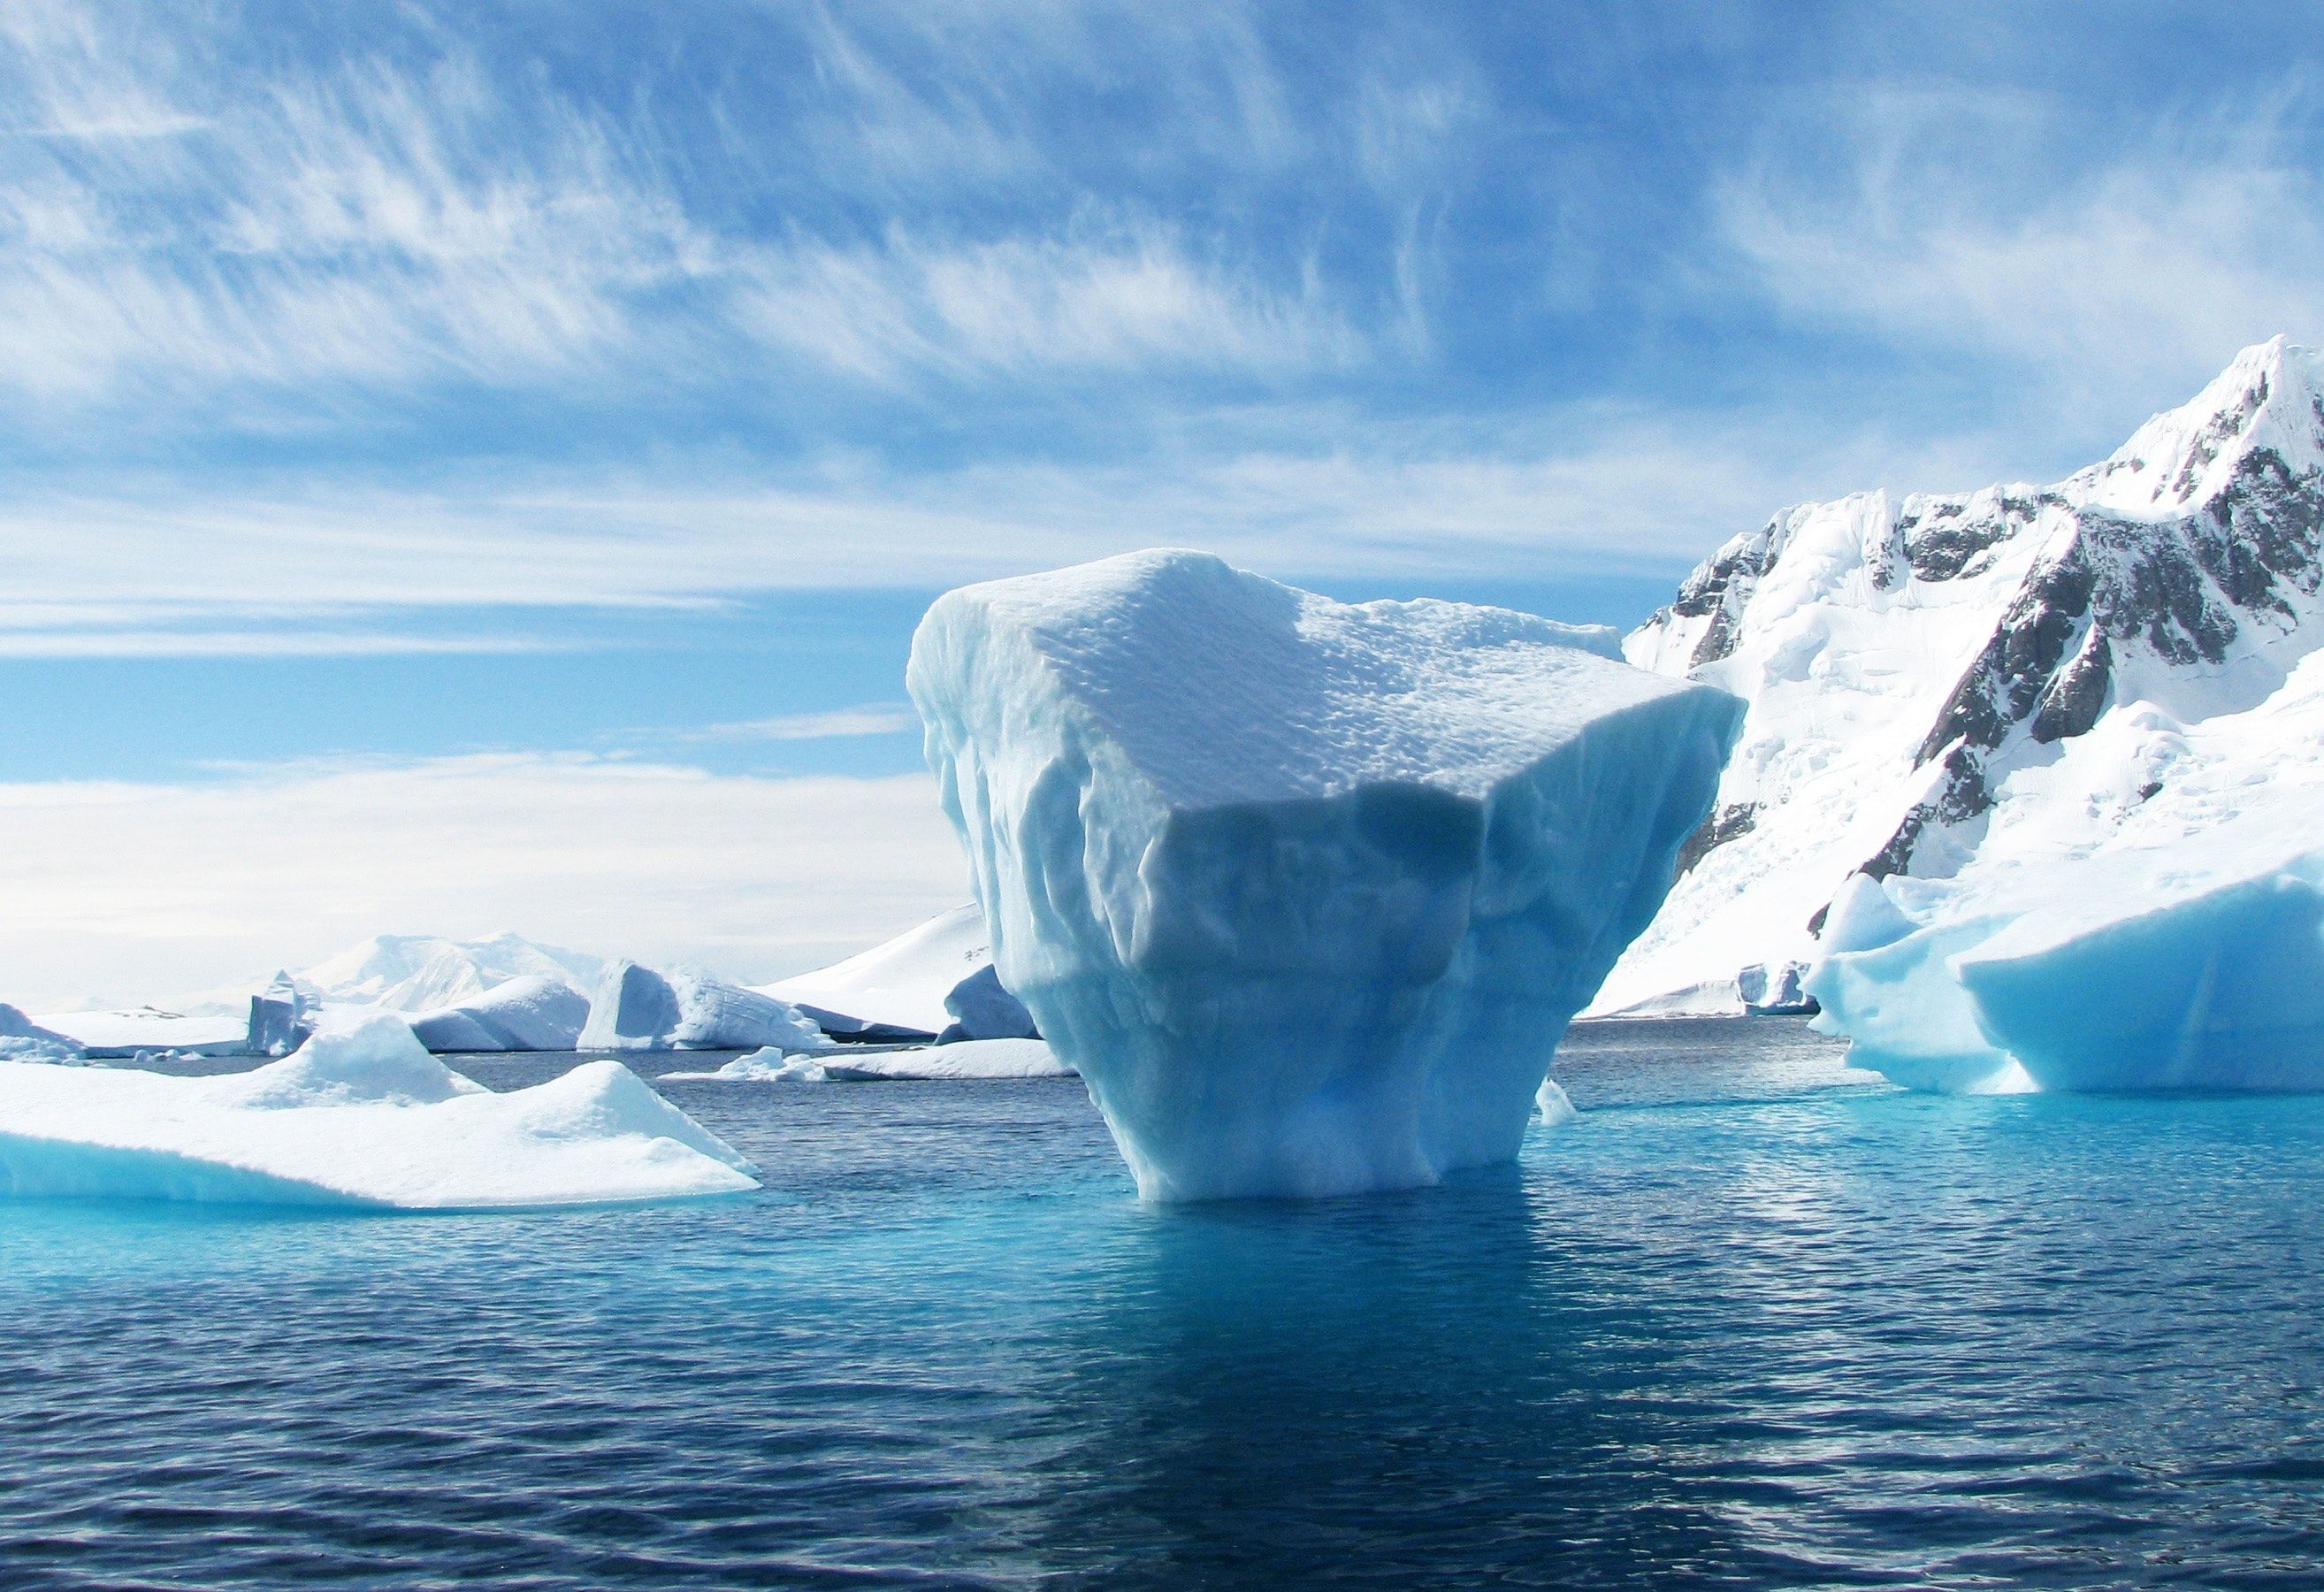
While everything I said above is all fine for the surface, the BIG story is happening underneath the sea surface in the Pacific. Averaged across the entire equatorial Pacific Ocean, ocean temperatures in the upper 300 meters returned to near-average for the first time in almost a year. And it’s clear that cooler-than-average ocean waters are widespread at depth and expanding eastward, even while above-average temperatures persist closer to the surface in the central/eastern Pacific.
Where is this all going?
That’s the million-dollar question. The seasonal prediction models that forecasters look to for guidance are pretty confident in a transition from El Niño to ENSO-neutral sometime during the northern hemisphere spring 2024. Following that, there is a general consensus among the models that La Niña will follow during the summer. Now when it comes to transitions, there is always a bit of uncertainty on the exact timing, as an El Niño can end in a hurry. After all, the current outlook has only a two-season difference between the end of El Niño (79% chance in April-June), and the start of La Niña (55% chance in June-August). And some of the influencers of that transition can be atmospheric patterns that are not forecastable this early on, like the Madden-Julian Oscillation or random weather events.
How common are transitions from El Niño to La Niña?
Going back to 1950, over half of the El Niño events were followed shortly thereafter by a transition to La Niña (after a brief period of time in ENSO-Neutral). So, it would not be at all uncommon to see this sort of potential outcome this year.
Breaking that down even more by looking at similar strong El Niños, five of the eight events since 1950 were followed by a La Niña. And that transition happened rapidly. Two years (1973 and 1998) had only one 3-month period of ENSO-Neutral conditions before switching to La Niña. Two years (1983, 2010) had two 3-month periods of ENSO-Neutral in between. And 2015 had three 3-month periods.
Suffice to say, the historical record suggests that if the equatorial Pacific moves from a strong El Niño into a La Niña, it doesn’t seem to waste its time.
We’ll keep our eyes on the Pacific for you to help narrow down when and how this El Niño will end. So check back with us next month!
Signed,
The most accurate mammalian weather/climate forecasters
** A pesky annoyance is the fact the 1965-66 El Niño also peaked at 2.0°C, but it did so only during the September-November and October-December seasons. By November 1965-January 1966, it was 1.7°C. So, if we rank just by November-January seasons, then the current 2023-24 event is ranked fifth. But if we rank by all near-winter seasons, then this event is basically tied for fifth.

Click the link to read the article on the Inside Climate News website (Katie Surma):
A first of its kind U.N. study by conservation scientists finds nearly half of internationally protected migratory species are on their way to extinction.
Humans are driving migratory animals—sea turtles, chimpanzees, lions and penguins, among dozens of other species—towards extinction, according to the most comprehensive assessment of migratory species ever carried out.
The State of the World’s Migratory Species, a first of its kind report compiled by conservation scientists under the auspices of the U.N. Environment Programme’s World Conservation Monitoring Centre, found population decline, a precursor to extinction, in nearly half of the roughly 1,200 species listed under the Convention on Migratory Species (CMS), a 1979 treaty aimed at conserving species that move across international borders.
The report’s findings dovetail with those of another authoritative U.N. assessment, the 2019 Global Assessment Report on Biodiversity and Ecosystem Services, that found around 1 million of Earth’s 8 million species are at risk of extinction due to human activity. Since the 1970s, global biodiversity, the variation of life on Earth, has declined by a whopping 70 percent.
Scientists and economists use complicated models to try to predict how fast the world can transition away from fossil fuels. The Washington Post analyzed 1,200 modeled pathways for the world to shift to clean energy and found that only four of them showed the world hitting the 1.5C target without substantially overshooting or using speculative technology (like large-scale carbon capture) that doesn’t yet exist. At this point, many experts believe that the economy is too stuck on fossil fuels to transition fast enough for 1.5 degrees.
Does that mean we’ll pass catastrophic tipping points?
That’s a more difficult question. Scientists don’t know exactly when certain tipping points — like the collapse of the Greenland ice sheet or the release of greenhouse gases from thawing permafrost — will occur. It’s very hard to predict and model these types of catastrophic changes.
And 1.5C isn’t a magic threshold; it’s not as though as soon as we pass that number, Antarctic ice sheets will collapse and ocean circulations will grind to a halt. But one thing is certain: For every tenth of a degree of warming, tipping points are more likely. Two degrees is worse than 1.9 degrees, which is worse than 1.8 degrees, and so on.
And at each tenth of a degree, the infrastructure and systems that the world has built — electric grids, homes, livelihoods — will become more strained. Our modern world simply was not designed for temperatures this high. At some level, the final temperature of the planet isn’t what matters most. It’s where countries can actually get carbon emissions to zero — and stop contributing to future warming altogether.
Click the link to read the article on The Washington Post website (Shannon Osaka). Here’s an excerpt:
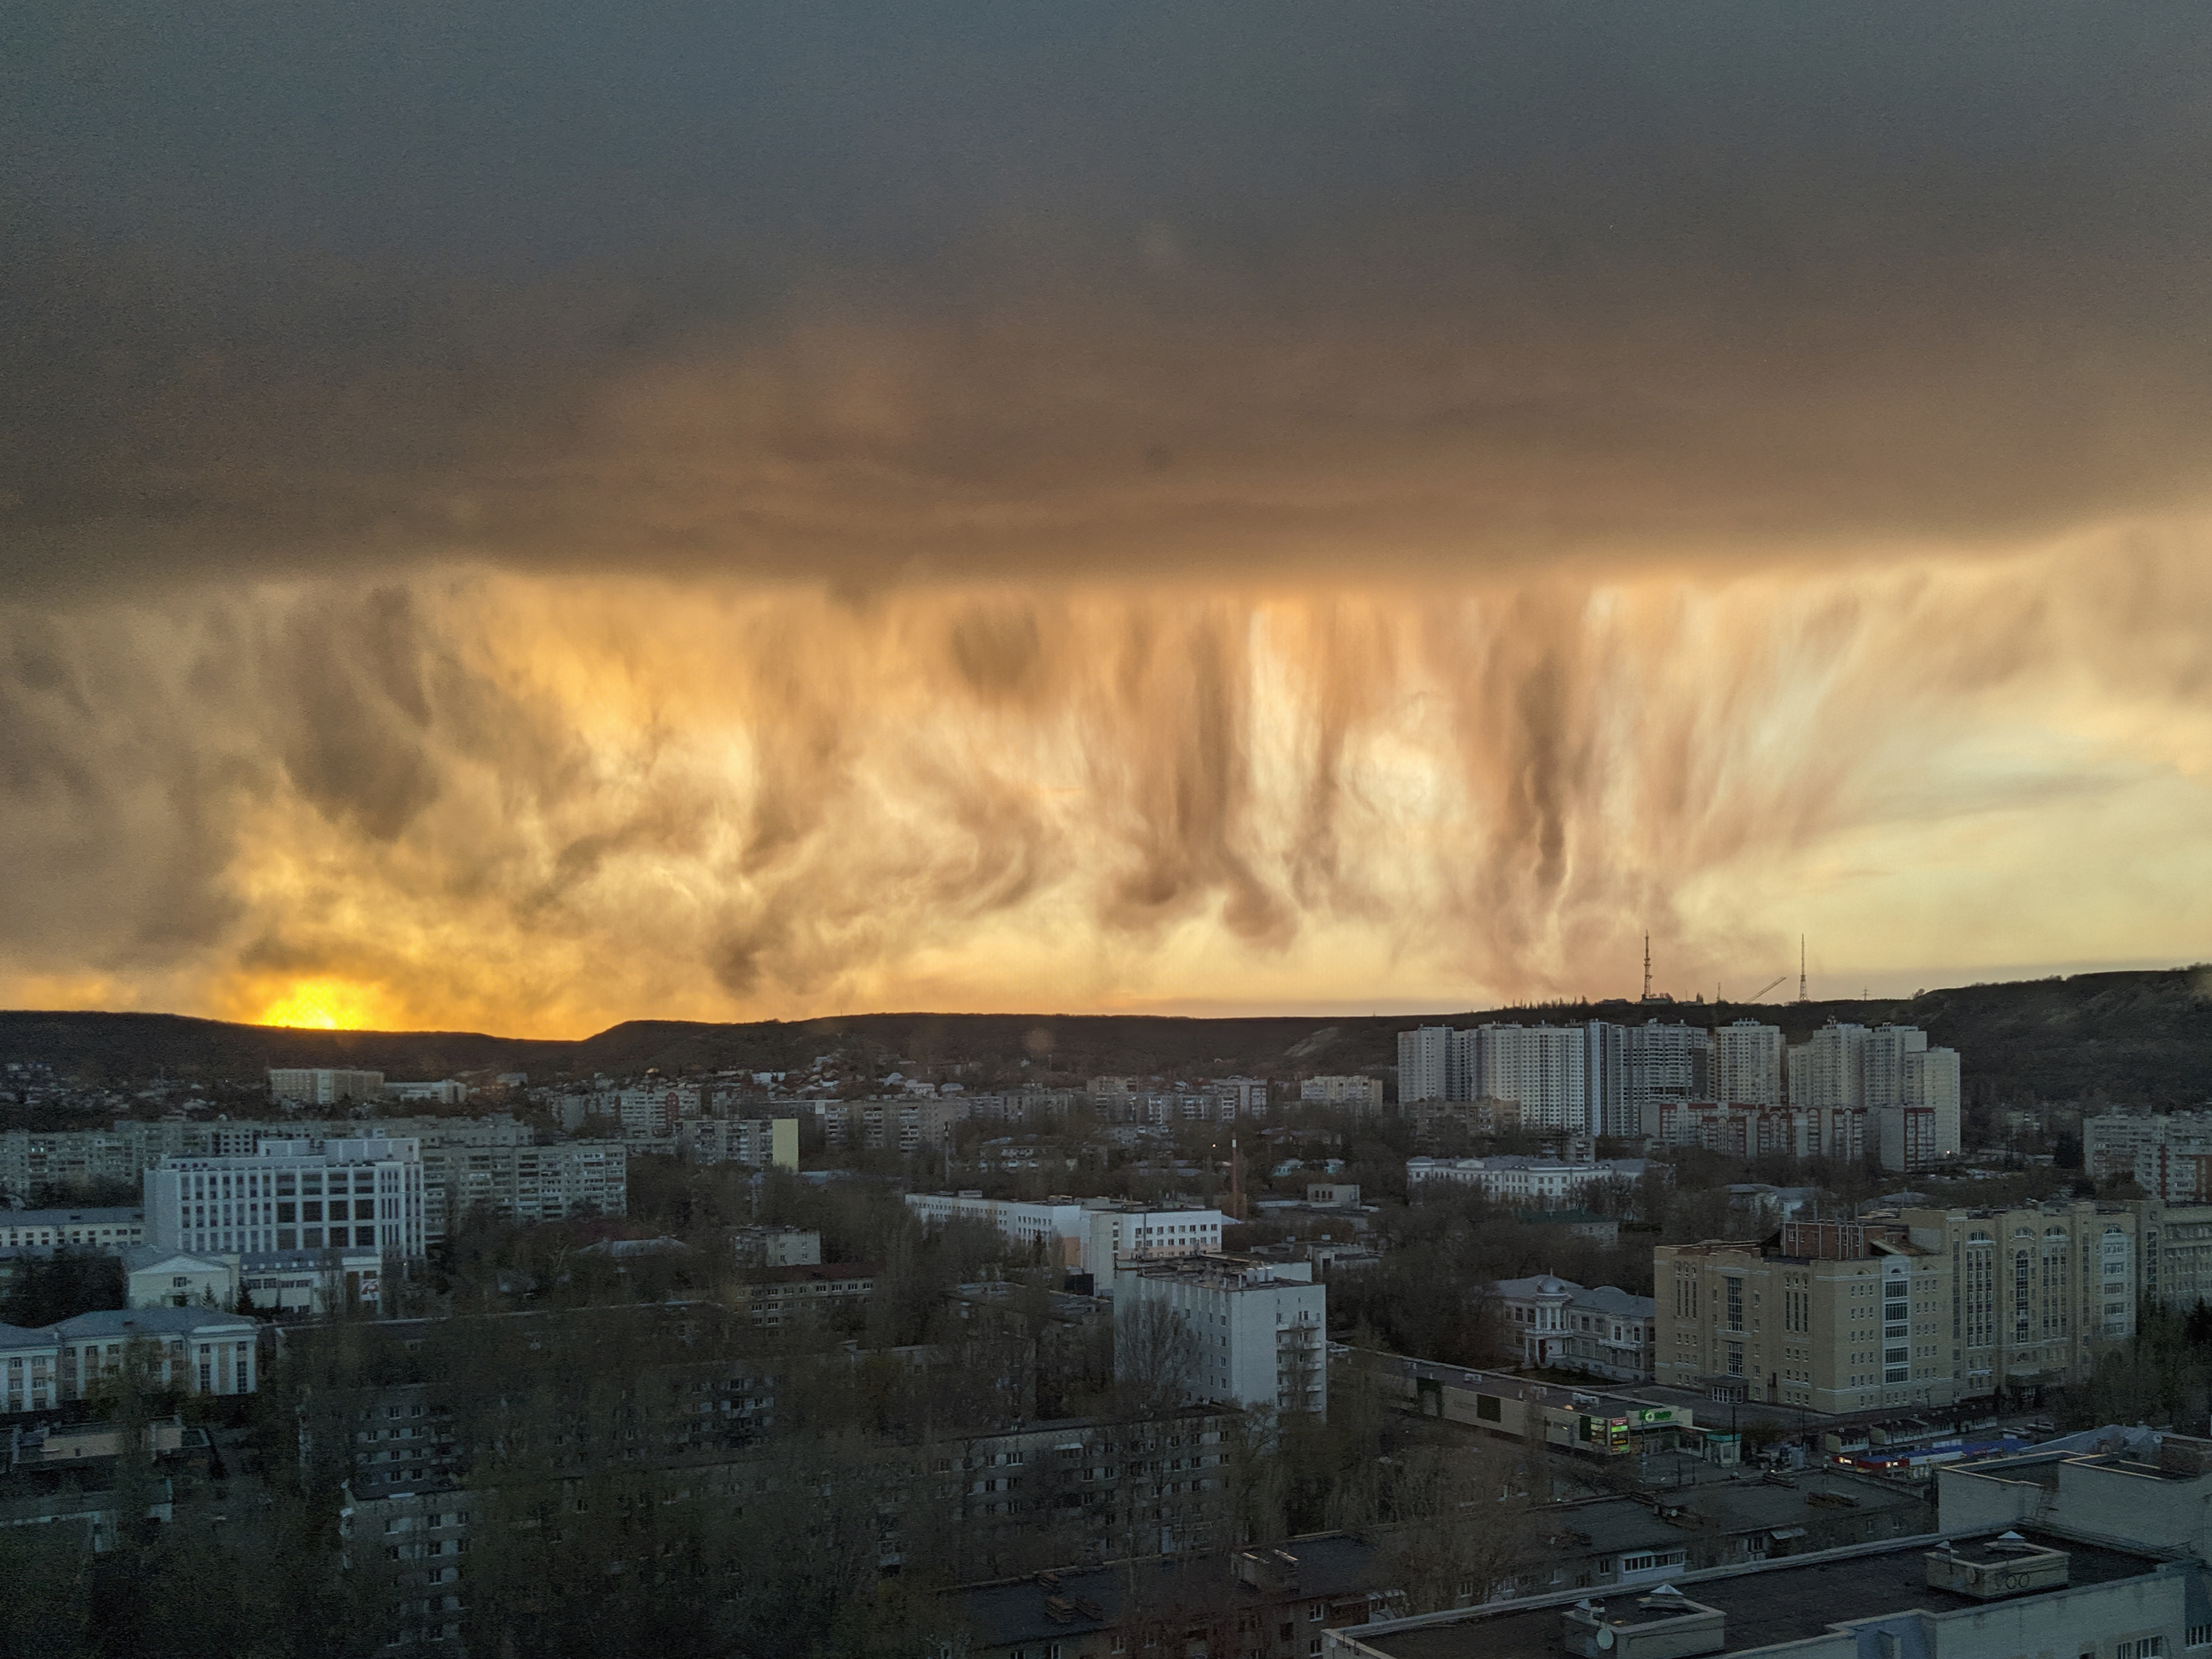
It’s official: For the past 12 months, the Earth was 1.5 degrees Celsius higher than in preindustrial times, scientists said Thursday [February 8, 2024], crossing a critical barrier into temperatures never experienced by human civilizations. According to the European Union’s Copernicus Climate Change Service, the past 12 months clocked in at a scorching 1.52 degrees Celsius (2.74 degrees Fahrenheit) higher on average compared with between 1850 and 1900. At some level, that’s not surprising — the past 12 months have been scorching, as a warm El Niño cycle combined with the signal of human-caused warming generated heat waves and extreme weather events around the globe.
“This El Nino maximum is riding on top of a base climate that is continuously warming due to climate change,” Andrew Dessler, a climate scientist at Texas A&M University, said in an email. “The combination of them is what’s giving us such hot global temperatures.”
But does this mean that the world’s most famous climate goal is out of reach? Not … exactly. Here’s what you need to know:
In the 2016 Paris climate agreement, almost 200 nations agreed to keep the global average temperature from exceeding 2 degrees Celsius (3.6 degrees Fahrenheit) above preindustrial levels — and to “pursue efforts” to keep it below 1.5 degrees Celsius. The latter addition largely came from pressure from small-island states, who are at risk of disappearing under rising seas if temperatures get much higher. Scientists have shown that holding the temperature rise to 1.5C could mean the survival of coral reefs, the preservation of Arctic sea ice and less deadly heat waves…
Does this mean we have missed the 1.5C climate goal? No. There’s actually some disagreement about what exactly counts as breaching that threshold — but scientists and policymakers agree that it has to be a multiyear average, not a single 12-month period. Scientists estimate that without dramatic emissions reductions, that will happen sometime in the 2030s. But there could be other single years or 12-month periods that cross the line before then.
Can we still avoid passing 1.5C? Most scientists say passing 1.5C is inevitable. “The 1.5-degree limit is deader than a doornail,” Columbia University climate scientist James Hansen said in a call with reporters late last year.