#Drought news February 22, 2024: Half an inch to locally 2 inches of precipitation fell this week over the #Colorado mountains into adjacent #Wyoming, and over western Wyoming

Click on a thumbnail graphic to view a gallery of drought data from the US Drought Monitor website.

Click the link to go to the US Drought Monitor website. Here’s an excerpt:

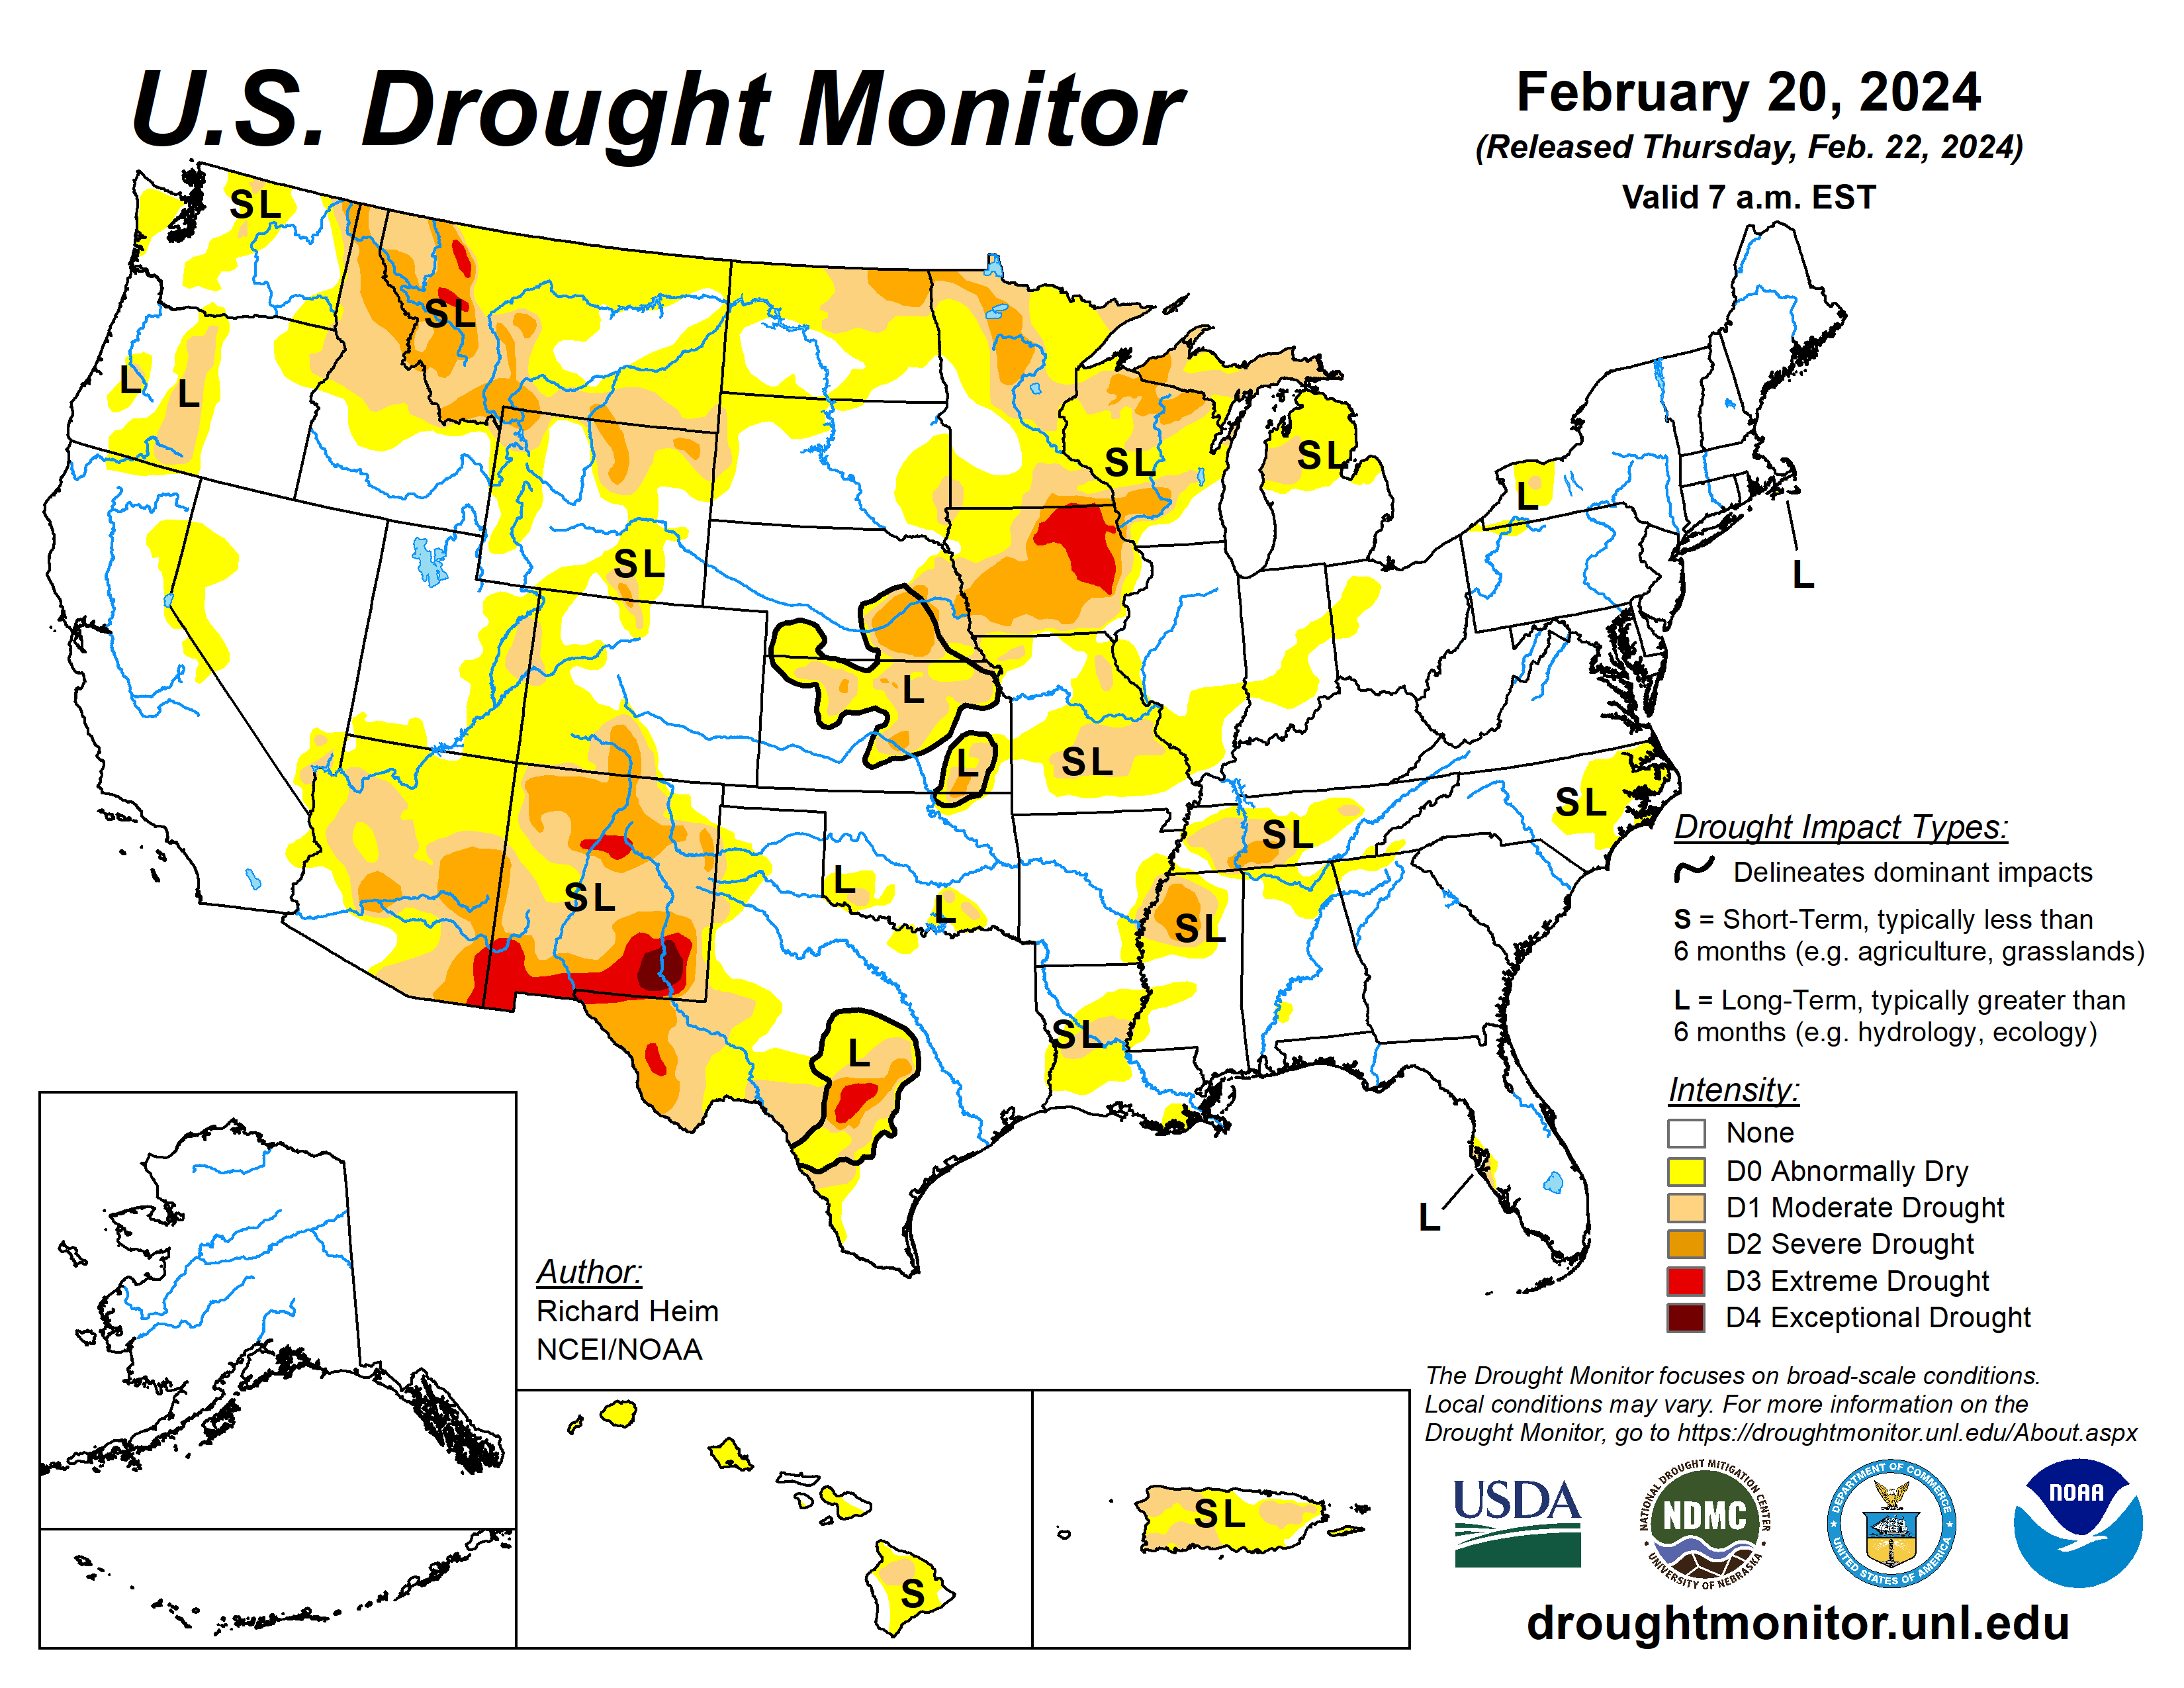
This Week’s Drought Summary

An atmospheric river of Pacific storm systems slammed parts of the West Coast with heavy precipitation during this U.S. Drought Monitor (USDM) week (February 14-20). The weather systems dried out as they crossed the western mountains, then produced anemic precipitation amounts east of the Rockies. Parts of the Midwest and Northeast received limited precipitation amounts from passing cold fronts, and heavier rain fell along the Texas coast and across Florida from another frontal system, but much of the country east of the Rockies, as well as the southwestern U.S., received little to no precipitation. The weather systems distorted the upper-level circulation over the contiguous U.S. (CONUS), which otherwise consisted of a high-pressure ridge over western North America and a low-pressure trough over the east. The end result of this distortion was a temperature anomaly pattern that consisted of warmer-than-normal weekly temperatures in the Upper Midwest and parts of the interior West, and below-normal temperatures in the Pacific Northwest, Rockies, and southern tier states, with near-normal temperatures elsewhere. An upper-level ridge over the Caribbean brought generally dry and warmer-than-normal weather to Puerto Rico and the U.S. Virgin Islands, while ridges also kept Alaska mostly drier and warmer than normal and Hawaii drier than normal this week. Drought or abnormal dryness expanded or intensified this week in parts of the Pacific Northwest, northern Rockies, northern Plains, Upper Midwest, Middle Mississippi Valley, Rio Grande Valley, eastern North Carolina, and much of Hawaii. Drought or abnormal dryness contracted or reduced in intensity in parts of the Four Corners states and Lower Mississippi Valley…
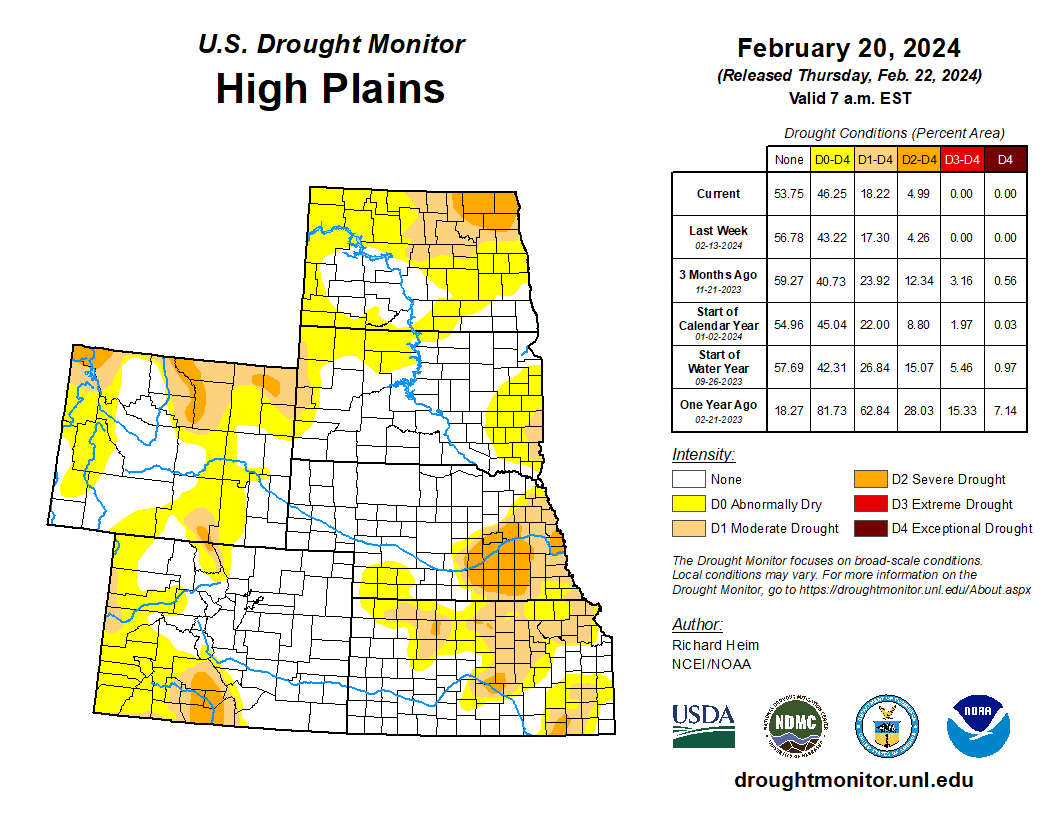
High Plains

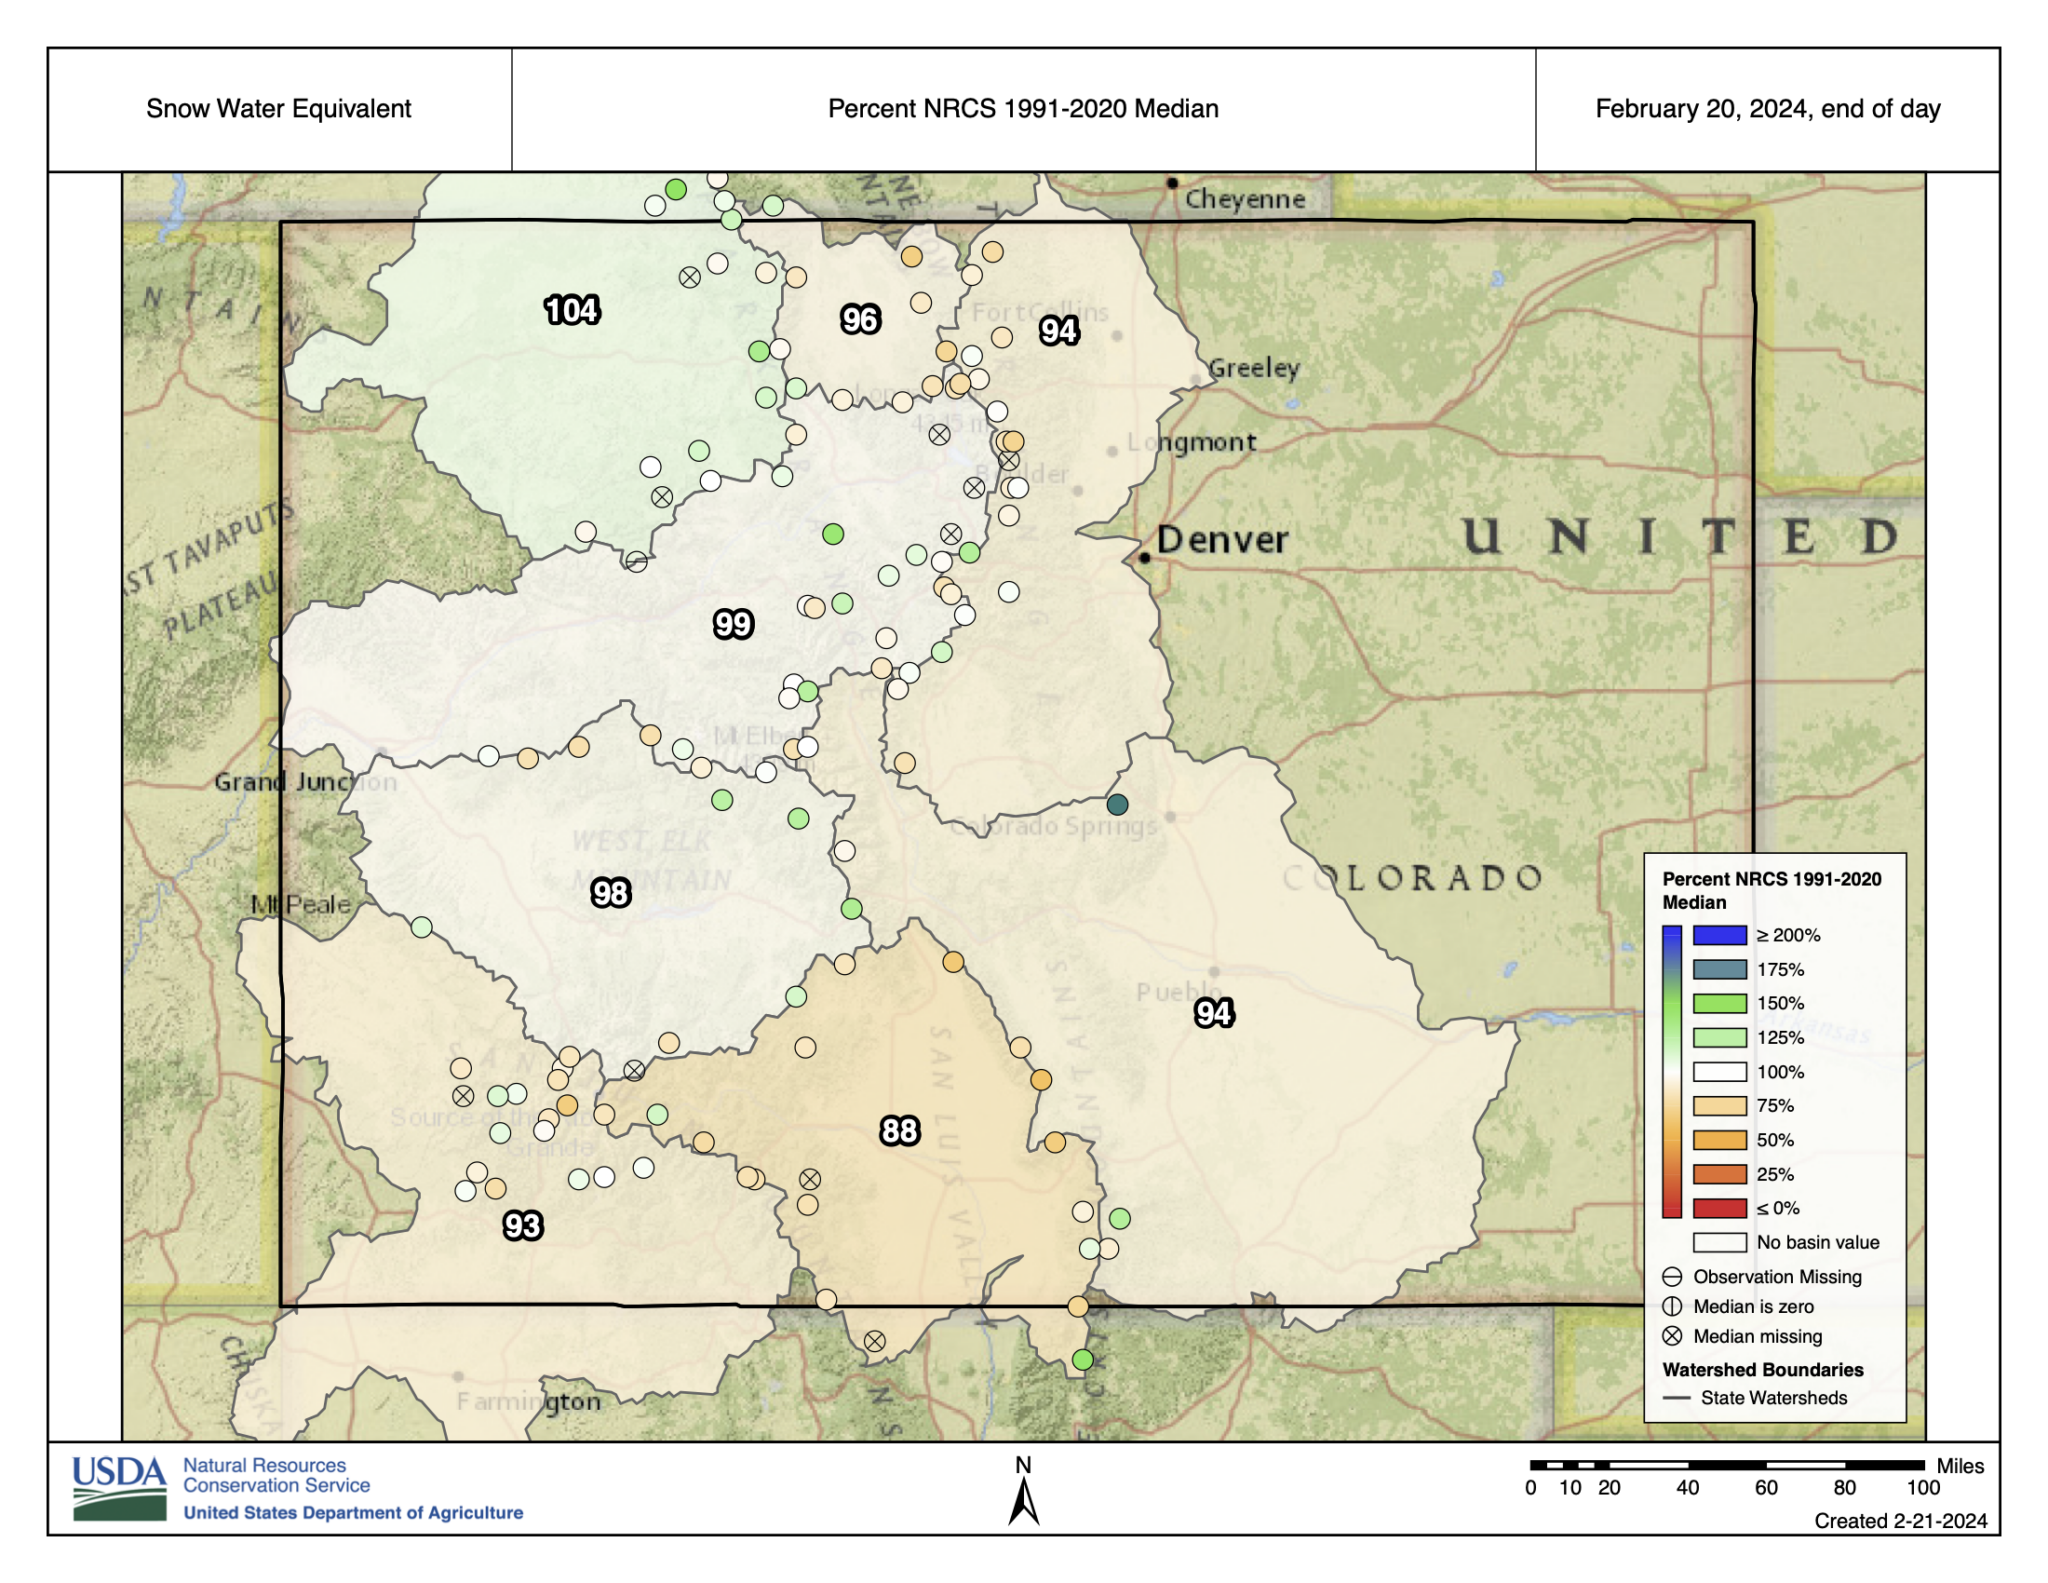
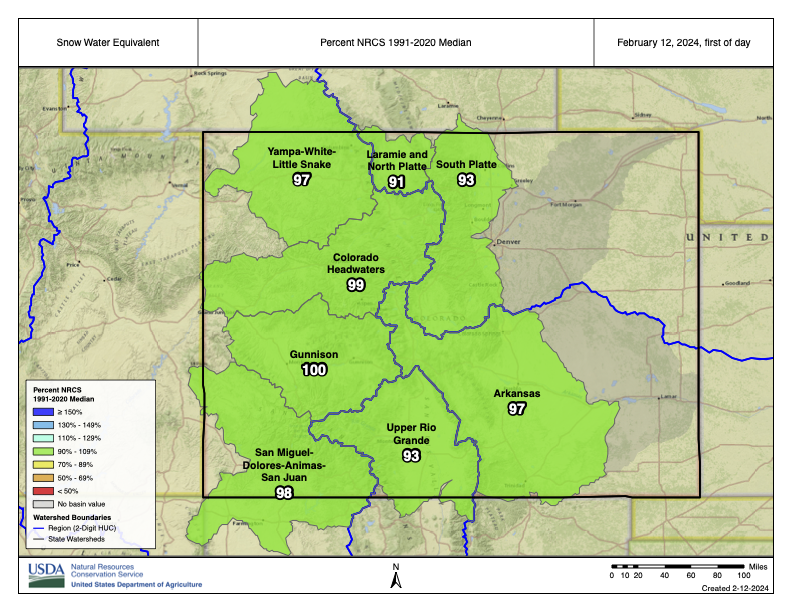
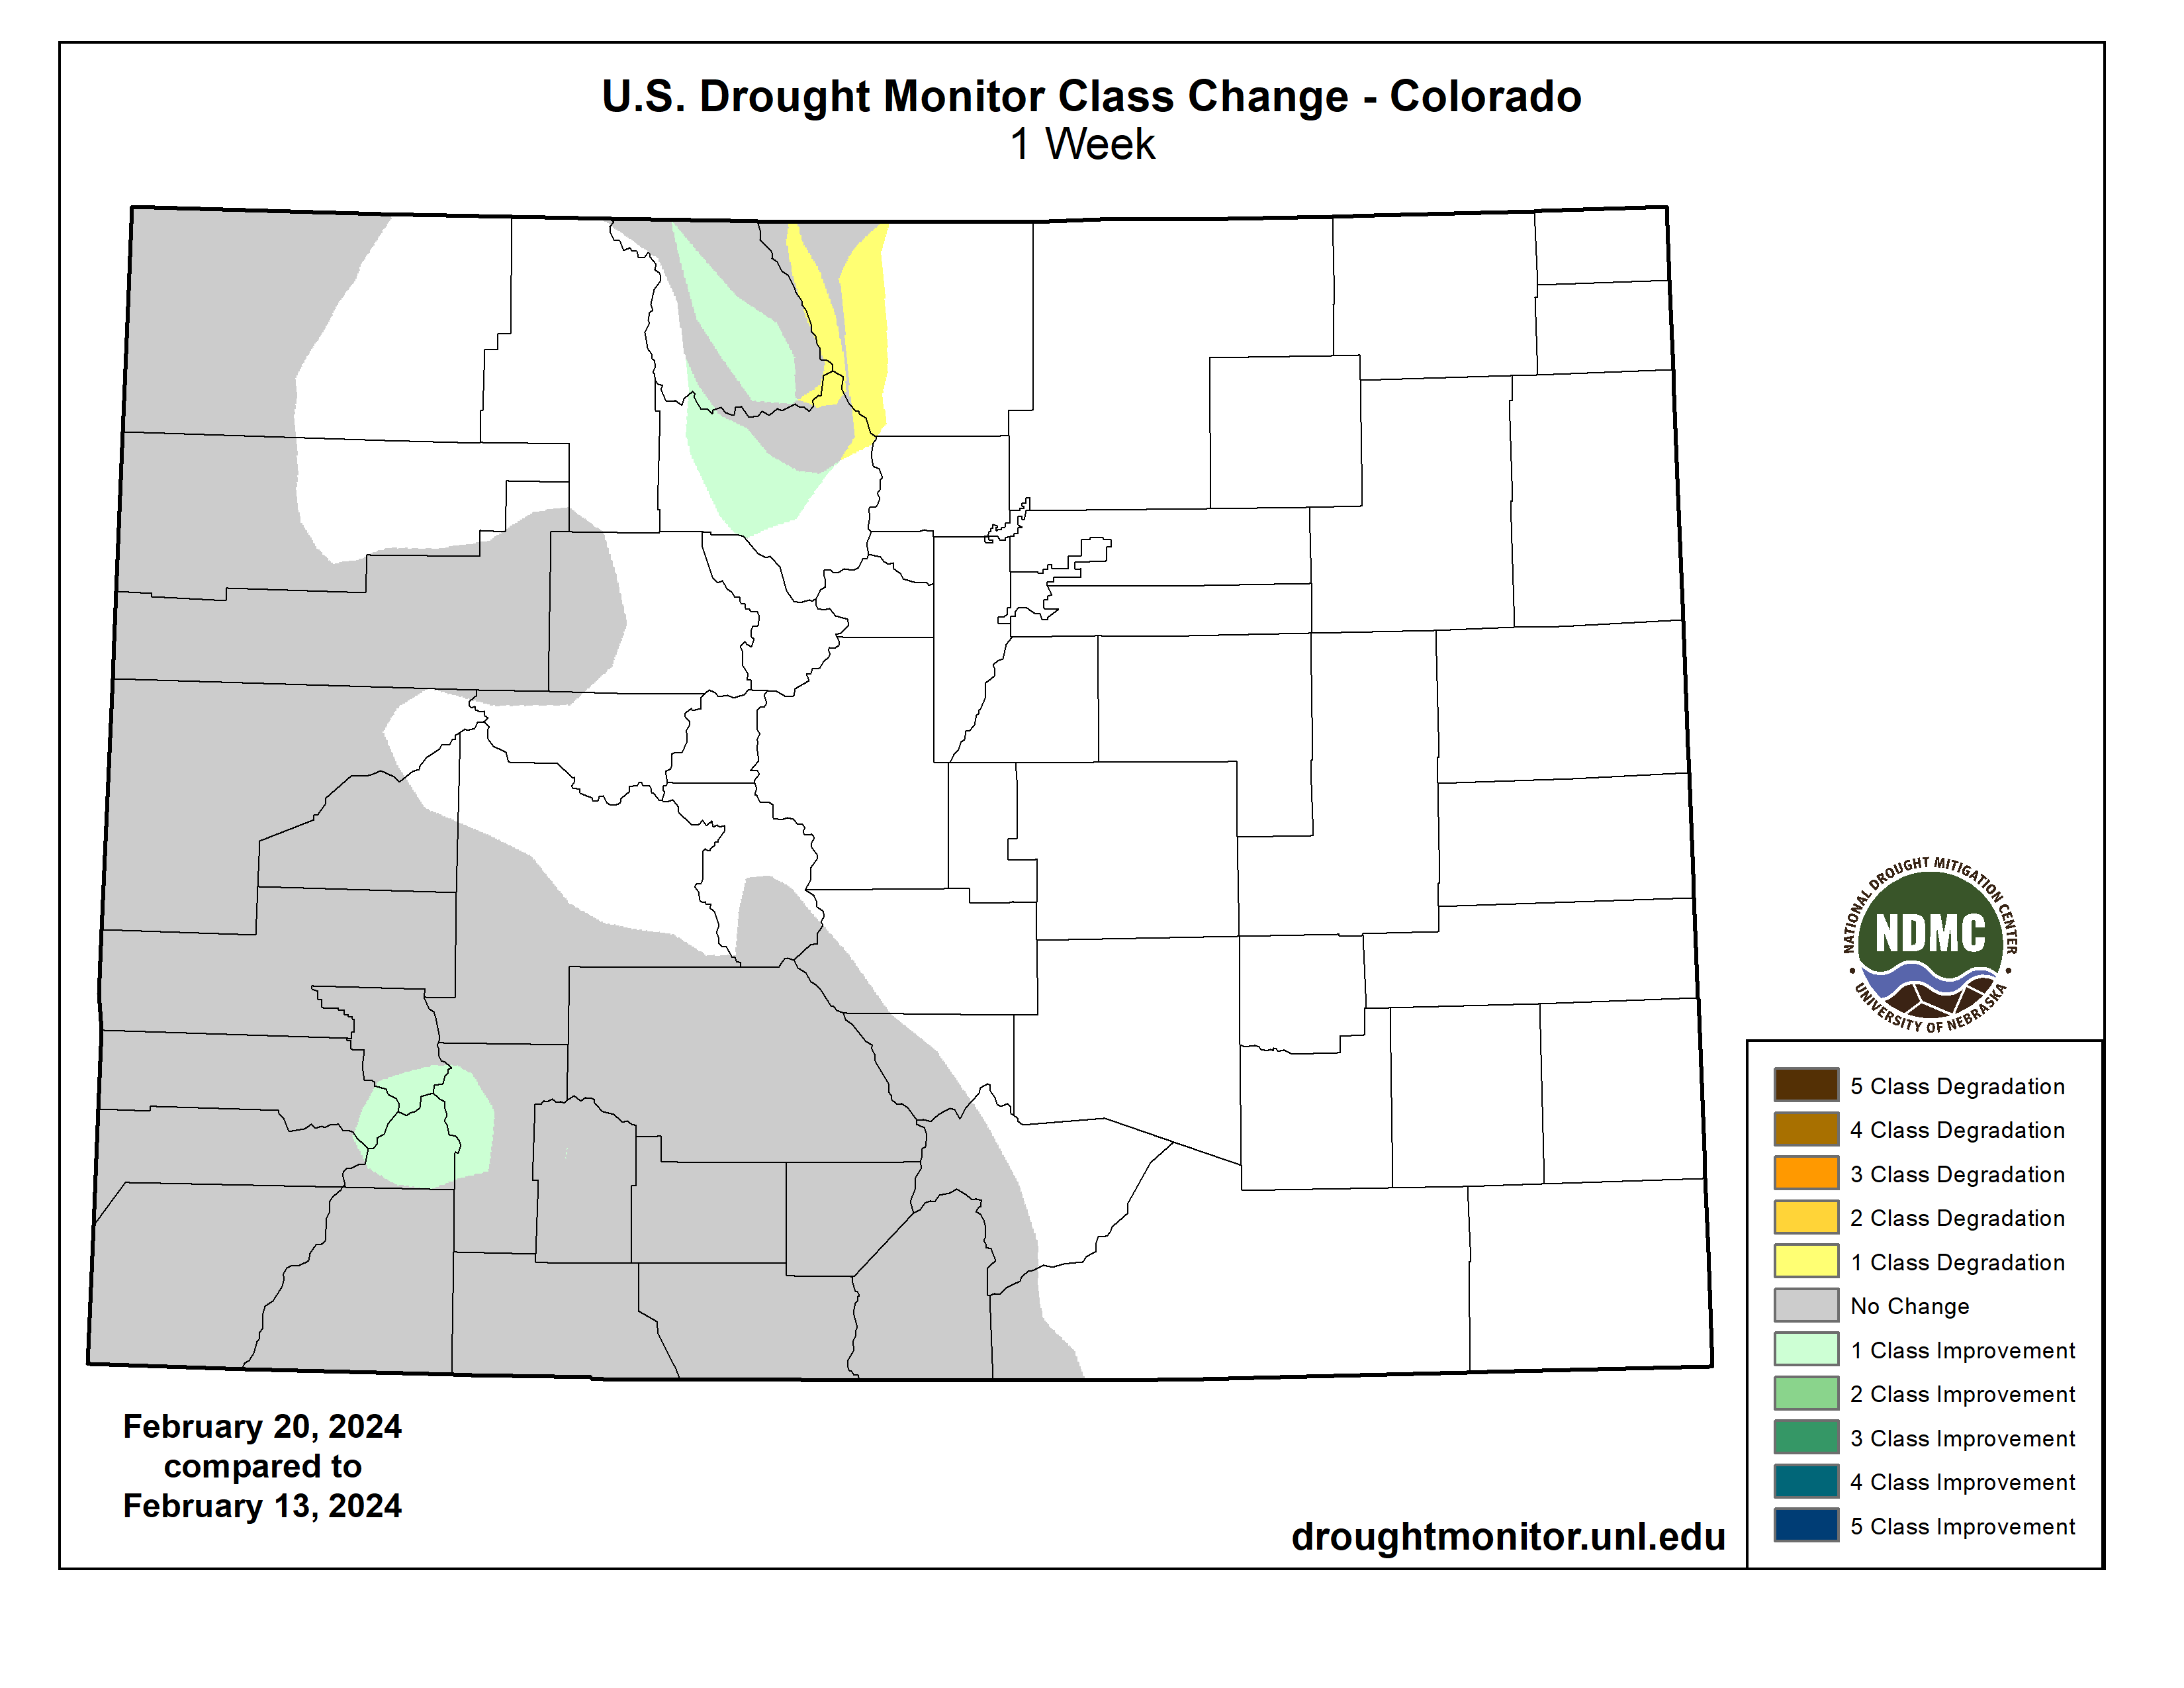
Half an inch to locally 2 inches of precipitation fell this week over the Colorado mountains into adjacent Wyoming, and over western Wyoming. A band of precipitation extended across South Dakota, with locally up to half an inch falling. Otherwise, the High Plains region received little to no precipitation. D0 was expanded in the Dakotas, and D1 expanded in North Dakota, where the last 3 months have been dry and the lack of snow cover has exposed bare ground. D0 and D1 were adjusted in north central and southwest Colorado where recent precipitation resulted in local improvements and continued dryness caused local expansion. D2 was introduced in north central and northeastern Wyoming…

Colorado Drought Monitor one week change map ending February 20, 2024.

West

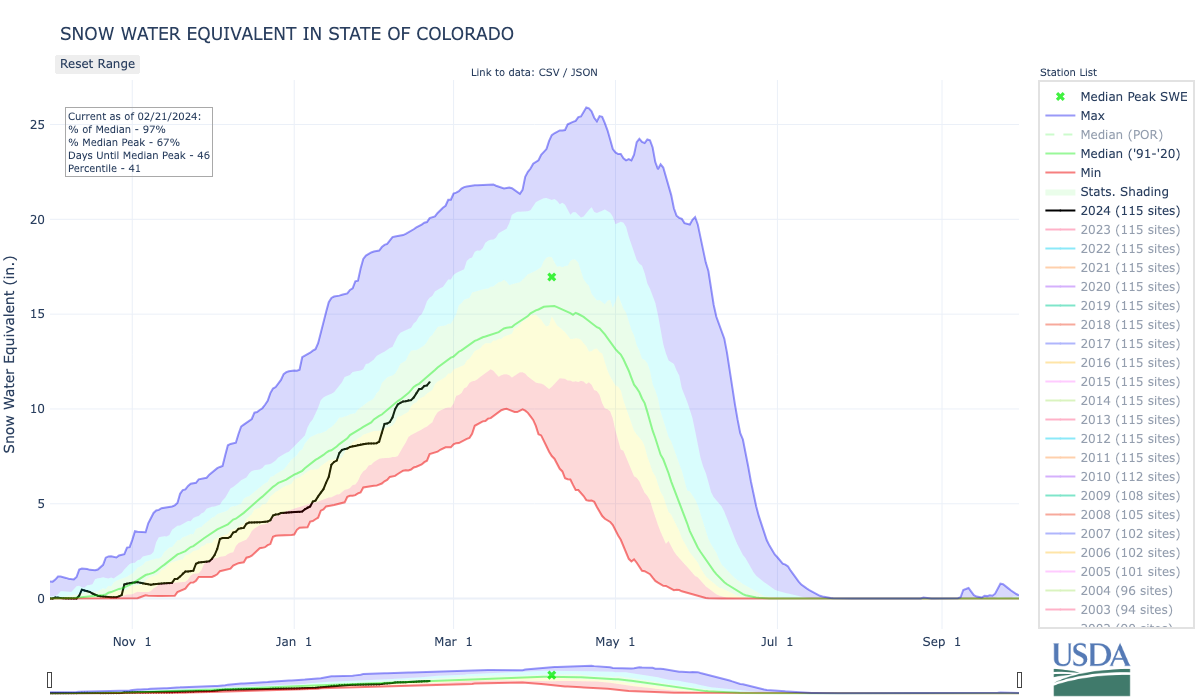
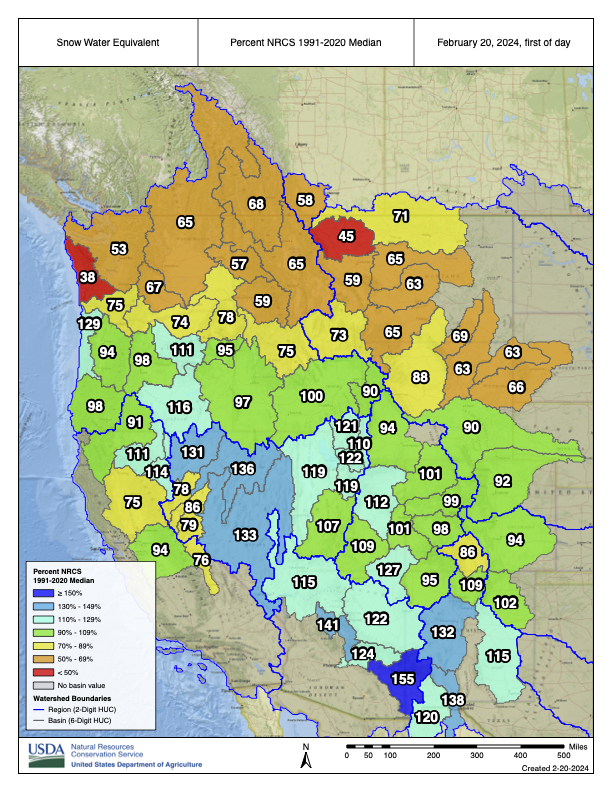
Five inches or more of precipitation fell along the California coast, across much of northern California, and in southwestern coastal Oregon, with 2 inches or more inland to the Sierra Nevada, Oregon Cascade mountain range, and over southwestern coastal Washington. Half an inch to an inch of precipitation fell across southern parts of the Pacific Northwest inland to the Rockies and a few areas to the north, with up to 2 inches falling from the Great Salt Lake area to Yellowstone National Park. Another area of 1 to 2 inches of precipitation occurred over the Colorado Rockies into adjacent Wyoming. Parts of California have received over 10 inches of precipitation during February and the Sierra Nevada range has received 1 to 3 feet of new snow since the end of January. But even with a wet February, much of the Sierra Nevada still has a below-normal snowpack. As of February 16, the northern Sierra snow water content (SWE) was 83% of normal, the central Sierra SWE was 74% of normal, and the southern Sierra SWE was 72% of normal. So, the D0 along the California-Nevada border was left unchanged.

While this week was dry across New Mexico, precipitation from the last 2 weeks to 3 months prompted the elimination of the D4 in southwestern New Mexico and the northwest D2, and contraction of the D3 in north central and D2 in southwestern parts of the state.

In northern parts of the West, precipitation for the water year to date (October 1, 2023-February 18, 2024) has been largely below normal and the winter snowpack is significantly below normal. Parts of the northern Rockies have record low SWE values, according to SNOTEL data. D0 expanded in parts of Idaho, Oregon, and Washington; spots of severe drought (D2) were added in north central and northeast Wyoming; and D2 was expanded and new D3 added in parts of Montana, especially the western and southern mountains, where the last 3 to 4 months have been dry and SWE values are record low…

South

Half an inch or more of precipitation fell across parts of the Texas coast, and there were a few areas of up to half an inch of precipitation in Arkansas and Tennessee, but otherwise the South region received no precipitation this week. D0 and D1 were expanded in west Texas along the Rio Grande Valley to reflect dry conditions over the last 7 days to 3 months, low streams, drying soils, and stressed vegetation indicated by satellite. D0 was contracted in South Texas and D1 contracted slightly in central Texas (Bell County). No change was made in Oklahoma, where reservoir levels remain historically low. A reassessment of conditions resulted in the removal of the D3 (extreme drought) and trimming of D2 in northwest Mississippi, trimming of D0-D1 in Arkansas, Louisiana, and Mississippi, and trimming of D0 in Tennessee. Precipitation is near to above normal in these areas for the last 1 to 4 months, streamflow is near to above normal, and surface soil moisture has been recharged. In Louisiana, stock ponds mostly refilled. The remaining D0-D2 is sufficient to reflect the longer-term dryness which shows up most severely at the 6- to 12-month time scales…

Looking Ahead

In the two days since the Tuesday valid time of this USDM, Pacific moisture continued to move across parts of the West, with little precipitation falling east of the Rockies. For February 22-27, one weather system will move across the eastern CONUS, while another moves into the West by the end of the period. The first is forecast to drop 0.5 to 1.5 inches of precipitation across the Tennessee Valley and southern Appalachians northward to the southern Great Lakes and central Appalachians, with half of an inch or less over the Northeast and even less over the Southeast. The second is expected to bring an inch or more of precipitation to the central and northern Rockies, coastal ranges of the Pacific Northwest, and Sierra Nevada, with up to 3 or 4 inches in the Washington Cascades. Other areas of the West are forecast to receive less than half an inch of precipitation, with little to no precipitation over the Southwest and to the lee of the Cascades in Washington. For the Great Plains to Mississippi Valley, little to no precipitation is predicted. Temperatures are expected to be warmer than normal, with the warmest anomalies across the Plains and Mississippi Valley due to upper-level ridging.

For much of the next 2 weeks, the atmospheric circulation is expected to consist of an upper-level trough over the western CONUS and a ridge over the eastern two-thirds of the country, with Pacific weather systems migrating through the trough/ridge pattern. The Climate Prediction Center’s (CPC) 6-10 Day Outlook (valid February 27-March 2) and 8-14 Day Outlook (valid February 29-March 6) favor a fairly stable pattern of warmer-than-normal temperatures from the Plains to East Coast and cooler-than-normal temperatures over the West and Alaska. The outlook is for above-normal precipitation over much of the CONUS, especially along the West Coast and Great Lakes, with odds favoring near to below-normal precipitation across the Plains and over most of Alaska.

US Drought Monitor one week change map ending February 20, 2024.

#Colorado mountain #snowpack in 2024 so far: decent, fine, ok — @ColoradoClimate Blog

Click the link to read the article on the Colorado Climate Center blog (Russ Schumacher):

February 18, 2024

We spend a lot of time thinking about snow in our mountains, because Colorado is a headwaters state, and the water stored in that snowpack ends up serving ecosystems, farms, and millions of people not just in Colorado but in all directions. As we progress toward the end of February, the overall picture of Colorado’s mountain snowpack comes into much clearer focus. As of February 20th, the snow water equivalent (SWE) in Colorado’s mountains, as measured at SNOTEL stations, was 97% of the median value for this day, compared to the 1991-2020 period. The northern mountains were a little bit above average (for example, the Yampa-White basin was at 104% of average), and the southern mountains a bit below (88% of median for the mountain areas feeding the Rio Grande river).

Snow Water Equivalent percent of the 1991-2020 median at Colorado SNOTEL stations, including values aggregated over the major river basins. Obtained from the USDA NRCS Interactive Map.

The state of the snowpack at this point in the winter can be characterized as pretty ok. Certainly much better than some of the drought years over recent decades, but also nowhere near the huge snows that fell last year across Colorado. (At this time last year, we were sitting at about 120% of average statewide.)

Colorado snowpack basin-filled map February 12, 2024 via the NRCS.

The snow accumulation season started quite slow: most locations were lagging well behind the average snowpack, with a few sites near record lows, in early January. But then a major storm cycle in mid-January gave a huge boost to the snowpack, bringing it back within shouting distance of the average. February has been a more typical month in the mountains, with a steady string of storms, some hitting the northern ranges and others benefiting the south. That brings us to the decent position we’re in now: not amazing, but not too bad either.

Time series of snow water equivalent for the state of Colorado. Water year 2024 (the current year) is shown by the black line, with the 1991-2020 median in the green line, the median peak shown by the “x”, and the historical range shown by the color shading. From the USDA NRCS Colorado Snow Survey.

How much do the current conditions tell us about where we’ll end up?

It turns out that for the statewide average, the snowpack value on February 20th correlates very strongly with the eventual peak, as shown in the graph below. (The correlation coefficient is 0.85, for those familiar with that metric.) In past years when the snowpack was similar in late February to where it is this year, the eventual peak tended to be a little below average. Only one year when the February snowpack was similar to this year did the seasonal peak end up well above average (1998…more on that in a second.) There’s still about a month and a half until the typical peak (a little less in the south, more in the north), meaning there’s still time for things to change. In a typical year, a whole lot of snow falls between late February and mid-April! But it’s also uncommon for a huge change in the overall seasonal picture after this time in the winter.

Comparison of Colorado statewide SWE on February 20 (on the horizontal axis) with the water year peak SWE (on the vertical axis), in inches. The median peak is shown by the dashed line at 17″. This year’s value is shown by the hashmark on the horizontal axis, with question marks indicating where this year could potentially end up. A few past years are highlighted. The correlation between the February 20 and peak values is 0.85. Data from 1987-2024, obtained from USDA NRCS.

So, what should we expect for the rest of the winter and spring? Although snowpack is just a bit below average, the water supply forecasts for the Upper Colorado River Basin look even lower. The Colorado Basin River Forecast Center’s mid-February update projected that April-July streamflow into Blue Mesa Reservoir along the Gunnison River will be 88% of average. For this reservoir—Colorado’s largest—that would be a decent outcome. However, the projected flow into Lake Powell is only 77% of average. Lake Powell rose above its historic lows after the big snows last year, but is still far below average levels (let alone being filled.) 

“New plot using the nClimGrid data, which is a better source than PRISM for long-term trends. Of course, the combined reservoir contents increase from last year, but the increase is less than 2011 and looks puny compared to the ‘hole’ in the reservoirs. The blue Loess lines subtly change. Last year those lines ended pointing downwards. This year they end flat-ish. 2023 temps were still above the 20th century average, although close. Another interesting aspect is that the 20C Mean and 21C Mean lines on the individual plots really don’t change much. Finally, the 2023 Natural Flows are almost exactly equal to 2019. (17.678 maf vs 17.672 maf). For all the hoopla about how this was record-setting year, the fact is that this year was significantly less than 2011 (20.159 maf) and no different than 2019” — Brad Udall

There are a couple of wild cards to consider. One is that we remain in El Niño conditions, which tends to increase the odds of a wet and snowy spring (see Figure 2.12 here). Recall the reference above to 1998, when snowpack that was just ok in February ended up well above average by late April. That was a strong El Niño similar to this year. The CPC monthly outlook for March does tilt toward wetter-than-average conditions, so that is a possible reason for hope.

NOAA Climate Prediction Center monthly outlook for precipitation in March 2024. From https://www.cpc.ncep.noaa.gov

On the flip side, the long-term trend toward warm springs and earlier melts in the mountains continues as the climate warms, which could alter the eventual water supply as well. As pointed out in this post, the biggest reason for errors in streamflow forecasts is the fact that we don’t know what’s going to happen with the weather over the next couple months! So, while history and these outlooks give some useful hints, as usual we will just need to wait and see what happens.

Westwide SNOTEL basin-filled map February 20, 2024 via the NRCS.

Coloradans offer to cut water use in exchange for $8.7 million — @BigPivots #ColoradoRiver #COriver #aridification

Water feature along Pueblo’s River Walk. Photo/Allen Best

Click the link to read the article on the Big Pivots website (Shannon Mullane):

February 18, 2024

Coloradans gunning to join this year’s effort to save water in the Colorado River Basin could help conserve up to 17,000 acre-feet of water — much more than the 2,500 acre-feet saved in 2023 — and receive about $8.7 million in return.

The voluntary, multistate program pays water users to temporarily use less water. State and federal officials relaunched the effort, called the System Conservation Pilot Program, in 2023 in response to federal calls to cut back on water use in the drought-stressed river basin. After a stumbling relaunch in 2023, this year’s program is moving forward with more applications, more potential water savings and more money for participants.

“The changes this year — it was just much more transparent,” said Greg Vlaming, a consultant who helped nine growers apply to the program. “The application process was simple and easy. It took me less than 15 minutes per application.”

The conservation program was initially piloted from 2015 to 2018. In 2023, officials relaunched it with $125 million in federal funding as a way to cut back on water use in response to a looming water supply crisis in the Colorado River Basin. The basin supplies water for 40 million people across the western U.S., 30 Native American tribes and northern Mexico.

Interest in the program has grown steadily. During the four-year pilot, about 15 to 45 people applied each year. In 2023, the program received more than 80 applicants.

But program costs have grown as well, in part because the program’s managers have boosted reimbursement rates to keep up with rising crop prices, according to the Upper Colorado River Commission, which oversees the program.

Last year, the four Upper Basin states — Colorado, New Mexico, Utah and Wyoming — spent nearly $16.1 million in federal funding to conserve about 37,810 acre-feet of water. During the four-year pilot, the program spent half that amount, about $8.5 million, to conserve more water, about 47,000 acre-feet.

One acre-foot supports about two families of four to five people for one year.

This year’s application period closed in December with 124 applications, according to the Upper Colorado River Commission. Of those, Colorado water users submitted 56; Utah, 32; New Mexico, one; and Wyoming, 35.

The river commission, which includes representatives from the federal government and each of the Upper Basin states, is scheduled to consider the applications March 4.

Then, once a federal review is complete and all project details are finalized, applicants have the final say about whether they will participate. The commission aims to launch the conservation projects in April, said Executive Director Chuck Cullom.

In Colorado, most of the applications come from farmers and ranchers who proposed cutting their water use by temporarily fallowing fields, or by switching to crops that use less water or can better withstand drought. About 20 proposals aim to save enough water to warrant $100,000 or more in compensation per project.

The Ute Mountain Ute tribe of southwestern Colorado has offered to use crops that require less water and will, if the tribe’s offer is accepted, get $1.1 million in return. Photo credit: Allen Best/Big Pivots

The Ute Mountain Ute Farm and Ranch in southwestern Colorado proposed the state’s biggest project this year. If approved, the enterprise will use crops that require less water and will fallow nearly 900 acres of land for an estimated 2,172 acre-feet of water savings. It would receive $1.1 million in return.

David Harold, owner of the Tuxedo Corn Company in Olathe, proposed saving 600 acre-feet of water. In return, he’d get about $305,000, roughly equivalent to the cost of a nice tractor, he said.

The program asks farmers to cut down their water use — buy-and-dry under a different name — but it’s also a way to experiment, he said. How can he respond to an uncertain water supply with as little impact to the local economy as possible and still survive as a farmer?

Harvesting a Thinopyrum intermedium (Kernza) breeding nursery at The Land Institute By Dehaan – Scott Bontz, CC BY 3.0, https://commons.wikimedia.org/w/index.php?curid=5181663
Sainfoin (Onobrychis viciifolia) has amazing properties and was largely ignored during the post war years of industrial agriculture. Not surprisingly, it’s making a bit of a comeback. Photo credit: Soil Association

Harold chose not to fallow — not growing crops means fewer hands to help with production and that impacts the local economy. Instead, he decided to turn off irrigation when it was hottest and least efficient, and to grow more drought resistant crops, like Kernza and sainfoin.

The payment was enticing, but in the long term not enough to offset all of the uncertainties that farmers face, he said. The conservation program’s reimbursement rate could change, or the program could end. There was a disaster with corn earworm in the sweet corn industry last season. State regulations, water supplies and labor costs change.

“The list goes on and on and on of why I should be doing everything I can to diversify or maneuver. Be agile. Be thoughtful,” Harold said. “The past will not be the future; what my dad did is not likely what’s going to work for me. It’s kind of daunting out there.”

Alan Ward stands at the Ewing Ditch headgate.

Pueblo Water was the only municipal water provider to apply. The Front Range utility normally takes about 943 acre-feet of water from the Ewing Placer Ditch in the Colorado River Basin and diverts it into the Arkansas River Basin for homes and gardens around Pueblo. If accepted, it will leave all of that water in the Colorado River Basin in return for up to $479,987.

“The primary purpose we’re doing it is just because we think, for this particular year, the water’s going to be more valuable in the System Conservation Pilot Project than it’s going to be on the Arkansas River,” said Alan Ward, division manager of water resources for Pueblo Water. “I don’t think we have plans to dedicate it (the funding) to any specific purpose. Essentially what it does is it subsidizes the cost of water for our customers.”

In 2023, when participants negotiated their own reimbursement rates, compensation for the top five applicants ranged from about $70,000 to $195,000 per project, according to the Colorado Water Conservation Board.

In response to participant feedback, officials this year switched to a fixed-rate structure based on a market analysis by the federal and state governments.

Corn harvest was underway on this farm between Montrose and Delta in September 2019. Photo/Allen Best

Colorado participants will receive $509 per acre-foot of saved water, the highest compensation rate of the four Upper Basin states. New Mexico producers will receive $300, while those in Utah and Wyoming will receive $506 and $492, respectively. Reimbursement rates will vary for other projects, like leaving water storage in reservoirs, or municipal and industrial water savings.

“I’m not complaining about it,” Vlaming said. “But when I say $509 per acre-foot to guys, they’re like, ‘Where do I sign?’ Some of these guys are going to get paid quite well.”

For water users, negotiating their own rates was one of several problems with last year’s program, alongside a short application period and unclear communication about how to apply and how water savings were calculated.

The application process was much more streamlined this year because officials learned from the process in 2023, said Cullom, the Upper Colorado River Commission executive director.

“The process — which included pre-application interviews and discussions between the applicant and the states and the consultants — helped strengthen all the applications,” he said. “I think we improved the process. That’s some feedback we’ve heard.”

[…]

This story was published by Fresh Water News, a service of Water Education Colorado.

Upper Colorado River Basin map via the Upper Colorado River Commission.