A study published just last month in Science Advances finds that the last couple of decades were dry. And they were hot. Yeah, I know: We don’t need no propellor-head scientists to tell us that! And yet. The findings, while not exactly surprising, are super interesting, because they provide additional confirmation that the current megadrought (or the most recent phase of ongoing aridification, if you prefer) is intensified by human-caused climate warming.
The paper takes a look at the increasing prevalence and severity of “hot droughts,” which is when rainfall deficits and high temperatures combine to deleterious effect — as much of the Western United States has suffered through lately. Research has shown that the current drought is among the most severe of the last 1,200 years, but the relationship between temperature and severity of past droughts has been less clear.
This study, “Increasing prevalence of hot drought across western North America since the 16th century,” dives more deeply into that relationship by looking at tree rings and paleo-climate reconstructions.
The last time the Southwest experienced anything close to the current drought was back in the late 1500s, when it was as rain- and snow-starved as it is now. But there was a big difference: It wasn’t nearly as hot then as it has been now.
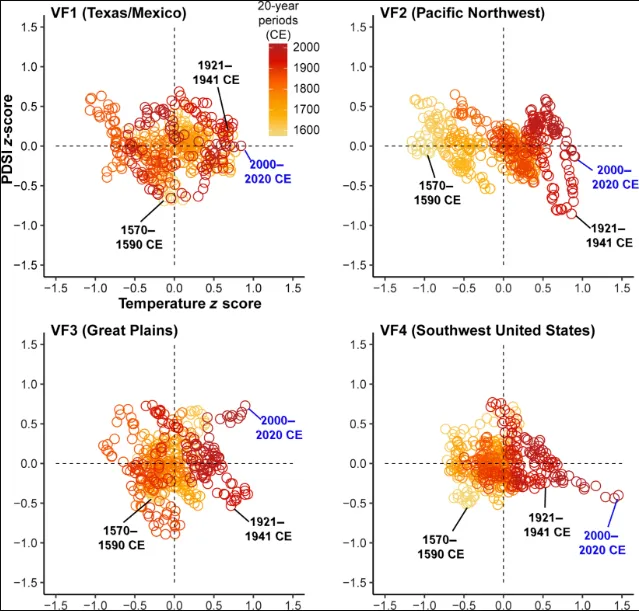
The phenomena are summed up in this graphic below, which I must admit I had to peer at for a while before I understood it. But once I grasped what was going on (and that the lower the Palmer Drought Severity Index, the drier it is, which seems counterintuitive to me), it popped out pretty clearly: We live in unprecedented hot, dry times.
Twenty-year moving averages of regionalized summer temperature z scores from the Western North America Temperature Atlas and Palmer Drought Severity Index values relative to the full period (1553 to 2020 CE). Averages are calculated using a 20-year backward moving window beginning in 2020 CE. In the Southwest, the 1570-1590 megadrought was just as dry as the current one, but far cooler. The Dust Bowl (1921 to 1941) was not quite as hot or dry as the last couple of decades. Source: “Increasing prevalence of hot drought across western North America since the 16th century,” Credit: The Land Desk
The authors note that the decades spanning the modern megadrought “exhibit the strongest negative relationships between summer maximum temperatures and soil moisture” compared to any other historical period. The heat amplifies evapotranspiration, which further dries out areas that are already suffering from a lack of rain or snow, but also can create drought conditions even when precipitation is especially scant. That can be seen in the Colorado River, where about one-third of the decline in flows can be attributed to unprecedented high temperatures. The authors go on to write: “… multidecadal drying exacerbated by high temperatures may further alter surface energy balance in ways that lead to additional warming.” Ughh. [ed. emphasis mine]
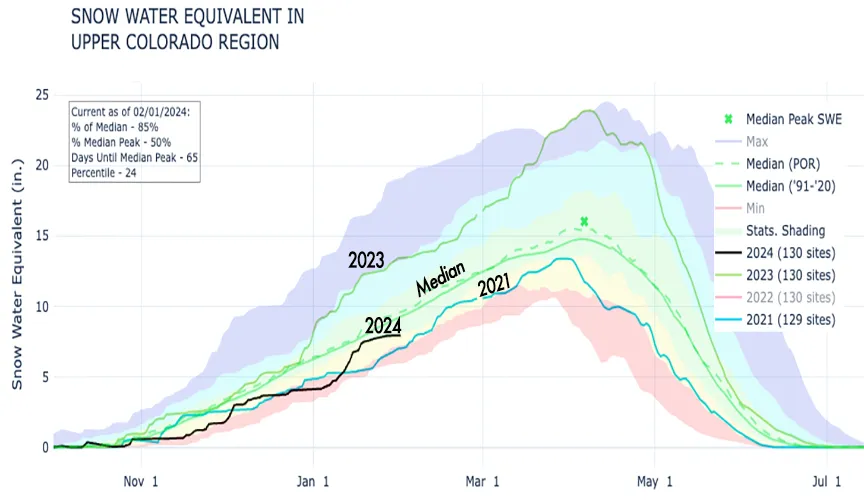
Oh, and about that 2000-2022 megadrought? I’m starting to get the bad feeling that the prolonged dry spell didn’t end in 2023, but just took a little break, and has come roaring back at us. Sure, January brought a few big storms to the West’s mountains, boosting snowpack substantially in some areas. The river basins in Utah’s Wasatch Front, for example, are mostly at or above median snowpack levels. But the snow remains thinner than the 1991-2020 normal in much of the West.
That includes the Upper Colorado River Basin.
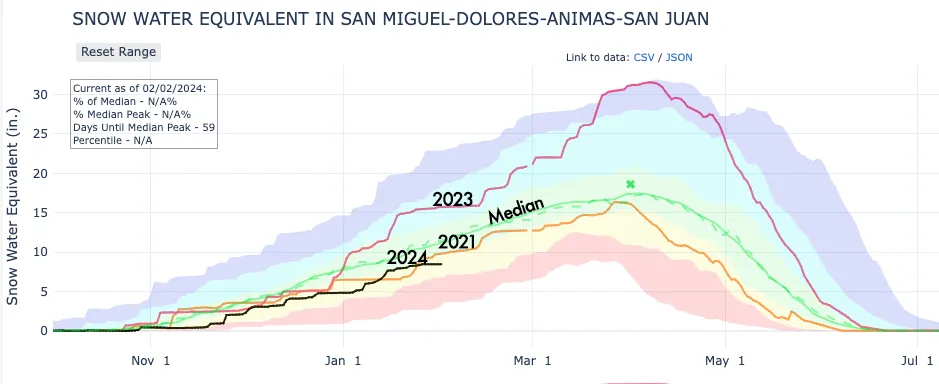
And in the Animas-Dolores Basin in southwestern Colorado. According to this, the combined basin is actually in worse shape than it was in early February 2021.:
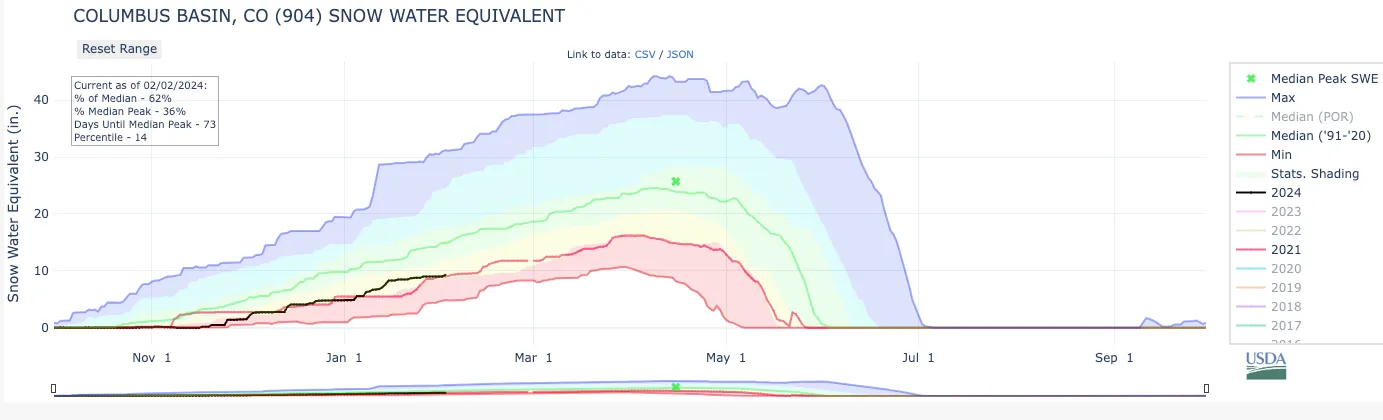
And zooming in on Columbus Basin in the La Plata Mountains, we find that this year’s snowpack is about even with this date in 2021. Better than ^^, but still …
I know I always say this, but I’ll say it again: Don’t panic. Yet. Even as I write this a good-sized storm is walloping southwestern Colorado and these lines are likely to shoot upward in coming days. And we’re still in early days as far as the strongest expected effects of El Niño, so we may be in for a whopper of a spring still.
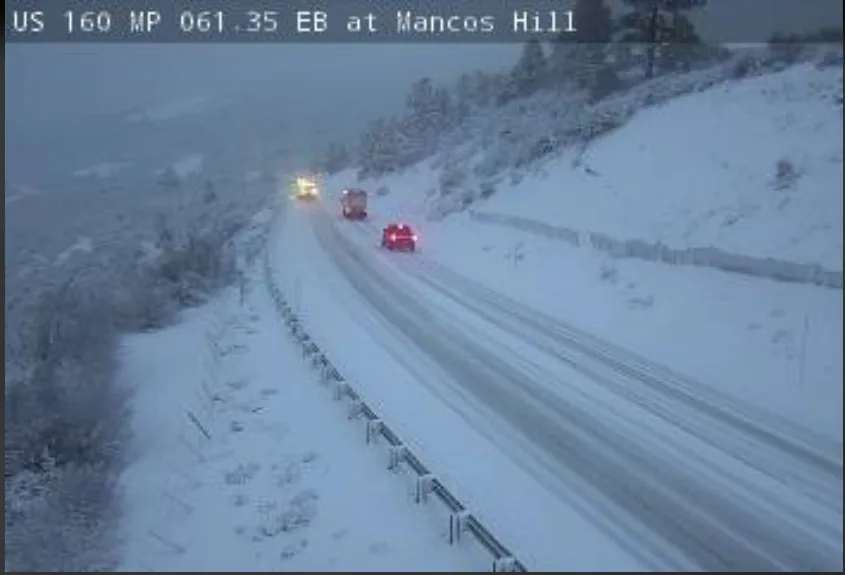
Driving in this kind of slippery wet snow sucks. But you gotta love the moisture it contains. Source: CDOT (web cam capture at 7 a.m., Feb. 2).
The term “atmospheric river” (AR) has become common in weather stories and media coverage, but the name for these age-old events is a relative newcomer in meteorological glossaries.
Coined by scientists in the 1990s, the term’s popularity has soared in recent years as researchers, forecasters, journalists, and others have publicized the outsized role of atmospheric rivers in producing rain, snow, wind, and severe weather in the American West (and other places).
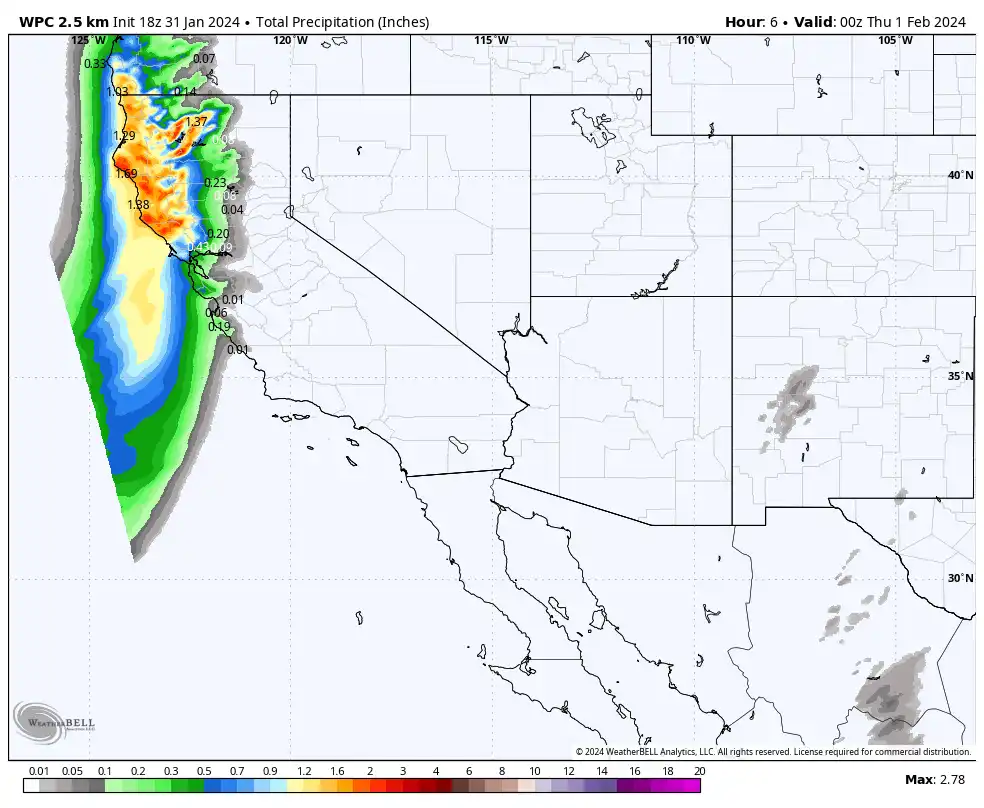
The West Coast is now facing the first of two ARs that promise to deliver much-needed snow to the Sierra Nevada but also threaten to cause havoc. The animated map below shows the expected liquid precipitation from January 31 to February 7.
Source: WeatherBELL Analytics.
Here in Colorado, some of that Pacific moisture is expected to give our snowpack a welcome boost after a warm, dry spell that made it feel like spring in late January and had me hiking through mud in a t-shirt. (See the end of this post for an update on the West’s snowpack, which remains underwhelming in many areas.)
Below is a quick primer on ARs, why they matter, and what the future might hold for ARs as the climate warms.
What are atmospheric rivers?
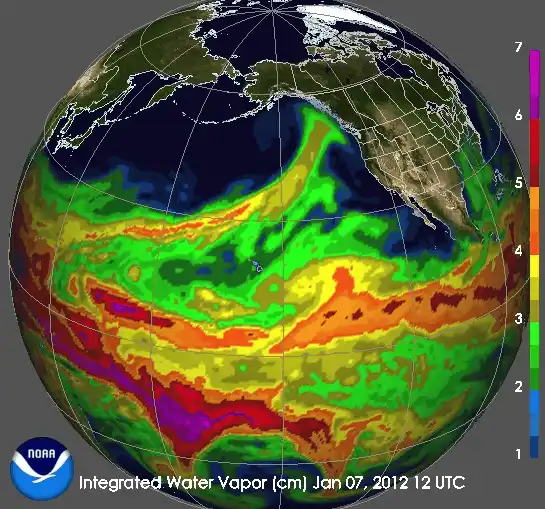
These plumes of moisture are sometimes likened to “rivers in the sky” because they transport so much water vapor from the tropics toward higher latitudes. In data visualizations, like the one below, they can resemble a fire hose dousing the West Coast.
Animation showing atmospheric river plumes in January 2012. Source: NOAA.
An AR is “a long, narrow, and transient corridor of strong horizontal water vapor transport that is typically associated with a low-level jet stream ahead of the cold front of an extratropical cyclone,” according to the American Meteorological Society’s Glossary of Meteorology.
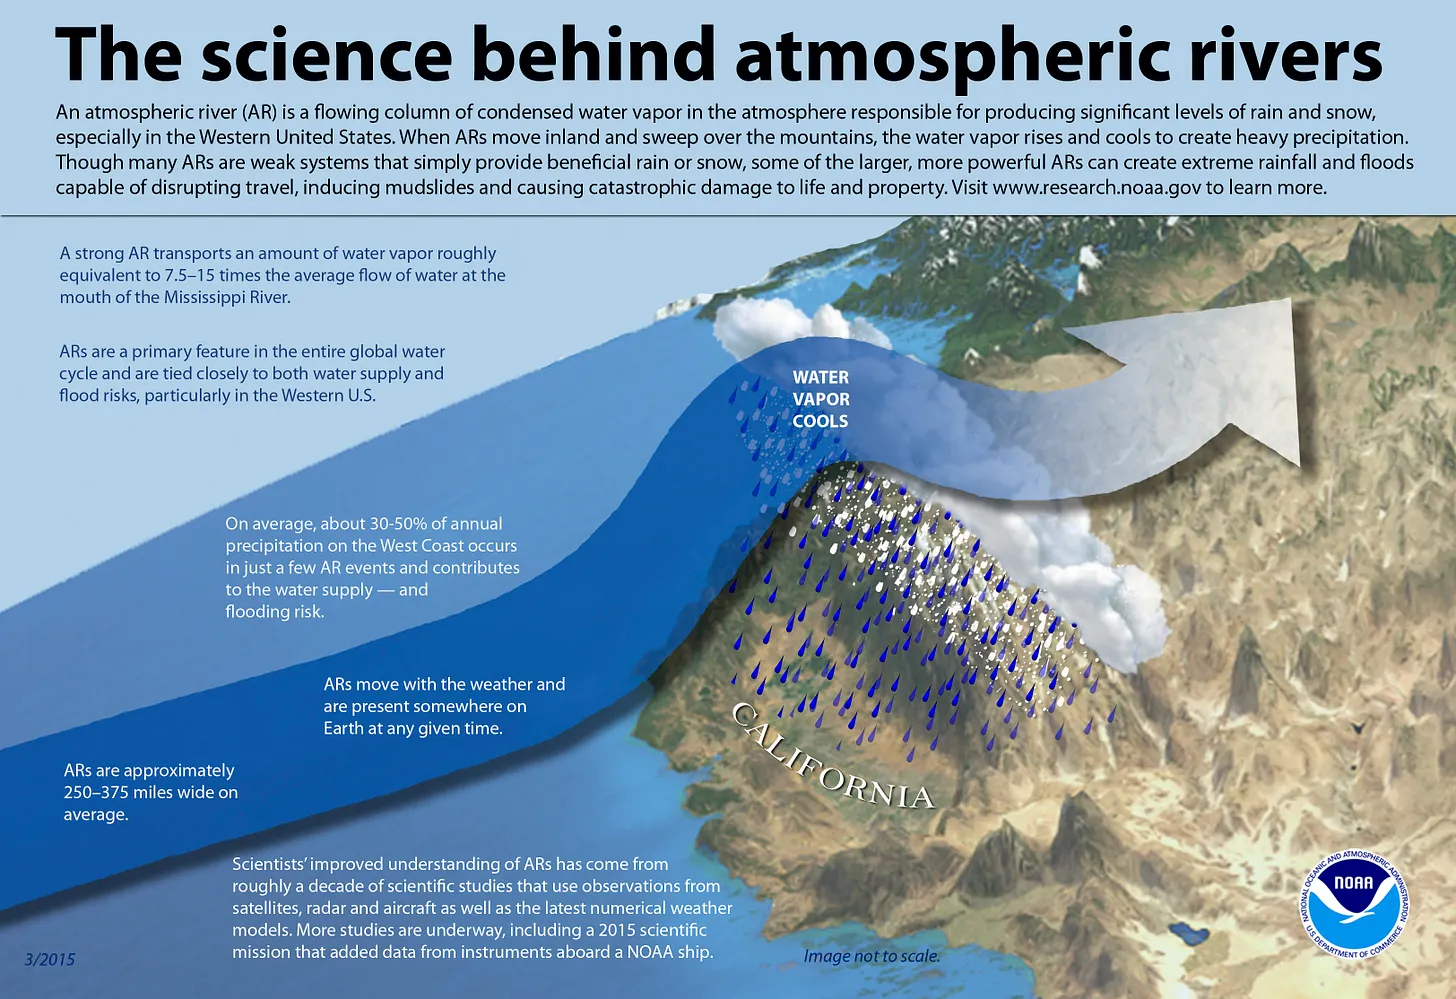
When ARs are forced upward by mountains or other forces, the water vapor cools, condenses, and precipitates, as shown in the graphic below. This NOAA figure says the amount of water vapor in a strong AR “is roughly equivalent to 7.5-15 times the average flow of water at the mouth of the Mississippi River.”
Source: NOAA.
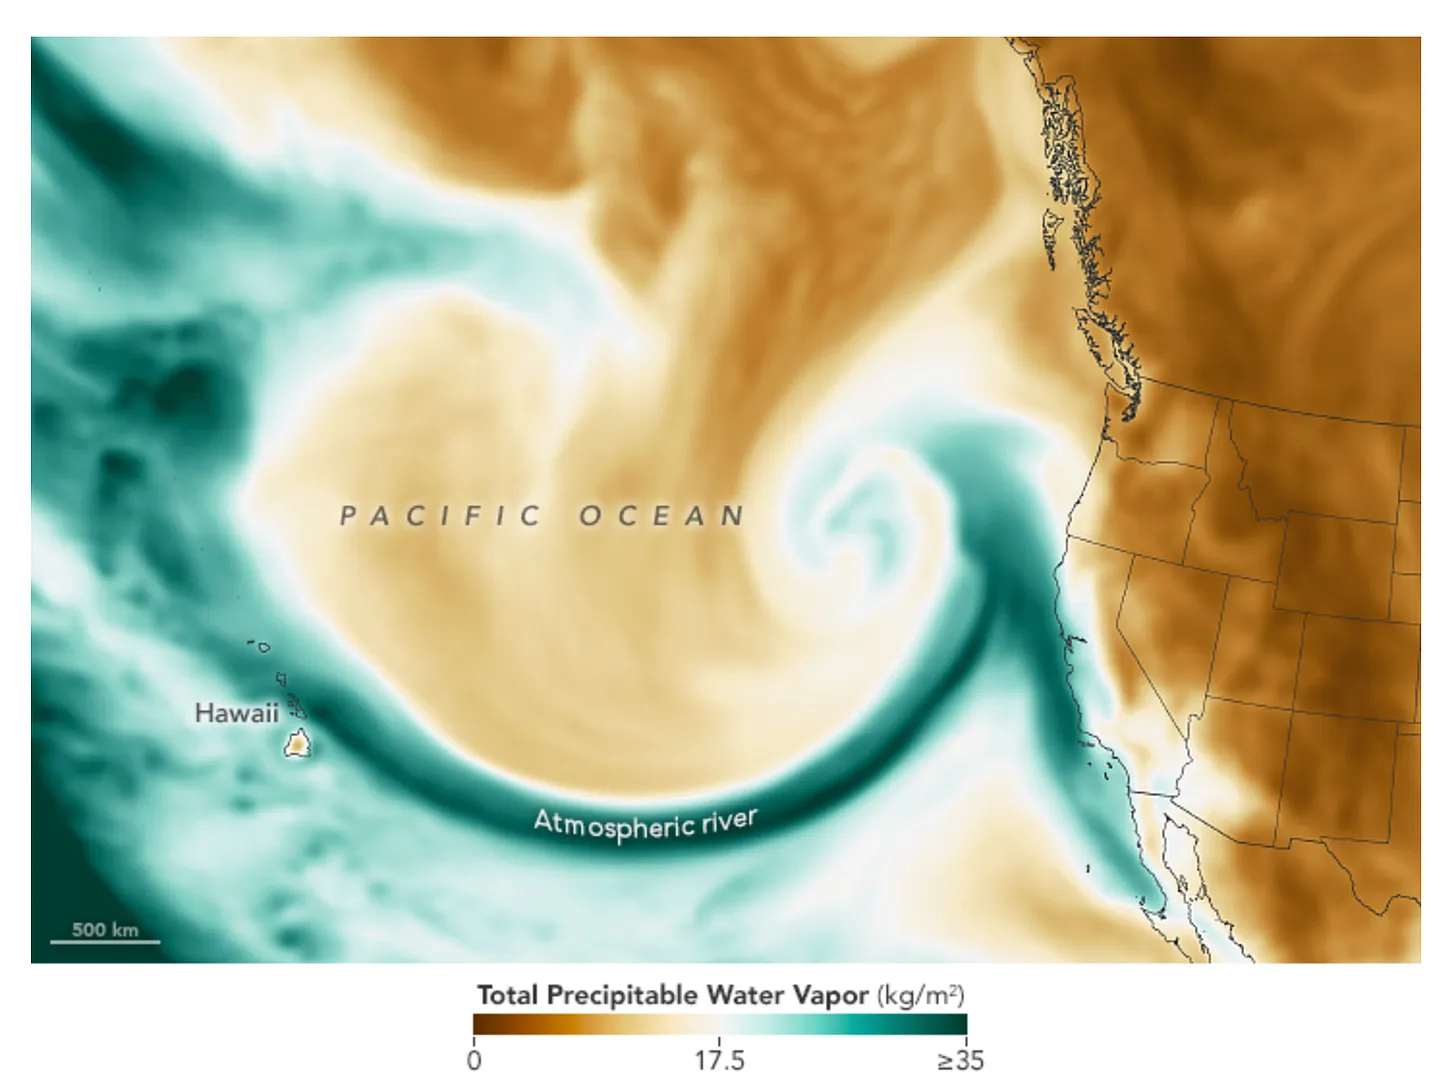
One type of AR has come to be known as the “Pineapple Express” because it taps moisture around Hawaii. The January 4 images below from the NASA Earth Observatory illustrate the connection: the top graphic depicts a measure of water vapor in the atmosphere and the bottom shows the view from a satellite.
Pineapple Express. Credit: The Water Desk
Source: NASA Earth Observatory.
ARs are critical for the West’s water and snowpack
Whether you compare ARs to the Amazon or the Mississippi, there’s no doubt they exude wetness, so they can have far-reaching effects on the West’s water resources, for better or worse.
On average, a few AR events contribute 30% to 50% of the annual precipitation in West Coast states, according to NOAA. A 2019 paper in Geophysical Research Letters concluded that AR storm days are responsible for about one-quarter of the snowpack in the Sierra Nevada and one-third of the snowpack in the Cascades of Oregon and Washington.
Even the Rocky Mountains benefit from ARs. A 2021 study in Geophysical Research Letters estimated that the snow produced by ARs accounts for 31% of the peak snow water equivalent in the Upper Colorado River Basin, where the majority of the river’s flow originates.
“Atmospheric river” is a relatively new term
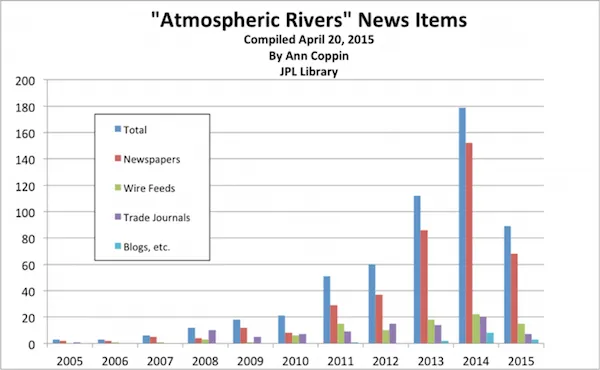
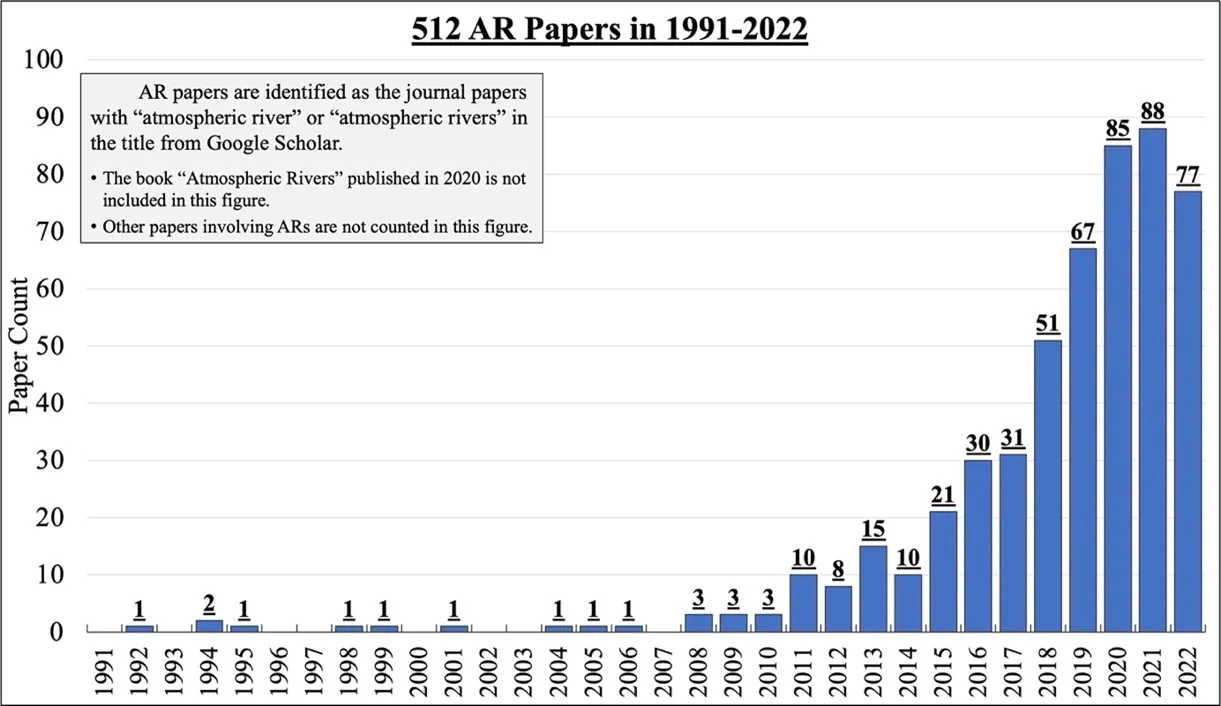
ARs have been a big deal for eons—an average of about 11 are present on Earth at any time—but it wasn’t until the 21st century that the term entered into general circulation. The two graphics below, from NASA’s Jet Propulsion Laboratory and the Center for Western Weather and Water Extremes (CW3E) at the Scripps Institution of Oceanography, show the term’s growing use in news stories and peer-reviewed journal articles.
Source: CW3E.
Source: CW3E.
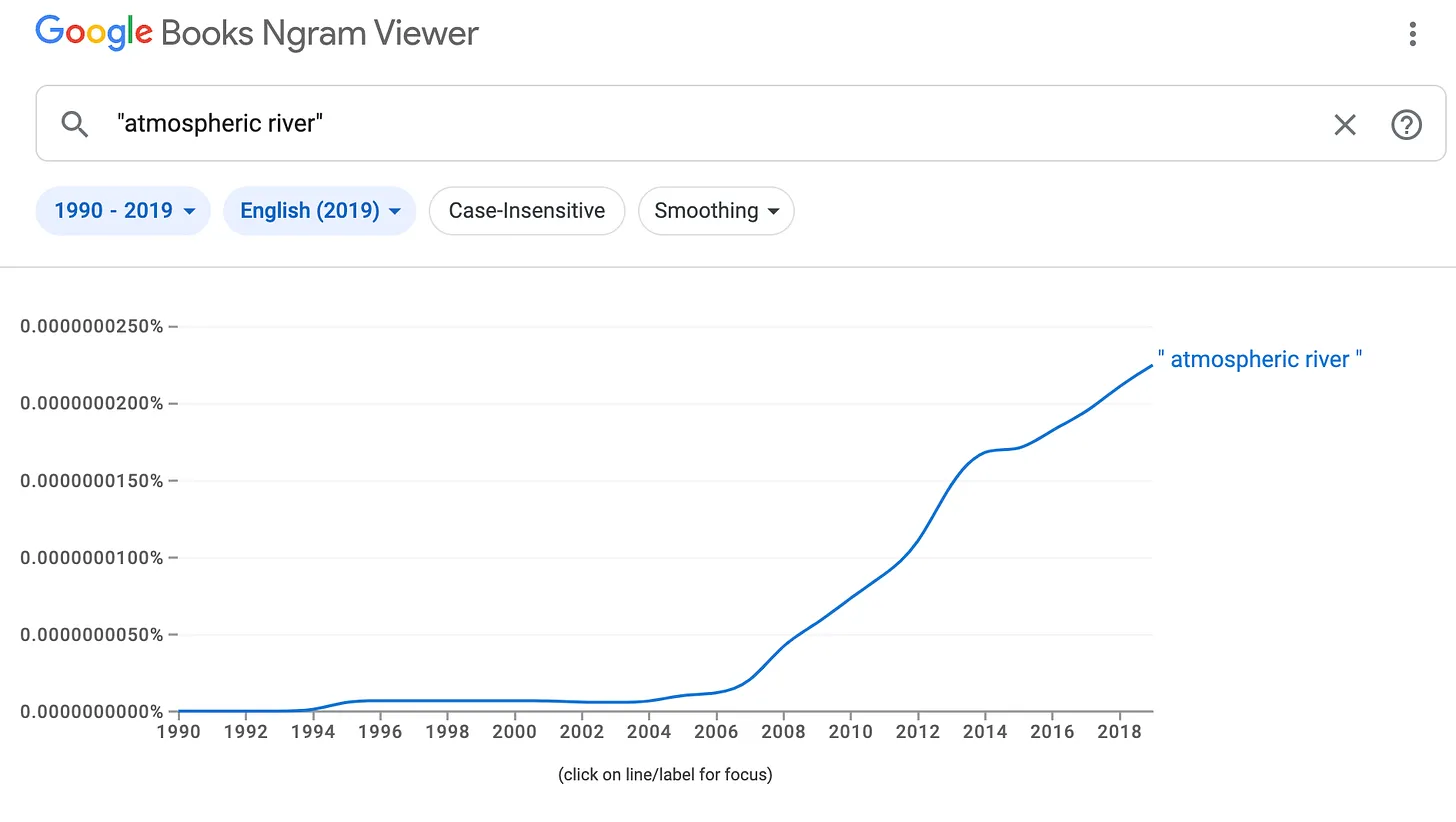
I took a peek at Google Ngram, which analyzes the text in books, and also found a sharp rise in the term’s use.
Source: Google Ngram Viewer
Some experts think the analogy to a terrestrial river is inappropriate, and some think the term is “duplicative of preexisting concepts, such as the warm conveyor belt,” according to this article in the Bulletin of the American Meteorological Society. Nevertheless, “atmospheric river” has jumped from peer-reviewed journals to water cooler conversations, not unlike “polar vortex,” “bomb cyclone,” and “heat dome.”
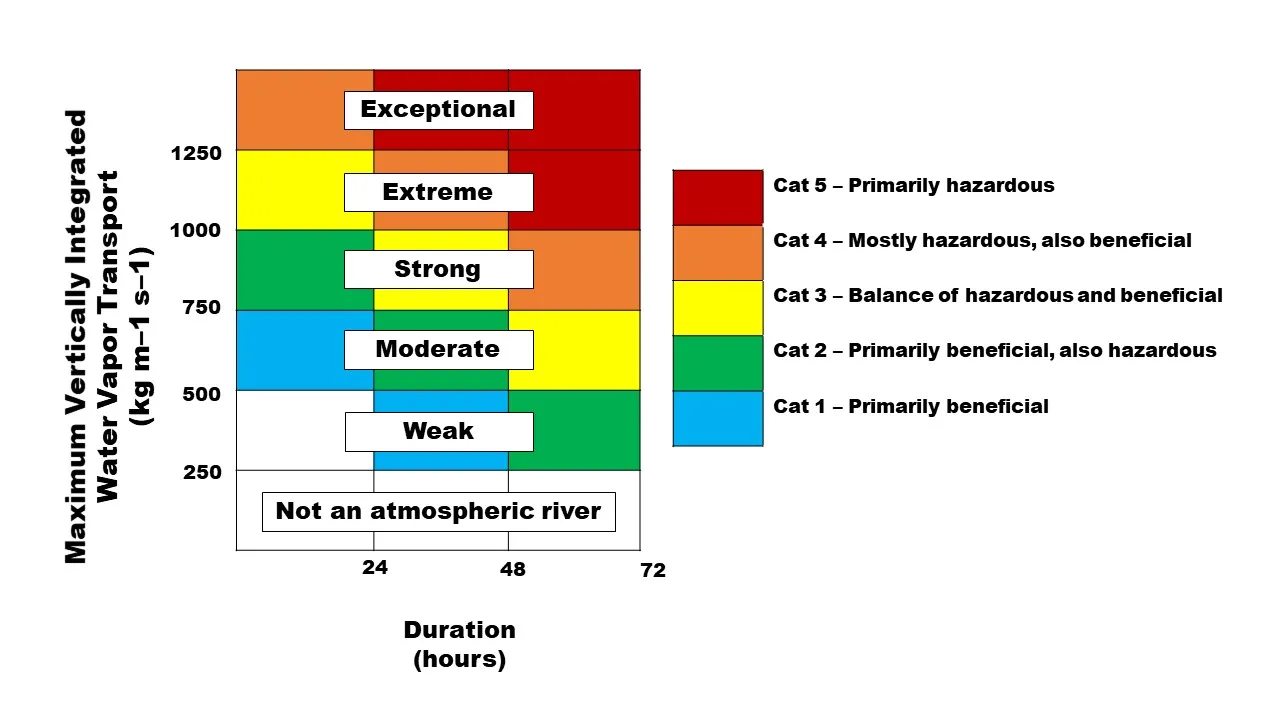
The AR Scale is based on two factors: the duration of the event and its “maximum vertically integrated water vapor transport,” a measure of its water content and the speed at which it’s moving. As shown in the graphic below, there are five categories, with the bottom two described as primarily beneficial.
Atmospheric rivers scales. Source: U.S. Geological Survey, adapted from Ralph et al. 2019.
One way to summarize AR forecasts is shown below in a set of maps from CW3E, which describe conditions along three locations—coastal, foothills, and inland—from January 30 to February 6.
Source: The Water Desk compilation of maps from CW3E.
The forecast shows the southern Oregon coast is expected to reach Category 5, the most severe level, while other areas along the Pacific Ocean will reach Categories 3 and 4. Farther inland, conditions are expected to be less extreme, but at higher elevations, it’ll definitely be dumping.
ARs can end droughts but also cause major flooding
As noted by the AR Scale, these events can be both helpful and hazardous. On the positive side, ARs can be effective drought busters. A 2013 study in the Journal of Hydrometeorology concluded that about one-third of persistent droughts in California have been erased by AR storms, with 60% to 74% of droughts in the Pacific Northwest ending this way.
On the negative side of the ledger, ARs have been responsible for some of the worst floods on the West Coast, including nearly 90% of California’s flood damage. Even this week’s weather prompted some internet rumors that California would be subject to a “megaflood” of biblical proportions, according to this Los Angeles Times story, which noted that experts don’t think this is “the big one.”
One doomsday scenario, known as “ARkStorm,” is a 1,000-year event featuring wave after wave of ARs flooding large portions of California, displacing up to 10 million people, and causing a $1 trillion disaster. For more on this potential nightmare, check out “The Trillion-Gallon Question,” a 2023 story by Christopher Cox in The New York Times Magazine about the potential fragility of California’s water infrastructure.
And let’s not forget about the wind. “Atmospheric rivers are among the most damaging storm types in the middle latitudes, especially with regard to the hazardous wind they produce,” according to NASA. Researchers at the Jet Propulsion Laboratory found that ARs were to blame for up to half of the most destructive windstorms over the last two decades. In a 2017 study in Nature Geoscience, scientists concluded:
“Landfalling atmospheric rivers are associated with about 40–75% of extreme wind and precipitation events over 40% of the world’s coastlines. Atmospheric rivers are associated with a doubling or more of the typical wind speed compared to all storm conditions, and a 50–100% increase in the wind and precipitation values for extreme events.”
Climate change will intensify ARs
As the planet continues warming, scientists expect ARs to strengthen. A warmer atmosphere can hold more water, so climate change is projected to boost the intensity of downpours. NASA scientists predict that by the end of the 21st century, climate change will make ARs about 25% wider and longer while increasing the global frequency of AR conditions, such as heavy rain and strong winds, by around 50%.
A 2021 paper focused on the West concluded that for every 1◦C of additional warming, annual average flood damages will rise by about $1 billion. Because warming is causing the snow level to rise, atmospheric rivers are more likely to drop rain, so they may not be as helpful to the snowpack, and when rain falls on snow, that can cause huge problems with flooding and debris flows.
The odds of an ARkStorm have doubled due to climate change and “runoff in the future extreme storm scenario is 200 to 400% greater than historical values in the Sierra Nevada because of increased precipitation rates and decreased snow fraction,” according to a 2022 paper in Science Advances.
For a great overview of climate change and ARs, see this recent Washington Post storyfrom Kasha Patel. And check out this fascinating piece from Ian James at The Los Angeles Times to learn how scientists are using a hurricane-reconnaissance jet to study ARs.
Update: snowpack and snow drought
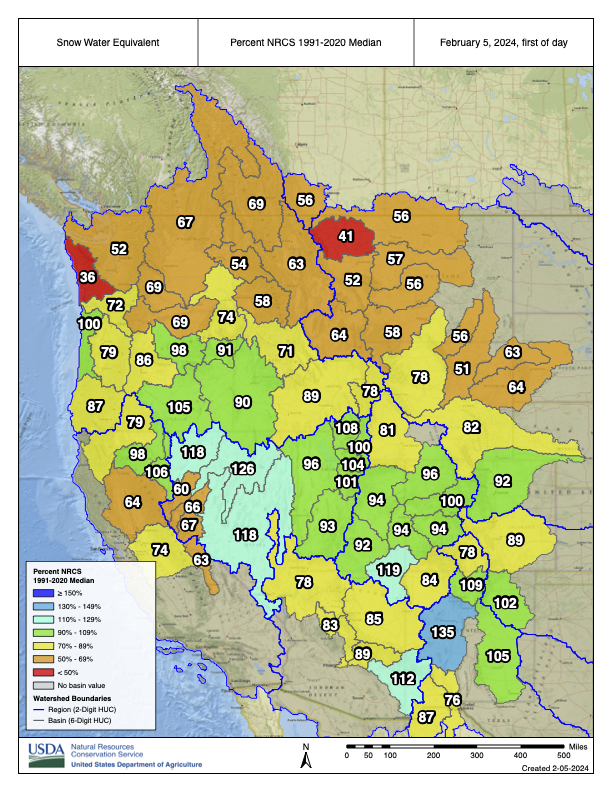
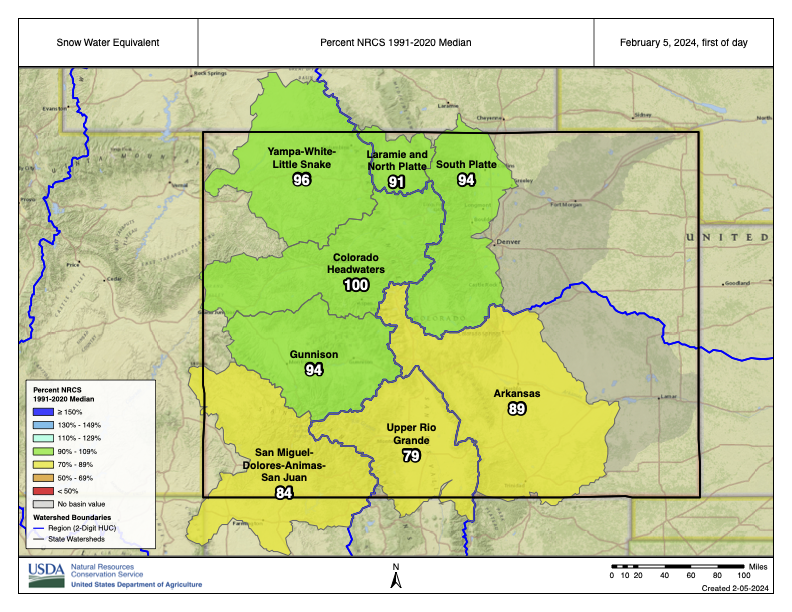
Many parts of the West could use some moisture, as shown by all the yellow, orange, and red in the January 31 map below of the region’s snowpack, but the green and blue colors depict basins where conditions are near or above normal.
Westwide SNOTEL basin-filled map February 5, 2024 via the NRCS.
In its January 26 update, “Snow Drought in Much of the Intermountain West Region Despite El Niño,” the National Integrated Drought Information System reported that snow water equivalent was 85.1% of the median in the Upper Colorado River Basin and 68.5% in the lower basin.
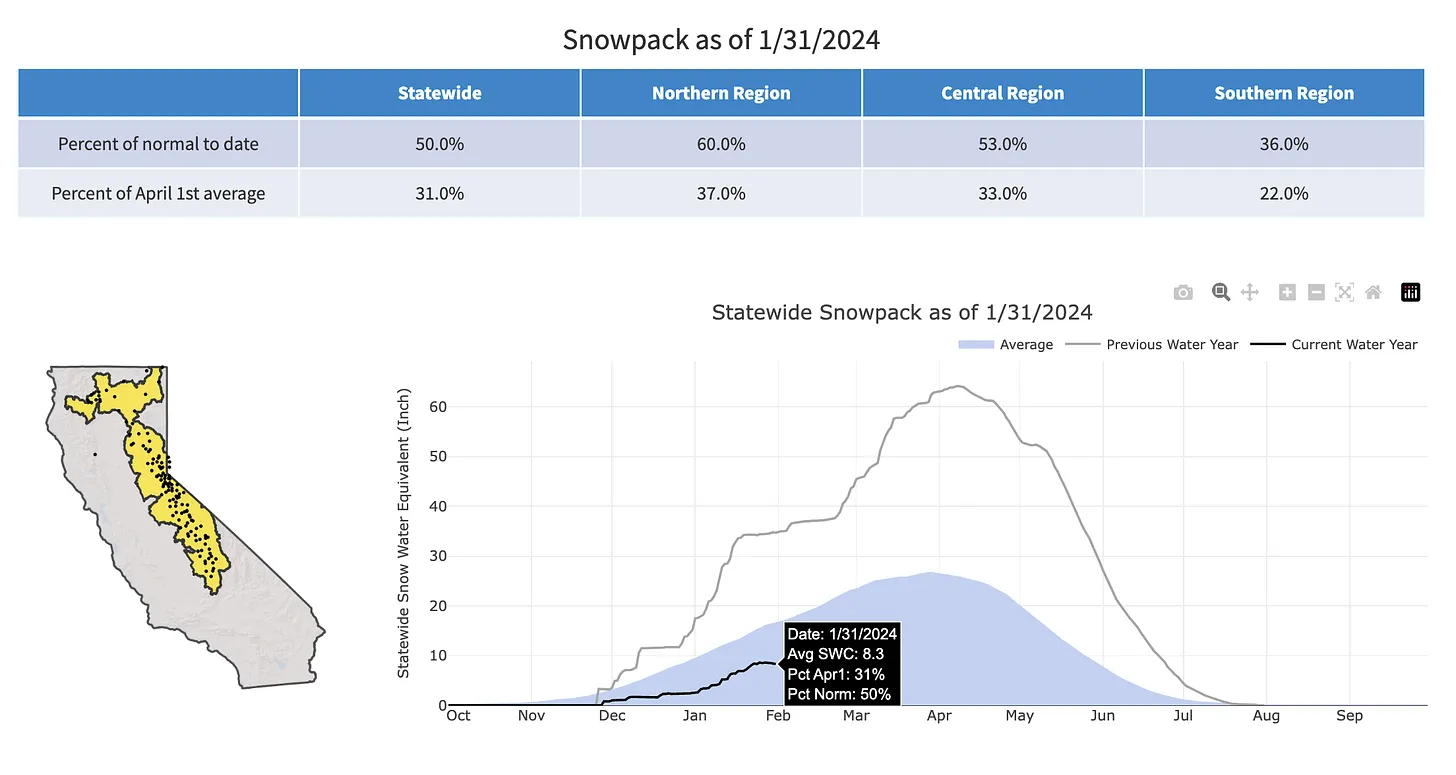
In California, the ARs will provide a big boost to the Sierra snowpack, which has been significantly below average all season. As shown below, the statewide snowpack on January 31 was just 50% of normal and only 31% of the April 1 average.
Source: California Department of Water Resources.
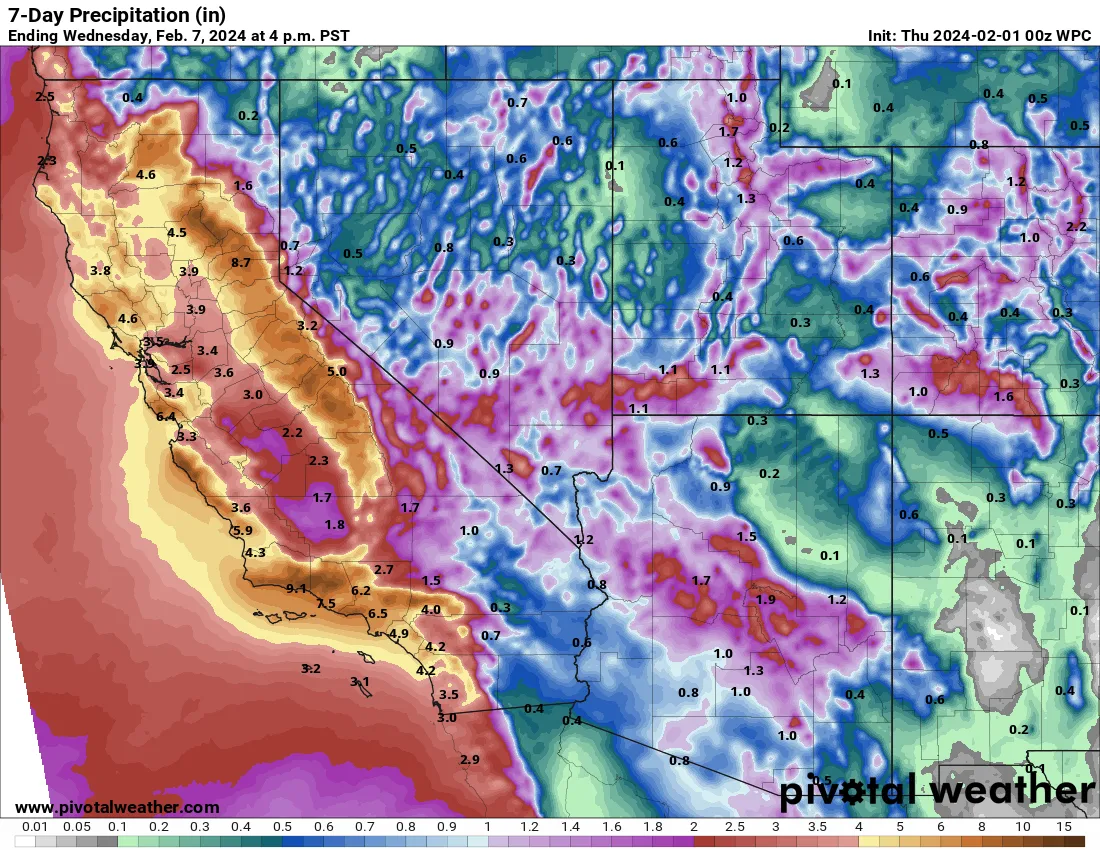
In summary, the West’s snowpack this winter has been lackluster in many areas, though some basins are actually above normal, and the near term looks wet. The January 31 map below shows the 7-day forecast for liquid precipitation, so expect to see a lot of those snowpack numbers jump!