As the #ColoradoRiver shrinks, states continue to tussle over cuts — Jonathan P. Thompson (@Land_Desk) #COriver #aridification

Enigmatic artwork with Glen Canyon Dam in the background. Jonathan P. Thompson photo.

Click the link to read the article on The Land Desk website (Jonathan P. Thompson):

The two groups of Colorado River watershed states — the Upper Basin and the Lower Basin — have each come up with a respective preliminary plan for how to deal with a shrinking supply of water in the river and its tributaries. And, surprise surprise, they don’t agree: They both want the other team to take a bigger hit. 

Way back in early 1900s, the question facing these seven states was how to divide up the waters of the Colorado River, first between the two basins, then between the states within each basin. The 1922 Colorado River Compact answered that question. Sort of. The Compact is flawed in many ways, including that the folks who signed onto it thought there was a bunch more water than actually flowed in the river — even back then. 

I like to run this one again from time to time, just to remind folks how much the population of the West has grown over the last century. This is what the signers of the Colorado River Compact were dealing with as far as water users go — compared to some 40 million users now. Source: USGS.

Now there’s even less water and higher consumption. If the river users don’t make some major cuts and soon, the reservoirs will dry up and leave the Southwest’s cities, towns, and farms to fight over the diminishing scraps. 

“We can no longer accept the status quo of the Colorado River operations,” said Becky Mitchell, Colorado’s representative on the Upper Colorado River Commission, in a press release. “If we want to protect the system and ensure certainty for the 40 million people who rely on this water source, then we need to address the existing imbalance between supply and demand.” 

Map of the Colorado River drainage basin, created using USGS data. By Shannon1 Creative Commons Attribution-Share Alike 4.0

So now the question facing the states is similar to the one they asked 102 years ago, but with a twist: How should those deep cuts be divided up now that global heating is depleting the river’s flow? 

It’s a tough question with no easy answers. And it’s all made more difficult by a lack of clarity regarding the definition of terms in the original Compact such as “beneficial consumptive use” and “surplus,” and how to measure those things. Where does use of tributaries that run into the Colorado below Lee Ferry, such as the Gila River, the Little Colorado, and the Virgin River fit into all of this?

The “natural flow” is the estimated amount of water that would flow past Lee Ferry (below Glen Canyon Dam) if there were no upstream dams, diversions, or withdrawals. The Colorado River Compact was based on the assumption that about 16 million acre-feet flowed past Lee Ferry per year (which is not unreasonable given the abnormally high flows between 1906 and the late 1920s). In fact, the 1906-1923 median is about 14.5 MAF (with an average of about 14.7 MAF). And the 1991-2023 average is 13.2 MAF. Yikes! Source: Bureau of Reclamation.

Until those definitions are agreed upon, we won’t really know whether the Lower Basin is using the amount of water allocated to it in the Compact (8.5 million acre-feet), or significantly more than that (10.1 million acre-feet). Until we know what “surplus” means, we won’t know who is responsible for ensuring Mexico gets its allocated share. So far there is no agreement on those definitions. (For a detailed and intelligent take on this, please see Eric Kuhn’s and John Fleck’s piece on Fleck’s Inkstain blog). 

The good news is that the current proposals aren’t final; there is still time for the basins to negotiate. And the two basins’ representatives are inching closer to accord, finding harmony where it previously eluded them. The two alternatives agree:

  • That consumption cuts should be triggered not by forecasted water levels in Lake Mead, but by current hydrologic conditions throughout the entire system. However, they differ on how to measure those conditions. 
  • And that the Lower Basin should include evaporation and seepage — totaling an estimated 1.3 million acre-feet per year — in its consumptive use, as the Upper Basin has always done. They plan to offset this loss by cutting consumption by 1.5 million acre-feet per year. 
Total losses (evaporation and riparian ET) from Reach 1 through Reach 5. Credit: USBR

The main sticking point comes when reservoirs shrink to critically low levels:

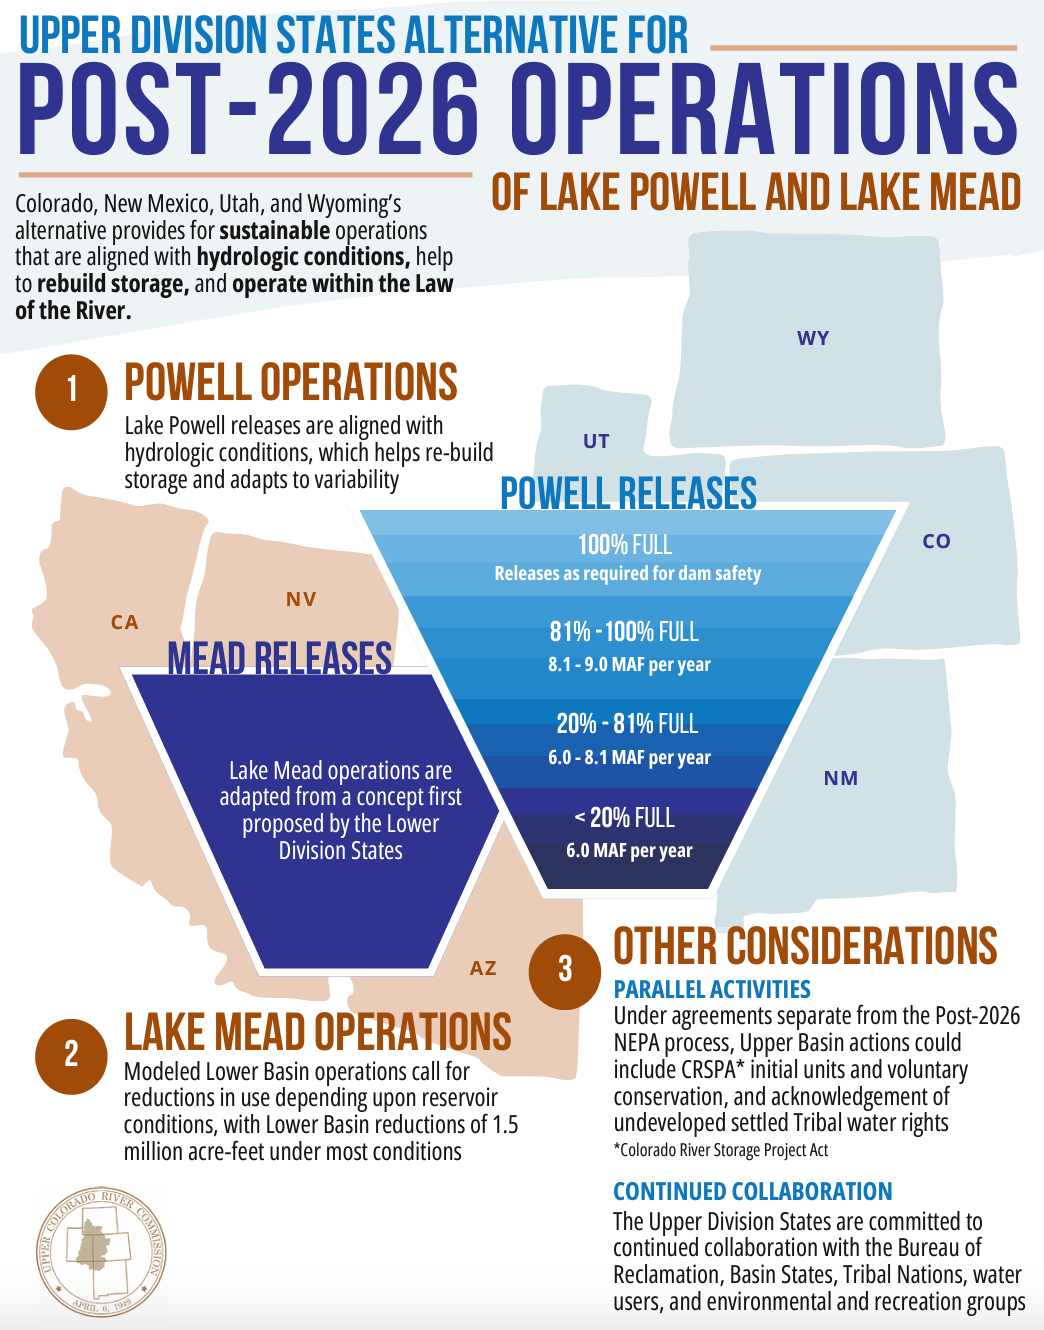
  • Under the Upper Basin’s plan, as storage levels drop, they would release progressively less water from Lake Powell. So if water storage is 81% to 100% full, then they’d release 8.1 to 9 MAF from Glen Canyon Dam, giving the Lower Basin their full allocation. But if storage is less than 20% full, it would release just 6 MAF per year, giving the Lower Basin 2.5 MAF less than their allocation that year — presumably forcing them to cut that same amount of consumption. Whether and how much consumption the Upper Basin would have to cut under this scenario would depend on how much water is actually in the river. It’s important to note that the Upper Basin does not and has never used its full allocation of 7.5 MAF per year.
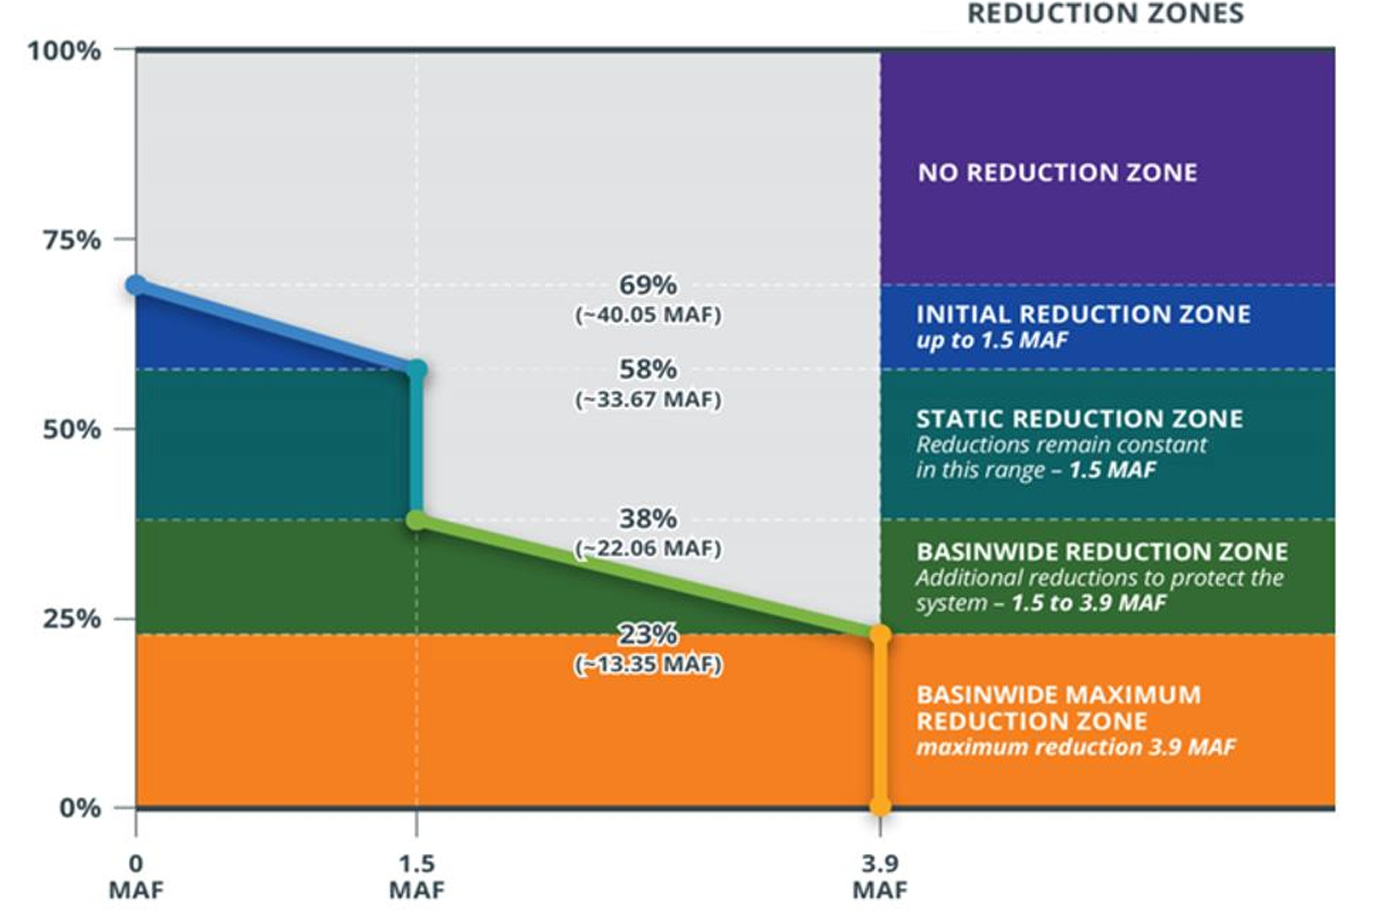
  • Under the Lower Basin’s plan, when the system is between 38% and 70% full, the Lower Basin would cut its consumption by 1.5 MAF per year. When system water levels drop below that, then the Lower Basin would continue its 1.5 MAF per year cuts, and the two basins would share any cuts above that up to a maximum of 3.9 MAF per year. So under the maximum cuts, the Lower Basin would reduce usage by 2.7 MAF while the Upper Basin would cut use by 1.2 MAF. 
The Upper Basin’s alternative, summed up. Source: Upper Colorado River Commission.
The Lower Basin’s proposed framework for reductions. The Lower Basin would make all of the cuts (1.5 MAF per year) down to 38%, after which the two basins would evenly split any reductions beyond 1.5 MAF. Source: Lower Basin states.

Both basins’ alternatives mention and acknowledge that many tribal nations’ water rights remain unfulfilled, and yet say little about how the situation might be rectified. And each Basin says its respective plan is the most sustainable, is most likely to keep Hoover and Glen Canyon dams from being compromised, and complies with the Law of the River — or the set of treaties, compacts, and court cases that govern how the river is used. 

Yet the sustainability or health of the Colorado River as an entity — a breathing, flowing, living being — is barely mentioned. Little thought is given to the ecosystems, cultures, and creatures the river sustains. I realize that’s not the point of this exercise. And yet, ultimately, it will be the River itself that lays down the law, not century-old compacts or legal precedents or antiquated water rights. Perhaps we ought to pay it a little more respect. 

FURTHER READING: 

  • Ya gotta check out the Colorado River Science wiki. All kinds of good resources there. 
  • Ditto for On the Colorado, a clearinghouse for all kinds of information on the River.
  • Aspen Journalism’s Heather Sackett did a thorough writeup of the two proposed alternatives. 
  • You want the wonky, nitty-gritty details on Western water? Then go to John Fleck’s Inkstain blog and spend some time. 
  • And finally, a Land Desk primer on the Colorado Compact. For paid subscribers only, I’m afraid:

The Colorado River Compact 

JONATHAN P. THOMPSON March 8, 2024

Colorado River, Black Canyon back in the day, site of Hoover Dam

Editor’s Note: This essay first appeared in the High Country News November 11, 2022.

Read full story

#Drought news March 14, 2024: West-central #Wyoming, north-central #Colorado, and northeast #Utah all saw areas of improvement due to lower evaporative demand and improving #snowpack

Click on a thumbnail graphic to view a gallery of drought data from the US Drought Monitor website.

Click the link to go to the US Drought Monitor website. Here’s an excerpt:

This Week’s Drought Summary

Moderate to heavy rain amounts fell across parts of the Southeast and Northeast this week, leading to localized improvements to ongoing drought and abnormal dryness in the Southeast, and mostly unchanged conditions in the Northeast, aside from western New York, which missed out on the heavier precipitation and saw minor degradations. The central third of the contiguous U.S. saw a mix of improvements and degradations, based on where heavier precipitation did or did not fall and where dry and windy conditions continued. Parts of Illinois, Indiana, Ohio, the Michigan Lower Peninsula, southern Missouri and southeast Kansas saw improving conditions after heavier rains fell there. Meanwhile, moderate drought expanded in northwest Missouri and portions of west-central Wisconsin, Minnesota, northwest Iowa, the far southern Michigan Upper Peninsula and far northeast Wisconsin. Much of Texas remained the same, with a few degradations in the southeast corner and several degradations in central and southern Texas where long-term drought conditions are still causing impacts. Recent dryness and warm and windy weather in northwest Oklahoma and the Texas and Oklahoma panhandles led to abnormal dryness developing there. Short-term dryness and high evaporative demand led to large areas of degrading conditions in northeast Wyoming, while west-central Wyoming, north-central Colorado, northeast Utah, western Montana, and the northern Idaho Panhandle all saw areas of improvement due to lower evaporative demand and improving snowpack recently. In Hawaii, an active trade wind pattern continued, leading to some improvements on the windward (northeast) slopes of the Big Island and Kauai, while a small area of moderate drought developed on the leeward (southwest) portion of Kauai. In Puerto Rico, a few improvements were made where recent rainfall has improved streamflows and crop stress, and lessened rainfall deficits and raised reservoir levels. No changes were made to the Drought Monitor this week in Alaska…

High Plains

Eastern parts of the High Plains region were mostly warmer than normal this week, with temperatures 8-10 degrees above normal occurring in the eastern Dakotas. Colder-than-normal weather occurred in western Wyoming and parts of Colorado. Localized heavy rains from severe thunderstorms this week occurred in parts of central and southeast Kansas, leading to localized improvements to ongoing drought and abnormal dryness. In south-central and southwest Kansas, abnormal dryness developed where dry weather from the past couple of months combined with warm and windy conditions, similar to those experienced in northwest Oklahoma and parts of the Texas and Oklahoma panhandles. In southwest Nebraska, localized improvements were made to an area of abnormal dryness after a major snowstorm struck the area. Recent dry, warm and windy weather led to a small expansion of abnormal dryness in northeast Nebraska and far southeast South Dakota. In northeast Wyoming and adjacent southwest South Dakota, recent dry, warm and windy weather led to expansions of abnormal dryness and moderate and severe drought. Recent snowpack improvements in the Wyoming Range of west-central Wyoming and in the Never Summer and Medicine Bow Mountains of northern Colorado led to improvements to ongoing abnormal dryness in both areas…

Colorado Drought Monitor one week change map ending March 12, 2024.

West

Temperatures across the West this week were primarily near normal or colder than normal. Compared to normal, the coldest area was southern Idaho, where temperatures mainly ranged from 6-12 degrees below normal. Portions of central and southeast Montana were 3-6 degrees above normal. Heavy precipitation fell in parts of north-central and northwest California, and along the Oregon and Washington coasts. Elsewhere, precipitation also fell in some of the mountainous parts of the northern half of the West region. After recent heavy precipitation in western Oregon and improvements to streamflow and long-term precipitation deficits, an area of abnormal dryness was removed from west-central Oregon. Given recent wetness, further improvements in the area may occur in coming weeks. In western Montana and northern Idaho, recently improved snowpack and lessening precipitation deficits led to several improvements to ongoing drought and abnormally dry conditions. Due to low evaporative demand and improved long-term precipitation deficits, northeast Utah saw reduced coverage of abnormal dryness this week…

South

Rainfall amounts this week in the South region varied widely. In western Oklahoma, south Texas, and the Oklahoma and Texas Panhandles, the weather this week was mostly dry. In north-central Texas, portions of Louisiana and Arkansas, central and southern Mississippi, and south-central Tennessee, rainfall accumulations of 1-2 inches occurred, with locally higher amounts. Much of the central and eastern part of the region saw above-normal temperatures, with readings commonly falling into the 2-8 degrees above normal window. In western Texas and the Oklahoma Panhandle, temperatures were generally closer to normal, with most readings falling somewhere between 4 degrees cooler than normal and 4 degrees warmer than normal. In south-central and southeast Tennessee, recent rainfall improved streamflows and precipitation deficits enough to result in improvements. Farther west in west-central and northwest Tennessee and adjacent east-central Arkansas, abnormally dry conditions expanded where short-term precipitation deficits paired with high evaporative demand and lowering streamflow. In areas of recent heavy rainfall in Louisiana, precipitation deficits lessened and soil moisture profiles improved enough for improvements in areas of abnormal dryness and moderate drought. In southeast Texas and nearby southwest Louisiana, abnormal dryness expanded and moderate drought developed where recent dryness and high evaporative demand combined with decreasing soil moisture and streamflow numbers. In central Texas, recent localized dryness occurred on top of long-term dryness and drought, which combined with very low streamflow in many locations to lead to expansion of drought and abnormal dryness areas. In the northeast Texas Panhandle and adjacent Oklahoma Panhandle and northwest Oklahoma, dry weather over the last couple of months combined with high evaporative demand led to the development of abnormal dryness. In these areas, wildfires have been common recently…

Looking Ahead

According to forecasts from the National Weather Service Weather Prediction Center, heavy snowfall is forecast in the Colorado Front Range area near the beginning of the forecast period (March 14-15), while heavy precipitation with this storm system is also likely across other parts of the Four Corners states. Aside from portions of the Four Corners states, much of the West is likely to stay dry through Monday evening. Farther east, through Monday evening, half an inch (or more) of precipitation is forecast from central Nebraska eastward into parts of the Rust Belt. Rainfall amounts of a half inch to 2 inches, with locally higher amounts, is also forecast from central Texas eastward through southeast Oklahoma, Arkansas and southeast Missouri to most of Georgia and Tennessee and southern Kentucky.

The National Weather Service Climate Prediction Center 6-10 day forecast favors near-normal precipitation or above-normal precipitation across the contiguous U.S., covering the period from March 19-23. The highest confidence areas for above-normal precipitation are the Florida Peninsula, along the Gulf Coast, and from the Arizona/New Mexico border northward through Montana. Warmer-than-normal temperatures are favored across parts of the West, especially in Utah, Nevada, California, Idaho, Washington and Oregon, and in parts of the central and southern Great Plains. Below-normal temperatures are favored in the Southeast, excluding the southern Florida Peninsula where near- or above-normal temperatures are favored. Below-normal temperatures are also favored from central Montana eastward through North Dakota and northern South Dakota, Minnesota, Wisconsin and Michigan, with below-normal temperatures slightly favored in the Ohio River Valley and Rust Belt.

In Hawaii, cooler-than-normal temperatures are favored. Below-normal precipitation is likely on all islands except for the Big Island, where near-normal precipitation is favored. Warmer-than-normal weather is favored in Alaska, especially in the western reaches of the state. Wetter-than-normal weather is favored for central, northern and western Alaska, while drier-than-normal weather is favored in southeast Alaska.

US Drought Monitor one week change map ending March 12, 2024.
Westwide SNOTEL basin-filled map March 15, 2024 via the NRCS.

Earth just had its warmest February on record: Northern and Southern Hemispheres had record-warm seasons — NOAA

Chile forest fires: At least 112 dead in Valparaíso region | BBC News

Click the link to read the article on the NOAA website (John Bateman):

Last month continued the world’s record-warm streak, with February 2024 ranking as the planet’s warmest February on record — the ninth month in a row of record-warm months.

What’s more, February 2024 wrapped up both hemispheres’ warmest December-through-February period on record, according to scientists from NOAA’s National Centers for Environmental Information.

Below are highlights from NOAA’s latest monthly global climate report:

Climate by the numbers

February 2024 | Season (December 2023 – February 2024)

The February global land and ocean surface temperature was 2.52 degrees F (1.40 degrees C) above the 20th-century average of 53.8 degrees F (12.1 degrees C), ranking as the warmest February in NOAA’s 175-year global climate record.

Looking how continents ranked, Europe, North America and South America had their warmest February on record, while Africa had its second warmest.

The three-month season (December 2023–February 2024) was the Northern Hemisphere’s warmest meteorological winter and the Southern Hemisphere’s warmest meteorological summer on record, with a global surface temperature of 2.45 degrees F (1.36 degrees C) above the 20th-century average. 

The year-to-date (January and February 2024) temperature currently ranks as the world’s warmest such period on record. There is a 45% chance that 2024 will be the warmest year in NOAA’s 175-year record and a 99% chance it will rank in the top five.

An annotated map of the world plotted with February 2024’s most significant climate events. See the story below as well as the report summary from NOAA NCEI at http://bit.ly/Global202402 offsite link. (Image credit: NOAA/NCEI)

Other notable climate events

Global sea ice coverage was sparse: Global sea ice extent (coverage) was the fourth smallest in the 46-year record, at 460,000 square miles below the 1991–2020 average. Arctic sea ice extent was slightly below average (by 100,000 square miles), whereas Antarctic sea ice extent was substantially below average (by 370,000 square miles), ranking second smallest on record.

Tropical activity was above average: Eleven named storms spun around the globe in February, which was above the 1991–2020 average of seven named storms. Only two storms made landfall, both bringing gusty winds to northern Australia. The only major tropical cyclone was Very Intense Tropical Cyclone Djoungou, which remained in the central Indian Ocean, well away from any major land masses. There were no active storms in the Pacific Ocean or the North Atlantic, but there was one weak tropical cyclone (Akara) in the South Atlantic, which is notable because atmospheric conditions usually inhibit tropical storm development in that basin.

More > Access NOAA’s latest climate report and download the images.