How much did #ElNiño influence precipitation over the United States this past winter? — NOAA #ENSO

Click the link to read the article on the NOAA website (Nat Johnson):

March 28, 2024

Last November, I wrote about how a strong El Niño might shape precipitation over the U.S. this winter (December – February). So, what happened? With crocuses now starting to bloom and the chirps of spring peepers in full chorus, we’re ready to investigate!

An El Niño-ish big picture

First, let’s acknowledge that a strong El Niño occurred this winter, as NOAA had been forecasting since issuing an El Niño Watch in April 2023. (If we couldn’t check that box, this would be a very short post!) We unofficially consider El Niño to be “strong” when the Oceanic Niño Index (ONI) exceeds 1.5 °C (2.7 °F), and the ONI value for this past December – February was well above that threshold at 1.8 °C.

(left to right) The precipitation difference from average for this past winter (Dec-Feb 2023-24) and the geographic pattern of precipitation we’d expect for this past winter based on past El Niño winters from 1952-2022. The precipitation pattern for this past winter is a reasonably good match to the El Niño pattern. NOAA Climate.gov image, based on analysis by Nat Johnson.

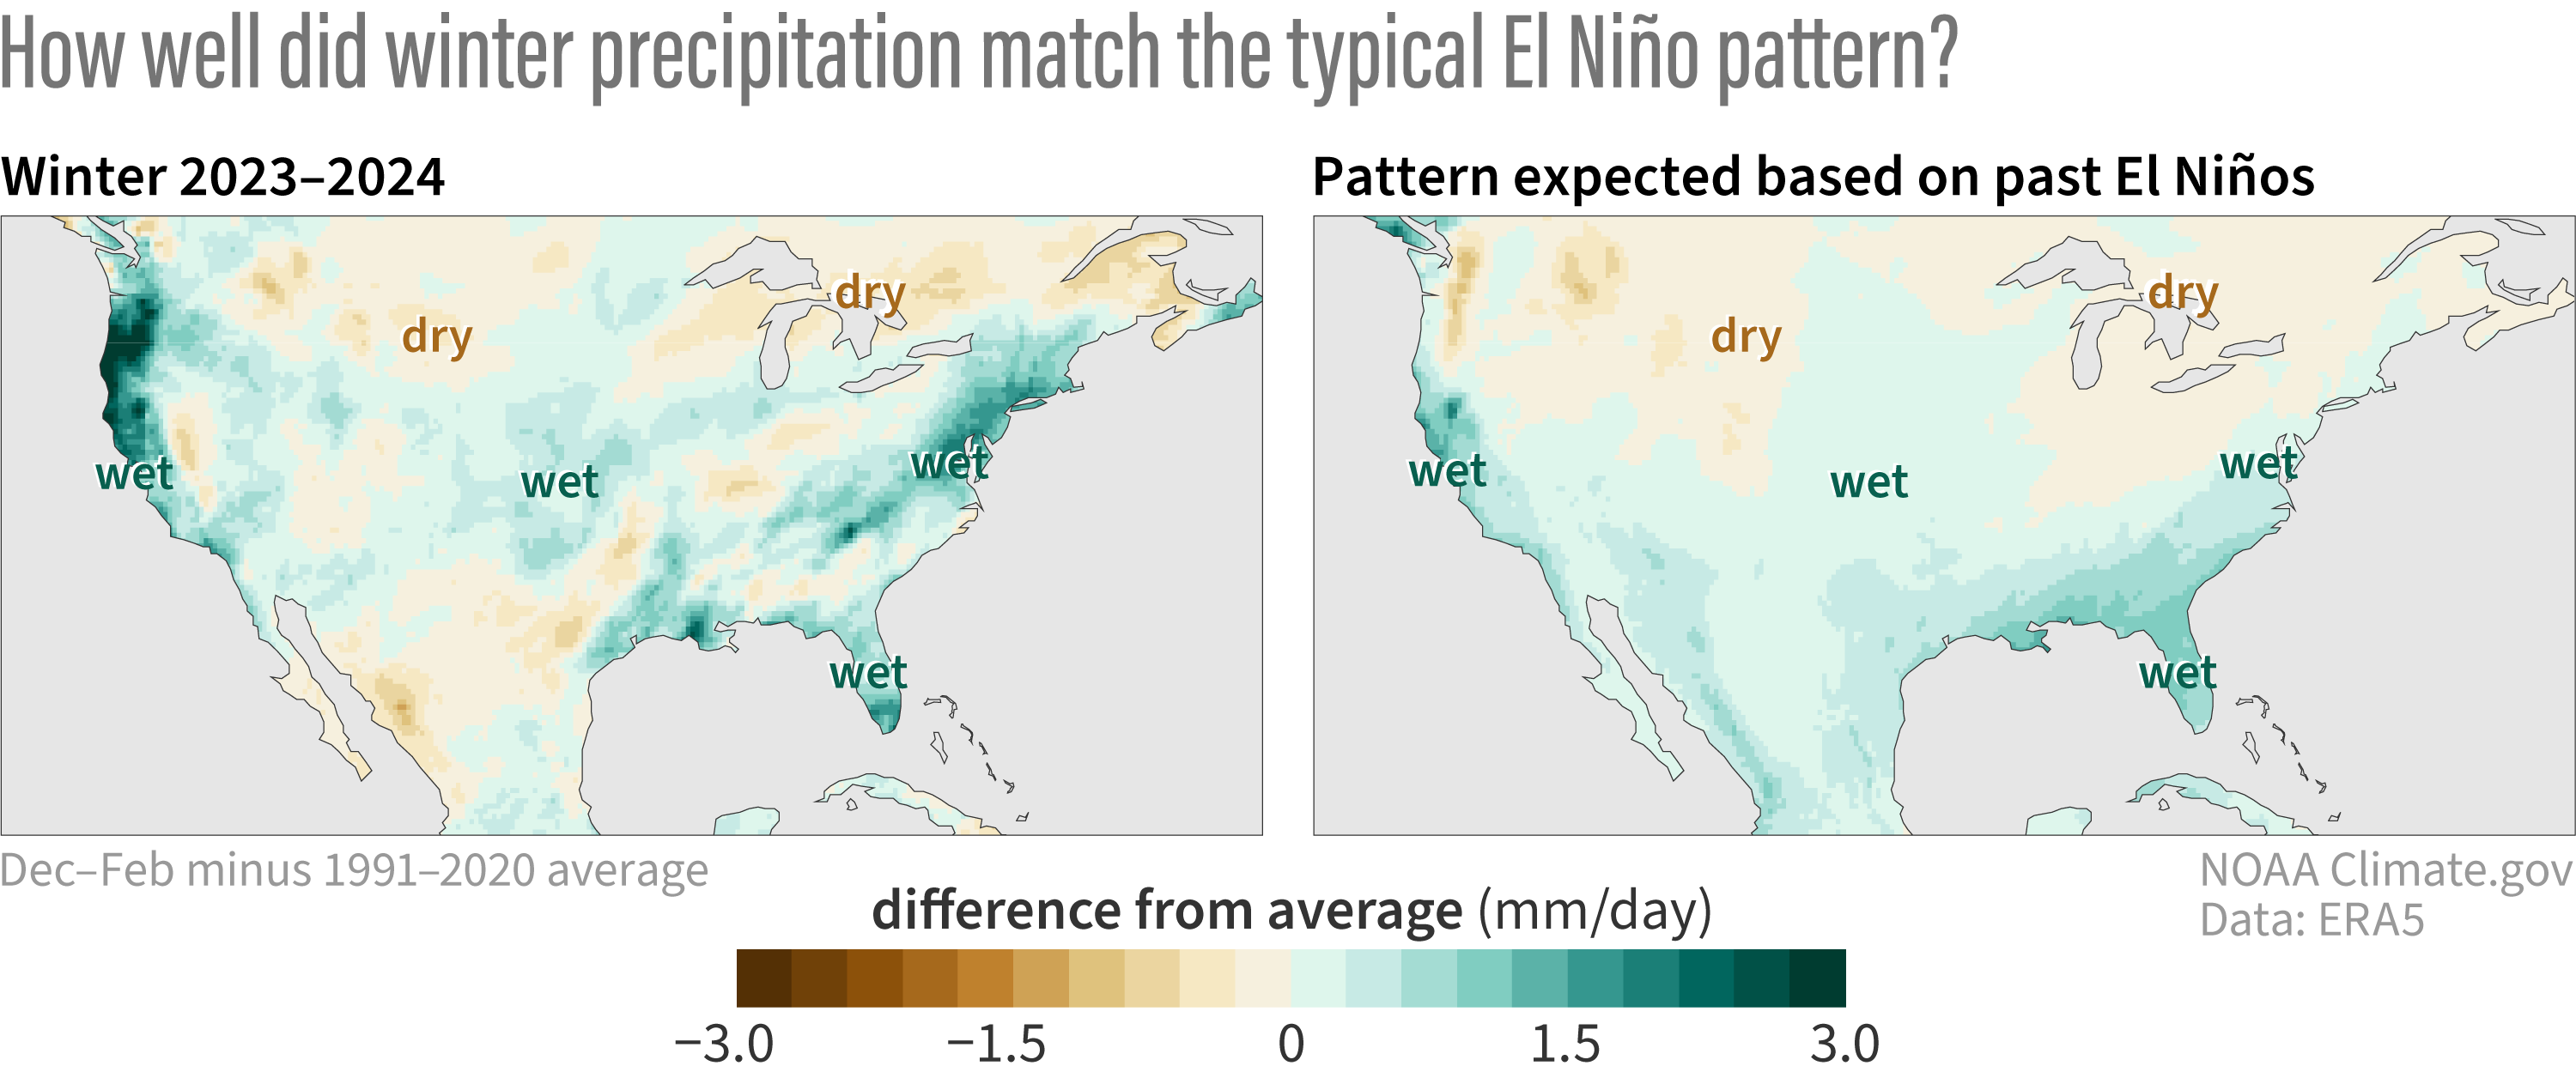
What happened with precipitation around the contiguous U.S.? Winter was wetter than normal overall, and as the map above and to the left indicates, wetter conditions were most pronounced across coastal areas, especially the West and Gulf Coasts and from the Mid-Atlantic to the Northeast. Wetter conditions also prevailed over most of the Central and Northern Plains. Drier-than-average conditions were much less expansive, but below-normal precipitation occurred around the Northern Rockies and portions of the south-central U.S. and extending southward into northern Mexico.

How much influence did El Niño have? If we compare the actual precipitation map for this winter with the expected winter El Niño precipitation pattern (1) to its right, we see a lot of similarities! In particular, the shifts in the jet stream induced by El Niño bring wetter conditions to the southern tier of the U.S., especially in California and the Southeast (with some mind-boggling atmospheric river events observed in California in particular).

At least by eye, we can affirm a decent match with the expected El Niño influence, but we’re scientists, so subjectivity alone isn’t going to cut it. To quantify the match between the actual and expected El Niño precipitation pattern, I will use a measure I used last November called the pattern correlation. To recap, values can range from -1 to +1, with values closer to +1 indicating a good match between the observations and typical El Niño pattern, values near 0 indicating no match, and negative values closer to -1 indicating an inverse match (observations look more like La Niña!). For some historical context, the pattern correlations between observations and the expected El Niño winter precipitation are shown below for all moderate-to-strong El Niños since 1950 (ONI values equal to or greater than 1.0 °C).

One way to evaluate how well the observed winter precipitation pattern matched the typical El Niño pattern is to calculate an overall correlation “score” that describes how well the two patterns matched. A score of 1 means a perfect match, a score of 0 means no match at all, and a score of -1 means an inverse match, or a mirror image, such as you might expect to see during a La Niña winter. The plot above shows these correlation scores for all moderate-to-strong El Niños since 1950. Almost all moderate-to-strong Niños, including the winter of 2023/24, had a score well above zero, indicating that the actual winter precipitation pattern was a reasonably good match to the typical El Niño pattern. NOAA Climate.gov image, adapted from original by Nat Johnson.

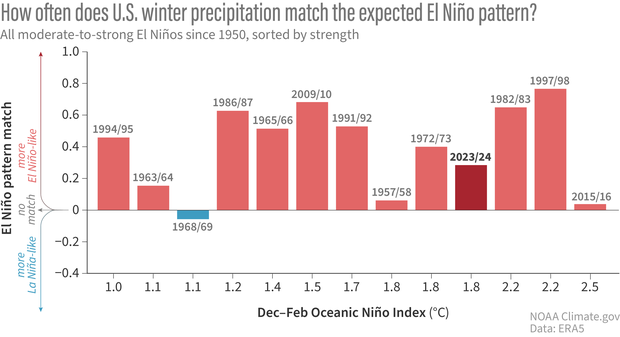
This past winter the pattern correlation was positive and around 0.3, which is a reasonably good match between what we saw and the expected El Niño precipitation pattern. Moreover, most previous moderate-to-strong El Niños matched the expected pattern at least as well as in 2023/24. There are some exceptions, like the winters of 1968/69, 1957/58, and most recently 2015/16, but the figure above supports the general rule that El Niño’s fingerprints are conspicuous whenever El Niño is at least of moderate strength.

What about the differences?

Of course, we shouldn’t just sweep the mismatches under the rug. There were many backyards this winter that did not experience the typical precipitation impacts for an El Niño of this strength. In particular, the Pacific Northwest and Northeast were considerably wetter than the expected El Niño pattern, while portions of the southern tier from southern Texas to the Southeast were notably drier.

So, why did we experience these deviations from the expected El Niño precipitation pattern? And, perhaps more importantly, were there other climate signals that were predictable? The answers to these questions require more thorough analysis than I can provide here, and I’m sure that scientists will try to come up with the answers in the coming months and years ahead (stay tuned for next month’s post!). Nevertheless, we can take a stab at seeking some early clues.

Fluttering butterflies?

We first have to consider the most boring and most frustrating possible culprit for the discrepancy – the chaos of weather or internal variability. Recall that when we consider our computer climate models – like from the North American Multi-Model Ensemble (NMME) – we look at the average of up to hundreds of individual forecast maps. This average, called the ensemble mean, filters out the influence of seasonally unpredictable, random weather and retains the seasonably predictable signal, like from ENSO. The NMME average forecast for this winter (2), shown in the top left below, closely resembles the expected El Niño precipitation pattern and features similarities with this past winter.

(top, left to right) The precipitation forecast for this coming winter (Dec-Feb 2023-24) based on the average of all the individual models in the North American Multi-Model Ensemble forecast system. The actual precipitation difference from average for this past winter. (bottom, left to right) An individual model forecast that is a very good match to what actually occurred. An individual model forecast that deviates significantly from what occurred. NOAA Climate.gov image, based on analysis by Nat Johnson.

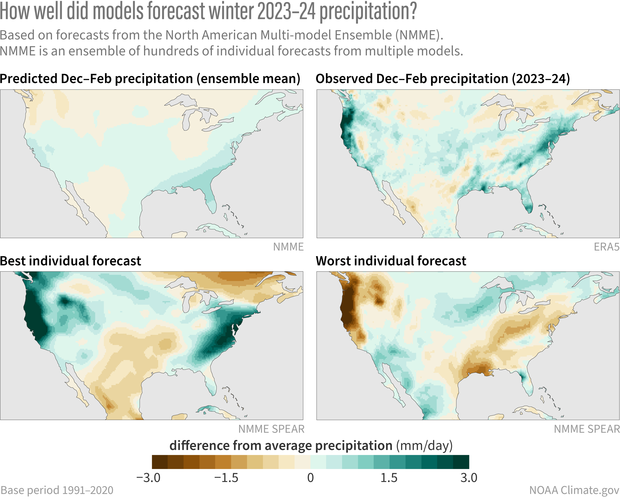
However, if we look at the hundreds of individual forecast maps that went into the ensemble mean, we see the influence of chaotic weather that can either support or oppose the pattern that actually occurred. In fact, if we search the 300+ forecast maps to find the one that best matched the actual pattern this winter (bottom left above), we see that it captured many notable features of this winter, including the very wet conditions in the Pacific Northwest, Mid-Atlantic, and Northeast.

Don’t be fooled, however – there was no way to know, in advance, that that prediction, out of the 300+ maps, would be the “best” one! We know this because we can find the worst-matching pattern (bottom right above), and we see a nearly opposite pattern, with a dry West Coast and Northeast! Both the best and worst forecasts were run in the same model forecasting system with the same El Niño, so most differences are likely attributable to the noise of random weather or internal variability.

Searching for a melody beneath the noise

Just because random, internal variability could be responsible for most of the differences between this past winter and the El Niño pattern, that doesn’t mean we’ve reached the end of our story. It’s still possible that some of the differences could be caused by other predictable factors, such as ENSO flavors, other climate phenomena, or long-term trends. One way to get an inkling of this possibility is to compare the NMME average forecast (ensemble mean) with the expected El Niño precipitation pattern. Because the NMME average has filtered out the effects of random weather, differences should be attributable to factors that are seasonally predictable, at least in climate model world.

(left to right) The difference between the North American Multi-Model Ensemble average precipitation forecast for this winter (Dec – Feb 2023-2024) and the pattern of precipitation we’d expect for this past winter based on past El Niño winters from 1952-2022. The difference between the observed precipitation pattern for this past winter and the pattern we’d expect based on past El Niño winters. The matching dry signal over the south-central U.S. and Mexico suggests that these drier conditions may have been predictable more than a season in advance. NOAA Climate.gov image, based on analysis by Nat Johnson.

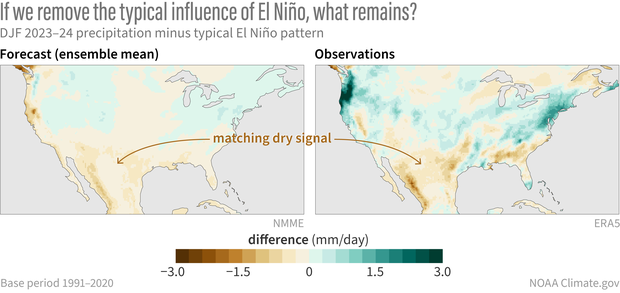
When we look at the observed deviations from the expected winter El Niño precipitation pattern in both observations (above, right) and the NMME average (above, left), we do, in fact, see some similarities! In particular, the NMME forecast indicated drier conditions over the southern tier of the U.S. and Mexico than we would expect for an El Niño of the strength that occurred. This suggests that the unusually dry conditions in this region may relate to a seasonally predictable signal beyond ENSO. We cannot rule out that some of the other observed deviations also may have been predictable but that our current forecast models were not up to the task – our models are improving but they’re still far from perfect! (3)

As mentioned above, it will take more digging to understand what factors may have resulted in any predictable deviations from the classic El Niño precipitation pattern this past winter. We’re in luck because next month Michelle will share some recent work by Dr. Clara Deser and Dr. Stephen Yeager that sheds some more light on what else might have been predictable alongside El Niño. I’m excited about this, so you definitely will want to check back next month!

Footnotes

  • As in my November post, I calculated the “expected winter El Niño precipitation pattern” as the linear regression of December-February precipitation anomalies on the Niño-3.4 index from 1952-2022. This gives a map of precipitation anomalies (in mm/day) per change in the Niño-3.4 index (in °C). The difference between my calculation here and in the November post is that here I then multiplied the regression map by the observed Niño-3.4 index for this past winter (1.8 °C) so that the map is now scaled by strength of the El Niño that actually occurred. Therefore, the expected winter El Niño precipitation pattern represents the precipitation anomalies we would expect for an El Niño of the strength that just occurred, and we can make an apples-to-apples comparison with the observed precipitation pattern.
  • As I wrote in November, I averaged all the forecasts produced in September, October, and November of this year from 7 different NMME models. Each model has a set of forecasts (ranging from 10 to 30) with slightly different initial conditions to sample the different possible realizations of chaotic weather variability. The NMME precipitation map was produced by averaging 324 individual forecast maps (108 for each of September, October, and November).
  • Note that the NMME also predicted drier conditions along the West Coast that did not actually occur. It is not clear if this model error is a result of random weather variability or a seasonally predictable signal that the models did not correctly capture.
Here are the typical outcomes from both El Niño and La Niña for the US. Note each El Niño and La Niña can present differently, these are just the average impacts. Graphic credit: NWS Salt Lake City office

Interior Department Announces Nearly $12 Million to Protect and Restore Western Wildlife Habitats and Migration Corridors

Click the link to read the release on the Department of Interior website:

March 26, 2024

The Department of the Interior and National Fish and Wildlife Foundation (NFWF) today announced $11.8 million for 10 projects in seven states that will help restore habitat connectivity and secure key migration corridors for wildlife in the American West. A total of $3 million in grants and $8.8 million in matching contributions will be invested to protect migratory species like elk, mule deer, and pronghorn and their habitats in Arizona, California, Colorado, Idaho, Montana, Oregon and Wyoming. 

“Healthy habitats and interconnected spaces to live and roam are key for the sustainability of species,” said Secretary Deb Haaland. “The Biden-Harris administration is strengthening public-private partnerships and employing an all-of-government approach to ensure the conservation of fish and wildlife in the West and across America through the protection of key migration corridors and habitats.” 

Bureau of Land Management (BLM) Director Tracy Stone-Manning and U.S. Fish and Wildlife Service (FWS) Director Martha Williams highlighted the announcement at the 89th North American Wildlife and Natural Resources Conference in Grand Rapids, Michigan. 

The grants are made possible through the Western Big Game Seasonal Habitat and Migration Corridors Fund, which is administered by NFWF in-part through annual appropriations funding from the BLM, FWS, and the Department of Agriculture. The funding supports Secretary’s Order 3362, which seeks to enhance and improve the quality of big-game winter range and migration corridor habitat on federal lands. Today’s funding builds on nearly $25 million in funding the Department and NFWF announced in 20212022 and 2023. This work supports the President’s America the Beautiful initiative, which aims to conserve, connect and restore 30 percent of our lands and waters by 2030. 

Today’s announcement supplements historic funding through President Biden’s Investing in America agenda, which is supporting critical projects to restore habitats, strengthen landscape resilience, and put create good-paying jobs to restore America’s lands and waters in partnership with Tribes, private landowners, hunting and conservation organizations, and state wildlife management agencies. 

Last month, Secretary Haaland announced more than $157 million from President Biden’s Investing in America agenda to restore our nation’s lands and waters through locally led, landscape-scale restoration projects. The funding from the Bipartisan Infrastructure Law will support 206 ecosystem restoration projects in 48 states, Washington, D.C., and the U.S. Territories and will advance the Department’s ongoing work across several restoration and resilience programs. 

Projects receiving grants and matching contributions are listed below: 

Map of the Salt River watershed, Arizona, USA. By Shannon1 – Shaded relief from DEMIS Mapserver (which is PD), rest by me, CC BY-SA 4.0, https://commons.wikimedia.org/w/index.php?curid=14995781

ARIZONA  

Managing Woody Invasives to Improve Habitat Quality on Perrin Ranch State Lands Grassland  

Grantee: Arizona Elk Society 

Grant Amount: $130,000 

Matching Funds: $130,000 

Total Project Amount: $260,000 

Improve winter habitat quality for migrant and resident mule deer, elk and pronghorn. Project will restore a minimum of 650 acres of grasslands in Northern Arizona by managing the encroachment of woody invasives. 

Restoring Beaver Creek Watershed to Improve Habitat Connectivity  

Grantee: Salt River Project Agricultural Improvement and Power District 

Grant Amount: $489,500 

Matching Funds: $3,376,500 

Total Project Amount: $3,866,000 

Restore wildlife habitat and connectivity, reduce wildfire risk, protect water supplies, communities, infrastructure and improve forest resiliency. Project will restore approximately 3,920 acres by removing invading woody species from grasslands and former healthy woodlands that will allow native grass, browse, and forb species to return. 

Christmas Elk via the Middle Colorado Watershed Council December 2013

CALIFORNIA 

Restoring Steven’s Prairie to Enhance Elk Habitat and Establish New Herds  

Grantee: Yurok Tribe 

Grant Amount: $181,393 

Matching Funds: $181,393 

Total Project Amount: $362,786 

Enhance meadow habitat for Roosevelt elk and provide a stopover site both for dispersing elk from saturated populations and for the establishment of new herds on Yurok lands. Project will survey and identify priority habitat in 160 acres; restore 80 acres of degraded prairie through removal of encroaching trees and invasive plants; establish a 25-acre fuel break along the perimeter of the restored site; and place 440 acres under various planning stages to improve management. 

Aspen’s namesake trees, the quaking aspen, acts as a keystone species that sustains hundreds of other plants and animals. Aspens are also under stress from drier conditions, increased temperatures and over-browsing by large herbivores. Photo credit: Brent Gardner-Smith/Aspen Journalism

COLORADO 

Enhancing Elk Habitat Through Vegetation Treatments in Hay Flats 

Grantee: US Forest Service 

Grant Amount: $200,000 

Matching Funds: $199,896 

Total Project Amount: $399,896 

Enhance elk habitat through vegetation treatments in mountain shrub and aspen communities within the vicinity of Hay Flats. Project will improve 2.25 acres of fencing, treat 430 acres with mechanical methods would create a mosaic of snowberry regrowth and allow understory species to take hold, and treat 220 acres with mastication and hand felling to increase forage, cover, and movement opportunities for elk in spring production areas, summer and winter habitat, and movement corridors. 

Protecting Migration Corridors via the Wolf Mountain VII Conservation Easement  

Grantee: Rocky Mountain Elk Foundation 

Grant Amount: $100,000 

Matching Funds: $1,977,882 

Total Project Amount: $2,077,882 

Conserve vital aspen woodlands, sagebrush, and riparian habitat, as well as a migration corridor and pathway for two of Colorado’s largest migratory herds. Project will permanently protect approximately 1,630 acres of migration corridors for elk and winter range for mule deer, secure habitat connectivity through the valley bottom and highly developable lands near State Highway 40, protect five stream miles, and support a host of other wildlife, including greater sage grouse.  

Mule deer buck. Photo credit: Greg Hobbs

IDAHO 

Modifying Fencing to Improve the Migration Route Across Highway 28 

Grantee: The Mule Deer Foundation 

Grant Amount: $317,922 

Matching Funds: $300,000 

Total Project Amount: $617,922 

Support passage-success of migratory mule deer and elk, reduce animal-vehicle collisions, and simultaneously increase safety for motorists. Project will extend a wildlife funnel fence project on Highway 28 by reconnecting three miles of corridor, improve 10 miles of fencing, remove two miles of fencing, and increase the passage success rate to 95%.

Grassland in Montana. Photo credit: Montana Fish Wildlife and Parks

MONTANA 

Collaborating with Montana Grassland Partnership to Improve Big Game Migration 

Grantee: Ranchers Stewardship Alliance, Inc. 

Grant Amount: $275,000 

Matching Funds: $275,000 

Total Project Amount: $550,000 

Support, connect, and contribute to the partnership of big game migration work being done under the umbrella of the Montana Grassland Partnership as part of the Ranchers Stewardship Alliance (RSA) Conservation Committee. Project will work to improve nine miles of fencing, remove nine miles of unneeded fencing, restore 1,000 acres of grassland for added habitat and add a Conservation Director position with RSA to better serve the RSA project area and collaborate within the Montana Grassland Partnership. 

A male Sage Grouse (also known as the Greater Sage Grouse) in USA. By Pacific Southwest Region U.S. Fish and Wildlife Service from Sacramento, US – Greater Sage GrouseUploaded by Snowmanradio, Public Domain, https://commons.wikimedia.org/w/index.php?curid=12016910

OREGON 

Protecting Migration Habitat via a Fee Title Transfer to the Warm Springs Indian Reservation  

Grantee: Oregon Wildlife Heritage Foundation 

Grant Amount: $199,998 

Matching Funds: $716,350 

Total Project Amount: $916,348 

Protect migration corridors in high use areas in the Metolious winter range. Project will transfer 300-acre acquisition to the Confederated Tribe of the Warm Springs Indian Reservation. 

Treating Invasives to Improve Migration Corridors for Elk and Nesting Habitat for Sage Grouse (OR) 

Grantee: Crook County Soil and Water Conservation District 

Grant Amount: $190,609 

Matching Funds: $213,586 

Total Project Amount: $404,195 

Enhance understory conditions in sagebrush habitats, which will improve conditions for a host of species including sagebrush obligates and improve migration and seasonal habitat for a variety of wildlife species. Project will restore 415 acres of migration habitat for elk and mule deer as well as seasonal habitat for sage grouse through the removal of woody invasives.

Herd of pronghorns. Public Domain, https://commons.wikimedia.org/w/index.php?curid=216046

WYOMING 

Restoring Big Game Migration Corridors for Bates Hole, Dubois and Platte Valley Mule Deer Herds 

Grantee: Wyoming Game and Fish Department 

Grant Amount: $961,250 

Matching Funds: $961,250 

Total Project Amount: $1,922,500 

Improve forage resources and connectivity between seasonal ranges for mule deer and a wide variety of other wildlife. Project will implement 13,530 acres of invasive weed treatments, modify 46 miles of fences and restore 150 acres of habitat. 

Consultant selected to conduct assessment of the Grand Valley #ColoradoRiver corridor — The #GrandJunction Daily Sentinel #COriver #aridfication

Bicycling the Colorado National Monument, Grand Valley in the distance via Colorado.com

Click the link to read the article on The Grand Junction Daily Sentinel website (Dan West). Here’s an excerpt:

March 27, 2024

The river ecosystem will be getting a health check up this year as part of the Grand Valley River Initiative, a planning effort for the river corridor being coordinated by One Riverfront, RiversEdge West and the Hutchins Water Center at Colorado Mesa University. RiversEdge West Executive Director Rusty Lloyd said Lotic Hydrological was recently selected to perform a riparian and floodplain assessment this year, which will help establish a baseline of the river ecosystem.

“This would really identify areas of restoration and conservation that would support native riparian vegetation, versus maybe areas where recreation or development might happen,” Lloyd said. “That riparian and floodplain assessment is really supposed to get at where are our good quality ecosystem values and habitat along our river in the valley. That assessment will feed into the decision making processes, hopefully.”

Lloyd said the state of the river has been changing in recent years with more recreation and development along the river. He said the initiative is intended to help local planners and policy makers as they make decisions about the future of the river corridor. OV Consulting has also been selected to coordinate communications with local municipalities and stakeholders about how to plan for the future of the river, Lloyd said. He said what that looks like could vary from a framework local governments could use to a signed agreement on planning around the river between local governments.