Presentation details Lincoln Creek contamination but solutions unclear: #ClimateChange may be increasing leaching-metals pollution of #LincolnCreek — @AspenJournalism

Grizzly Reservoir was a bright shade of turquoise in September 2022. The man-made alpine lake has high concentrations of metals that are toxic to fish, according to a report from the Environmental Protection Agency. CREDIT: HEATHER SACKETT/ASPEN JOURNALISM

Click the link to read the article on the Aspen Journalism website (Heather Sackett):

February 5, 2024

Presenters at a public meeting Thursday [February 1, 2024] about contamination on Lincoln Creek hosted by agencies that oversee water quality offered a lot of information, but few solutions yet to the problem.

The meeting, held at the Rocky Mountain Institute in Basalt, featured the results of water quality sampling and presentations from a panel of experts from agencies including Environmental Protection Agency, Colorado Parks and Wildlife, U.S. Fish and Wildlife Service, Colorado Department of Public Health and Environment, the U.S. Forest Service, Colorado Division of Reclamation, Mining and Safety, the U.S. Geological Survey, environmental group Trout Unlimited and Pitkin County Environmental Health.

“We have a lot of questions,” said Kurt Dahl, Pitkin County environmental health manager. “Is (the contamination) going to continue to increase? What does it mean for the Roaring Fork? For my office? For human health? … There’s also this question around mitigation. I think we want to get our arms around, is this a possibility? What does this look like? What are the costs? Can we afford it?”

A report released in November by the EPA based on water-quality samples from 2022 found that Lincoln Creek in the four miles between the Ruby Mine and Grizzly Reservoir exceeds state water quality standards for aquatic life for aluminum, cadmium, copper, iron, lead, manganese and zinc. Aluminum and copper concentrations were especially high.

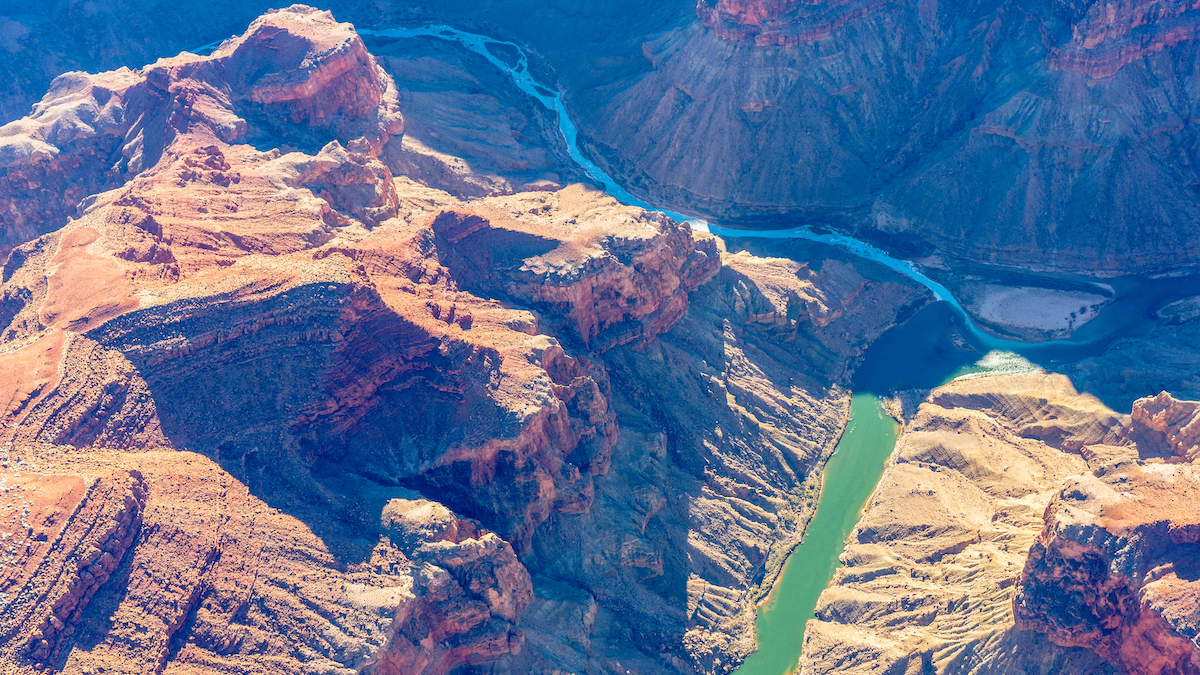
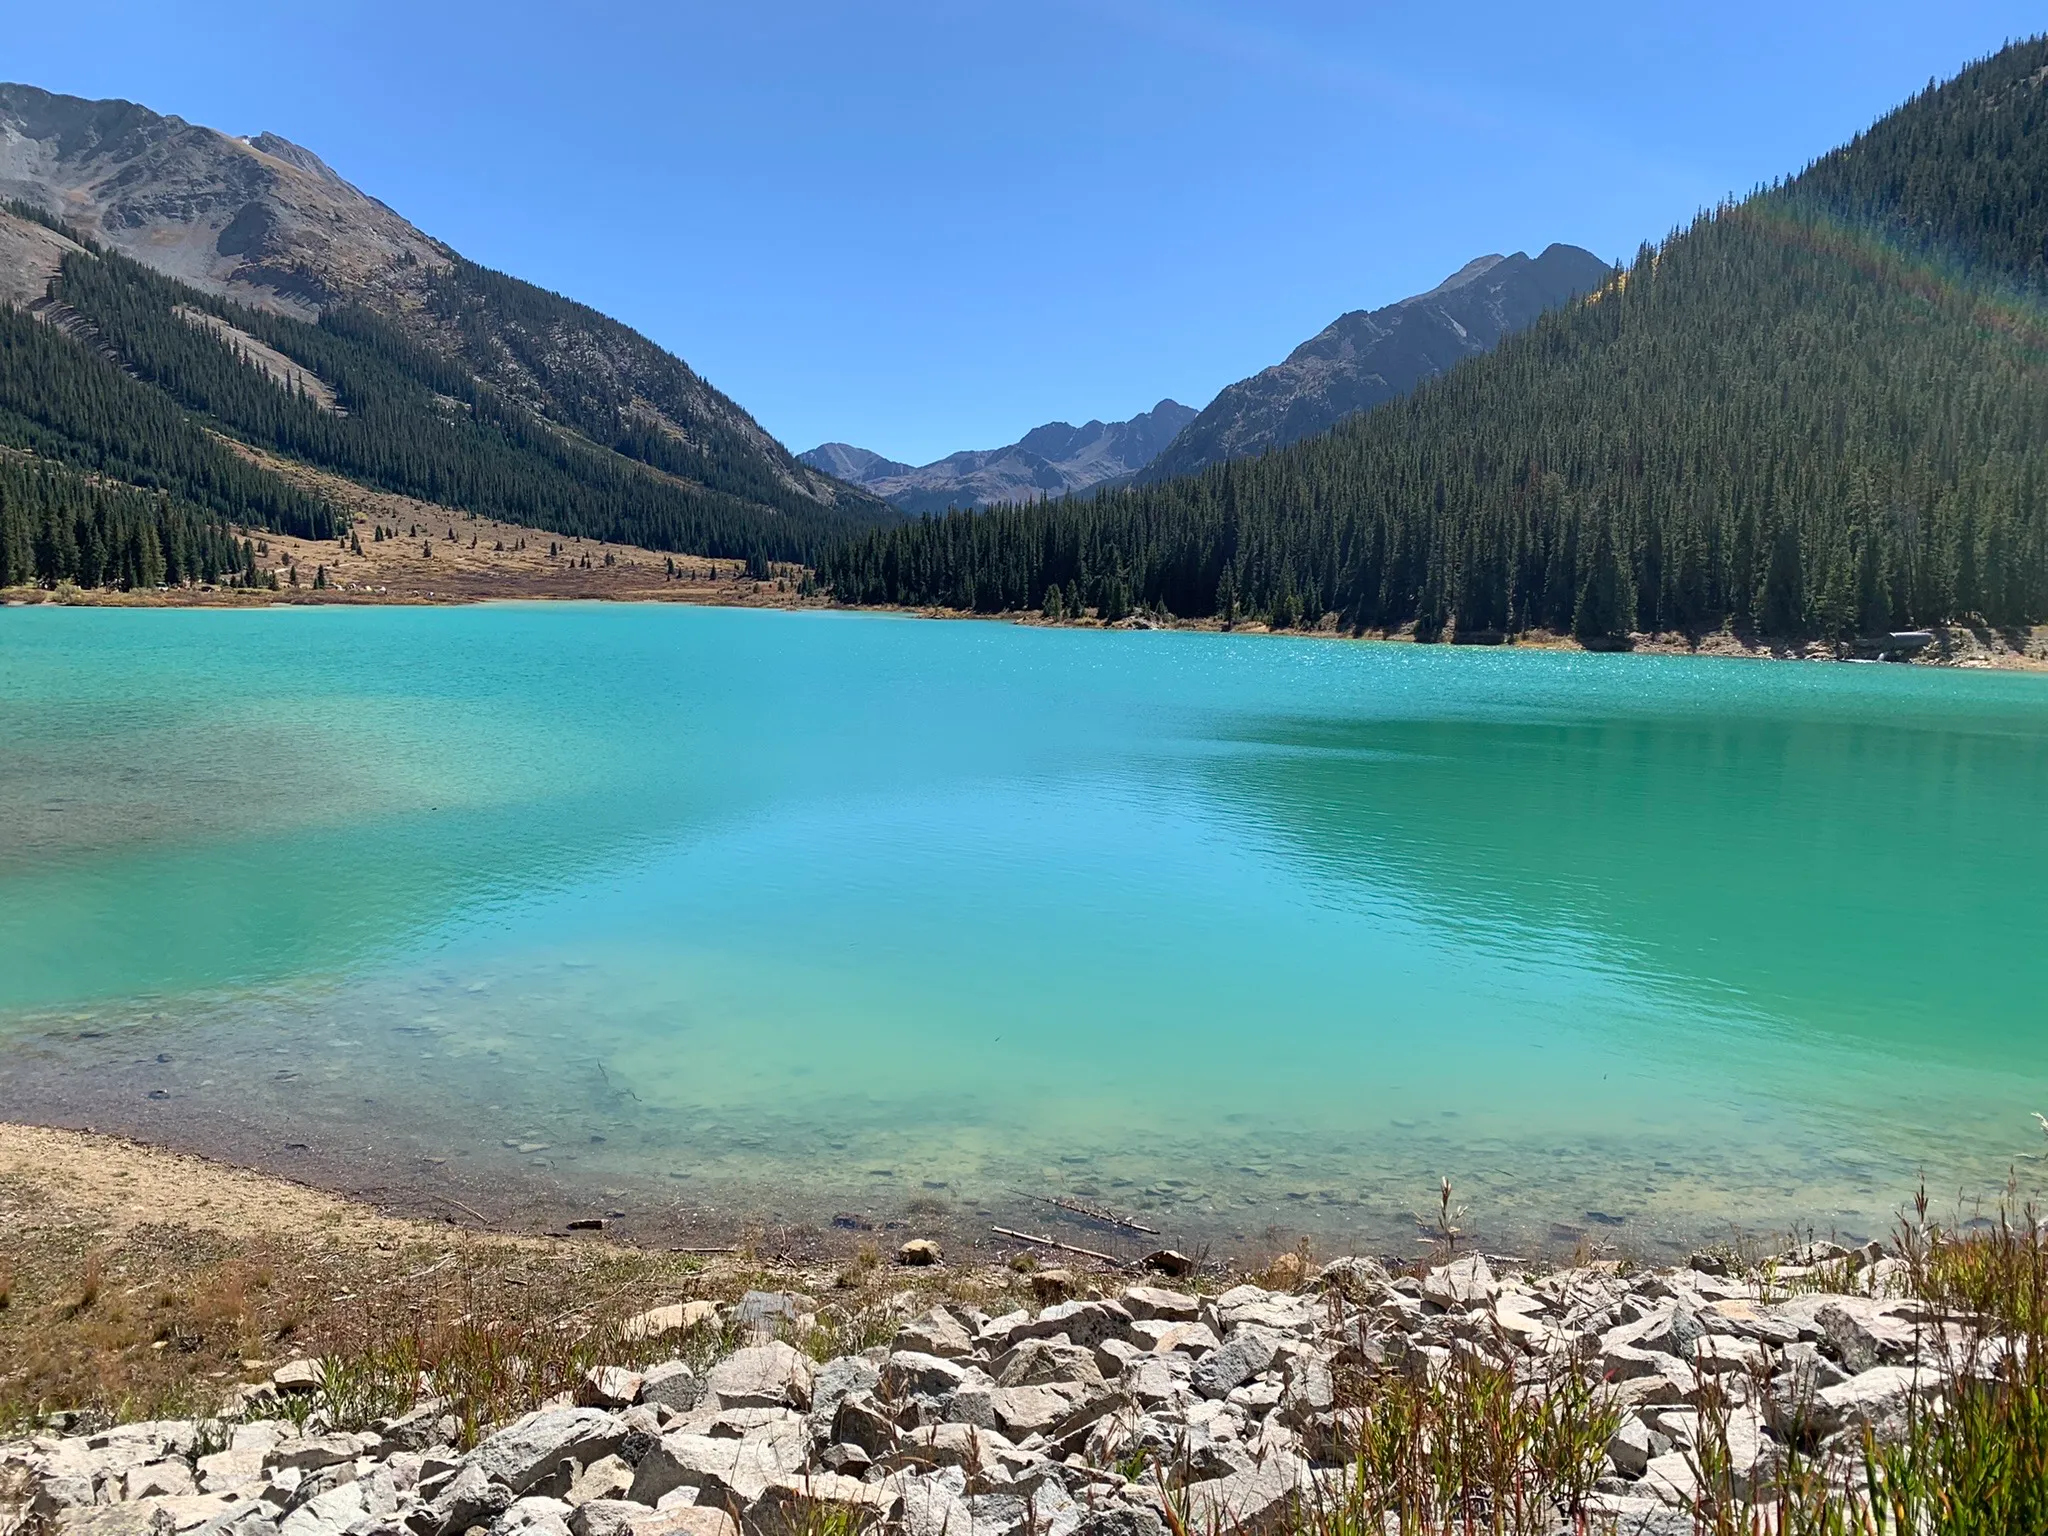
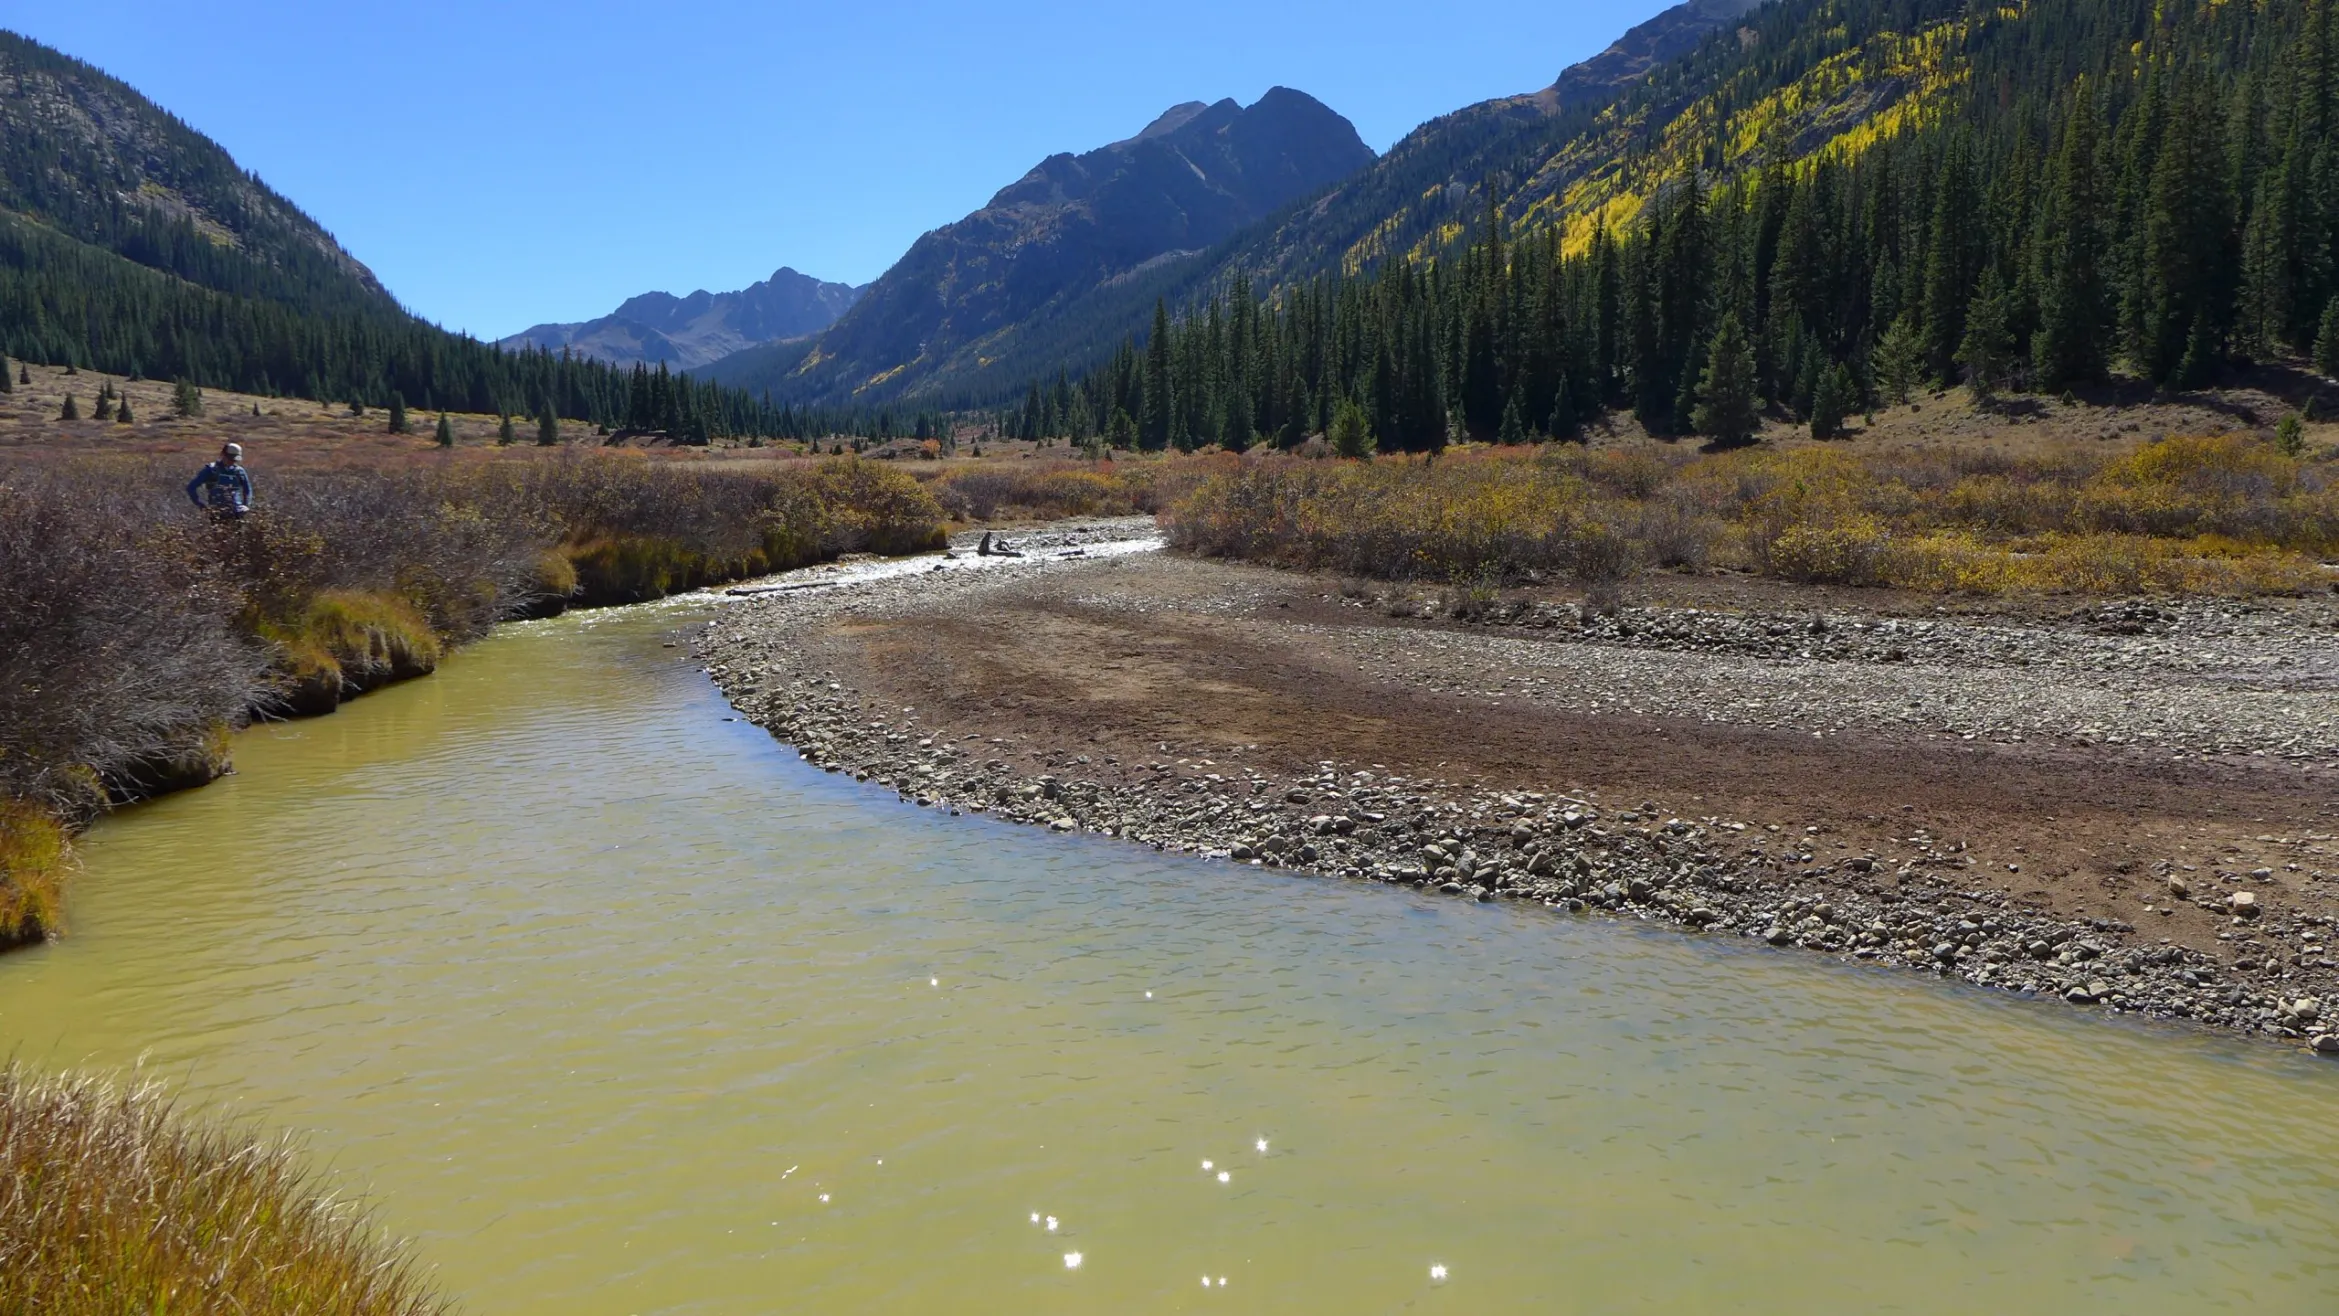
Water quality issues on Lincoln Creek have been a concern for years, with the creek above the reservoir often running a yellowish color, and Grizzly Reservoir often a bright turquoise. In September 2022, Lincoln Creek below the reservoir turned a milky-green color, and white and yellow sediment settled on the streambed, prompting water quality testing in the fall of 2022 and the EPA report. These conditions in 2022 could be seen downstream at the confluence with the Roaring Fork River, sparking concern for local residents and organizations.

And the problem has gotten worse in recent years. The high concentrations of aluminum and copper are toxic to fish, and Lincoln Creek and Grizzly Reservoir experienced a fish die-off in 2021. In fall of 2023, there was a fish kill downstream in the Roaring Fork in the North Star Nature Preserve, which experts say was probably due to a combination of high metals concentrations and too-warm water.

The EPA report also found that the main source of contamination is not drainage from the Ruby Mine, but is naturally occurring from a “mineralized tributary” just downstream from the mine.

During the Q&A portion of the meeting, attendees asked whether the Ruby Mine, where turn-of-the-20th-century prospectors dug for gold and silver, could really be the source of contamination. Mindi May, water quality program director with CPW, said she initially shared the audience’s skepticism that the mine wasn’t the main source of contamination, but after visiting the site she agrees with geologists’ findings that it’s naturally occurring.

“You could just see the water from the mineralized trib just seeping out of the ground,” she said. “So at this point I am convinced … that the mineralized trib and the Ruby are separate and that the mineralized trib is natural and that it really is the problem.”

The fact that the contamination of the creek is naturally occurring creates a question about who’s responsible for cleaning it up. The EPA is authorized to address elevated metals concentrations only from human-caused sources, not contamination from natural sources.

Primarily an ecological problem

Panelists addressed the potential human health impacts from the contaminated water in the creek and at Grizzly Reservoir, a popular spot for summer camping, hiking and fishing. The U.S. Forest Service manages the seven-site Portal Campground near the reservoir.

Mike Carney, a toxicologist with U.S. Fish and Wildlife Service, said his agency is primarily concerned with arsenic and lead, which have health risks but aren’t the main contaminants in Lincoln Creek. He said there’s not much risk associated with someone’s skin coming into contact with the copper and aluminum-laden water. As for drinking the water, backpacking filters are unlikely to filter out all the contamination and gastrointestinal distress could result. But would-be guzzlers of the orange-tinted water would probably be turned off by the taste.

“At those concentrations, that water would likely not be palatable because it would taste very bad,” Carney said. “This is primarily an ecological problem here.”

Carney said they did not find worrisome concentrations of metals accumulating in the tissue of fish sampled from Grizzly Reservoir. CPW restocks the fish every summer so they may not spend enough time living in the reservoir to build up metals concentrations before they die or are caught and eaten by anglers.

Twin Lakes collection system

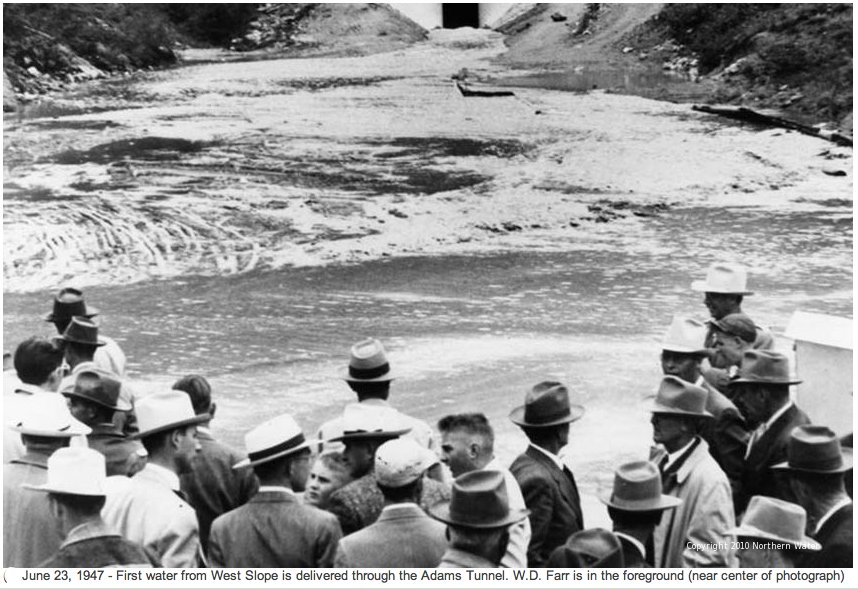
Lincoln Creek feeds into the Twin Lakes Reservoir and Canal Company’s transmountain diversion system, in which Grizzly Reservoir is used as a collection pool before sending water through the Twin Lakes Tunnel to the Arkansas River basin, where it is used primarily in Front Range cities, including for drinking water. Colorado Springs Utilities owns the majority of the water in the Twin Lakes system.

The November EPA report said the substantial mixing, the distance that the water travels to the Front Range and the water-treatment process limit the impacts to Colorado Springs’ drinking water.

Twin Lakes is planning to drain Grizzly Reservoir this summer so it can do a rehabilitation project, including installing a membrane over the steel face of the dam, replacing the gates that control the flow of water into the Twin Lakes Tunnel and repairing the outlet works that release water down Lincoln Creek.

Repairs to fix damage after a log got caught in the outlet works in 2015 resulted in the release of a slug of contaminated water and sediment from the reservoir that quickly boosted flows in the Roaring Fork near Aspen and turned it yellow, alarming residents. Twin Lakes board president Alan Ward said that wouldn’t happen with this summer’s planned draw-down.

“The company was very embarrassed by that, we do not want that to happen again,” he said. “We talked with our contractor about a drawdown plan and we need to make sure that as we get to those sediments, that we’re moving slowly and have a lot of sediment control in place so that we’re not putting that in the creek.”

Lincoln Creek is one of several drainages that flow into Grizzly Reservoir, a collection pool for Twin Lakes Reservoir and Canal Company. Drainage from defunct upstream mines may be partly responsible for the water’s yellow color. Photo credit: Heather Sackett/Aspen Journalism

Leaching metals and climate change

When water and oxygen come into contact with pyrite-rich rock, it reacts to form sulfuric acid and causes the leaching of metals from the rock. One take-away from Thursday’s presentations is that this type of metals contamination of Colorado waterways is increasing with climate change.

Thomas Chapin, a research chemist with USGS, said drought and climate change have reduced the volume of streamflows, meaning metals concentrations will be higher even if the overall amount of metal leaching stays the same. But melting ice and ground that was once frozen also allow water and oxygen to come into contact with rock that used to be inaccessible to the leaching process.

Prior to mining, snowmelt and rain seep into natural cracks and fractures, eventually emerging as a freshwater spring (usually). Graphic credit: Jonathan Thompson

“The combination of the decrease in flow coming down, so less dilution, and the lowering of the water table and exposing more material to acid rock drainage, it’s a double whammy,” Chapin said.

Pitkin County isn’t the only place in Colorado where increasing metals concentrations is negatively impacting water quality. Chapin said a recent study looking at the Snake River, a tributary of the Blue River in Summit County, found a 100% to 400% increase in the amount of zinc concentrations over 30 years.

“We saw similar data with Lincoln Creek,” he said. “Those September values have gone up quite a bit.”

The recently released Climate Change in Colorado report found that temperatures have warmed more in fall than other seasons.

Dahl wrapped up the meeting, which ran 30 minutes past its scheduled time of 6 to 7:30 p.m., by saying that local water quality experts are talking about next steps and plan to hold another public meeting this spring.

“We recognize that there was a lot of information here without a lot of opportunity to ask questions,” he said. “We’ve already agreed that we need to have another public meeting.”

This story ran in the Feb. 3 edition of The Aspen Times.

Map of the Roaring Fork River drainage basin in western Colorado, USA. Made using USGS data. By Shannon1 – Own work, CC BY-SA 4.0, https://commons.wikimedia.org/w/index.php?curid=69290878

But what does a polar vortex breakdown look like down here? — NOAA

Click the link to read the article on the NOAA website (Amy Butler and Laura Ciasto):

February 29, 2024

We’ve talked about how the reversal of the west-to-east winds during a major sudden stratospheric warming sets up a feedback between large atmospheric waves and the winds, and how this results in the stratospheric wind changes being communicated down into the troposphere. But what does this mean for weather patterns down here after the polar vortex is disrupted?

By taking the average of the surface temperature and atmospheric thickness for the 30 days after all the major sudden stratospheric warmings in the observational record, we can average out day-to-day variations in the weather and see more clearly what weather patterns related to major warmings look like.

Average changes in (left) surface temperature and (right) atmospheric thickness (at the 500-hectoPascal pressure level) for the 30 days after the 42 observed major sudden stratospheric warmings from 1958-2023. NOAA Climate.gov image based on ERA5 reanalysis data provided by Amy Butler.

From a stratospheric hot mess to a tropospheric cold brew

Sudden stratospheric warmings (and sometimes just the phrase “polar vortex”) are often associated with cold and snowy weather; and indeed, anomalous cold is evident over some regions like northern Europe and Asia and the eastern United States after these events. How does a warming of the stratosphere cause widespread cold at the surface?

During major warmings, the atmospheric thickness increases over the pole, which shows up on these maps as a positive anomaly in tropospheric geopotential height over the Arctic, particularly Greenland. This increase in atmospheric thickness in the troposphere is linked to the build-up of air over the pole during the sudden warming: it can act like a rock dropped in a bucket, pushing down on the troposphere such that the cold Arctic air “sloshes” out into lower latitudes. An alternative way to think about it is that the increased atmospheric thickness over the Arctic induces changes in tropospheric winds that push cold air from the Arctic farther south in some regions and pull warm air from the south into the Arctic in other regions.

But… it’s not cold everywhere

Not all regions need to bring out snow shovels and gloves when a polar vortex breakdown is on the menu. The map shows that there are also large areas with generally warmer than normal surface temperatures after major warmings. These regions include eastern Canada and much of subtropical Africa and Asia. This is one reason why, even though we might care most about what happens where we live, we shouldn’t equate polar vortex disruptions with cold air outbreaks.

Weather effects are strongly regional

Another reason to not automatically assume that a major stratospheric warming means colder weather is that the magnitude of cold varies widely from place to place, with the strongest cold appearing over northern Europe and Asia, and more moderate to weak cold appearing over central Europe and the eastern United States. These regional differences arise because the changes in atmospheric thickness, and thus the effects on the tropospheric jet stream, are centered over the North Atlantic [footnote 1], and so the strongest associated temperature changes occur just upstream or downstream of this region.

An atmospheric gamble

It’s important to remember that the maps of “typical” surface impacts are not a forecast and do not represent the expected day-by-day weather when one of these events occurs. These maps show an average over many major warmings, each occurring in different years and with different global climate conditions (such as different phases of ENSO). These maps don’t give a sense of where the weather may vary substantially from one event to another.

Furthermore, they’re also an average over the 30-day period after one of these events, which means that from day to day or week to week after a major warming event, the weather could look vastly different in any given location than from what is shown here. What this type of map does is provide a sense of where changes in temperatures and pressures are most likely to occur in the month after a major warming, allowing us to assess the probabilistic risk of certain extremes. In other words, a major warming “loads the dice” for certain conditions, but by no means guarantees them.

Another way we can get a hint about which areas are most likely to follow the average pattern is to look at how much variability there is at a given location from event to event. That’s what the maps below show.

Where do the surface temperatures and atmospheric thickness (at the 500-hectoPascal pressure level) vary the most from one major warming event to another? These maps show where the standard deviation, a measure of the variability, is greatest across events (for the 30-day averaged period after the 42 observed major warmings in the 1958-2023 period). Surface temperatures (left) show high event-to-event variability across the central Arctic, Russia, and Alaska. The high variability over the central Arctic likely reflects changing sea ice conditions over this period. Atmospheric thickness (right) shows high event-to-event variability over Greenland and the North Atlantic, and the North Pacific. The high event-to-event variability over Alaska and the Pacific region likely reflects the varying El Nino-Southern Oscillation conditions that occurred during the 42 major warming events, which get averaged out in the first figure in this post. NOAA Climate.gov image based on ERA5 reanalysis data provided by Amy Butler.

Current polar vortex conditions: did it or didn’t it? 

So did we see the second sudden stratospheric warming of the year? Well… it’s complicated. The stratospheric polar vortex did indeed rapidly weaken and warm as predicted, so physically-speaking, a sudden warming occurred around February 19, 2024.

However, whether it will be classified as a major or minor event is still unclear. This is because the way a major sudden warming is commonly defined [footnote 2] requires the daily-mean west-to-east winds, averaged around the 60N latitude circle and at the altitude corresponding to an atmospheric pressure of 10 mb, to fall below 0 m/s. In this case, the winds came very very close to that threshold (within +/- 1 m/s), so that some reanalysis data products [footnote 3] likely will show the winds falling below 0 m/s and others will not. This disagreement between data products has happened in the past and is one of the caveats of using a threshold-based definition of these events; there is some sensitivity to which events get “counted” as major warmings, even though a rapid weakening and warming of the polar vortex was observed.

Observed and forecasted (NOAA GEFSv12) wind speed (top) and temperature (bottom) in the polar vortex compared to the natural range of variability (faint shading). For the GEFSv12 forecast issued on February 28, a reversal of the vortex winds is forecast to occur around March 5 (top, thick magenta line), accompanied by an increase in stratospheric temperature (bottom, thick pink line). While the polar vortex winds only barely fell below 0 m/s in January and hovered near 0 m/s in February, in March the winds are expected to stay reversed until almost April. NOAA Climate.gov image, adapted from original by Laura Ciasto.

Nonetheless, perhaps because the weakening of the vortex wasn’t substantial enough to significantly reverse the stratospheric winds (if at all), the winds have re-strengthened quickly. The continued west-to-east winds will allow further onslaught of the polar vortex by atmospheric wave activity. [Remember from our earlier post that only when the polar vortex is whipping along from west-to-east can waves from below penetrate and disrupt it.] Current forecasts show potential for a more substantial reversal of the stratospheric polar vortex than we’ve seen so far this entire winter taking place early next week. However, we are also heading into spring, which is when the stratospheric polar winds typically transition to an east-to-west summertime state. So it remains to be seen whether this upcoming reversal will essentially kill the polar vortex for the remainder of the season (the “final warming”), or whether the vortex will return to west-to-east flow in April for a brief period [footnote 4]. 

Footnotes

  1. Why the North Atlantic jet stream appears more strongly affected than the Pacific region after major warmings is still not well understood.
  2. The most common definition is based on Charlton and Polvani (2007), but many other definitions exist. Which events are classified as “major” is sensitive to the definition used.
  3. Reanalysis products take multiple observational sources like satellite and balloon measurements and assimilate them into a model to create a product that is both temporally and spatially complete at each grid space of the model, and is constrained by observations. Because different data centers use different models and data assimilation techniques, and may assimilate different satellite and balloon records, reanalysis products can exhibit differences from one another. Note that because it can take some time for this data to be released, we often have to wait several weeks to determine if the major warming occurred in each dataset.
  4. There are more technicalities to the major stratospheric warming definition that have implications for the final count of events this winter. In particular, because events must be separated by 20 consecutive days of west-to-east stratospheric winds, this upcoming wind reversal will not be counted separately from the February 19th event, if it occurred. Additionally, if it is a final warming, it will not be counted as a major warming which only includes “mid-winter” events. Ultimately, these details are all somewhat arbitrary and only matter for statistical purposes!

#ClimateChange, cost and competition for water drive settlement over tribal rights to #ColoradoRiver — The Associated Press #COriver #aridification

Confluence of the Little Colorado River and Colorado River; Credit: EcoFlight

Click the link to read the article on the Associated Press website (Felicia Fonseca and Suman Naishadham). Here’s an excerpt:

February 28, 2024

A Native American tribe with one of the largest outstanding claims to water in the Colorado River basin is closing in on a settlement with more than a dozen parties, putting it on a path to piping water to tens of thousands of tribal members in Arizona who still live without it. Negotiating terms outlined late Wednesday include water rights not only for the Navajo Nation but the neighboring Hopi and San Juan Southern Paiute tribes in the northeastern corner of the state. The water would come from a mix of sources: the Colorado River that serves seven western states, the Little Colorado River, and aquifers and washes on tribal lands. The agreement is decades in the making and would allow the tribes to avoid further litigation and court proceedings, which have been costly. Navajo officials said they expect to finalize the terms in the coming days. From there, it must be approved by the tribe’s governing bodies, the state of Arizona, the other parties and by Congress…

On Wednesday, the Navajo Nation cited climate change, cost, competition for water and the coronavirus pandemic as reasons to move toward a settlement. Arizona, in turn, would benefit by having certainty over the amount of water that is available to non-tribal users. The state has had to cut its use of Colorado River water in recent years because of drought and demand…

Arizona — situated in the Colorado River’s Lower Basin with California, Nevada and Mexico — is unique in that it also has an allocation in the Upper Basin. Under the settlement terms, Navajo and Hopi would get about 47,000 acre-feet in the Upper Basin — nearly the entire amount that was set aside for use at the Navajo Generating Station, a coal-fired power plant on the Navajo reservation that shut down in late 2019.  The proposal also includes about 9,500 acre-feet per year of lower-priority water from the Lower Basin for both tribes. An acre-foot of water is roughly enough to serve two to three U.S. households annually. While the specific terms for the San Juan Southern Paiute Tribe remain under discussion, Congress could be asked to establish a small reservation for the tribe whose ancestral land lies in Utah and Arizona. The tribe’s president, Robbin Preston Jr., didn’t immediately respond to emailed questions from the AP.

Native America in the Colorado River Basin. Credit: USBR

From farms to cities: Analysis shows #Colorado-Big Thompson water right ownership changes — The #FortCollins Coloradoan #ColoradoRiver #SouthPlatteRiver #COriver #aridification

First water through the Adams Tunnel. Photo credit Northern Water.

Click the link to read the article on the Fort Collins Coloradoan website (Ignacio Calderon). Here’s an excerpt:

February 29, 2024

On Wednesday [February 28, 2024], 96 Colorado-Big Thompson water shares and 154 acres of farmland from the Carlson Family Trust were auctioned for $5,473,600 and $990,000, respectively. It was the second such water auction in February. Earlier this month, Carol Oswald Yoakum sold her 90 shares of Colorado-Big Thompson water for an average of $52,481 per share...In recent years, around 95% of Colorado-Big Thompson shares that were transferred went from farms to municipalities and water districts, a Coloradoan analysis found…

When Colorado-Big Thompson water changes hands, it is recorded in the Northern Water Board’s monthly meetings agenda. The Coloradoan manually compiled every document available online, with records going back to June 2019, to understand this trend.  The analysis focused on the transfers where there was a change in contract class. This excludes transfers where water is kept in the same use, like when shares are passed down in a family farm. Different contract classes allow for different water uses…During the time period covered by the analysis, the Coloradoan found 237 transfers, which moved 4,396 shares. The 10 biggest receivers, which were all water districts or municipalities, accounted for nine out of every 10 shares. However, that doesn’t necessarily mean most water is being used by cities…

“When we look at the data of where water is delivered, we see that on average it’s a little more than 50% that goes to municipal use, but municipal ownership is about 75%,” said Jeff Stahla, spokesperson for Northern Water, referring to water use from the Colorado-Big Thompson Project…Christopher Goemans, an associate professor in the Department of Agricultural and Resource Economics at Colorado State University, said “we’ve seen this shift in the ownership of rights from agricultural to municipal uses. And yet the vast majority of the water is still diverted and used in agriculture.”

[…]

On the other hand, the cost of acquiring water is driven in large part by the market for water rights. Wednesday’s auction averaged around $57,000 per Colorado-Big Thompson water share — several orders of magnitude higher than it cost when the project began. In 1960, three years after the project first started delivering water to users, the cost per share was $1.50.

Colorado-Big Thompson Project map. Courtesy of Northern Water.

Why Bird Advocates Want to Double Down on Conservation Across the Americas: A bipartisan U.S. bill would ramp up funding for the Neotropical Migratory Bird Conservation Act, an under-the-radar program with a long reach — Audubon

A curriculum funded by the NMBCA combines taxonomy and traditional knowledge for Indigenous students from San Antonio del Chamí, Colombia. Photo: Andrés Estefan

Click the link to read the article on the Audubon website (María Paula Rubiano A.):

Birds are everywhere at the school in Cañaveral, Colombia. Their songs fill the air. Their nests perch in flowerpots. And each Tuesday every classroom celebrates birds, from the short tales children write in Spanish class to science lessons about migratory journeys.

Since 2021 around 450 kids at 8 schools in Colombia’s coffee belt have been immersed in these lessons that seek to build support for conservation. “Kids now know about the worms that birds bring to their chicks and the birds’ scientific names,” says John Edison Martínez Delgado, academic coordinator at Cañaveral school. “They’re always drawing them in their notebooks.”

Audubon and a local university developed the curriculum for one of more than 700 projects funded through the U.S. Neotropical Migratory Bird Conservation Act (NMBCA), the only federal grant program dedicated to conserving birds across the Americas. Since 2002 it has pumped $89 million—$440 million, if you count matching funds—into habitat protection, research, and education in 43 countries. It has delivered three-quarters of that funding outside the United States to regions where some 390 long-distance migratory species spend much of their lives. And though the NMBCA is designed to benefit birdlife, advocates say it also supports people on the front lines of conservation, from Canada to Chile.

While the act’s geographic scale is vast, advocates say it needs more cash to help stem population declines driven by climate change, habitat destruction, and other threats. That’s why supporters are urging lawmakers to pass bipartisan legislation to increase funding and make it accessible to more communities. “It’s a perfect time to look back at this program, to work with Congress, and provide some options about how to address some of these steep declines,” says Erik Schneider, policy manager at Audubon.

Before Congress passed the NMBCA in 2000, wildlife managers across the Americas were alarmed by mounting evidence that development in migratory birds’ winter habitats was eroding populations. They saw the need for coordinated action—and for funding to make it happen.

To help foster that collaboration, the act required recipients to come up with $3 to match every $1 in U.S. government grants. As a result, organizations have banded together across borders to work with locals at key sites, says Ingrid Arias, develop­ment director at the nonprofit FUNDAECO. Using NMBCA funds, the group has partnered with the American Bird Conservancy (ABC) to purchase and protect more than 16,000 acres of forest habitat for Wood Thrush, Baltimore Oriole, and other species on Guatemala’s Caribbean Coast.

Setting aside protected areas, however, is not enough. Since many neotropical migrants winter on farms and other working lands that people rely on for their livelihoods, NMBCA projects also nurture connections with often remote communities, supporters say. Along with their work at schools in Colombia’s coffee belt, Audubon Americas and local partners have inked conservation agreements with growers there who commit to respect the biodiversity corridors running through their coffee farms. And in Guatemala, FUNDAECO and ABC have established native tree nurseries and bird-friendly cardamom farms run by community members.

The program also protects habitat in more urban areas. In Chile, Audubon Americas and nearly 80 partners used NMBCA funds to create the first conservation plan for a wetland, now being engulfed by the growing city of Concepción, where shorebirds like Baird’s Sandpiper and Hudsonian Godwit overwinter. Now another grant is helping to build support for the plan and to train locals as coastal stewards.

As effective as the act’s cost-share requirement has been at spurring teamwork, proponents argue that it could be lower and still serve that function—while opening the door to more partners. The proposed Migratory Birds of the Americas Conservation Enhancements Act would set the match at two-to-one, a change Arias says is especially needed today: “Since the pandemic, many environmental organizations’ fundraising ability has suffered a lot.”

What’s more, the bill would double the program’s annual budget to $10 million by 2028. That would be a big step, supporters say, toward the goal of making it a habitat-protecting force comparable to the North American Wetlands Conservation Act. That program has funded projects on more than 32 million acres, or nearly 10 times the scale of the NMBCA, and is widely credited with reversing declines in waterfowl populations. Other migratory birds desperately need—and could soon have a better shot at—a similar rebound.

This story originally ran in the Winter 2023 issue as “Ready for a Rebound.”

Map showing the global routes of migratory birds. Credit: John Lodewijk van Genderen via Reseachgate.net