It’s the beginning of April, which signifies the beginning of the end of our snowpack season. In Colorado, our southern basins typically reach their peak snowpack in the next few days, while our northern basins still have a few more weeks to go. But by this time, we usually have a pretty good idea on how we fared this season and what our water situation might look like as we approach the summer. So let’s take a look!
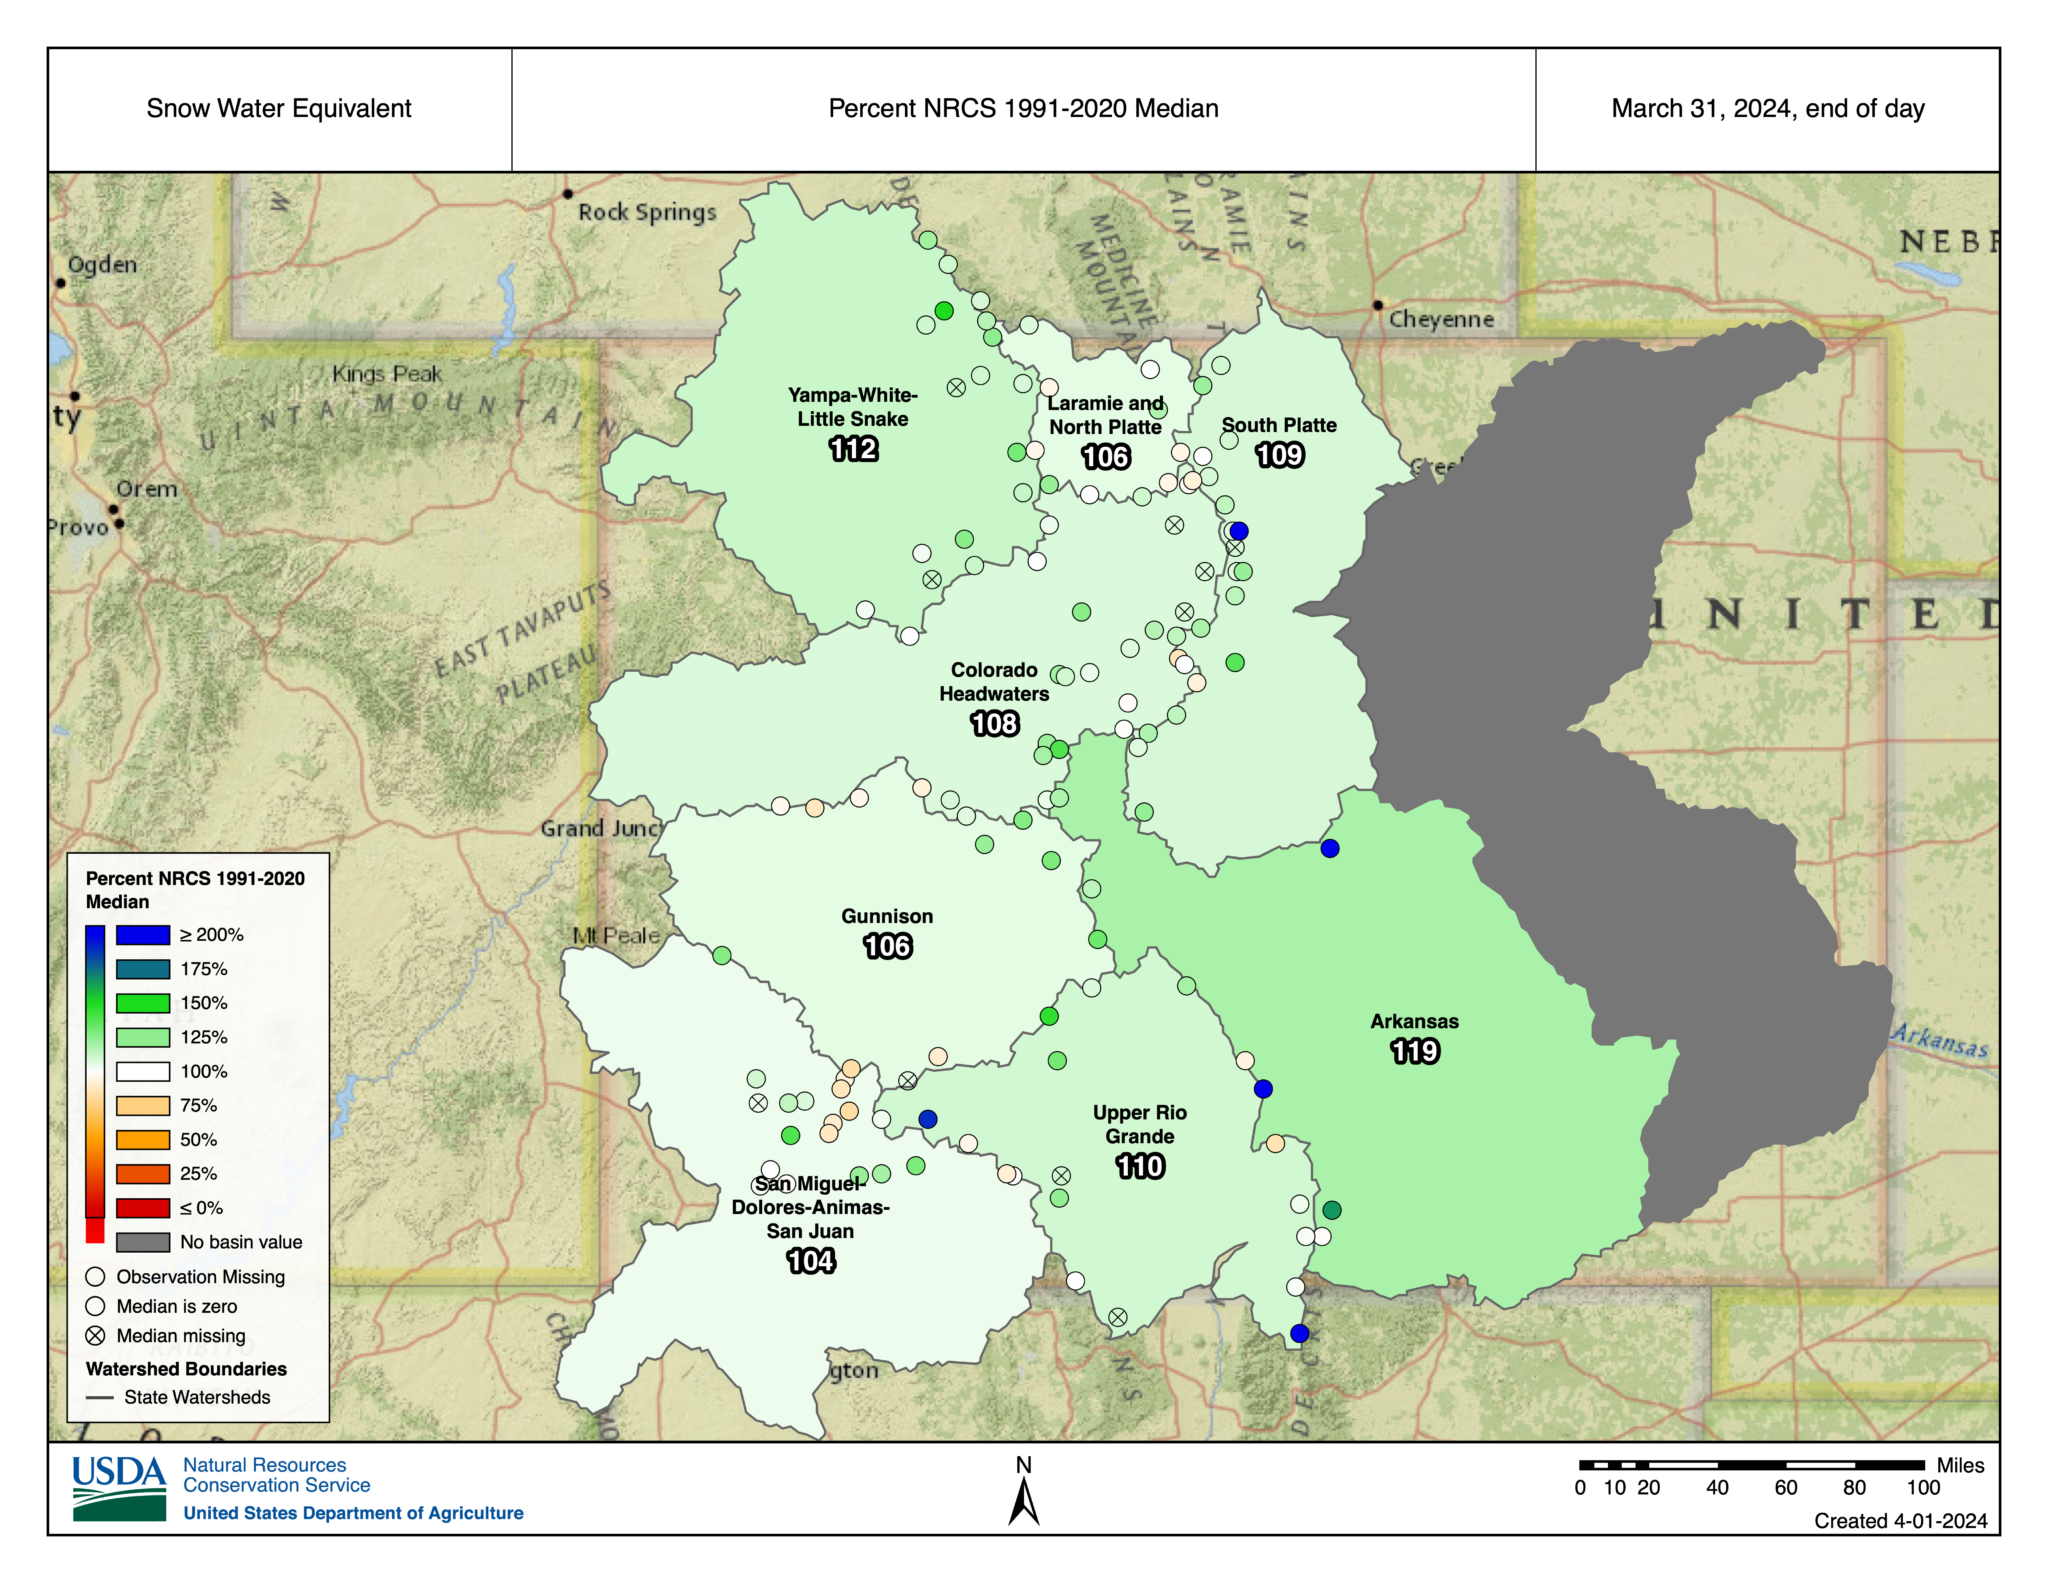
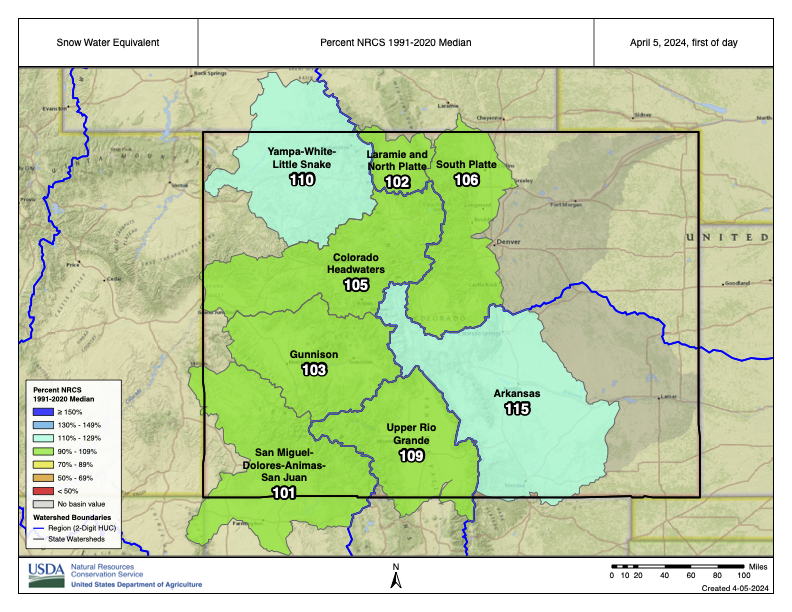
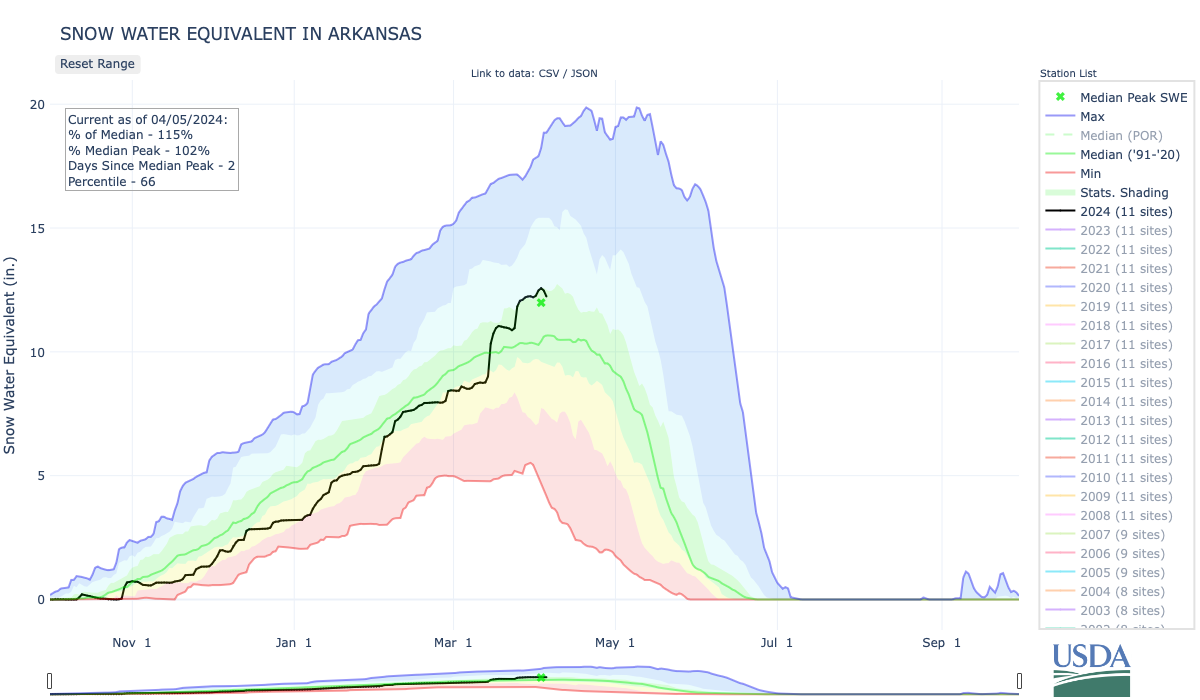
At the end of March, all Colorado basins reported above median snowpack. The Arkansas basin is at the highest, with 119% of median, and the San Juan basin in southwest CO is at the lowest, with 104% of median. Despite the basin averages. there are a few individual SNOTEL sites that are a bit below average. A few sites around the San Juan mountains are showing lower snowpack, as is Park Reservoir on the Grand Mesa.
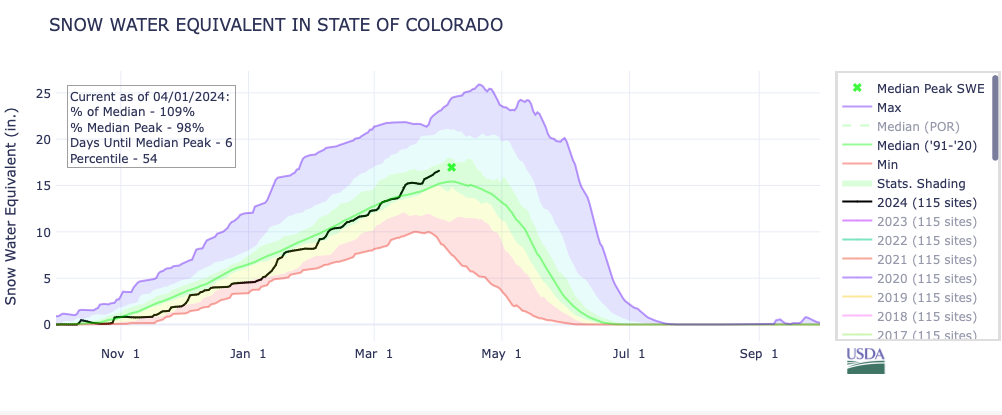
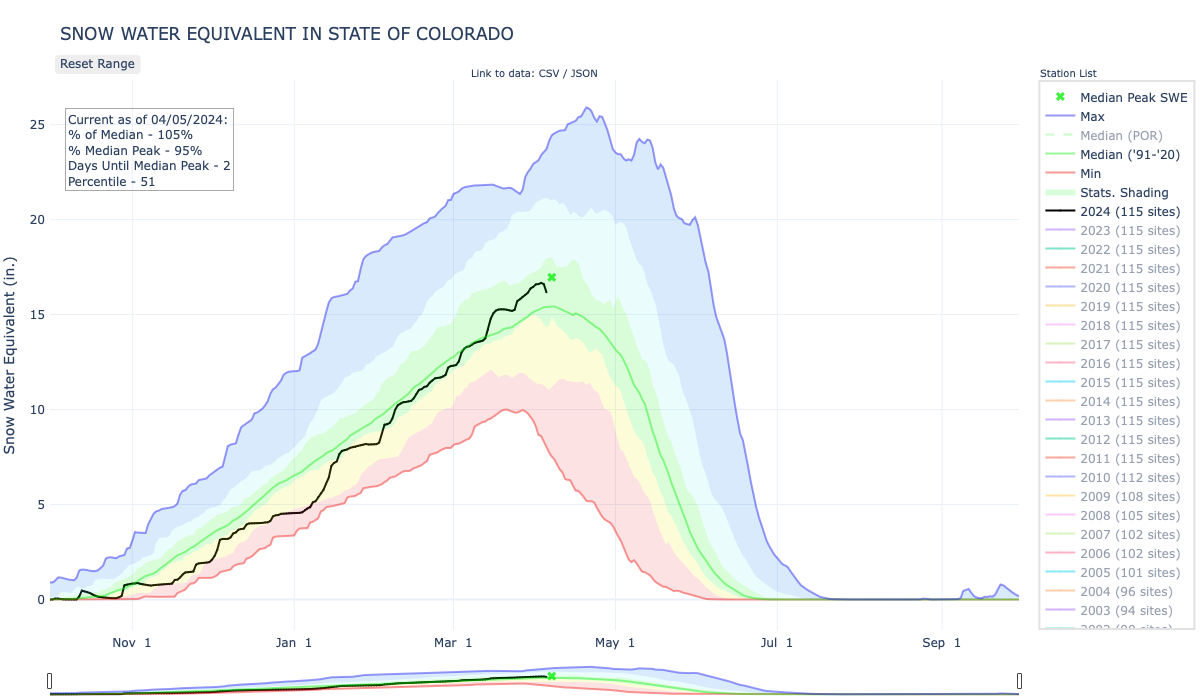
The above graph shows how the snowpack has accumulated since the beginning of October, following the black line. The green line indicates what’s typical, and the “X” shows the normal peak date and value. For the statewide average, we’re six days away from the peak, and well on target to reach and possibly exceed that normal peak.
So, what happens after we reach peak?
It’s easy to forget, but passing the peak does not mean it stops snowing. In fact, it’s very important that snow continue to accumulate in the high elevations well into May! It’s hard to tease out from the snowpack graphs (like the one above) that new snow is being added on, even in the midst of overall melting. The peak really means the mountains have hit a critical time when solar radiation, and the higher angle of the sun, are having a greater impact on the snow surface. Snowpack becomes isothermal (meaning consistent temperature of 32°F throughout the entire depth), and melting takes over.
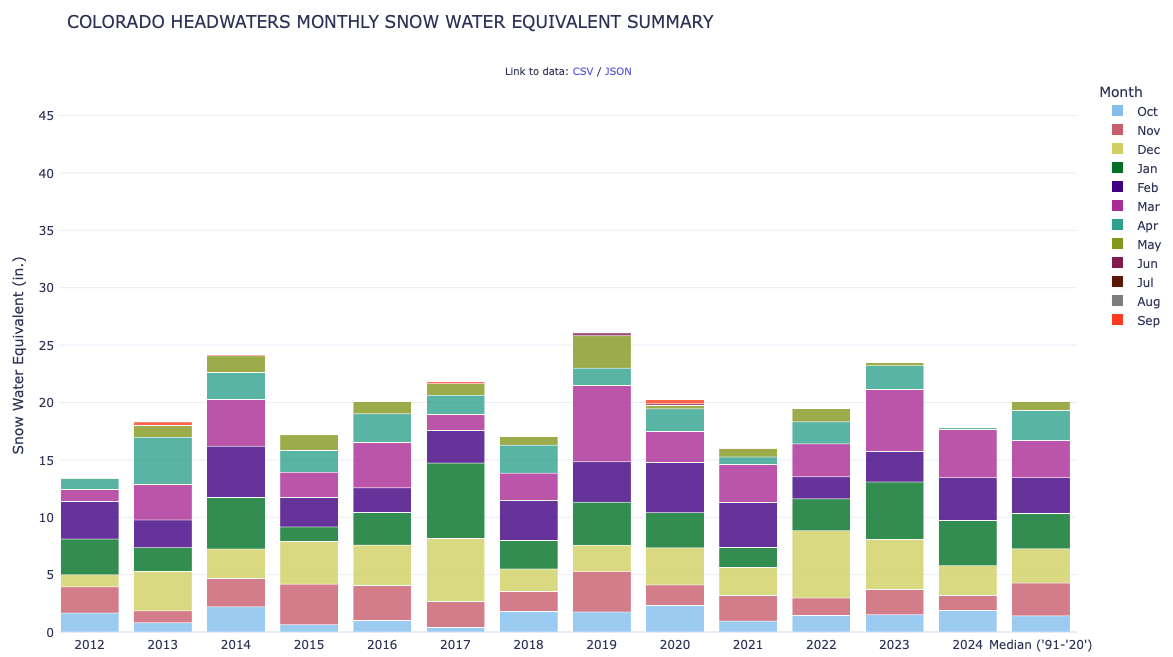
The graphic above is a pretty cool product produced by the NRCS. Focusing in on the Colorado Headwaters region here, we’re looking at the total amount of snowpack that accumulates in each individual month for water years back to 2012. The stacked graph on the right shows the median (what is typically expected). Next to that is how the current water year is stacking up. The magenta color is March snowpack. You can see this year is a bit ahead of the median, but behind what we had last year. The teal and green colors are yet to stack up for April and May. For just April and May, we normally add 3.4″ of new snowpack. Water Years 2013 and 2019 are examples of when we got much more than that in April and May.
Now look more closely at Water Years 2012 and 2021. In 2012 snowpack lagged behind for most of the winter. And there was barely any accumulations in March and April, resulting in near record low snowpack for many areas, including the Colorado headwaters. In 2021, accumulations were a little behind at the end of March, but not too far off. Unfortunately, very low snowpack numbers in April and May resulted in much below average total snowpack and contributed to worsening drought conditions.
While our 7-day outlook for precipitation shows more activity over the mountains, mid-April is looking more likely to be warm and dry. If we pick up normal accumulations as the melt starts this spring, our snowpack season will end in decent shape. Areas that miss out on new accumulations and start a rapid melt may find their situation a bit more concerning at the beginning of summer. We’ll see how it all unfolds soon!
If you are interesting in exploring the interactive graphics provided by the NRCS – and used for this blog – check out the NRCS Colorado Snow Survey page.
Colorado lawmakers on Wednesday hailed the announcement by federal officials that 220,000 acres of national forest land on Colorado’s Western Slope will be protected from oil and gas development and mining for at least the next 20 years.
The U.S. Interior Department confirmed that it would withdraw the Thompson Divide area near Crested Butte from federal mineral leasing, following an 18-month review process and more than a decade of advocacy by local conservationists and Colorado officials.
“This announcement is a testament to the persistence of Colorado’s farmers, ranchers, hunters, anglers, recreationists, wildlife enthusiasts, and conservation groups, who were unrelenting in their work to protect the landscape we all love,” Bennet, a Democrat who has long championed the move, said in a press release.
“The Thompson Divide area is a treasured landscape, valued for its wildlife habitat, clean air and water, and abundant recreation, ecological and scenic values,” said U.S. Interior Secretary Deb Haaland. “The Biden-Harris administration is committed to ensuring that special places like these are protected for future generations.”
Prohibiting mineral leasing in the Thompson Divide area is one component of the Colorado Outdoor Recreation and Economy Act, a public lands package championed by Democrats in the state’s congressional delegation since 2019. With the bill stalled by Republican opposition, President Joe Biden in 2022 moved to implement several CORE Act provisions through executive action, including the designation of the Camp Hale–Continental Divide National Monument near Leadville.
While oil and gas trade groups opposed the move, a U.S. Forest Service assessment last year found the impact on the industry would be negligible, while “the proposed action would protect the agricultural, ranching, wildlife, air quality, recreation, ecological, and scenic values of the Thompson Divide area for both intrinsic and economic value to local communities.”
The withdrawal order applies to nearly 200,000 acres of in the White River and Grand Mesa, Uncompahgre, and Gunnison national forests, in addition to 20,000 acres of public land administered by the Bureau of Land Management. The Federal Land Policy and Management Act authorizes the Interior Department to order such withdrawals for a maximum of 20 years.
The CORE Act, which Colorado Democrats have reintroduced for a third time in Congress, still aims to make the withdrawal permanent. The bill stands little chance of being passed by the Republican-controlled House, where GOP lawmakers including Rep. Lauren Boebert of Windsor have called it a “400,000-acre land grab.”
But a long list of local elected officials and conservation advocates say Wednesday’s announcement has been a long time coming.
“We have worked for almost two decades to secure meaningful protection for the Divide, with ranchers, hunters, anglers, mountain bikers, off road vehicle users, and environmentalists coming together in an unlikely alliance to preserve the current uses of these lands,” Jason Sewell, a rancher and president of the Thompson Divide Coalition, said in a statement. “While we will continue to advocate for permanent protections for the Thompson Divide as afforded in the CORE Act, we could not be more thrilled to know that this landscape will continue for the next 20 years to provide the recreational opportunities, jobs, and wildlife habitat that it has for generations.”
In response to falling flows in the critical habitat reach, the Bureau of Reclamation has scheduled an increase in the release from Navajo Dam from 400 cubic feet per second (cfs) to 500 cfs for tomorrow, April 5th, at 4:00 AM.
Releases are made for the authorized purposes of the Navajo Unit, and to attempt to maintain a target base flow through the endangered fish critical habitat reach of the San Juan River (Farmington to Lake Powell). The San Juan River Basin Recovery Implementation Program recommends a target base flow of between 500 cfs and 1,000 cfs through the critical habitat area. The target base flow is calculated as the weekly average of gaged flows throughout the critical habitat area from Farmington to Lake Powell.
Click the link to read the article on The Denver Post website (Elise Schmelzer). Here’s an excerpt:
April 3, 2024
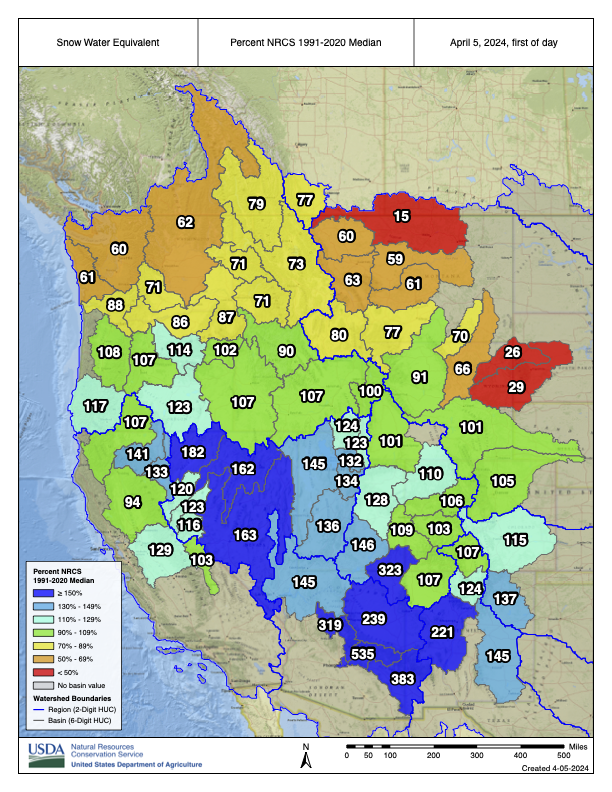
The statewide snowpack sat at 109% of the 30-year median on Wednesday, just a few days shy of the normal peak of snowpack for the state. Every major river basin in the state also recorded above-median snowpack, reducing the risk of large, uncontrollable wildfires and boosting the state’s water supplies. Despite a slow start to the snow season, large storms in February and March boosted the amount of water that will become available as mountain snow melts. The statewide snowpack had lagged behind the median until early March.
Colorado snowpack April 5, 2024 via the NRCS.
In Colorado, the major river basins in the state ranged between 104% and 112% of the 30-year median this week. At 119% above the median, the Arkansas River basin had the best year…
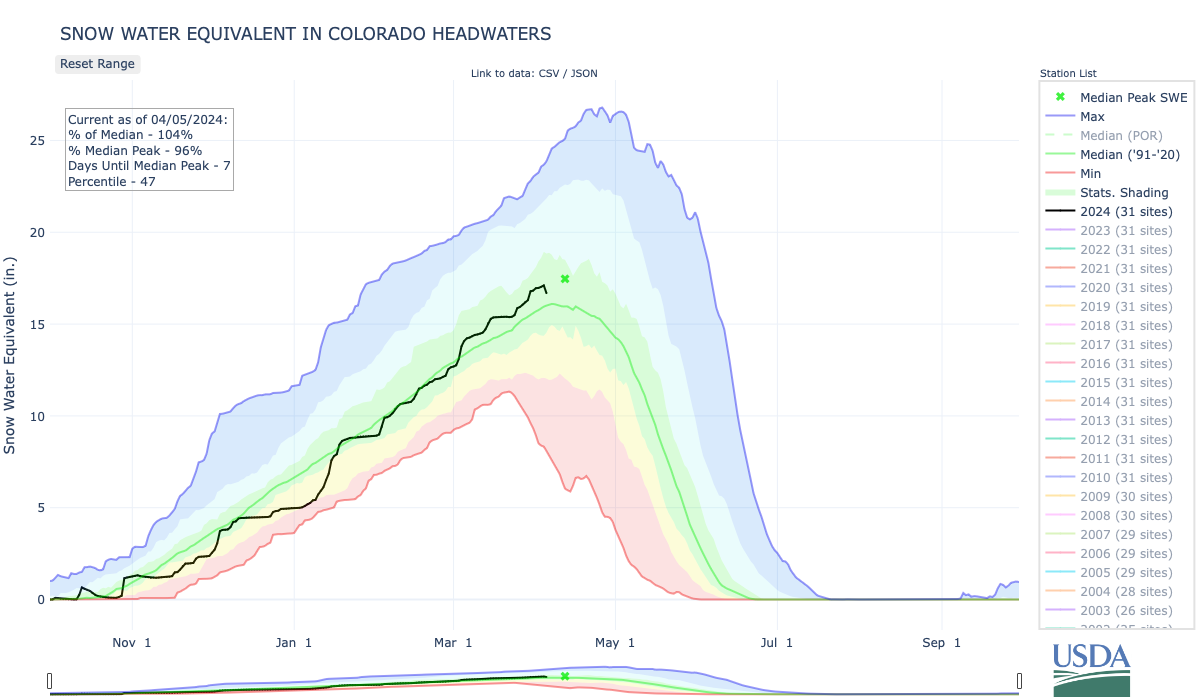
Snowpack in the Upper Colorado River Basin is at 114% of the median depth, which is critical for restoring water levels in Lake Mead and Lake Powell, the two major reservoirs in the Southwest. But even if snowpack is above average, the amount of water that reaches the reservoirs can be below average due to dry soil or high heat, said Dan McEvoy with the Western Regional Climate Center.
Snow levels are far lower in Montana, Idaho, Washington and northern Wyoming. Many river basins in those states sat at less than 70% of the median as of Sunday, the most current data show.
The latest National Climate Assessment warns of a shrinking snowpack and serious downstream consequences
A recent federal synthesis of climate change research paints a grim portrait of snow’s future in the American West and warns that the fast-growing region’s water supply is vulnerable.
“Climate change will continue to cause profound changes in the water cycle, increasing the risk of flooding, drought, and degraded water supplies for both people and ecosystems,” according to the Fifth National Climate Assessment (NCA5) released in November.
The congressionally mandated report concludes there is “widespread consensus” that warming will “decrease the proportion of US precipitation that falls as snow, decrease snow extents, advance the timing of snowmelt rates and pulses, increase the prevalence of rain-on-snow events,” and transform the runoff that is vital for farms, cities and ecosystems.
Climate change has already diminished the West’s snowpack, with warming global temperatures leading to earlier peaks and shorter seasons, especially at lower elevations and in areas closer to the coast.
In areas where snow is the dominant source of runoff, the volume of water stored in the snowpack may decrease by more than 24% by 2050 under some emissions scenarios, with “persistent low-snow conditions emerging within the next 60 years,” the report said.
“When we have less snow in the West, it can strain our water supplies,” said report co-author Steph McAfee, regional administrator of the U.S. Geological Survey’s Southwest Climate Adaptation Science Center. “We’ve tended to rely on the snowpack as a reservoir that didn’t need to be built and it doesn’t need to be maintained, so it’s been a key place for storing water. Having less snow directly means less water stored for use in the summer.”
NCA5 stresses that climate change’s reshaping of the water cycle and other impacts will exacerbate inequalities in U.S. society and pose a special threat to some marginalized communities.
“All communities will be affected,” the report said, “but in particular those on the frontline of climate change—including many Black, Hispanic, Tribal, Indigenous, and socioeconomically disadvantaged communities—face growing risks from changes to water quantity and quality due to the proximity of their homes and workplaces to hazards and limited access to resources and infrastructure.”
NCA5 describes itself as the federal government’s “preeminent report on climate change impacts, risks, and responses,” though it is required to steer clear of policy prescriptions.
The report is based on the latest science, but it is produced for decision-makers and the general public, so it is written in relatively accessible language, and data visualizations play a leading role in communicating the findings.
Below I use 10 visuals from NCA5—mostly maps but also charts, an infographic and a photo—to help summarize the report’s conclusions about climate, snow and water in the West, focusing on the more arid parts of the region.
Climate, snow and water
At one level, the story of snow and climate change is simple: in order for snow to fall and stick around, it has to be cold enough, so the warming of the planet is generally bad news for snow.
“I think the changes to snow and snowpack are changes that we have more confidence in than just about any other water parameter because of the direct effect of warming on snowpack and snow precipitation,” said Elizabeth Payton, NCA5’s Water Chapter Lead and a water resources specialist at the Western Water Assessment at the University of Colorado Boulder.
Co-author Ben Harding, senior water resources engineer at Lynker, summed up the report’s findings on snow this way:
“We’re going to see shorter periods of time with snow on the ground, the snow will start to accumulate later and it’ll start to melt earlier,” he said.
A smaller snowpack, a curtailed snow season and a new runoff regime will test the region’s complex water infrastructure of dams, aqueducts and canals, many of which were built in the early to mid-20th century, before climate change was recognized as a peril. The altered snowpack will also strain the West’s water laws and policies, many of which emerged in the 19th century, before some Western states were even admitted to the union.
But while climate change has already shrunk the snowpack in most parts of the world and will continue to take a toll as temperatures climb, there are exceptions that buck the trend. Total global precipitation is expected to increase due to warming, including in places where the snowpack shrivels. NCA5 predicts there will be worse droughts and floods.
For example, atmospheric rivers, which are pivotal for the West’s snowpack and water supply, are expected to strengthen in the years ahead. But beyond a certain point, warming makes it more likely that rain will fall instead of snow, even high in the mountains, raising the risk of flooding and a subpar snowpack.
As temperatures keep rising, increasing rates of melting and evaporation will play a key role. Another critical factor is how much moisture gets sucked up by plants and then transpired into the atmosphere. Some snow never becomes snowmelt and is “lost” to the atmosphere through sublimation, moving directly from the solid to the gaseous phase. Soil moisture is yet another essential element of the water cycle, impacting drought, flooding, agriculture and ecosystems.
But that’s not all. In Colorado, for example, dust-on-snow events are a big deal because the darker material reduces the snow’s reflectivity and causes it to absorb more heat, accelerating the meltout. Climate change threatens to worsen the dust problem as it continues to aridify parts of the West.
Warming is adjusting the dials on all of these factors, and the magnitude of these changes matter, but there’s yet another crucial dimension: timing. In spring, farmers, water managers and dam operators not only care deeply about the volume of the snowpack that will fill reservoirs, canals, ditches and pipes, but also are keenly interested in when that water will be entering the system.
“Having a pulse of snowmelt at the beginning of the growing season has been helpful to farmers and ranchers, and the timing of the snowmelt has been something that ecosystems have evolved to adapt to,” Payton said. “The timing is going to be shifting dramatically.”
Warming has already taken a toll on the West’s snowpack
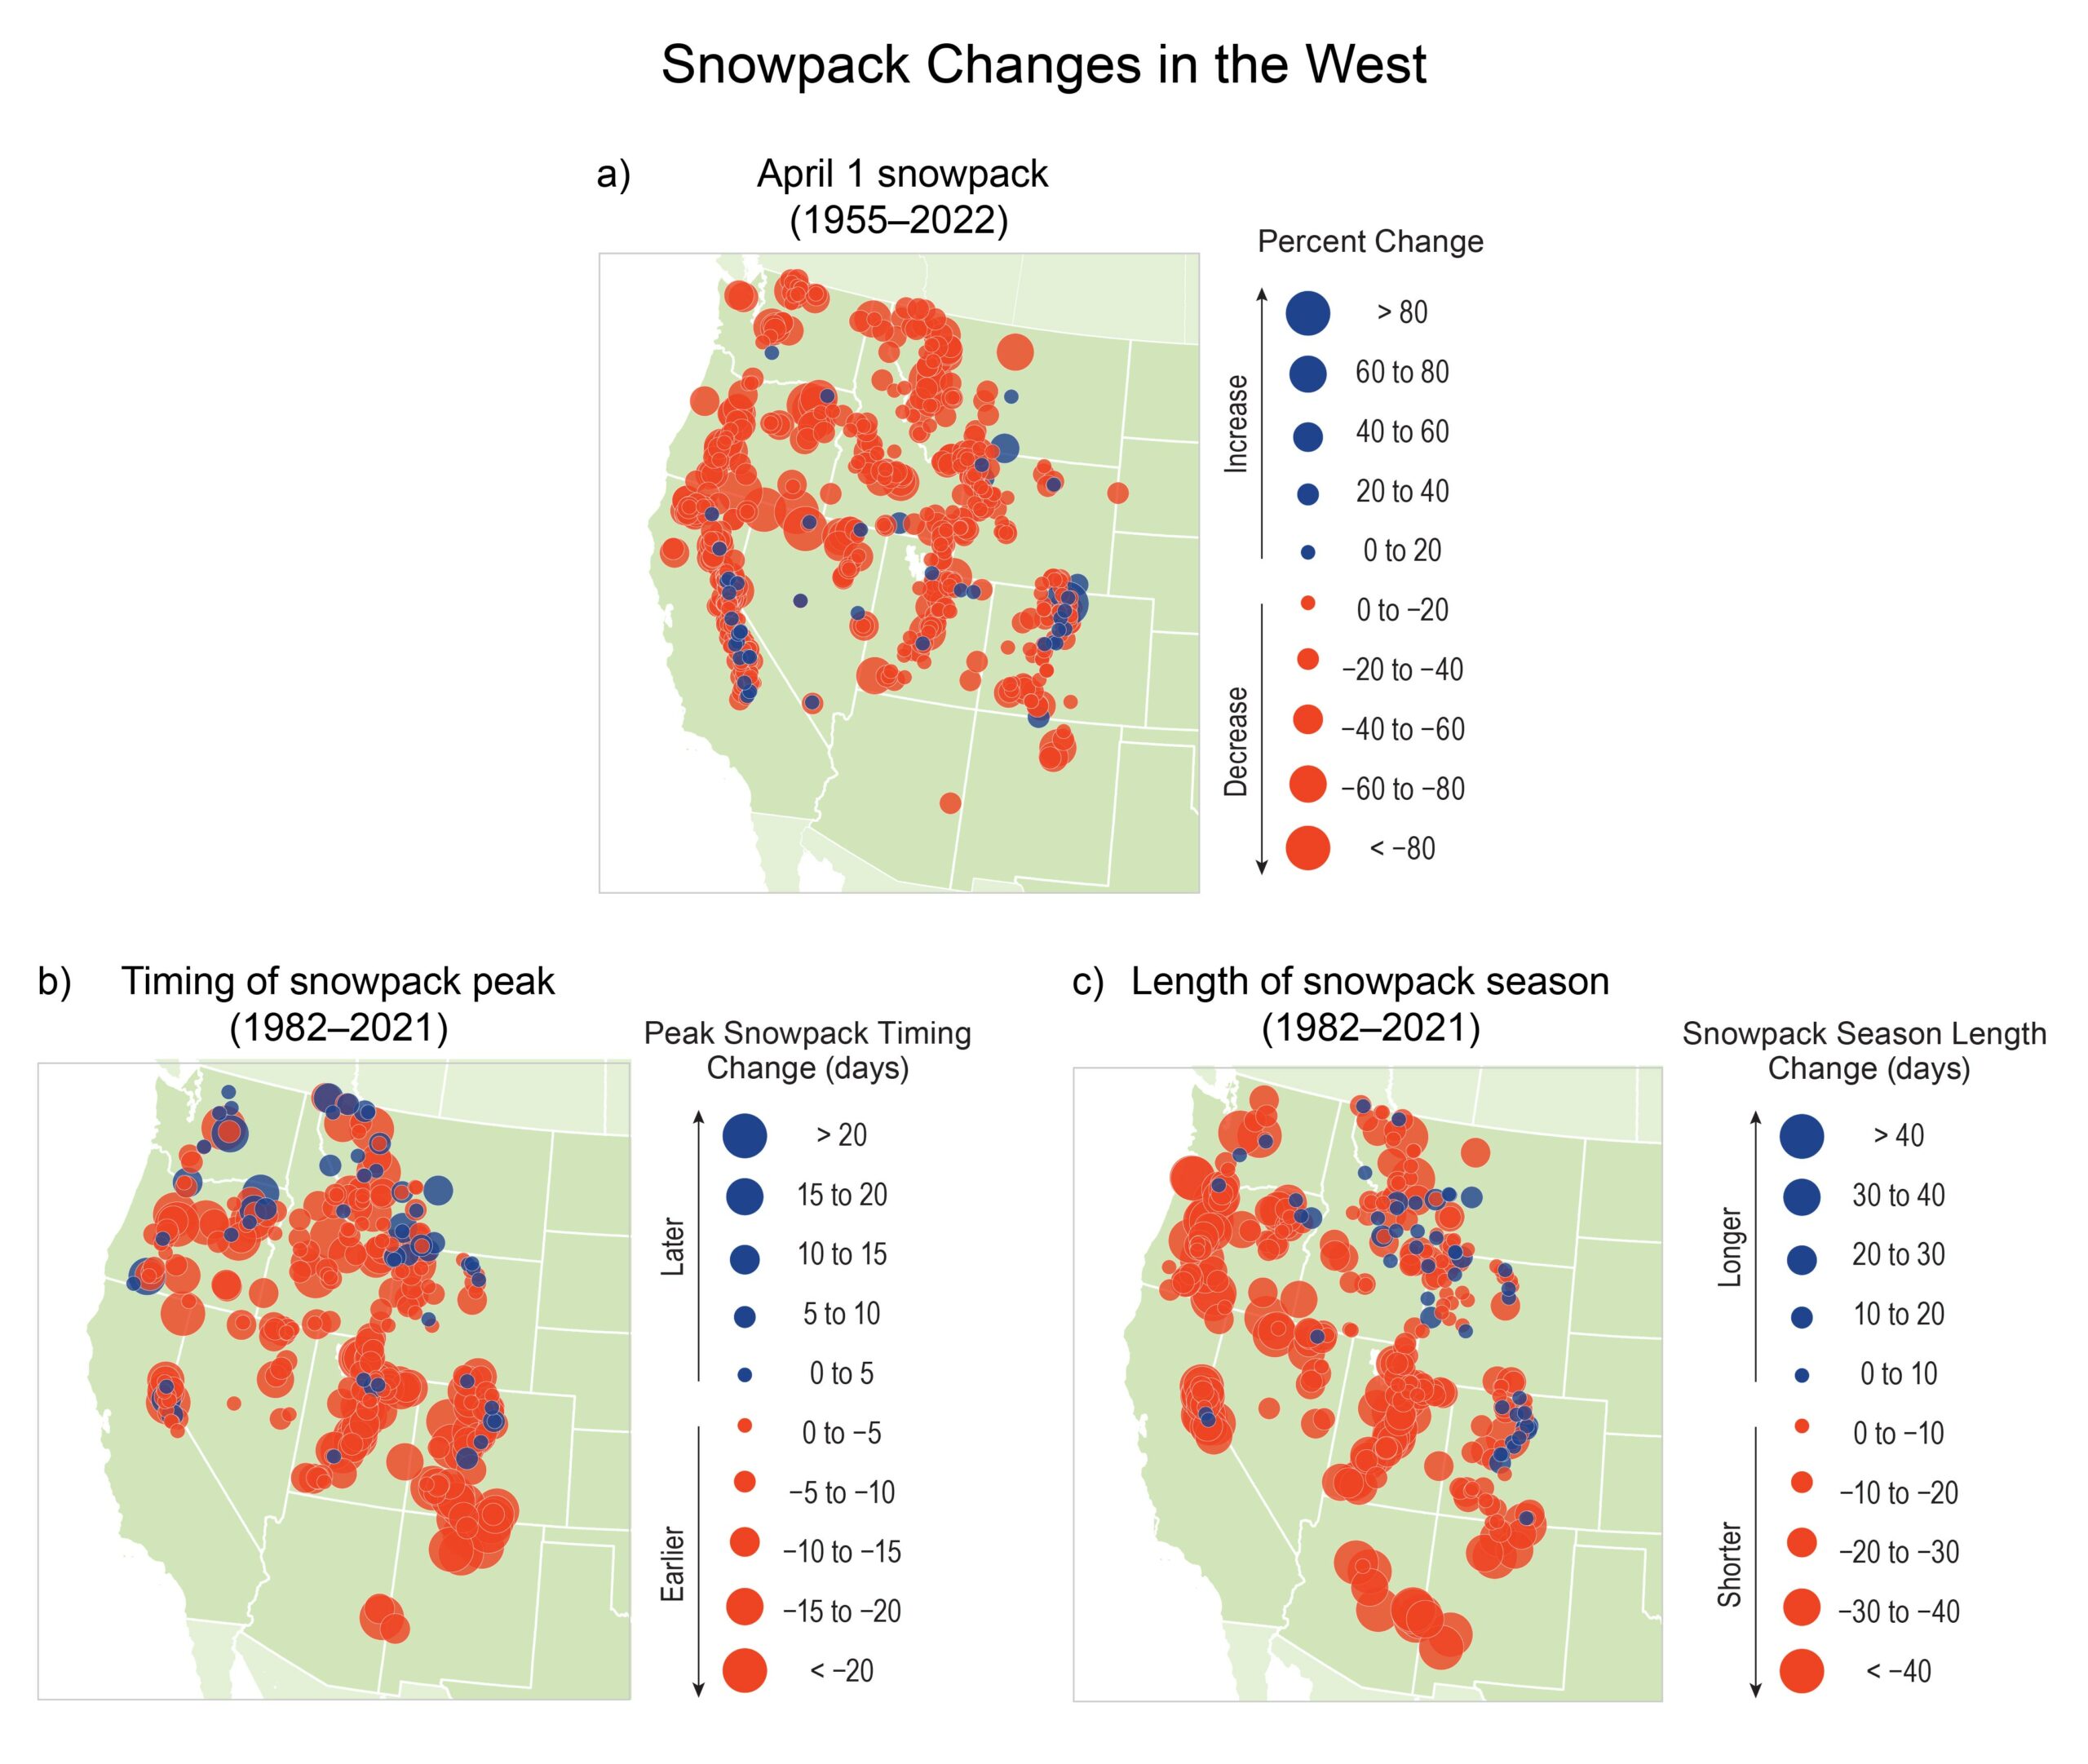
While much of NCA5 focuses on the future, the report also looks back at how climate change has already transformed the nation. The graphic below depicts how the West’s snowpack has shifted in recent decades, with red circles indicating declines, blue circles showing increases and the circle scaled to the size of the change.
The figure’s title says it all: “Western snowpack is declining, peak snowpack is occurring earlier, and the snowpack season is shortening in length.”
Map “a” shows changes in the volume of the snowpack on April 1, a key date for water managers as they plan for the runoff season. About 93% of sites have experienced a decrease in April 1 snowpack since the 1950s, with the decline averaging about 23%. Map “b” concerns the timing of the snowpack’s peak, which has come nearly eight days earlier on average since 1982. Map “c” presents data on the length of the snow season, which has decreased by 18 days on average over the last four decades. (For more on these maps, including the underlying data, see this page from the Environmental Protection Agency.)
While the vast majority of circles in the figure are red, there are also some blue locations, such as in north-central Colorado. When I asked NCA5 co-authors about those sites, several noted that many of them lie at higher elevations—like those along the Continental Divide in Colorado—and the naturally colder conditions there can help preserve their snowpack in a warming world, up to a point.
“There are some parts of Alaska or some very high elevations that might have more snow when the snowpack is at its largest,” McAfee said. “They’re starting out really cold, so if it warms up some, it’s still cold enough to snow. If it warms up enough, then there’s the possibility for snow melting earlier or more of those storms bringing rain than snow.”
While some high-elevation locations may see their snowpack increase in coming years, it’s “by and large definitely not enough to compensate or offset the widespread losses in snow that are occurring everywhere else,” said co-author Justin Pflug, a scientist at the University of Maryland and NASA Goddard Space Flight Center.
How much warmer it gets will be crucial for the snowpack (and much else)
One of the challenges in producing a report like NCA5 is the uncertainty surrounding future greenhouse gas emissions. Innovation, geopolitics, consumer preferences and more make it hard to predict how rapidly the economy will decarbonize. As a result, scientists must use varying emissions scenarios, and it remains to be seen just how much temperatures will rise at a global level.
While the rate of future warming is uncertain, one thing that’s clear is that some parts of the planet will warm more than others and have already experienced much steeper temperature increases.
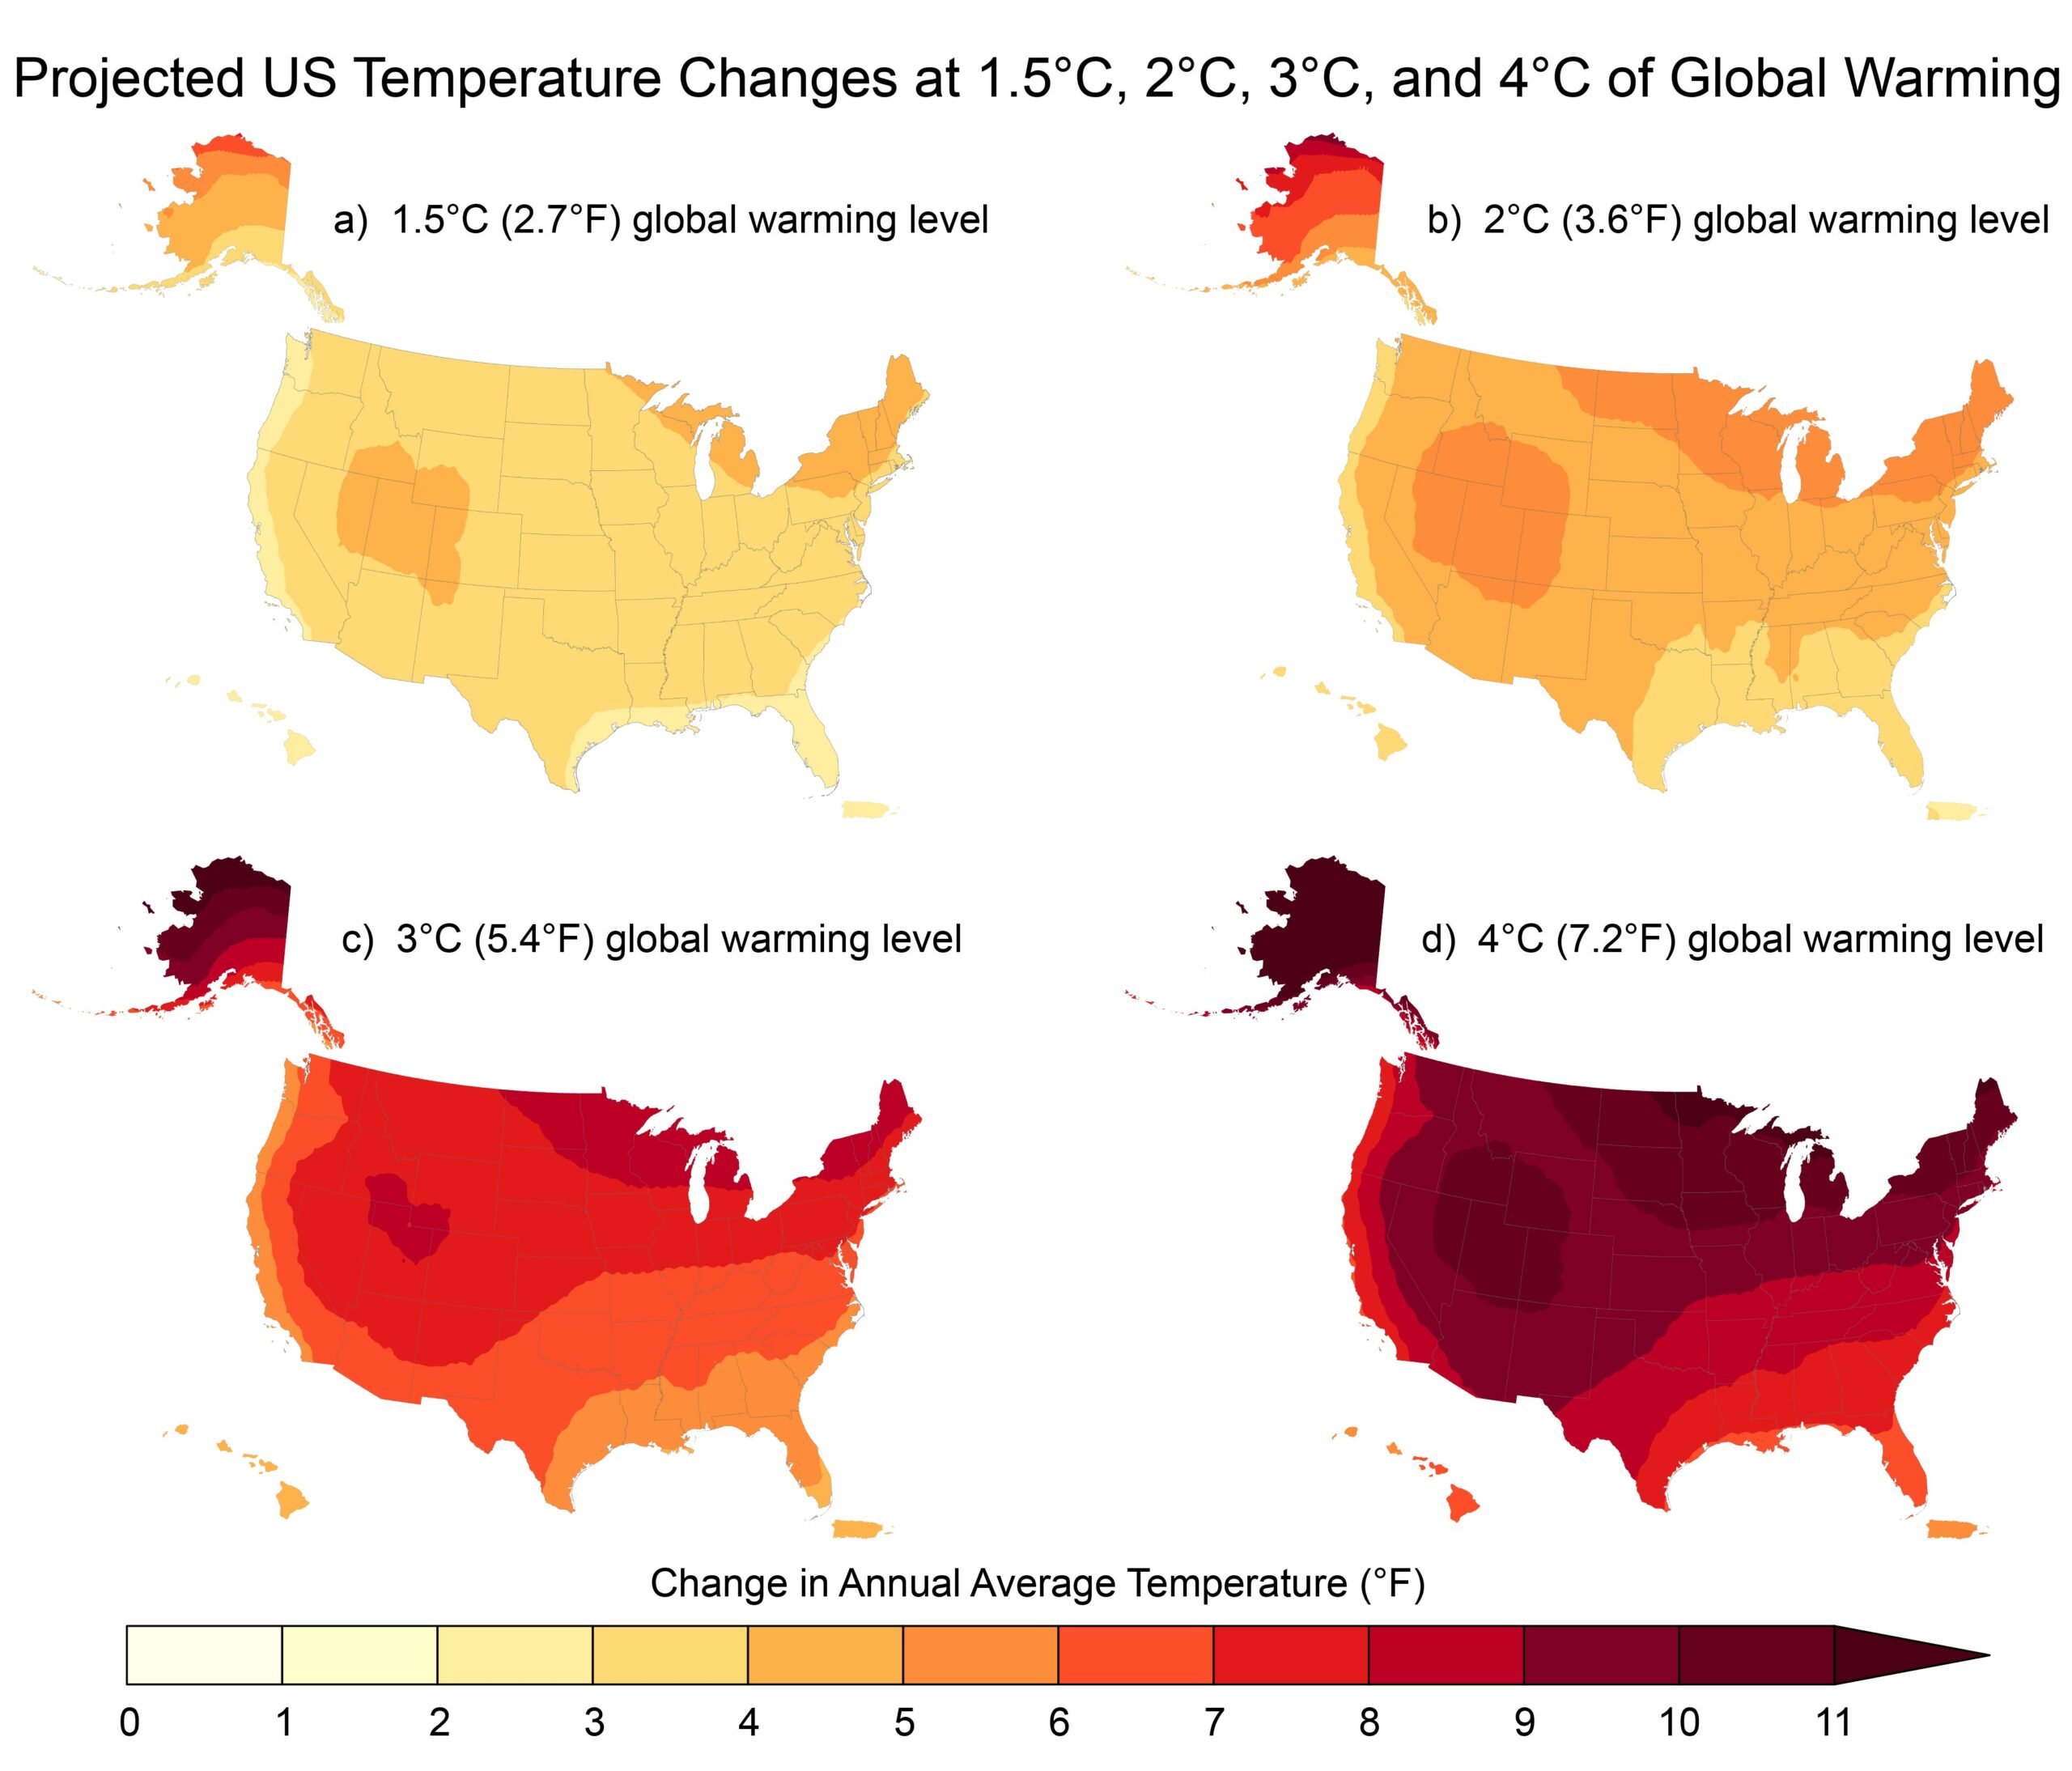
The graphic below, which maps the projected change in temperatures at various levels of global warming, shows that the effects are expected to be uneven across the United States. For example, at 2°C of global warming, parts of the Interior West would be more than 5°C warmer. Across the globe, researchers have found “growing evidence that the rate of warming is amplified with elevation,” according to a 2015 paper in Nature Climate Change.
Locations in Alaska would be even hotter than that, mirroring a global trend of much more rapid warming in the Arctic. A 2022 study in Communications Earth & Environment is titled “The Arctic has warmed nearly four times faster than the globe since 1979.”
“One of the key messages for us in the water chapter is that temperature really matters for water,” McAfee said. “Temperature influences whether or not we get rain or snow. It influences when the snowpack melts. It influences how big a sip the atmosphere takes from the water and all of that. So we can’t think about precipitation and we can’t think about our water systems separate from temperature.”
When people hear about droughts and water shortages, they naturally think of a lack of precipitation, which remains the primary driver of such dry times. But as NCA5 notes, “higher temperatures can cause drought to develop or become more intense than would be expected from precipitation deficits alone.”
In a “hot drought,” the atmosphere demands more moisture and desiccates the landscape. Warmer temperatures also contribute to “snow droughts” (discussed below), “flash droughts” that develop in a matter of weeks and “megadroughts” that can extend over decades.
NCA5 also emphasizes two other messages related to temperature: the degree of change matters greatly, and how hot the planet gets depends on the choices society makes now. [ed. emphasis mine]
“The more the planet warms, the greater the impacts—and the greater the risk of unforeseen consequences,” according to the report. “While there are still uncertainties about how the planet will react to rapid warming and catastrophic future scenarios that cannot be ruled out, the future is largely in human hands.”
Climate change is projected to increase global precipitation, but not necessarily in the Southwest
Scientists and their models can paint a much clearer picture of how temperatures will change compared to the projections for precipitation. That said, global warming is expected to increase overall precipitation on the planet because there will be higher evaporation rates and warmer air can hold more moisture.
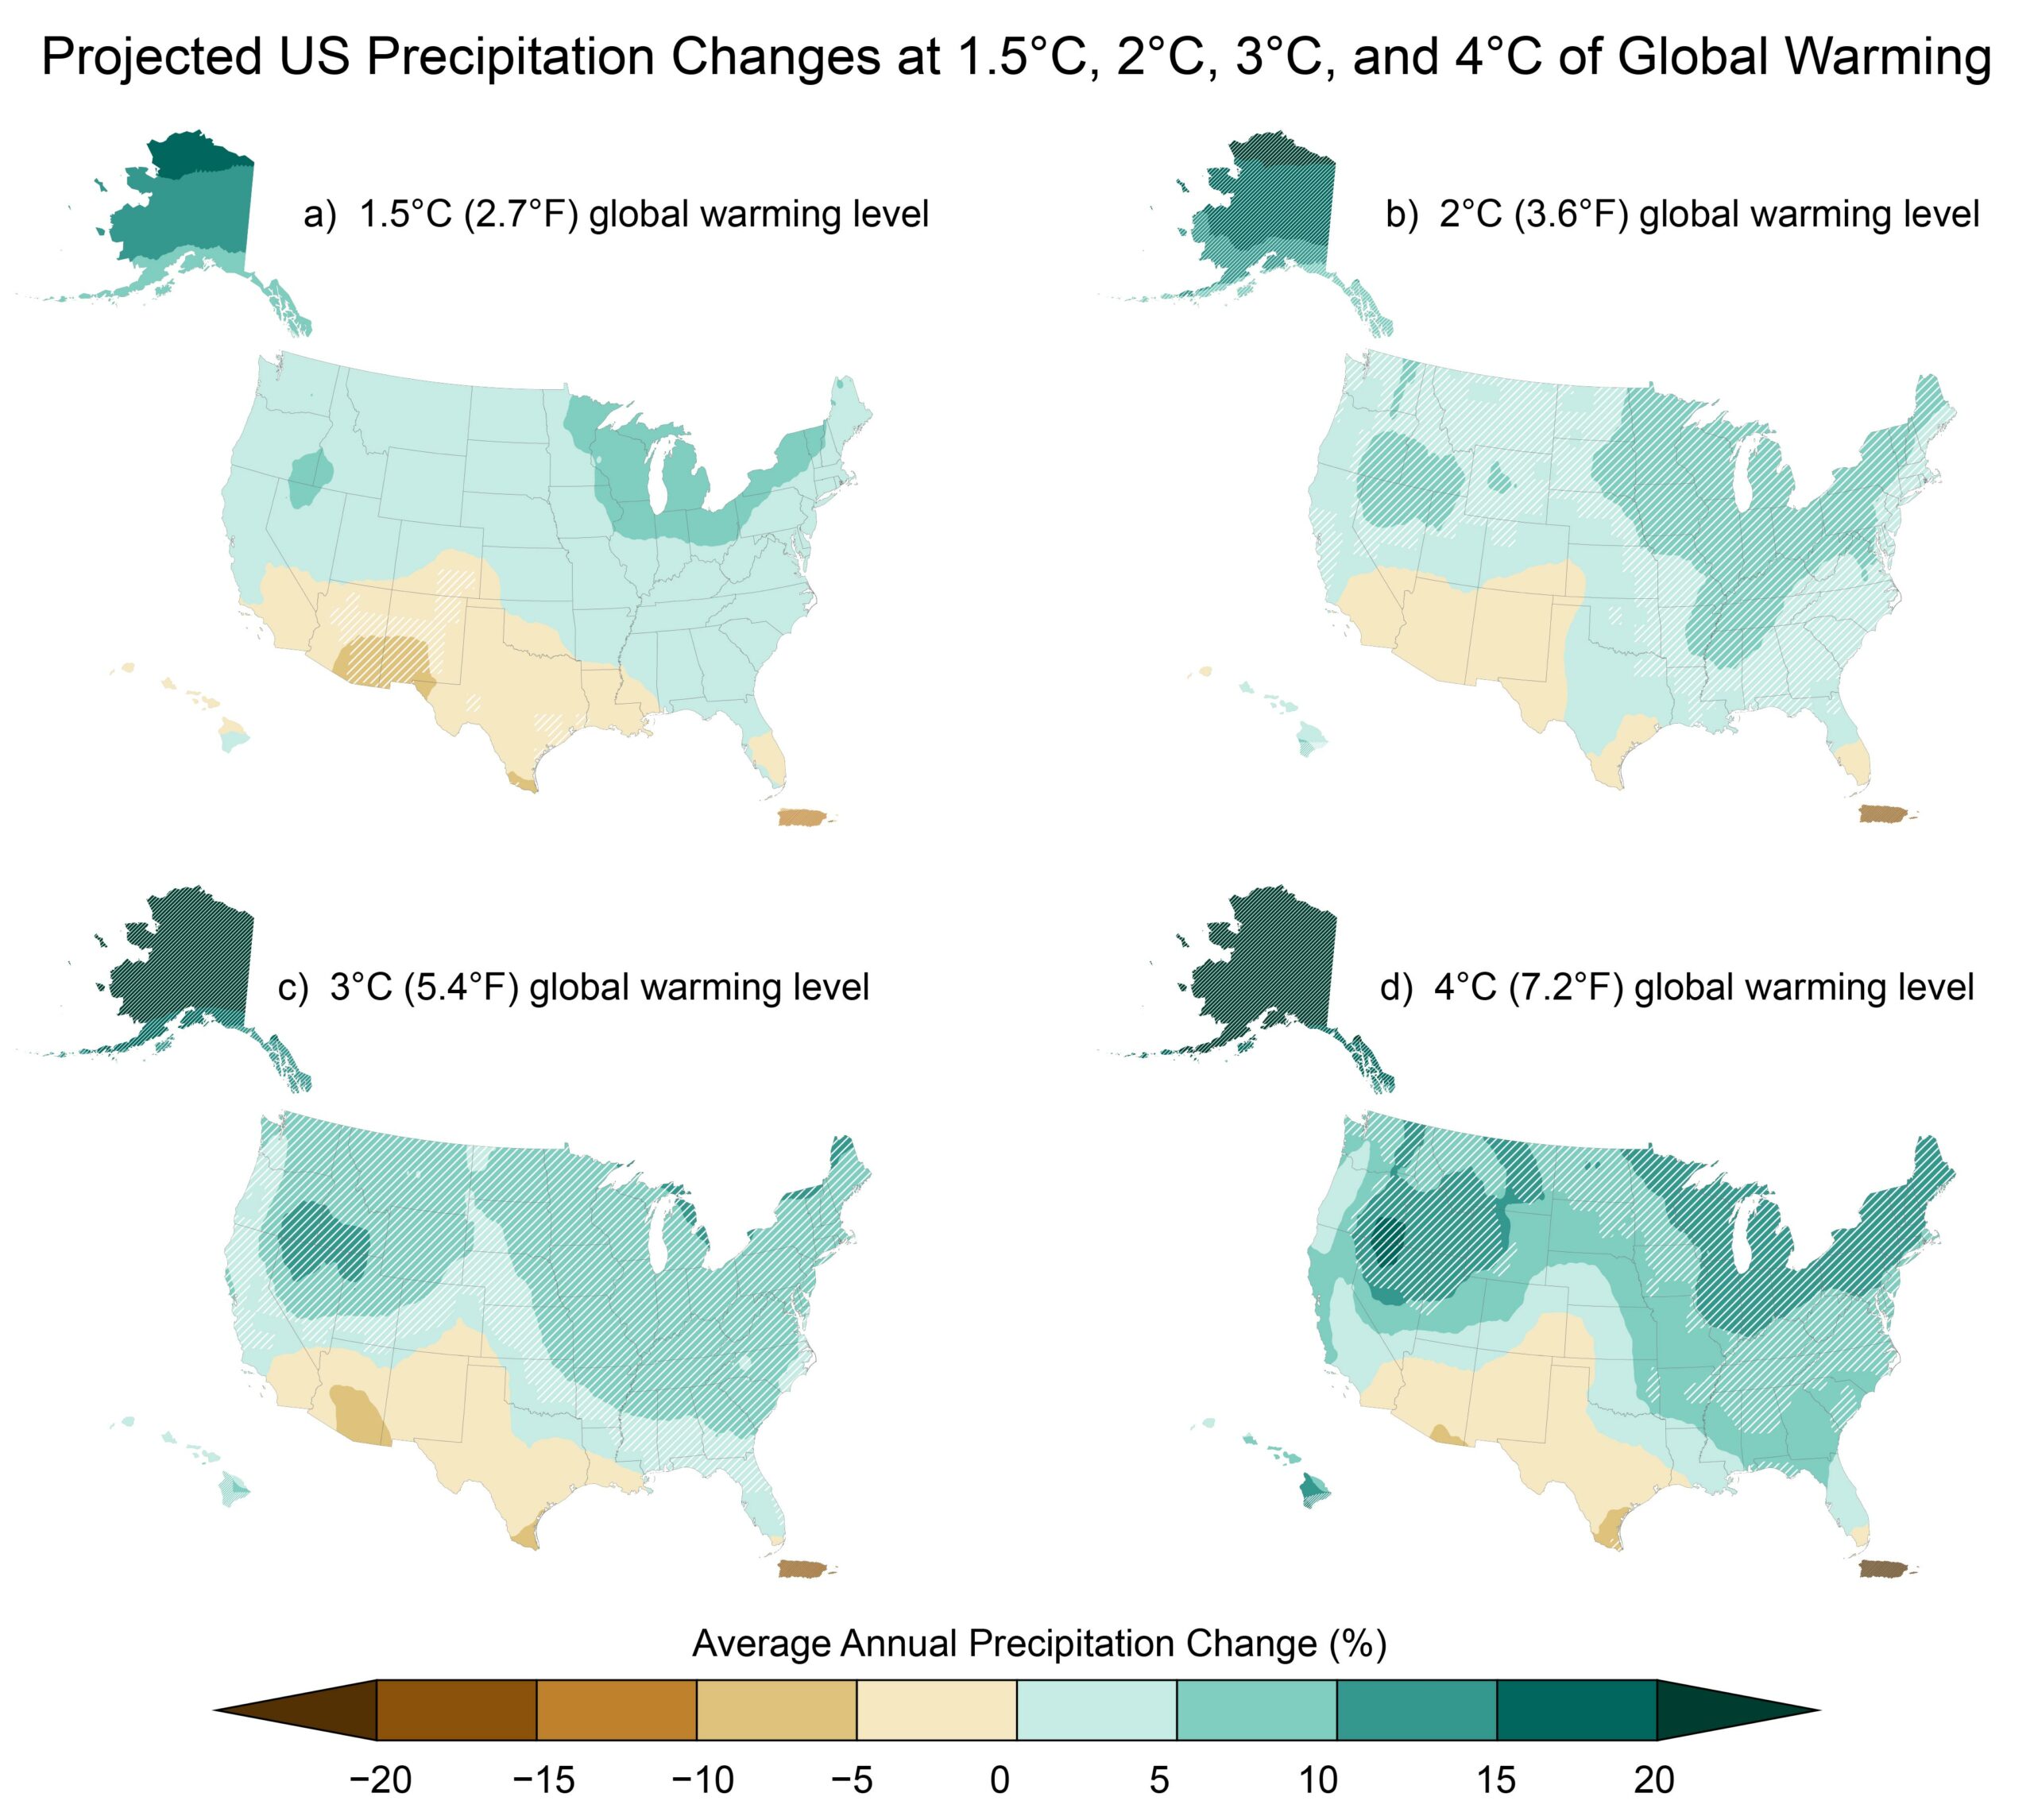
The figure below shows projected changes in annual precipitation according to four different levels of warming, with greens indicating increases and browns depicting decreases. The hatching shows areas where 80% or more of the models agree on whether precipitation will increase or decrease.
Most of the country is expected to see more precipitation overall, with higher levels of warming generally leading to wetter conditions and more certainty about those changes. But in all of the maps, precipitation is expected to decrease in Southern California, much of Arizona, New Mexico and Texas, plus portions of Colorado.
“Precipitation changes also scale with global warming, but these projections vary by location and are less certain than temperature changes,” according to NCA5.
Payton said “there’s not a very strong signal” for total precipitation changes for the Southwest. “The atmosphere can hold more moisture when it’s warmer,” she said, “but that moisture has to come from somewhere, so over the Southwest, where it’s already dry, is it going to be able to suck up that additional amount of moisture that it can hold?”
While precipitation projections are cloudier, Westerners should expect a shift from snowflakes toward raindrops in many parts of the region: “it is virtually certain that less precipitation will fall as snow, leading to large reductions in mountain snowpack and decreases in spring runoff in the mountain West,” according to NCA5.
Overall, NCA5 concludes that “changes in future precipitation and temperature are expected to exacerbate drought across large portions of the US,” with projections showing “the strongest drying signal occurring in the Southwest.”
While drought and water scarcity are dominant themes in more arid parts of the West, these areas also contend with floods that can turn dry washes into raging torrents in a flash and threaten both lives and property.
“Warmer air is thirstier air, and that really raises the risk of higher-severity precipitation events,” Pflug said.
Flooding can also be caused by snowmelt, especially in years with a big snowpack, rapid thawing in spring or when it rains on top of snow.
“Due to climate change, snowmelt-driven flooding is expected to occur earlier in the year due to earlier runoff,” the report said. “Moreover, atmospheric rivers, which have driven much of historical flooding in the region, are expected to intensify under a warming climate.”
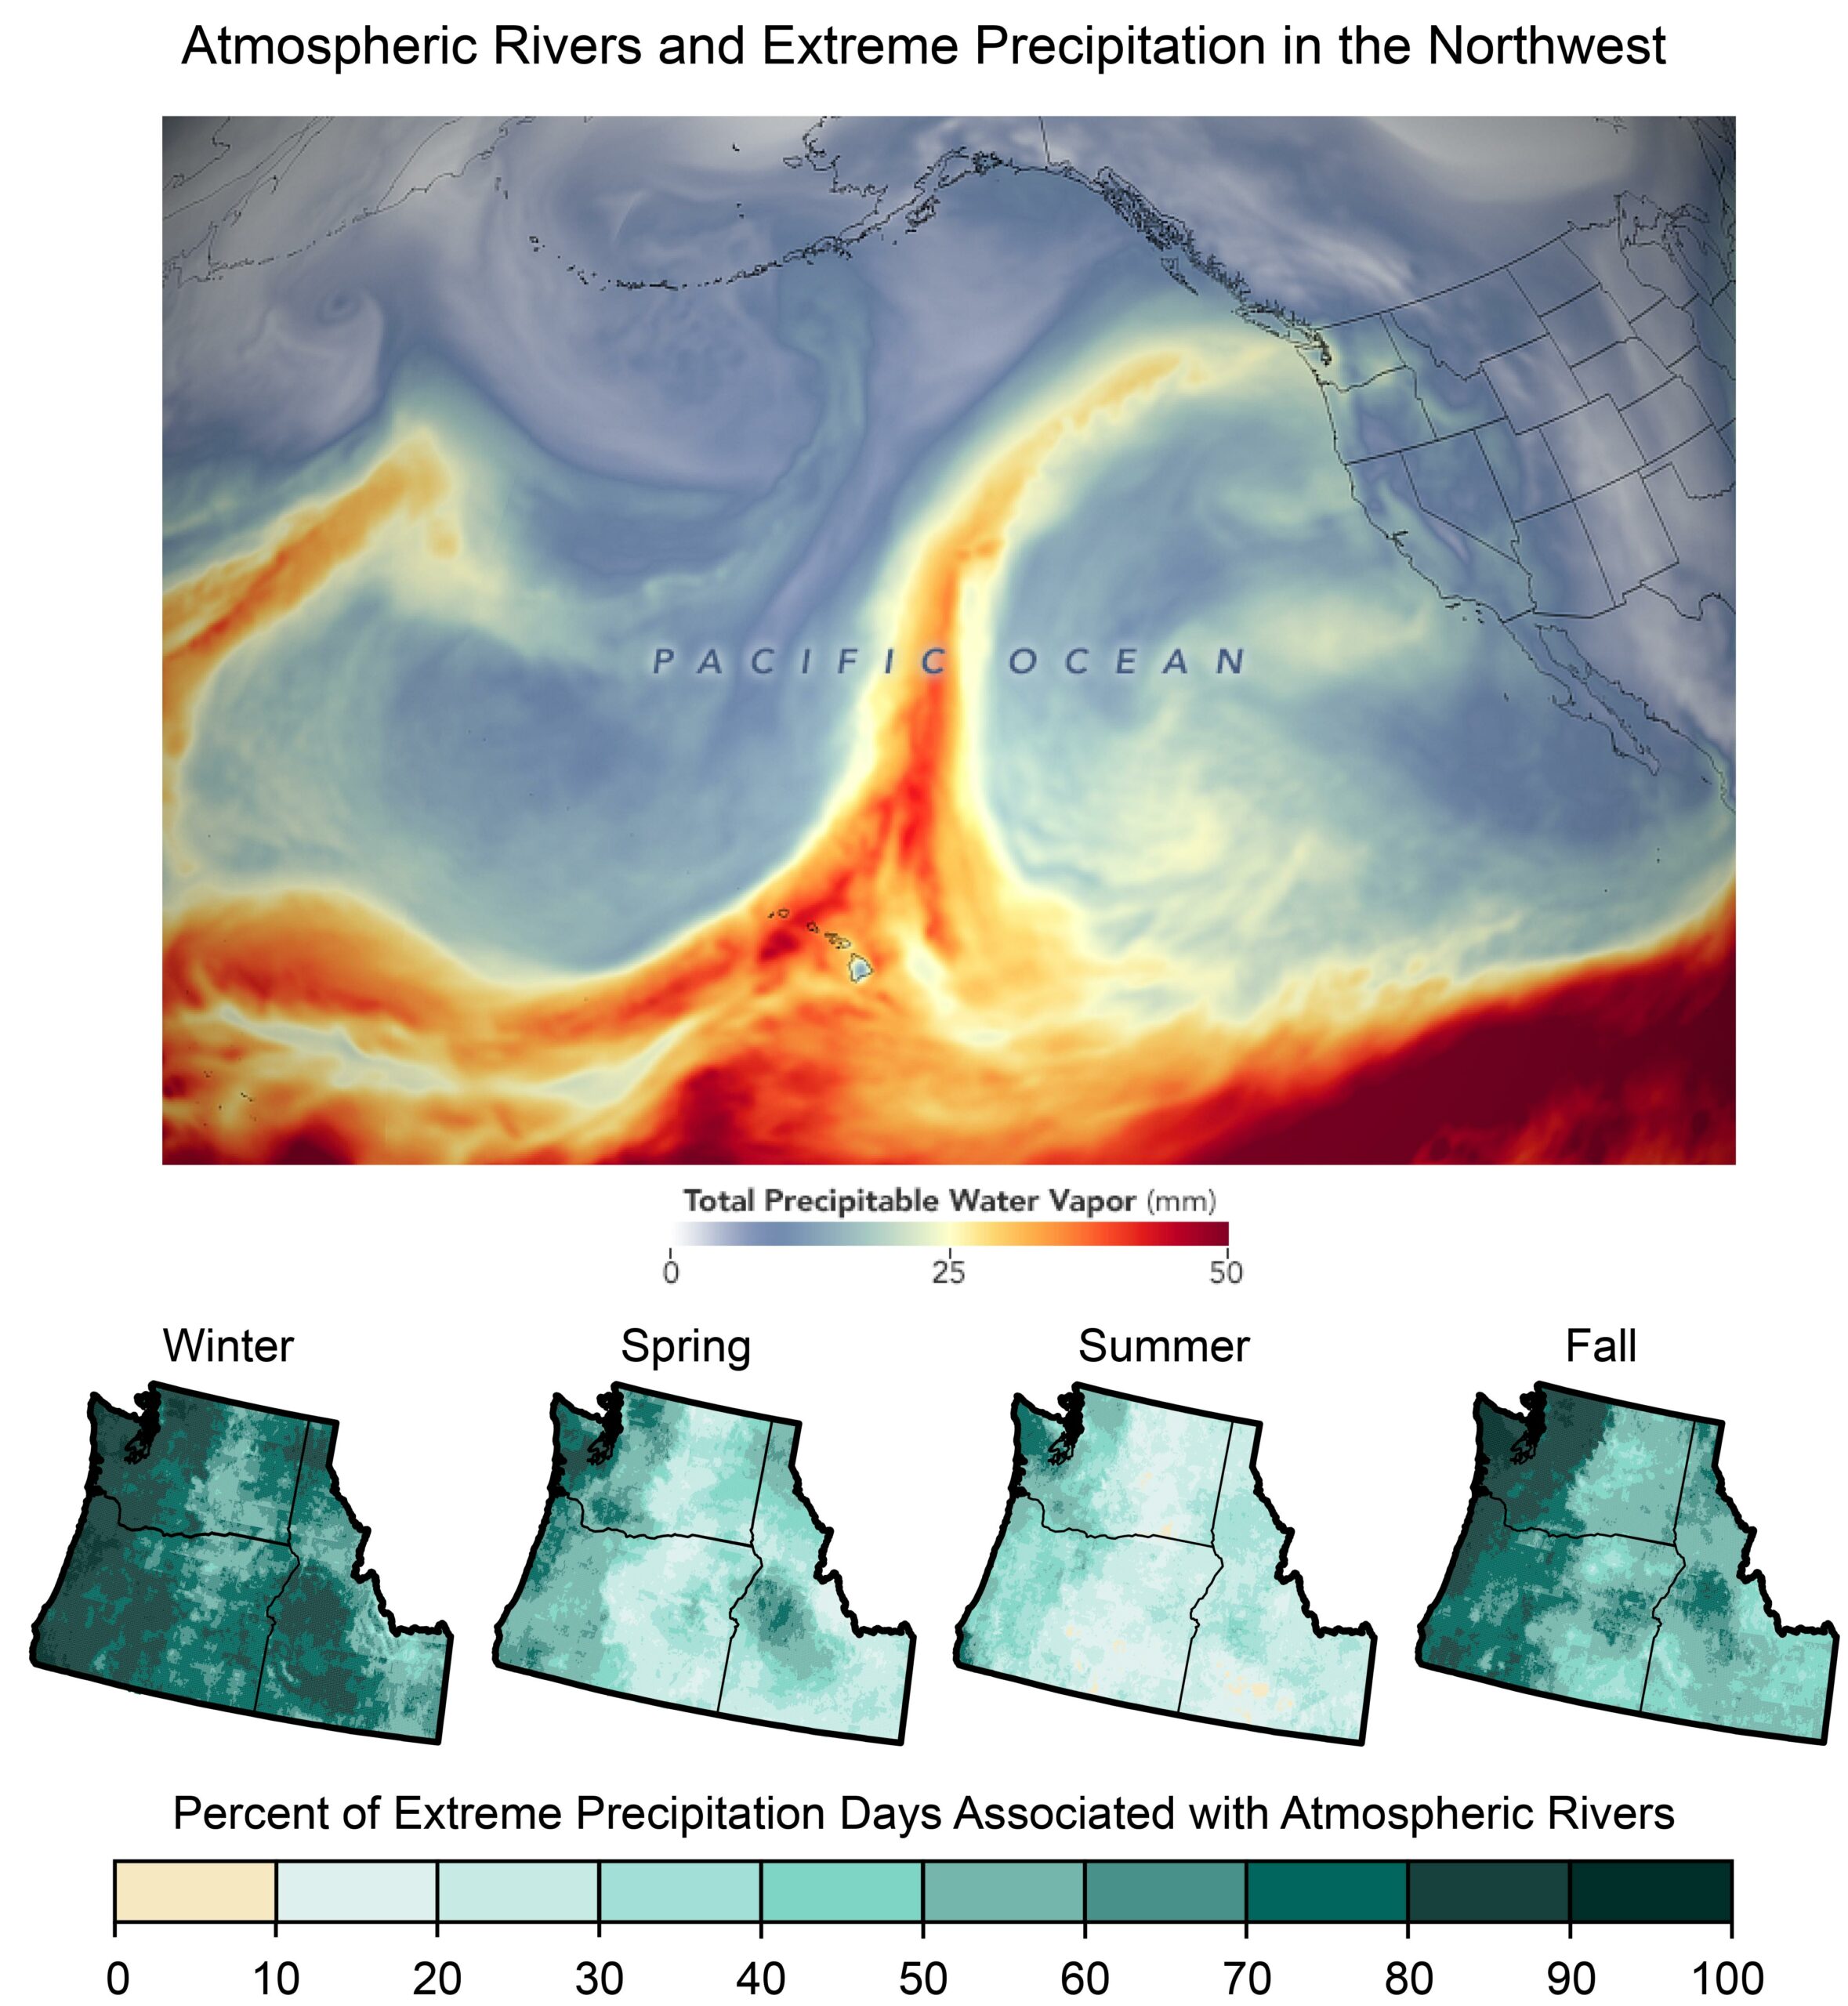
The graphic below shows the importance of atmospheric rivers to extreme precipitation in the Pacific Northwest, especially in winter (see my previous post for more on climate change and atmospheric rivers).
The West’s snowpack will store less water and runoff will change
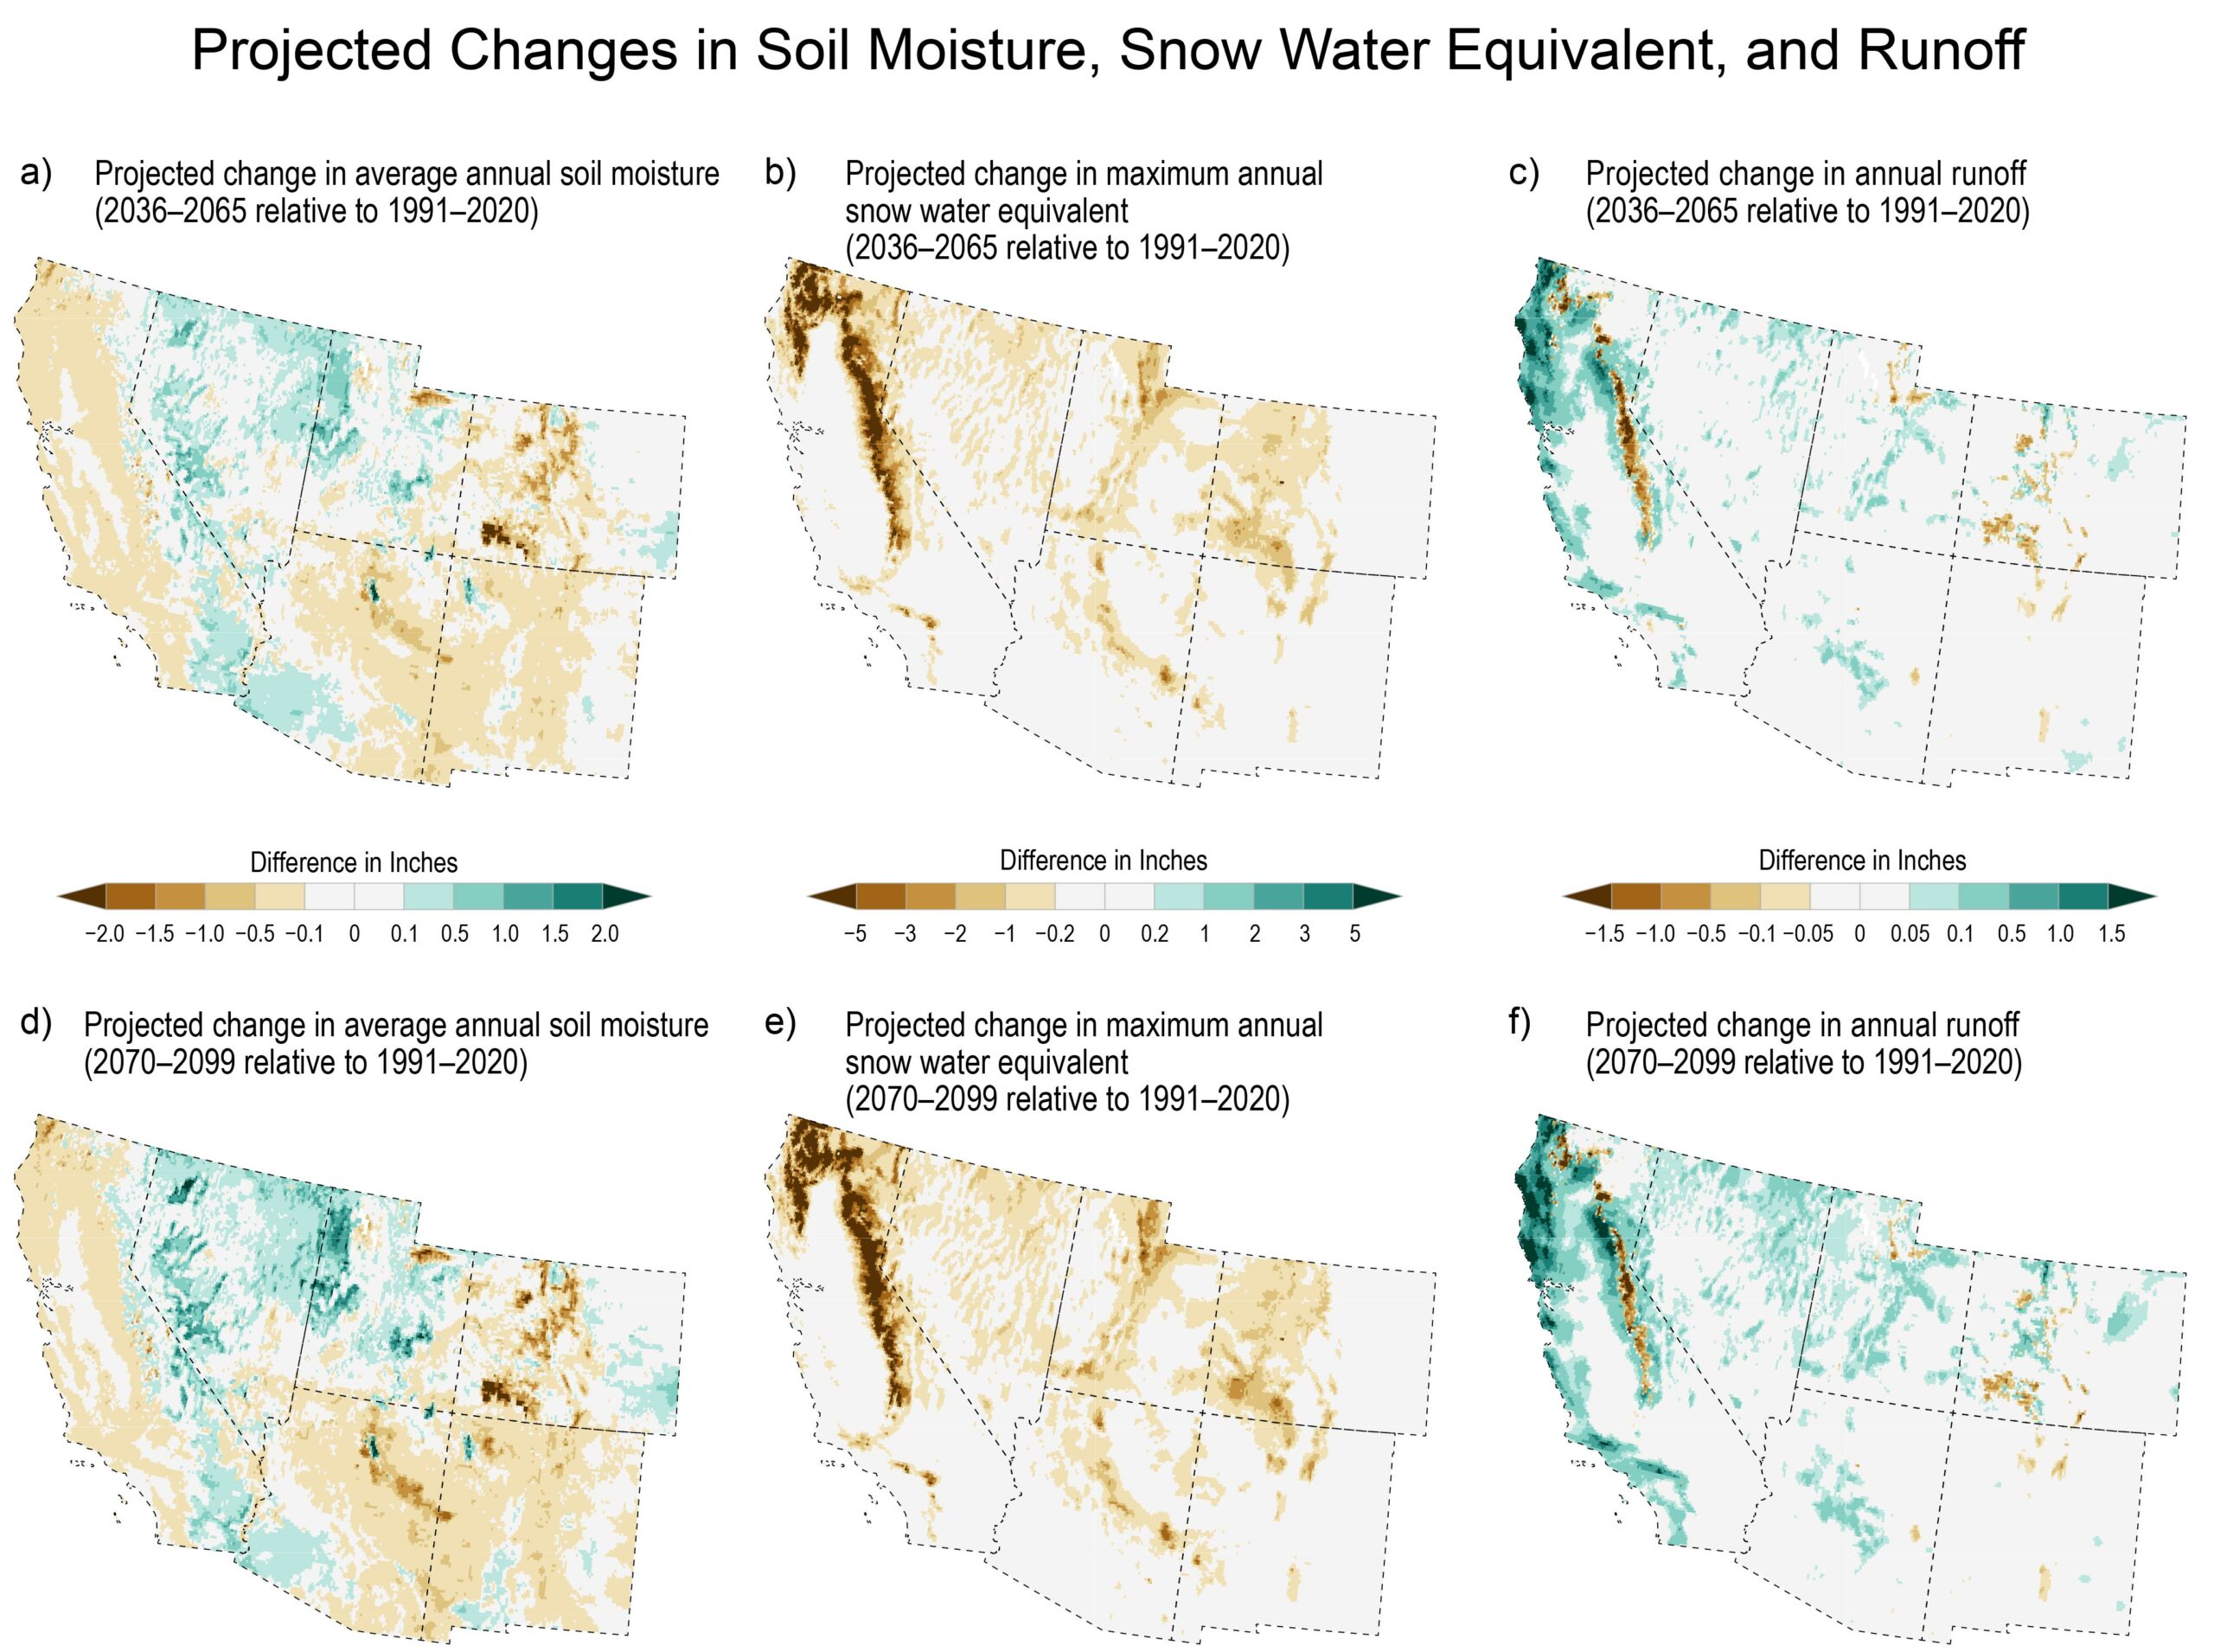
The maps below depict how warming temperatures and changing precipitation patterns are expected to influence three crucial variables in the Southwest’s water cycle, with the top row of maps showing projections for 2036-2065 and the bottom row showing 2070 to 2099, both relative to the 1991-2020 period.
The leftmost maps show projected changes in soil moisture, a critical factor for agriculture and a host of ecological processes. While drier soils are expected in many parts of the Southwest, and especially in portions of the Four Corners states, other areas are expected to see increases in soil moisture.
The center maps depict projected changes in the maximum volume of snow water equivalent, a measure of the snowpack’s water content. Whereas the soil moisture picture is somewhat muddled, the story for snow is crystal clear: steep declines throughout the region, and especially in California’s mountains.
The rightmost maps show expected changes to runoff—the water that reaches streams, rivers, lakes, reservoirs and taps. As with soil moisture, the projections vary by location but many of the highest-elevation areas, such as the Sierra Nevada, the Southern Rockies and Utah’s Wasatch Range, are expected to see decreases in runoff.
The report’s co-authors stressed that the interactions between soil moisture, snowpack and runoff are complicated, and there is still considerable uncertainty about future precipitation patterns. With soil moisture, for instance, earlier snowmelt may lead to wetter conditions in spring but drier conditions later in the summer.
Because the changes will vary across the country, people should “look at results and data and projections for their own region and not necessarily take a message from elsewhere and assume that’s what’s happening where they live,” McAfee said. “Climate change will have different impacts in different places. So the fact that we might be concerned about reduced water supplies in the Colorado River doesn’t necessarily mean we have the same concerns in every river basin.”
In the Colorado River Basin, research has shown that “less snow means more evaporation, and this is because snow is really reflective,” McAfee said. “Anyone who’s ever been out skiing knows this: you can get that reflection up and the nose and chin sunburn, and if the snowpack melts early, the land gets more energy, which makes it possible to evaporate more water from the soils and streams and for the plants to get going earlier.”
One challenge for scientists and water managers is that it’s tough to calculate how much snow is out there. Snow accumulation can vary dramatically on a single run at a ski resort, not only from top to bottom due to thousands of feet of elevation difference, but even from one side of the run to the other due to trees, shading, rocks and wind.
Another vexing problem is tracing what happens to all those H20 molecules after they’ve fallen to earth.
“There’s still some uncertainties about where the snow is going hydrologically,” Pflug said.
In recent years, peak snowpack levels in the Rockies that were around normal have translated into below-average streamflows. Some scientists have pointed to deficits in soil moisture as the culprit for the disparity. Others are researching how warming temperatures are impacting sublimation, when snow converts directly into water vapor. A 2023 paper from Colorado State University scientists argued that spring and summer precipitation was important for explaining the discrepancy between snowpack levels and subsequent runoff.
Here’s how NCA5 sums up the situation for the Colorado River, which supplies some 40 million people in seven U.S. states and Mexico while also irrigating millions of acres of crops:
“Colorado River streamflow over the period 2000–2014 was 19% lower than the 20th-century average, largely due to a reduction in snowfall, less reflected sunlight, and increased evaporation. The period 2000–2021 in the Southwest had the driest soil moisture of any period of the same length in at least the past 1,200 years. While this drought is partially linked to natural climate variability, there is evidence that climate change exacerbated it, because warmer temperatures increase atmospheric ‘thirst’ and dry the soil. Droughts in the region are lasting longer and reflect not a temporary extreme event but a long-term aridification trend—a drier ‘new normal’ occasionally punctuated by periods of extreme wetness consistent with expected increases in precipitation volatility in a warming world.”
Some rural and Indigenous communities are especially vulnerable to the changing water cycle
The consequences of a thinner, less reliable snowpack and changing runoff patterns will be far-reaching, but they will be especially problematic for some rural communities dependent on farming and snow-related recreation.
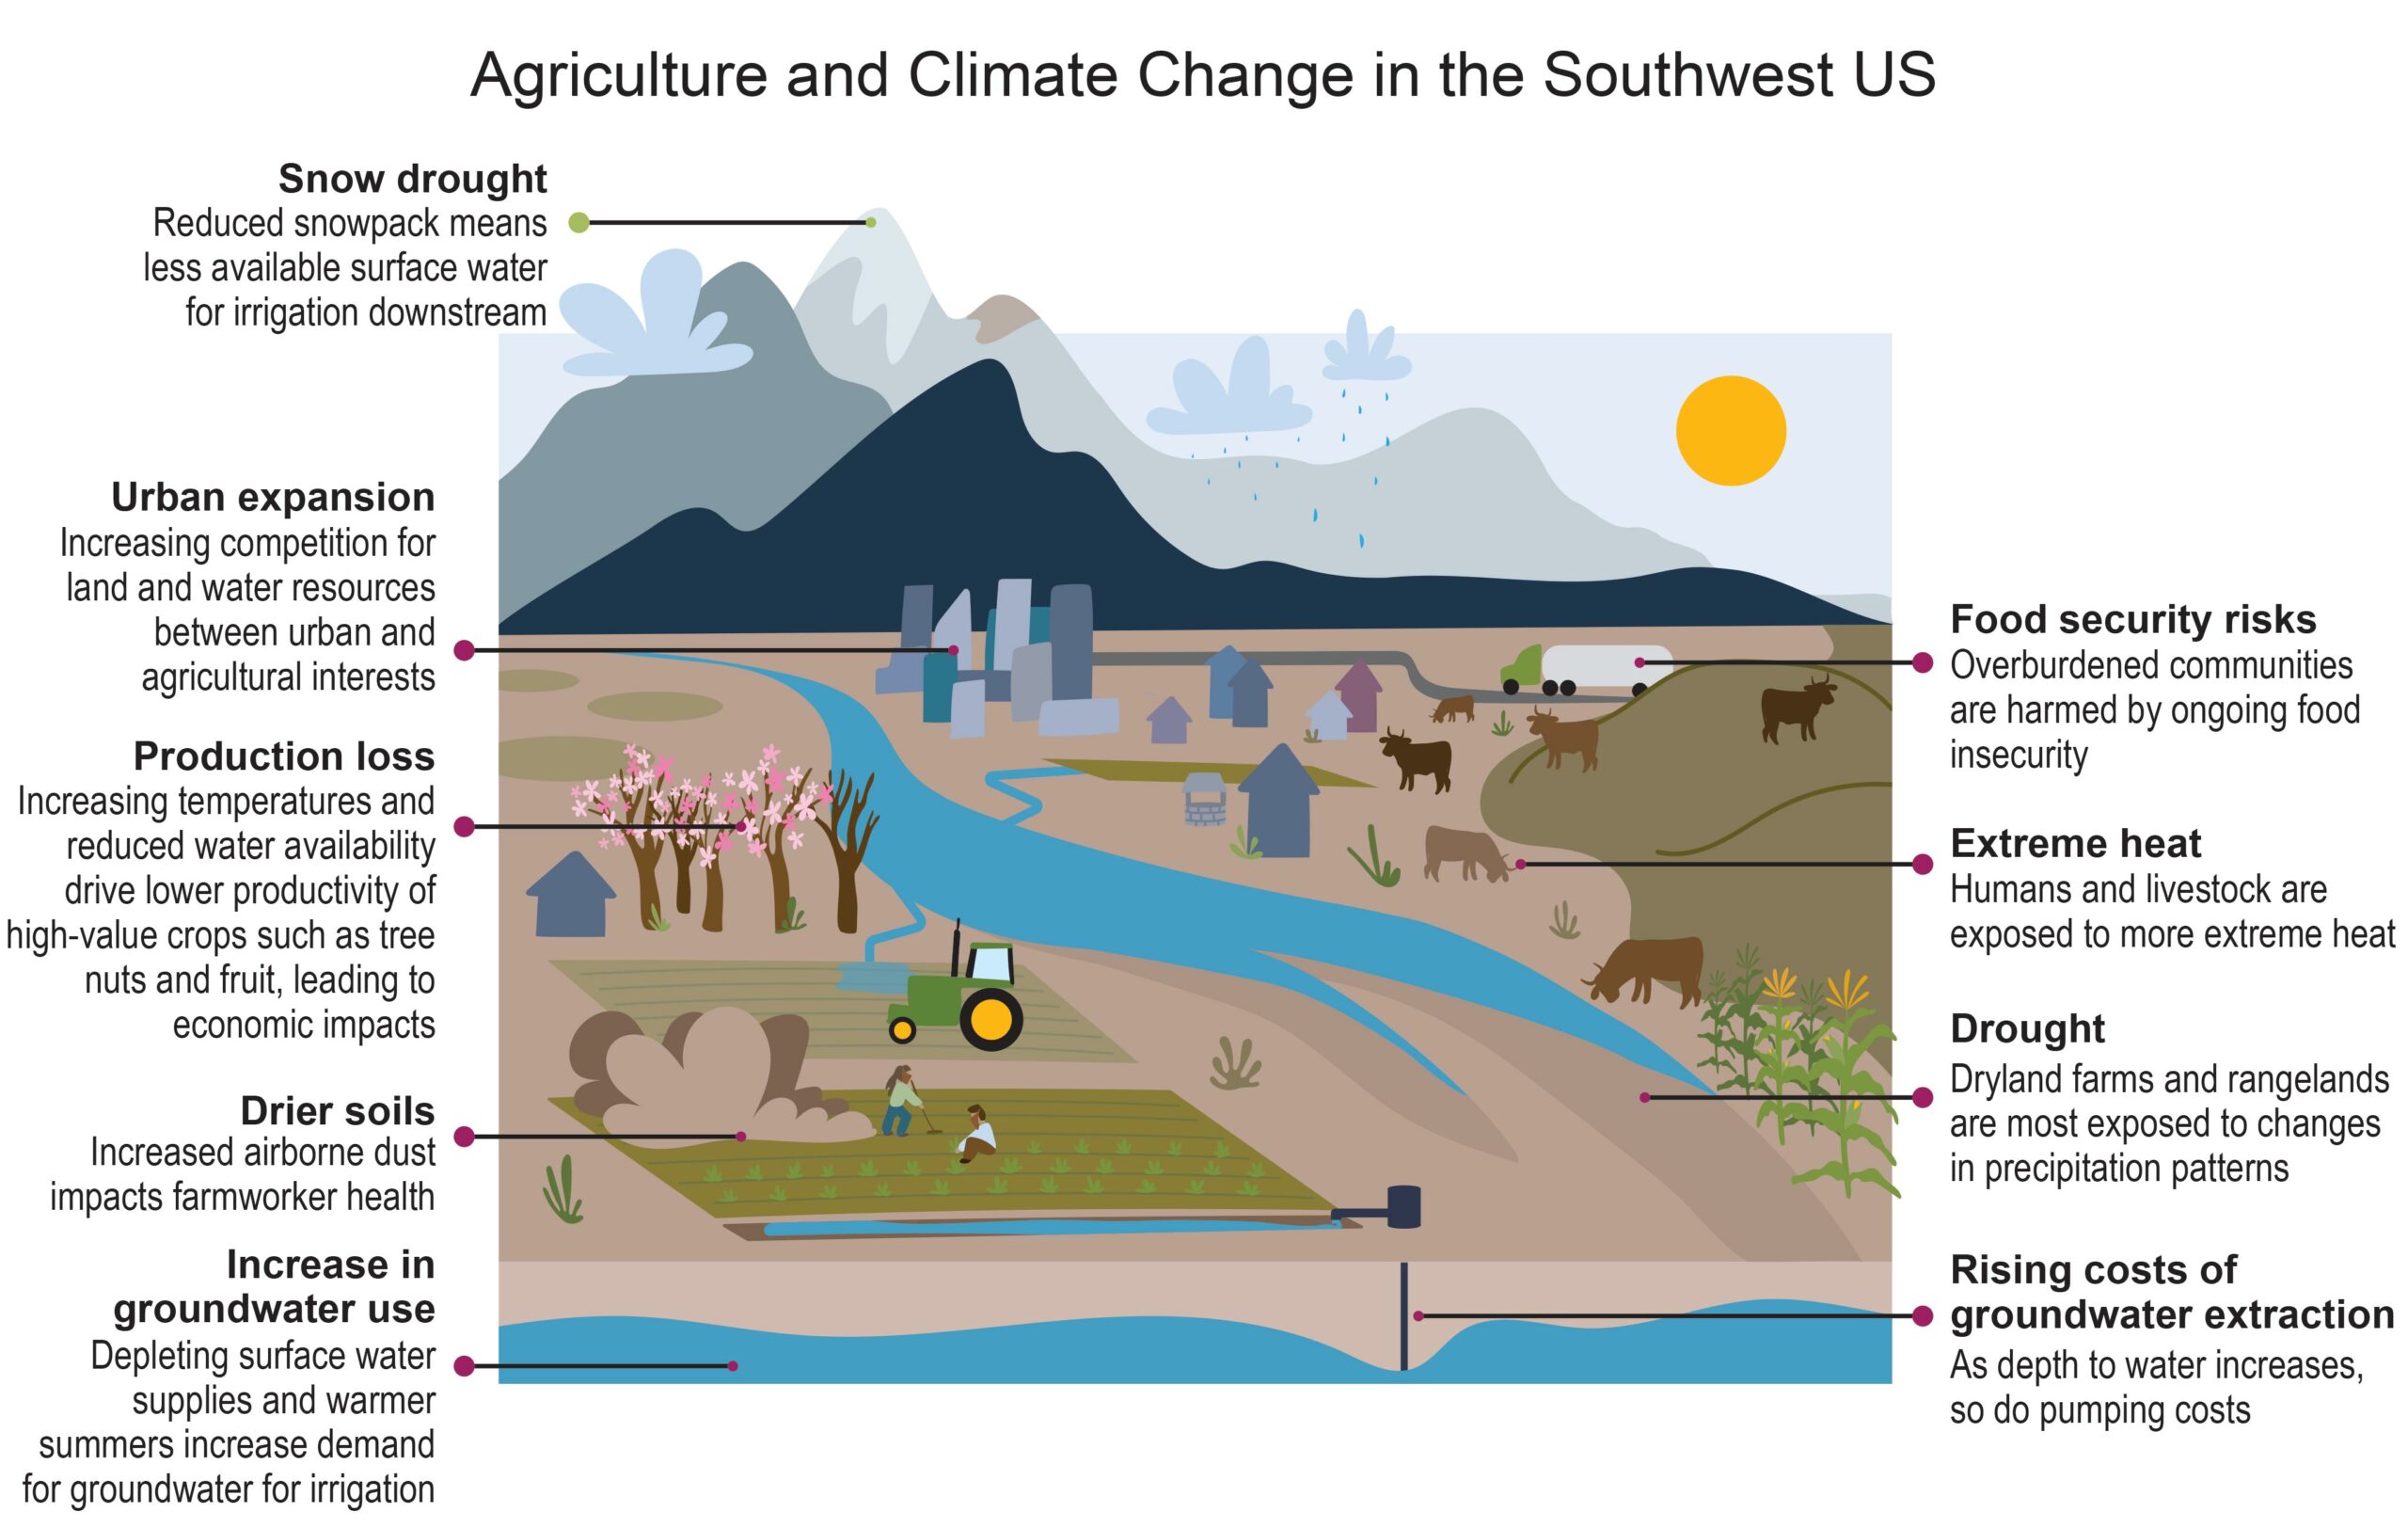
The infographic below illustrates some of the downstream effects on agriculture, with snow droughts contributing to the stresses facing the sector and its workers. Reduced snowmelt for irrigation may cause farmers to lose money, generate more dust that harms both farmworkers and the snowpack, and lead to increasing use of dwindling underground aquifers as agriculture shifts from surface water to groundwater.
While the graphic above focuses on agriculture, climate change will also affect the water supply for cities, suburbs and businesses, plus the innumerable species that have evolved to depend on the snowpack and snowmelt.
Farmers who rely on direct flows from the river may have very senior water rights, but often they lack reservoirs to store the water, so as climate change shifts precipitation from snow to rain and starts the runoff season earlier, these water users—plus fish and other wildlife—face a growing risk of shortages later in the year.
“For communities that have storage rights, they’re less sensitive to the loss of snowpack if you still are getting precipitation in some form or another,” Payton said. “There are a lot of people and communities in the West who are just living on the edge, and they don’t have the storage, they don’t have the infrastructure to take advantage of when it’s there and are very much dependent on the regime that they’ve been used to.”
NCA5 highlights that “community-based snow-fed irrigation systems in high-elevation watersheds of New Mexico and Colorado, known as acequias, are particularly exposed to the shortfalls in annual snowpack.”
While building more reservoir storage is a potential solution, that strategy has three problems, Harding said. “One is people don’t like reservoirs, except for the people that are going to benefit and use the water. Two is they’re really expensive. And three is we’ve used up most of the really good reservoir sites, so that seems unlikely,” he said.
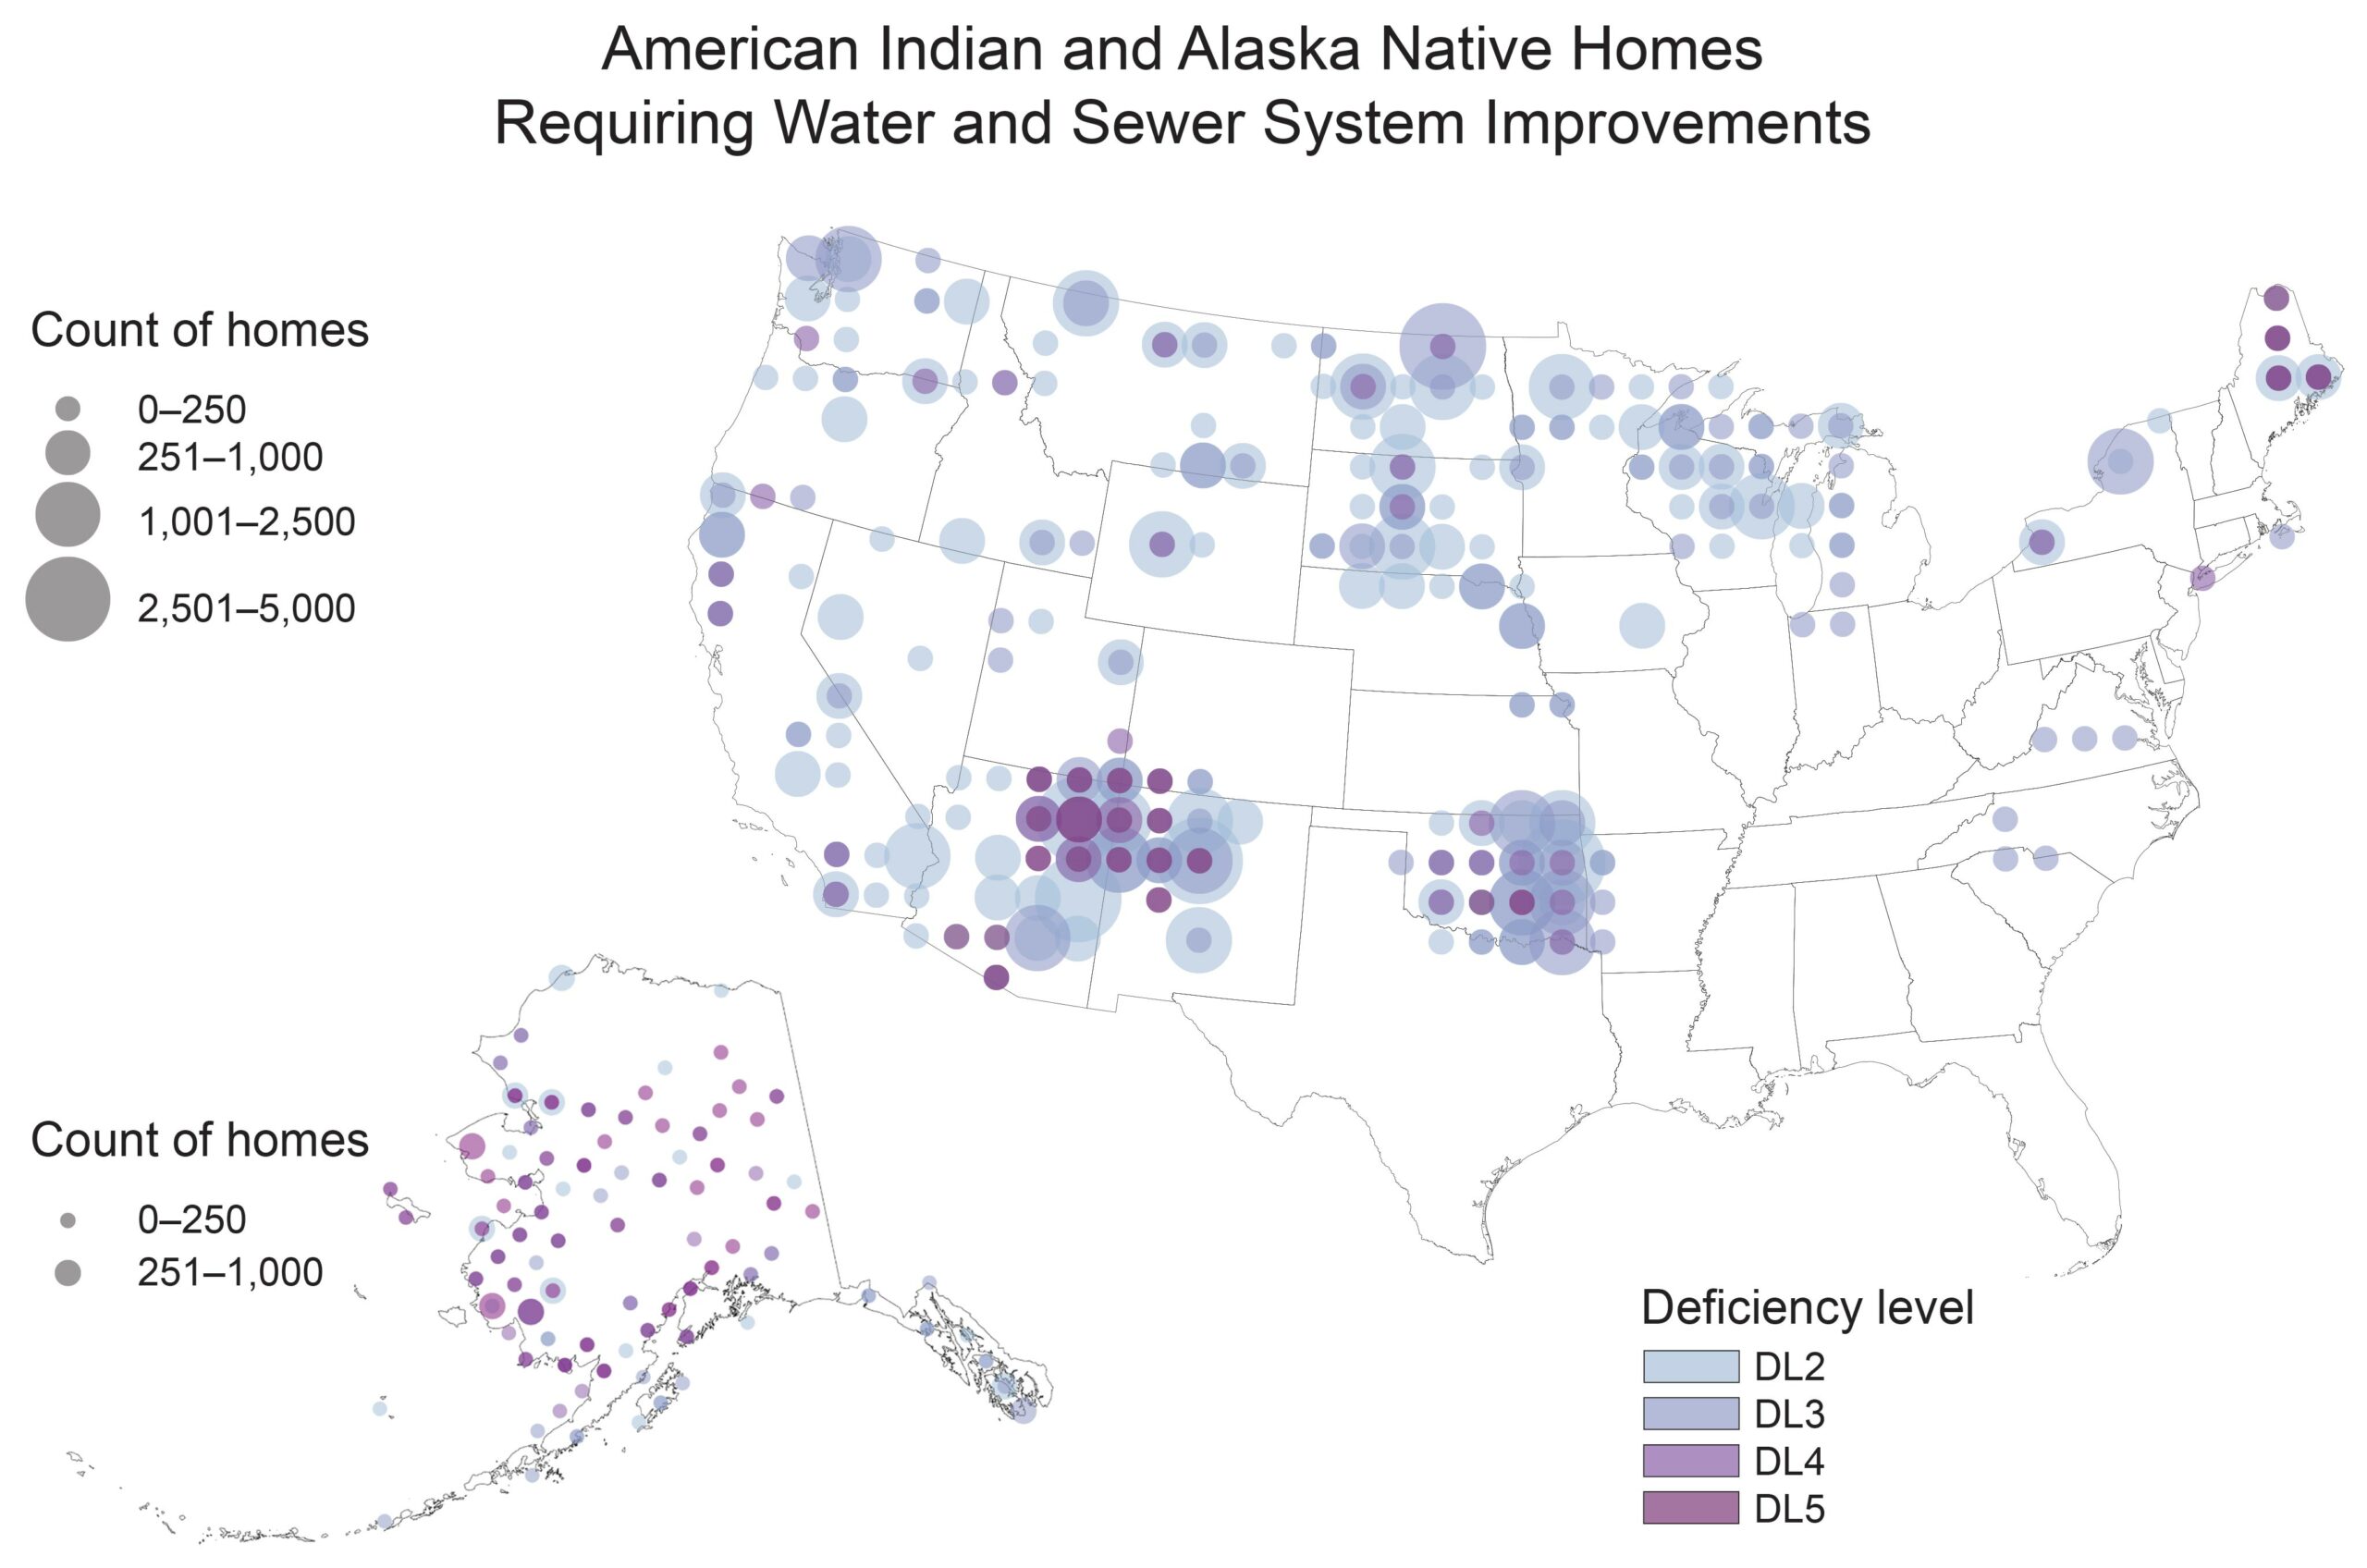
Even without the influence of climate change, many Indigenous communities in the West confront major hurdles in securing safe and adequate water supplies (see this 2021 paper for more on incomplete plumbing and poor water quality in U.S. homes).
The map below shows that many American Indian and Alaska Native homes already face serious problems with their water and sewer systems. At deficiency level 2, a water and sanitation system is in place but it needs upgrades or maintenance, while at level 5, the worst category, “there’s absolutely no water supply, no sanitation system in at all,” said co-author Heather Tanana, a visiting professor of law at the University of California-Irvine, in a webinar.
“As we’re experiencing increased changes in the water cycle, the water quality and quantity impacts are further being exacerbated in part because of aging infrastructure,” Tanana said. “So who is being the most affected? Again, it’s our under-resourced frontline communities.”
There are two types of snow drought to worry about: dry and warm
The report highlights two kinds of “snow drought” that can afflict the West (this page offers updates on the current status of snow droughts). In a “dry” snow drought, a lack of precipitation diminishes the snowpack. That’s what happened in California’s Sierra Nevada in the 2014/2015 winter, “resulting in the shallowest snow volume ever recorded there,” according to NCA5.
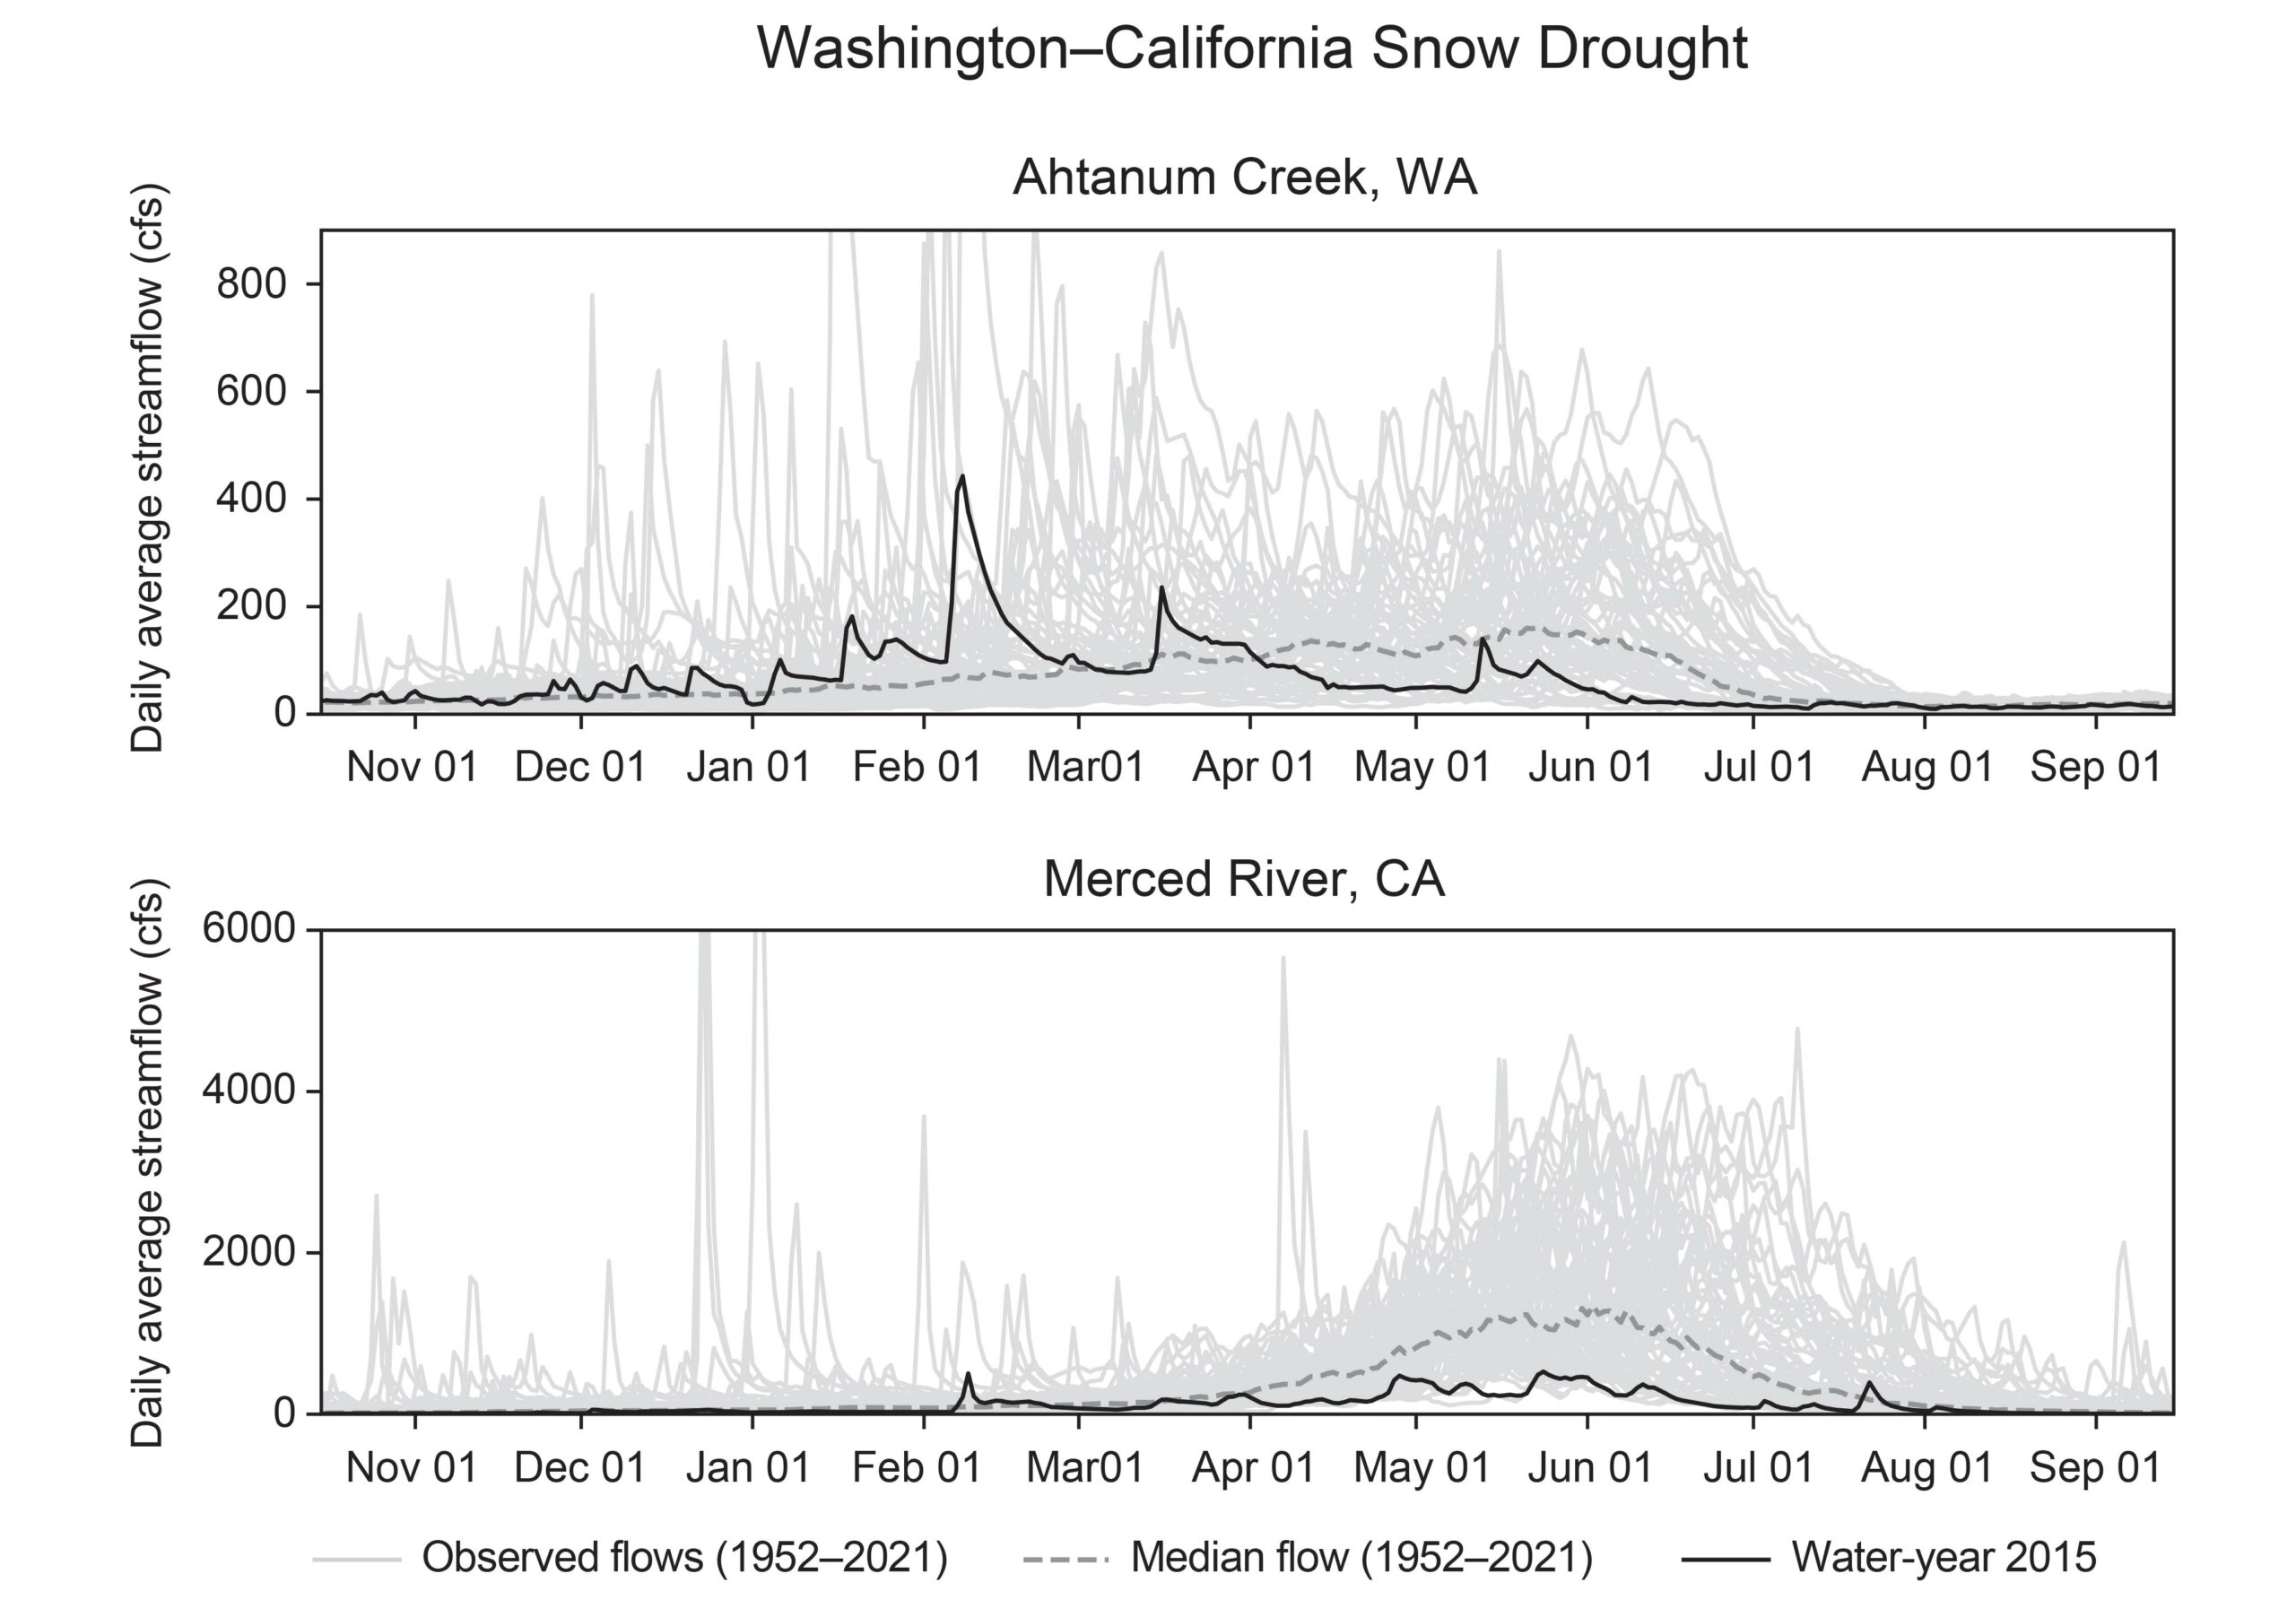
That same winter, but farther north in Oregon and Washington, there was another snow drought, but this one was a “warm” one. Winter precipitation was 77% to 113% of normal, yet because of higher temperatures, the precipitation shifted from snow to rain, leading to a reduction in the snowpack and higher winter snowmelt, but below-normal flows from April to August.
The graphic below illustrates the streamflow for two locations: Washington’s Ahtanum Creek and California’s Merced River. In each chart, the black line indicates flows during the 2015 water year (which began October 1, 2014), the gray lines show data from 1952 to 2021 and the dashed line plots the median for that period. The top chart shows that runoff spiked in February and again in March but was then mostly below average during the subsequent warmer months. By contrast, the Merced River’s flow was below normal for nearly the entire runoff season.
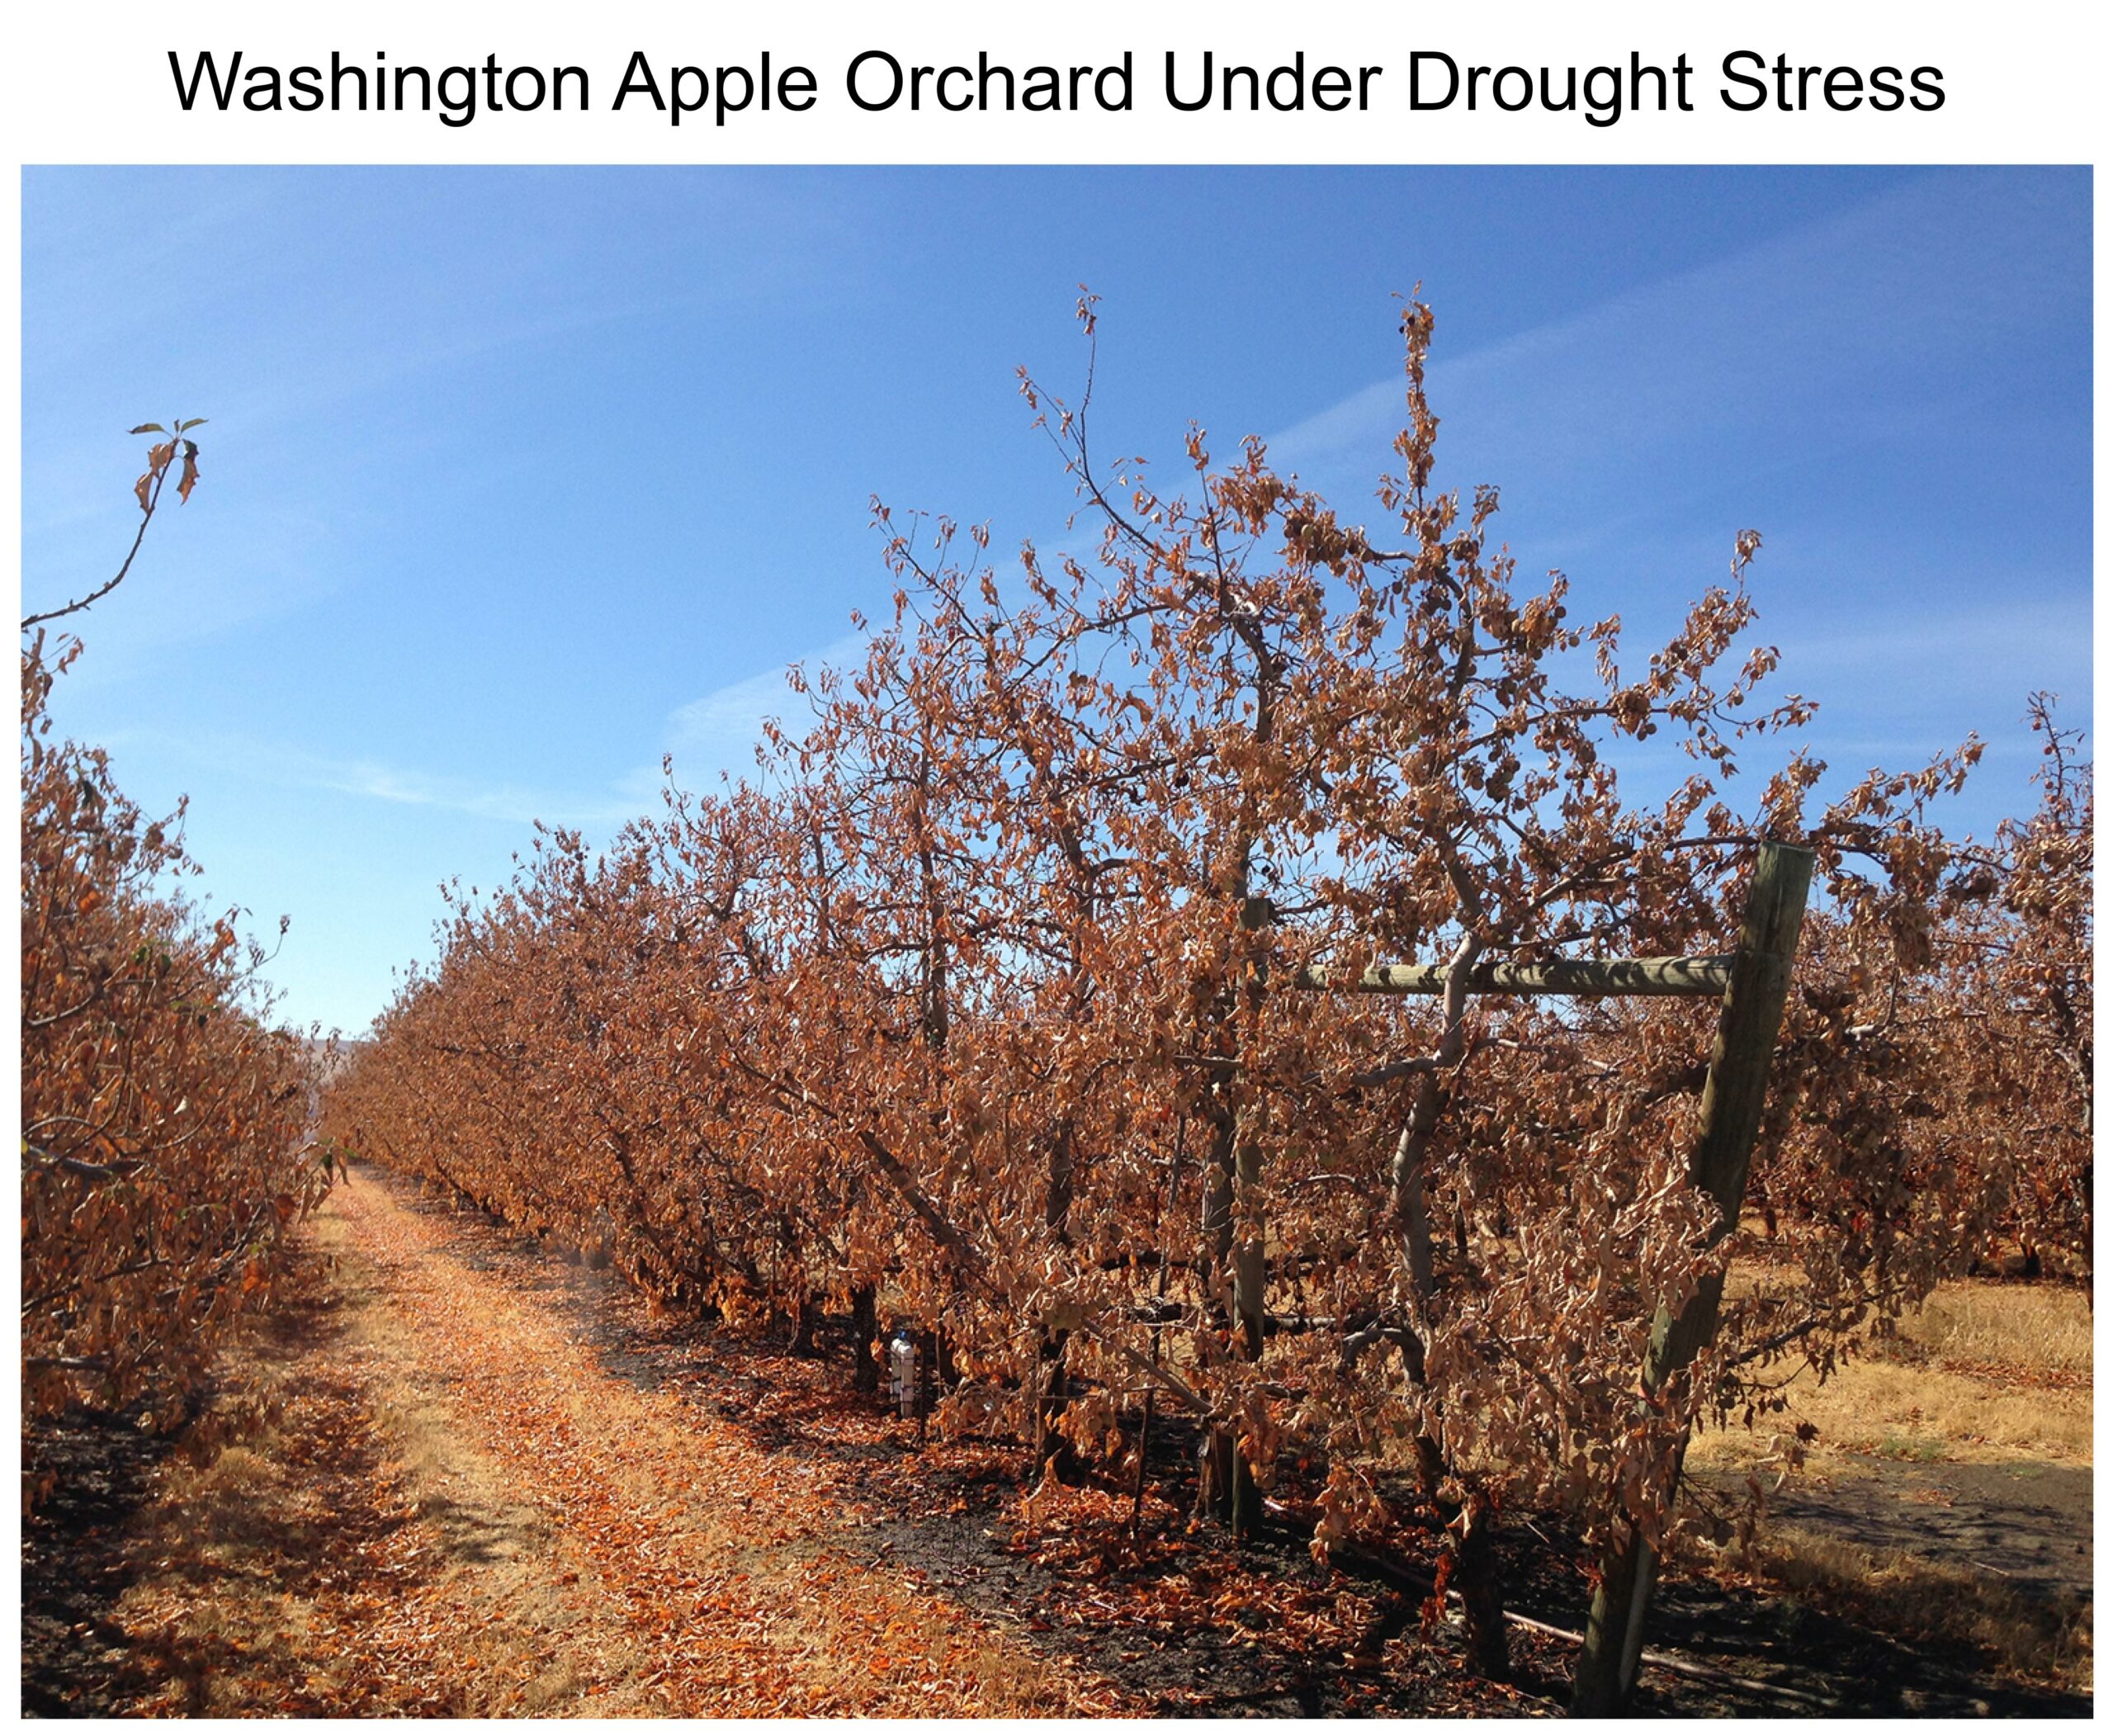
“In Oregon and Washington, irrigated crops—including valuable orchard crops—that depend on direct streamflow diversion water rights failed, but municipal water supplies that relied on storage rights that allow reservoirs to capture winter runoff were sufficient,” according to NCA5. “In California, total water supply was limited, resulting in severe or complete cutbacks to junior water rights and contract holders.”
The September 2015 photo below from NCA5 shows an apple orchard in the Roza Irrigation District, near Yakima, Washington, suffering the effects of the warm snow drought and reduced irrigation.
Warming will make the landscape “thirstier” in many locations
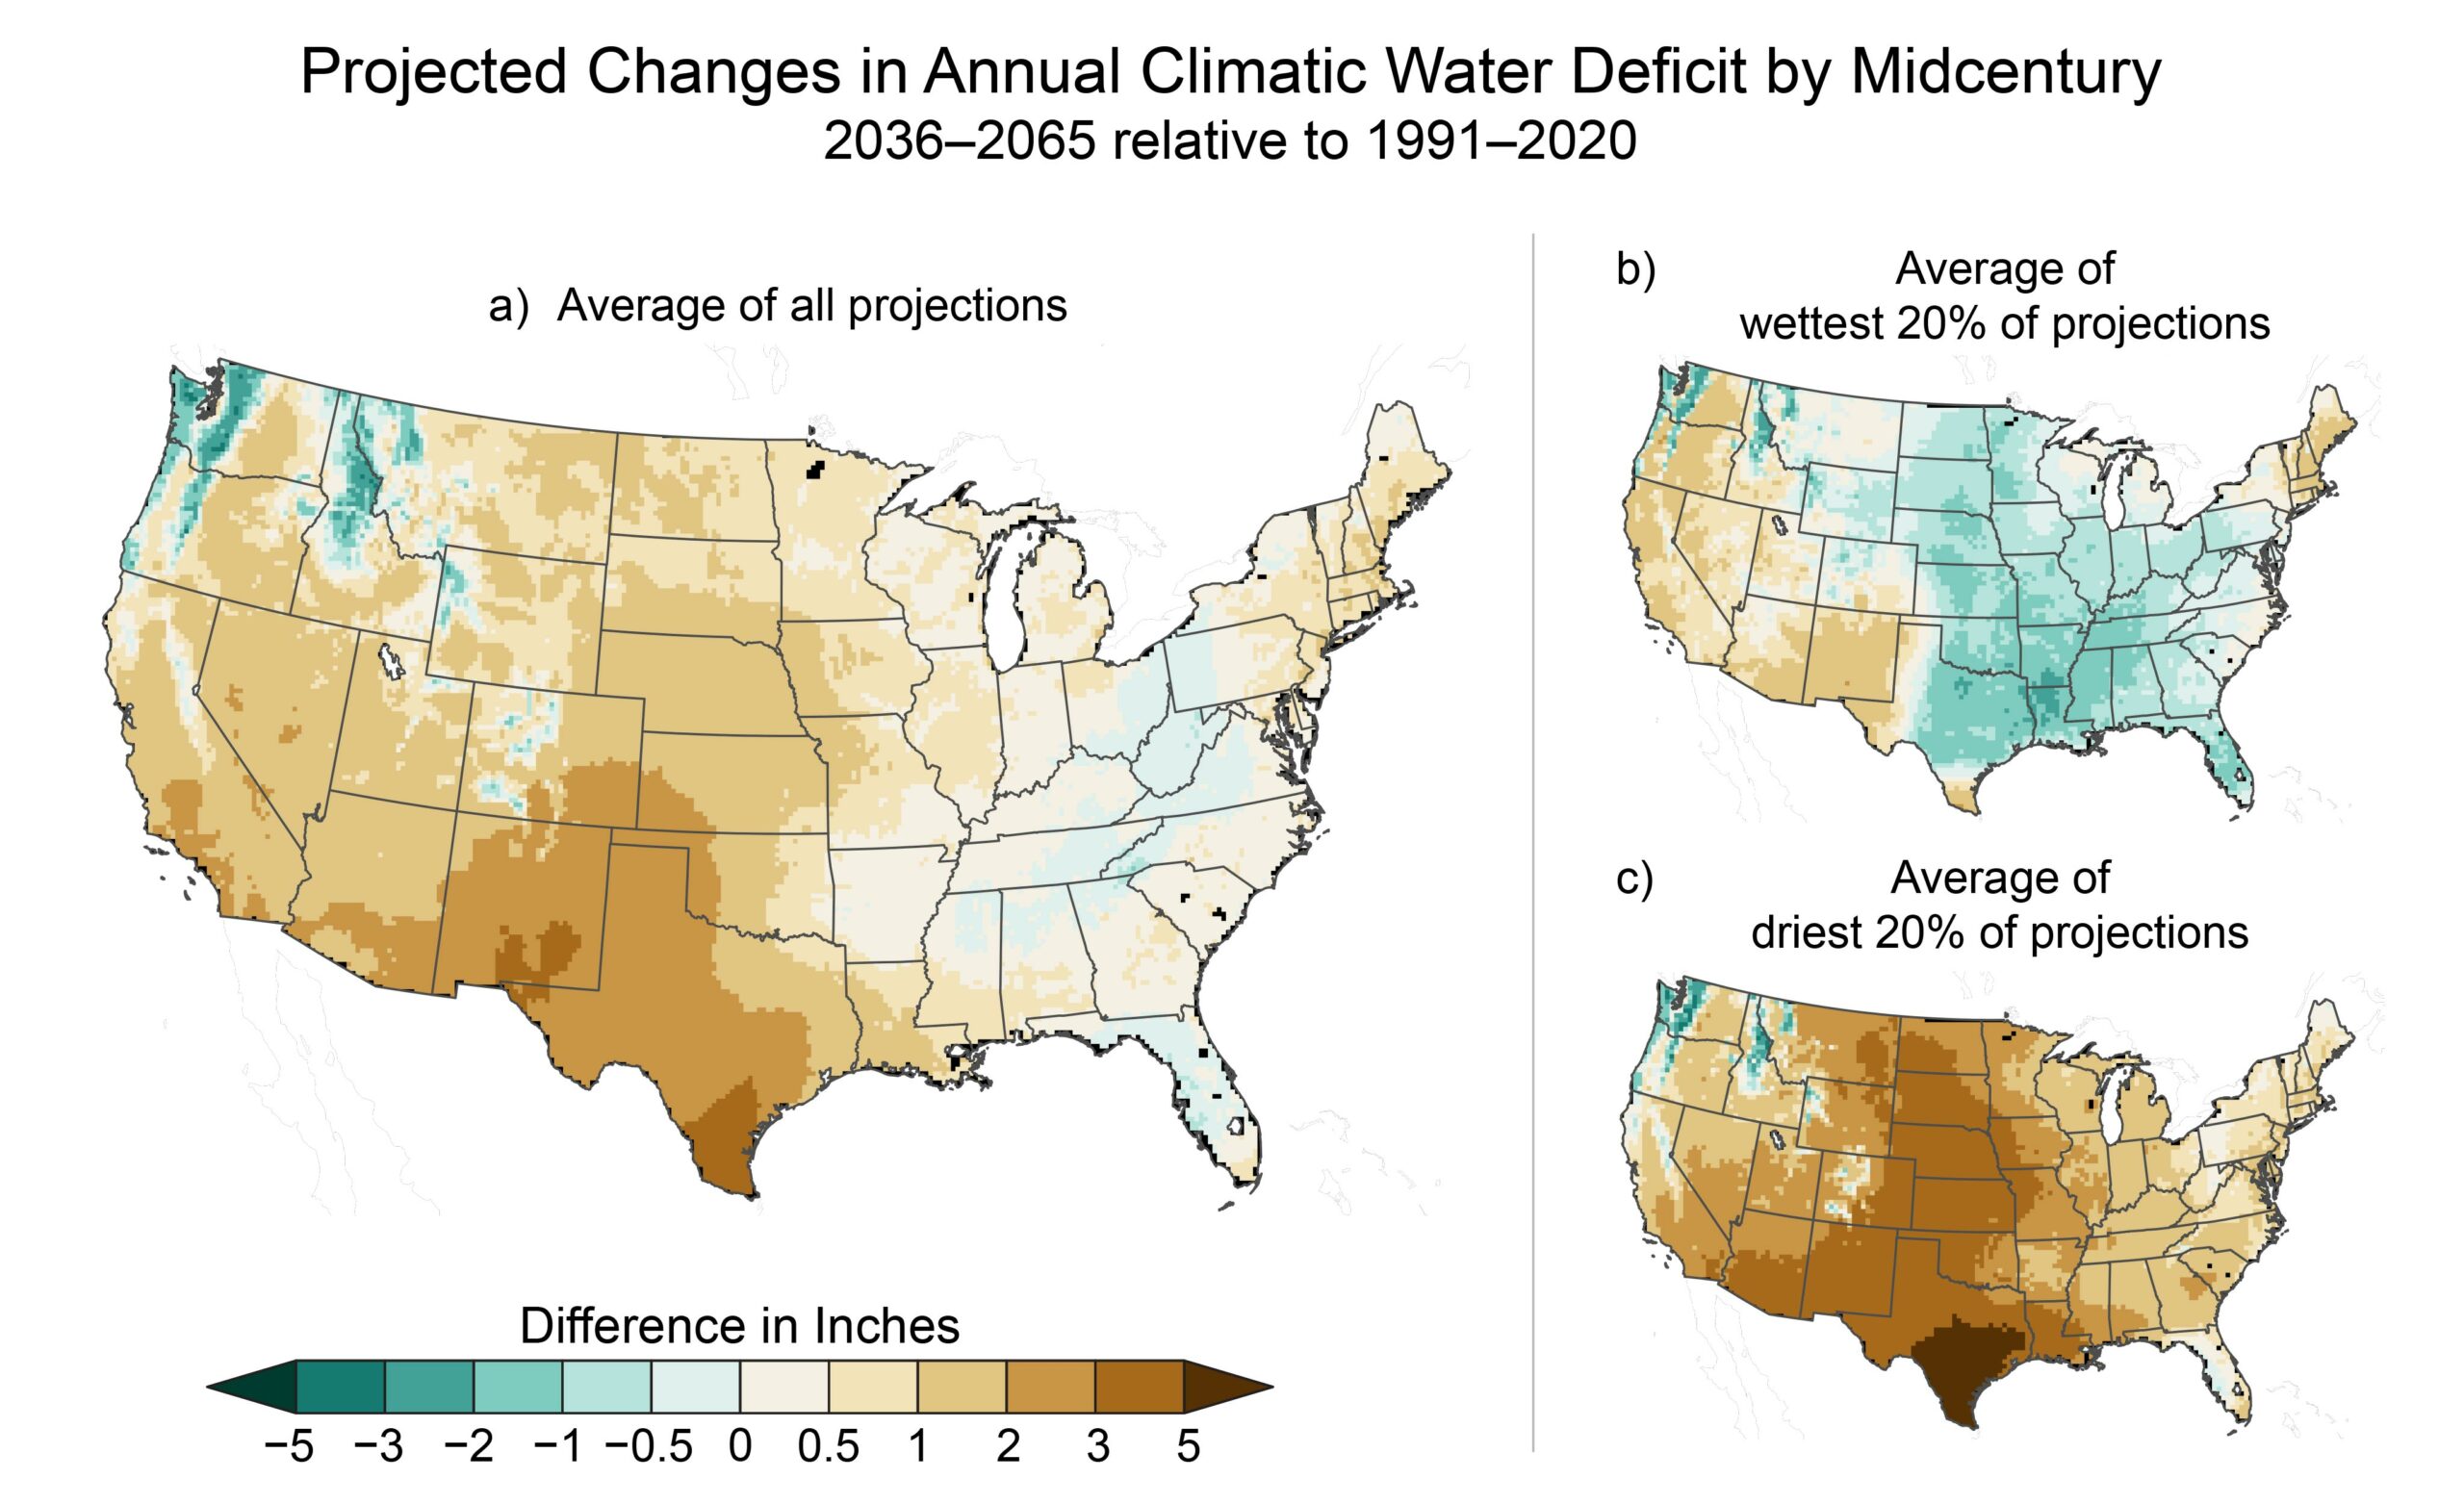
NCA5’s water chapter discusses a measure known as the “annual climatic water deficit.” In simple language, this metric describes the thirstiness of the landscape.
“This is a measure that I advocated for because I think it integrates the effects of everything,” said Harding, who defined the deficit as “how much water we’d have to add to the system to fully satisfy the needs of the plants.”
As shown in the maps below, the climatic water deficit is expected to increase by midcentury across much of the nation—and especially in the Southwest. Map “a” shows the average of the projections, while maps “b” and “c” report the average of the wettest and driest 20% of projections.
The region’s increasing dryness threatens to reinforce snow loss by increasing the amount of dust that lands on the snowpack, thereby accelerating its melting. As a result, NCA5 cautions that “under increasing aridity, agricultural practices such as fallowing and grazing on rangelands will need careful management to avoid increased wind erosion and dust production from exposed soils.”
Adding insult to injury, NCA5 warns that those soils will be more susceptible to blowing around because hotter summers will “degrade protective desert soil crusts formed by communities of algae, bacteria, lichens, fungi, or mosses.”
The Water Desk’s mission is to increase the volume, depth and power of journalism connected to Western water issues. We’re an editorially independent initiative of the Center for Environmental Journalism at the University of Colorado Boulder.
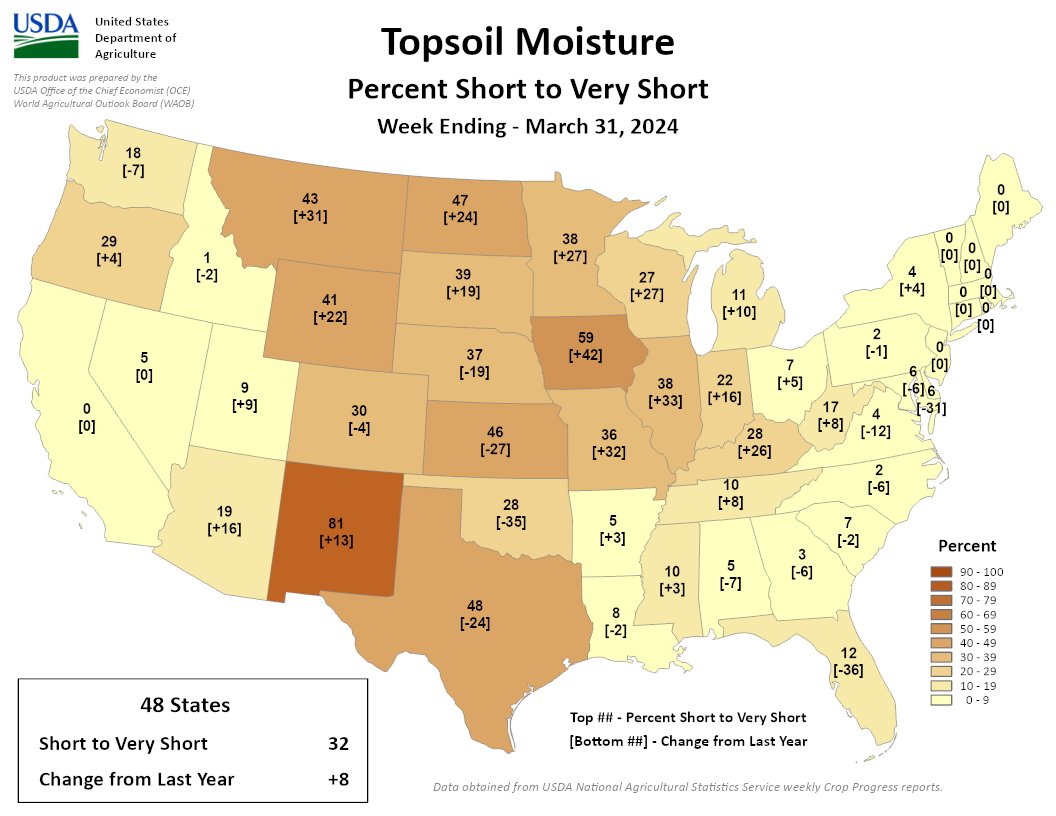
32% of the Lower 48 is short/very short; 8% more than last year at this time. Dry soils are most prevalent in NM and the North Central. The Southern Plains too, although in better shape than last year.
Drought-challenged U.S. communities are overlooking what could be a major source of relief: stormwater, which generates more water annually than is stored in lakes Mead and Powell, the largest reservoirs in the West.
But Colorado and other states with laws against collecting stormwater are likely to miss out on its potential.
Lakes Powell and Mead store some 49.4 million acre-feet, according to the U.S. Bureau of Reclamation.
That 59.5 million acre-feet of stormwater is roughly 93% of the water used by all U.S. cities and industry in 2015, according to the Pacific Institute. An acre-foot serves about two to three U.S. households for a year.
But because this source has never been fully analyzed or developed, it is not yet widely used.
“Our results indicate that there is a vast potential for stormwater capture all across the country,” said Bruk Berhanu, a lead author of the study and senior researcher in water efficiency and reuse at the Pacific Institute.
With climate change and warming, streamflows are projected to decline in Colorado and elsewhere in the coming years, and there is increasing pressure to find new sources and better use existing water supplies.
“As communities in the West face increasing strain on their water supplies, planners have been looking at strategies that use an ‘all of the above’ approach,” Berhanu said. “We aren’t suggesting stormwater could cover all of our future water supplies, but they can help fill the gap between our current water supplies and projected demands.”
Estimated annual urban stormwater runoff by state
Source: Pacific Institute, “Untapped Potential: An Assessment of Urban Stormwater Runoff Potential in the United States”
But use of stormwater comes with conditions. It would require major new facilities to capture, store and treat it if it is to be used for drinking water. If too much is captured, it could reduce water available for the environment, according to the report.
And in some places, such as Colorado, the practice isn’t allowed.
Under what’s known as the Prior Appropriation Doctrine, water users with the oldest, or most senior water rights, get their water first, even if their diversion point lies farther downstream than someone else’s. And stormwater, once it reaches the stream, becomes part of someone’s water right. If larger amounts were captured, it could jeopardize other water rights already in place.
The City of Aurora, and others, have actively worked for decades to find new ways to make their water supplies stretch further, but stormwater capture is not one of them.
“What works in some states, does not work in Colorado,” said Greg Baker, a spokesman for Aurora Water, referring to the legal prohibitions against the practice.
Could that change? Possibly.
Colorado has taken major strides in recent years to re-examine how water that falls from the sky may be collected and used in ways that don’t harm neighbors downstream. In 2009, for instance, the state passed a law that opened the door to rainwater harvesting in some rural areas and then in 2016 allowed homeowners across the state to use rain barrels to capture small amounts of water for use on gardens and lawns.
That state also created a pilot program to encourage more research. The Dominion Water and Sanitation District in Douglas County, to date, has been the only water district to participate in the pilot, according to Andrea Cole, Dominion’s general manager. Soon it may be able to legally capture rainwater when, later this year, it will ask a state water court to approve collecting rainwater commercially to serve parks and other public spaces in Sterling Ranch, one of the most water-efficient residential developments in the state.
To get to this point, Dominion spent 15 years tracking how much rain fell on the development before anything was built, and tracking how much more water was generated after new homes and roads were built and the water began falling on roofs and other solid surfaces, instead of the soil.
“In Colorado, water is precious, so every last drop is accounted for in somebody’s system. … But when you change the land from an open prairie to a development, the water no longer [sinks] into the soil, or makes its way to nearby streams,” Cole said.
Measuring the water has and will continue to be a meticulous process, she said.
“We can only capture that water [that falls on] Sterling Ranch. … If it is outside the ranch, we have to allow it to go back to the stream,” Cole said.
Sterling Ranch sharply limits outdoor water use, so lawns are scarce. The plan is to use the rainwater for parks and gardens so that homeowners with little of their own grass have a place to play and relax, Cole said.
The Pacific Institute’s Berhanu said he is hopeful that the new report will generate more interest in developing stormwater to help fill looming gaps in water supplies.
“In a state like Colorado, we would hope that this information builds the case for revisiting those policies and making adjustments to enable more stormwater capture,” Berhanu said.
The potential is there, Cole said.
“We are the first out of the chute, and being the first is always scary. But people are watching to see what we can get through water court,” she said. “Once there is a [legal] water right for it, we are going to see new developments trying to use this.”
More by Jerd SmithJerd Smith is editor of Fresh Water News. She can be reached at 720-398-6474, via email at jerd@wateredco.org or @jerd_smith.
Excavation and foundation preparation at Gross Dam wrapped up in April. The far side of the photo shows the new footprint of the dam. Photo credit: Denver Water.
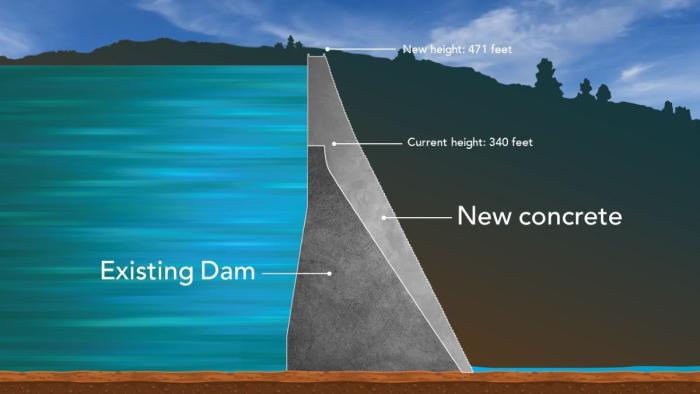
“Over the past two years we’ve excavated 260,000 cubic yards of rock and placed 27,000 cubic yards of concrete to get the existing dam and the rock around it ready for expansion,” said Doug Raitt, Denver Water’s construction project manager for the Gross Reservoir Expansion Project.
The next phase of the multiyear project begins in May, when crews will begin the process of building 118 new concrete “steps” that will create the higher dam. Construction on the expansion project began in April 2022 and is scheduled to wrap up in 2027.
Roller-compacted concrete will be placed on top of the existing dam to raise it to a new height of 471 feet. A total of 118 new steps will make up the new dam. Image credit: Denver Water.
The steps will be made of roller-compacted concrete and around 800,000 cubic yards of concrete will be needed to build them.
So, to prepare for raising the dam, a team from Kiewit Barnard is building a sophisticated concrete batch plant near the top of the dam. At the plant, cement, fly ash, sand and aggregates will be mixed together to make the specific type of concrete mixture used to build the steps.
The batch plant will produce roller-compacted concrete on-site using rock quarried from around Gross Reservoir. Photo credit: Denver Water.
“Producing the roller-compacted concrete on-site really makes for an efficient process so we don’t have to haul it in from off-site,” Raitt said. “We’re also crushing rock that we quarried on-site as well.”
Learn more about the Gross Reservoir Expansion Project at grossreservoir.org.
Crews are also building an elaborate conveyor system that will carry the concrete from the batch plant to the dam.
Workers are building a conveyor system that will move concrete from the batch plant to the dam. Photo credit: Denver Water.
Once conveyed over the top of the dam, the concrete will slide to the bottom via a chute system, which also will be built this spring.
At the bottom of the dam, workers are creating a flat surface that will be the base for the new roller-compacted concrete steps.
Workers are building the base of the dam that will serve as a platform for the roller-compacted concrete steps. Photo credit: Denver Water.
“It’s an exciting time as we get ready for the actual dam raise phase of the project,” Raitt said. “Once the roller-compacted concrete process begins, it will take about three years to complete the expansion.”
Colorado transmountain diversions via the State Engineer’s office
Statewide snowpack on Tuesday [April 2, 2024] stood at 109% of median, according to the Natural Resources Conservation Service.
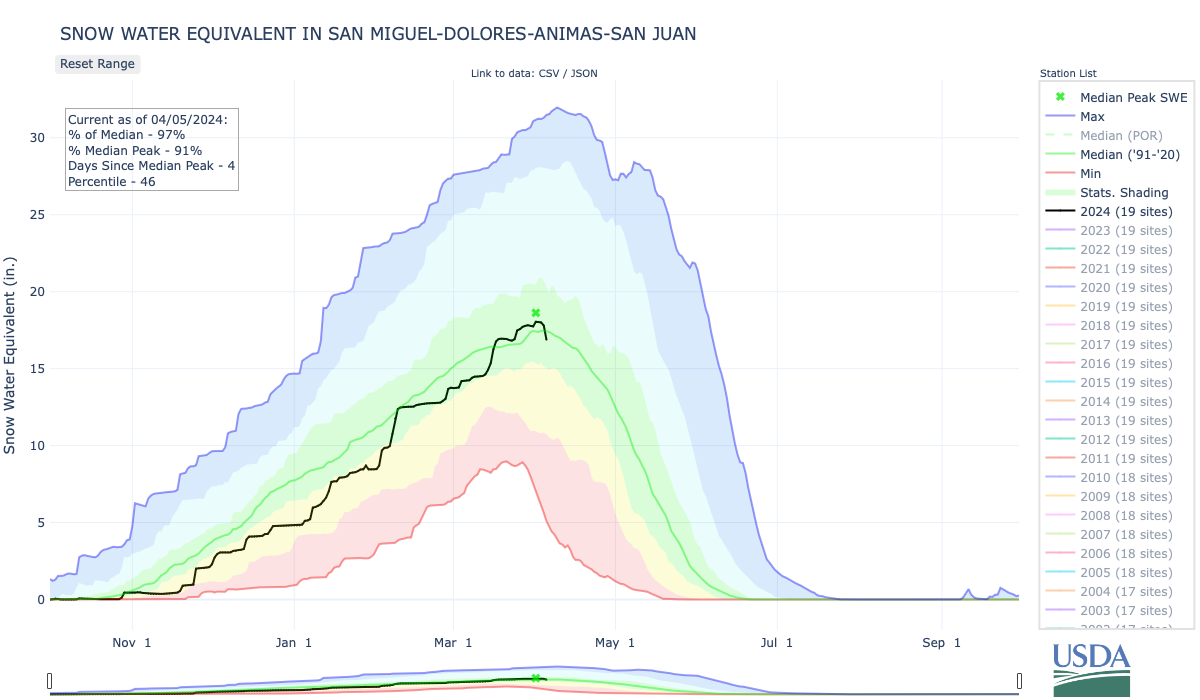
Snowpack, which is a measurement of the water equivalent of the snow, ranged Tuesday from 104% in the combined San Miguel/Dolores/Animas/San Juan river basins in southwest Colorado…
to 121% in the Arkansas River Basin.
The Colorado River Basin headwaters stood at 108% of normal,…
…and the Gunnison River Basin, 105%. Snowpack accumulation in southern Colorado basins typically peak around the start of April, and more northern basins usually peak days or weeks later. NRCS data shows snowpack at 85% of median at one site on Grand Mesa and 96% at two other sites there. Dave Kanzer, director of science and interstate matters for the Western Slope’s Colorado River District, said this year’s snowpack is spotty and highly variable…
Credit: Colorado Basin River Forecast Center
However, the Colorado Basin River Forecast Center’s latest forecast is projecting April-July flows into Lake Powell this year to be 85% of normal. That’s at a time when low water levels in Powell and downstream in Lake Mead due to long-term drought and heavy use of water are of dire concern to southwestern states, water users and the federal government.
In my last post, I reported that the water mavens of both the Upper and Lower Colorado River Basins had each presented the Bureau of Reclamation with plans for managing the river after 2026, when the current, amended ‘Interim Guidelines’ expire.
The Interim Guidelines had been implemented in 2007, remember, when it was obvious that the patchwork of existing ‘Law of the River’ (LOTR) guidelines, laws, treaties, compacts and other measures propping up the Colorado River Compact were failing to constructively guide the extensive storage and distribution systems imposed on the river through the turn-of-the-century drought that had begun six years earlier.
“New plot using the nClimGrid data, which is a better source than PRISM for long-term trends. Of course, the combined reservoir contents increase from last year, but the increase is less than 2011 and looks puny compared to the ‘hole’ in the reservoirs. The blue Loess lines subtly change. Last year those lines ended pointing downwards. This year they end flat-ish. 2023 temps were still above the 20th century average, although close. Another interesting aspect is that the 20C Mean and 21C Mean lines on the individual plots really don’t change much. Finally, the 2023 Natural Flows are almost exactly equal to 2019. (17.678 maf vs 17.672 maf). For all the hoopla about how this was record-setting year, the fact is that this year was significantly less than 2011 (20.159 maf) and no different than 2019” — Brad Udall
The Bureau and the seven states have since cobbled together – with help from a big snowpack in the 2023 water year and a rain of cash from the Biden administration’s infrastructure acts – a set of added interim actions to stagger through the remainder of the interim to 2026. The immediate emergency out of the way, the Bureau asked the water leaders of the seven states, and of the 30 First People nations in the river basin that will no longer allow the states to ignore them, to come up with a plan for managing the river works from 2027 through – well, another interim, maybe another 20 years. In a time of climate change and political chaos, we no longer think ‘in perpetuity’ (which never worked out anyway).
So the water leaders gathered for several meetings, to try to come up with a plan for managing the river after 2027. But they were not succeeding, so the predictable happened: they went home to the two Basins established by the 1922 River Compact, and each group prepared an ‘alternative plan’ for the management of the river.
I’ve created a fairly detailed side-by-side comparison of the actions each alternative proposes when triggered by diminishing levels of storage in the reservoirs; it would not, however, be readable in the format of these posts, so you can click here to bring up a readable copy. Meanwhile, here is a summary of some of the main points, similarities and differences between the two alternatives.
Both alternatives are similar conceptually: they operate on a measure of storage in some of the reservoirs on the river, with changes in the total content of the selected reservoirs triggering reductions in consumptive use by one or both Basins. Each alternative, however, uses a different set of reservoirs as the base – and a different date for measuring the content of the reservoirs.
The Lower Basin alternative wants the measuring standard to be the live storage of the major reservoirs in the river’s storage system: the four large Colorado River Storage Project reservoirs in the Upper Basin (Powell, Flaming Gorge, Blue Mesa and Navajo), and the three mainstem Lower Basin reservoirs (Mead, Mojave behind Davis Dam and Havasu behind Parker Dam) – a total of ~58 million acre-feet (maf) when they are full, which they currently are not. And they want the total system content to be measured on August 1 every year, a time when the reservoirs are still relatively full after runoff. (‘Live storage’ is the volume minus the ‘dead pools’ that cannot be delivered past the dams.)
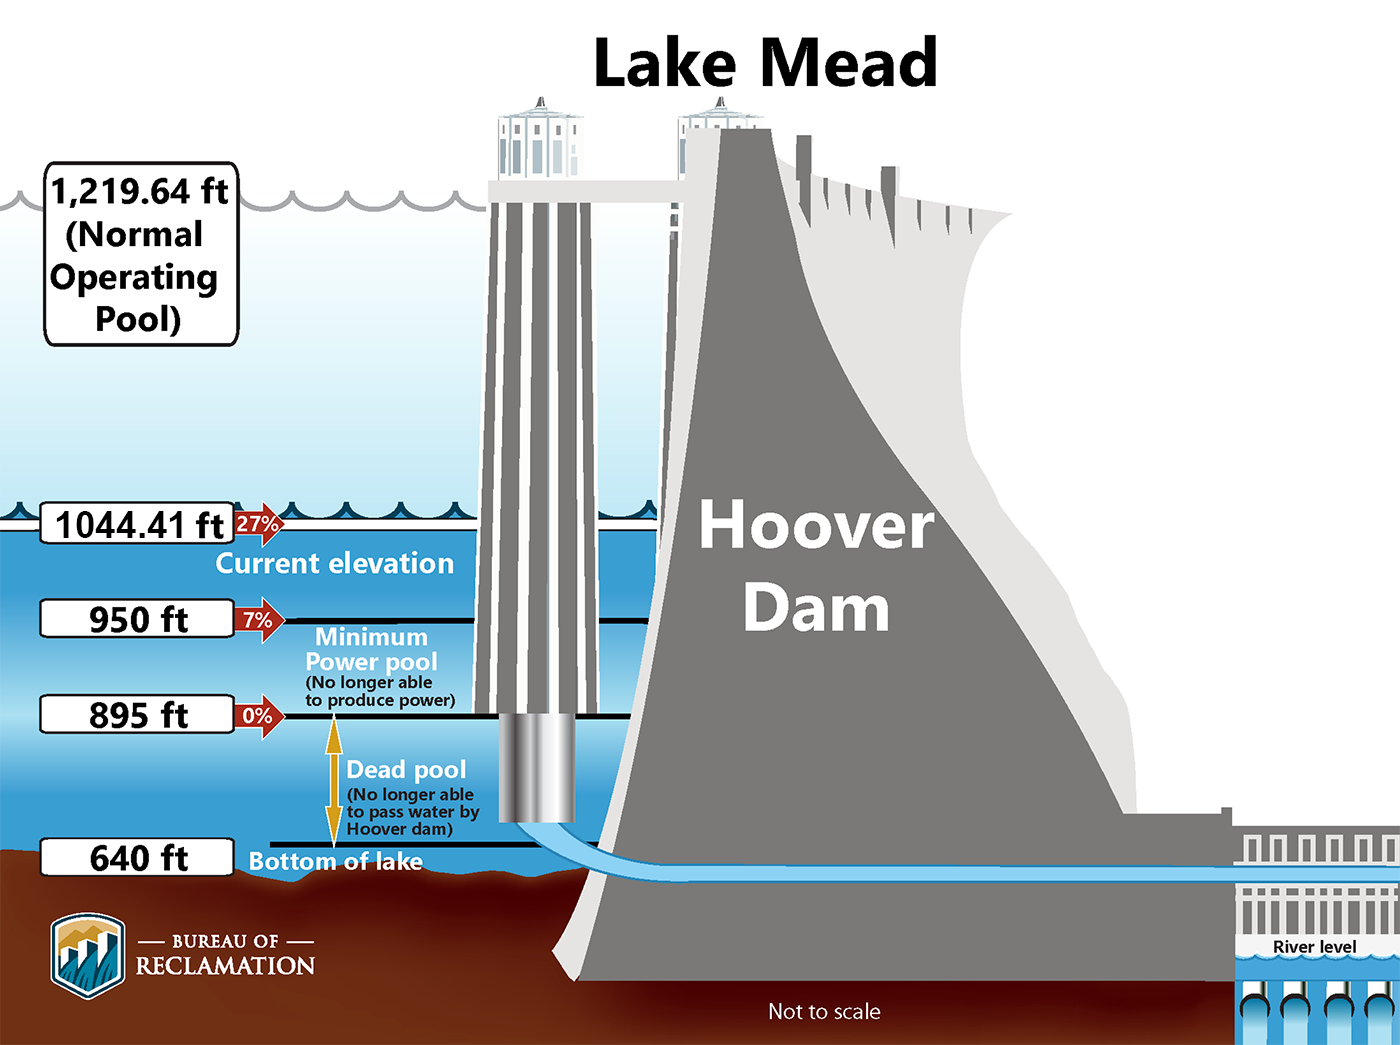
Lake Mead key elevations. Credit: USBR
The Upper Basin alternative wants to measure only the live storage of Mead and Powell Reservoirs, minus an undefined ‘threshold volume’ for each of them – 4.2 and 4.7 maf respectively (probably the quantity required to keep the reservoir levels up to power-generating capacity?). This would probably be in the neighborhood of 40 maf when both reservoirs are full, which they are not. And they want the annual measure to be on October 1, the beginning of the new water year, a time when storage has been somewhat depleted by agricultural use.
The structural deficit refers to the consumption by Lower Basin states of more water than enters Lake Mead each year. The deficit, which includes losses from evaporation, is estimated at 1.2 million acre-feet a year. (Image: Central Arizona Project circa 2019)
Both alternatives are in agreement that reductions in use have to start with the Lower Basin cutting its use by the amount of the ‘structural deficit’ – the system losses through evaporation, riparian transpiration, et cetera, a total of ~1.5 maf. This decrease starts linearly when total storage as measured by the Lower Basin drops to 70 percent of full and ramps up to 1.5 maf when/if storage drops to 58 percent. The Upper Basin alternative has the Lower Basin starting its 1.5 maf reduction when its measure of storage is at 90 percent of full, and ramps up to 1.5 maf at 70 percent. With storage, however it is measured, chronically well down in the 30 percents these days, the Lower Basin could count on leaving 1.5 maf in Mead for the foreseeable future under either alternative.
The big difference between the two alternatives comes when or if storage drops to 38 percent by the Lower Basin’s measure of total system storage, and 20 percent of Powell-Mead storage by the Upper Basin measure. At that point – basically panic time – the Lower Basin wants both Basins to begin to ramp up to an additional 2.7 maf feet of reductions, to a total of 3.9 maf – basically the 4 maf in reductions the Bureau asked for in the panicky days of 2022.
The Upper Basin, however, wants the Lower Basin to do all of the 2.7 maf in reductions, on top of the 1.5 the Lower Basin will still be doing. Their justification: if river storage drops to those levels, then the Upper Basin, much of which has no storage to rely on, will alreadyhave had reductions at least that bad imposed by nature’s ‘hydrologic shortages.’ To make them do additional reductions to send more to the reservoirs would be the equivalent of double taxation.
The Upper Basin Alternative also throws a wild card into the game; it unilaterally grants itself the prerogative to ‘undertake parallel but separate activities that are not a part of this federal action or part of the [UB] Alternative. Parallel activities refer to actions in the Upper Basin that are beyond the scope of the Post-2026 Operations, but may complement those operations.’
The ‘parallel activities’ are briefly described as (but not limited to) activities like retaining the right move waters among the big Colorado River Storage Project reservoirs under pre-existing Records of Decision, and carrying out conservation programs like the Upper Basin’s Pilot System Conservation Program that pioneered the ‘paid reductions’ that are the core of the program to get the river system through 2026 (a pilot program partly paid for by large Lower Basin organizations). It may be too much read into this a kind of ‘declaration of independence’ for the Upper Basin, but it is an independent step toward adaptive management that might make the Lower Basin, accustomed to dependable deliveries from the Upper Basin a little nervous….
September 21, 1923, 9:00 a.m. — Colorado River at Lees Ferry. From right bank on line with Klohr’s house and gage house. Old “Dugway” or inclined gage shows to left of gage house. Gage height 11.05′, discharge 27,000 cfs. Lens 16, time =1/25, camera supported. Photo by G.C. Stevens of the USGS. Source: 1921-1937 Surface Water Records File, Colorado R. @ Lees Ferry, Laguna Niguel Federal Records Center, Accession No. 57-78-0006, Box 2 of 2 , Location No. MB053635.
And there’s one nice thing to see: both alternatives seem to bypass the Colorado River Compact mandate that the Upper Basin ‘will not cause the flow of the river at Lee Ferry to be depleted below’ an annual average of 7.5 maf, come hell or low water, or the big bad Lower Basin will come after your water to make it up. When the live storage drops to the low 20 percents in both alternatives, the releases from Powell drop to 6.0 maf – with no language implying a ‘call’ on the Upper Basin if that amount is unavailable. (Not that any such language ever existed in the Compact.)
Speaking of the Colorado River Compact. Yes, we cannot escape it. It is difficult to look at this situation and not see the Compact at work, and as usual, not in a constructive way.
Forty-seven years ago, in 1977, one of the Colorado River’s droughtier years – an estimated natural flow of 5.8 maf, third lowest since measuring began – I wrote an article about the Colorado River for a magazine that wanted ‘something about the drought.’ Figuring correctly that the drought emergency would be over by the time an article would be published, I wrote a long essay about how the drought was not a problem that year for the Lower Colorado River because of the huge storage it had – but how it could be facing problems in the future if it continued uncontrolled growth. (That article, ‘The Desert Empire,’ is archived on this site.)
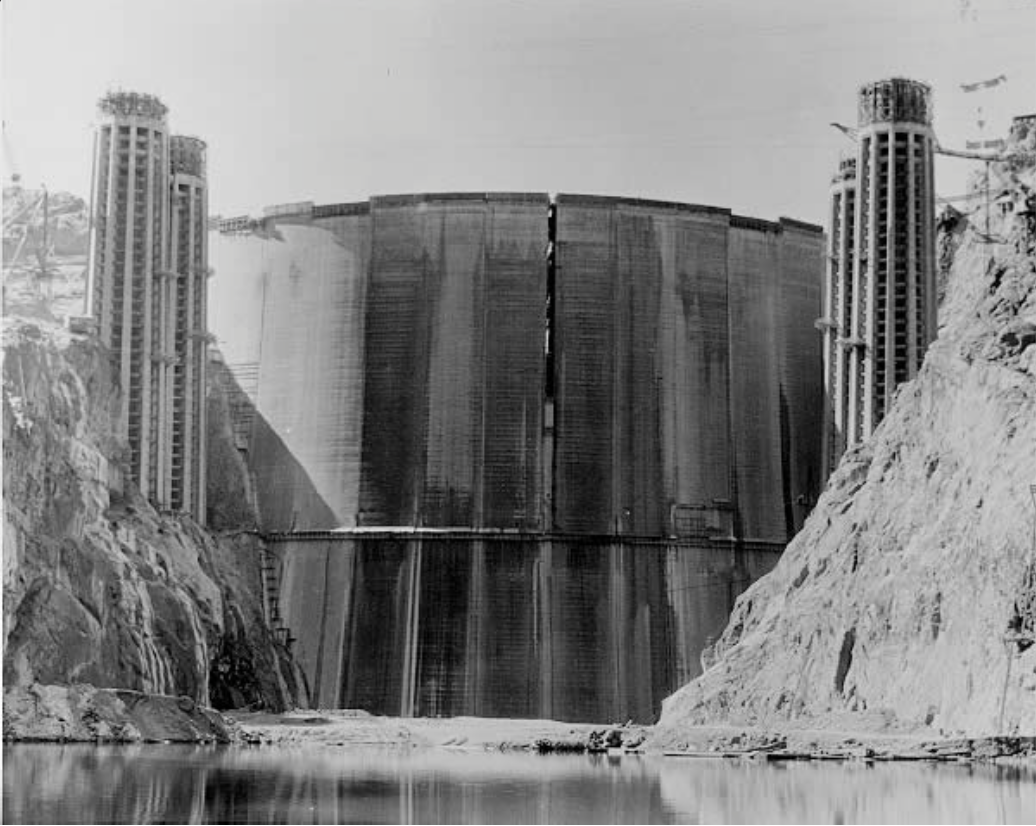
The back of Glen Canyon Dam circa 1964, not long after the reservoir had begun filling up. Here the water level is above dead pool, meaning water can be released via the river outlets, but it is below minimum power pool, so water cannot yet enter the penstocks to generate electricity. Bureau of Reclamation photo.
But one thing I observed then as a possible source of future difficulty was the political division of the river into two basins. It was only a ‘paper division’ in the Compact, but it became concrete, as it were, when Glen Canyon Dam began to fill in 1963, finally finishing filling three years after this observation about its impact in that 1977 essay:
Glen Canyon Dam backs up a body of water … which amounts to nearly the equivalent of what flows down the Colorado River in two years. The amount of water that flows out of the lake reflects not the influx from upriver but demands from downriver.
This being the case, it seems just sentimental to continue to think of the Colorado River as a single entity. For all practical purposes there are now two rivers – interdependent, to be sure, but separate, and under separate management…. To describe the two rivers in the simplest possible manner: the Upper Colorado River is generally patterned after a ‘natural’ river, with many sources and a single destination. The Lower Colorado River, on the other hand, is patterned more after, say, a municipal waterworks, with a single primary source and many destinations. [ed. emphasis mine]
Now, a century after the Compact divided the river into two basins, and almost half a century after that observation about the post-dam river(s) – how can we look at this situation in which the water mavens from the (once) whole river sat down together to try to come up with a plan for managing the system imposed on the river(s), but after only a few days’ effort, withdrew to their ‘Upper and Lower Colorado Rivers’ to work out their River’s separate perspective on the problem? This may be the apotheosis of the Colorado River Compact, the completion of the division into two river basins whose users don’t always seem to remember they are all on the same river. Both alternatives express a willingness by their makers to reassemble as one group, but….
Map of the greater Colorado River Basin which encompasses the Colorado Plateau. Credit: GotBooks.MiraCosta.edu
The natural river itself encourages this kind of separation, with a region of mostly uninhabited (if often visited) canyons constituting close to a fourth of the length of the river, separating two regions of human activity. This kind of a ‘devoid’ in the middle part of a river basin is probably just nature in the middle of some of its endless work. The river probably began as two rivers, running off the Colorado Plateau in opposite directions, that eroded into each other and are still in the contentious process of becoming one river (as soon as they are able to completely eliminate the Colorado Plateau through all their magnificent work-in-progress erosions).
The two areas of human activity above and below the canyons have evolved over the past century and a half in ways consistent with the nature of the river that runs through them. Above the canyons, mountains dropping into piedmont plateaus, carved and deposited by many small streams flowing together into larger streams, all encouraging modest scales of cultural development, by individuals or small communities, a refuge for a time for Jefferson’s and Powell’s ‘agrarian counterrevolution.’
Back of Hoover Dam prior to first fill photo via Reclamation.
But the other river, below the canyons, flowed out of the canyons in a powerful seasonal flood or, later, a comparative trickle, a desert river, an anomaly doing nothing for the desert but moving its silt and sand farther toward the ocean. This was a river just waiting for the Industrial Revolution, the Anthropocene juggernaut of nature transformed to the service of humankind. And that revolution arrived, late in the 19th century, growing so fast in the desert that users in the agrarian states upstream feared the entire river might be appropriated out from under them. The Compact commission resulted, to try to quell those fears enough so the Bureau of Reclamation could build the big mainstem dam that would enable California to grow even faster….
The best the Compact commission could do was the division of the river into the two basins, linked only by the mandate for the Upper River water users to not dry up the Lower River users. This did nothing but formalize that ‘natural’ division created by the canyons – and also some of the problems innate to the cultural division between the industrial revolutionaries and the agrarian counterrevolutionaries (now enjoined with the environmental and recreational groups). The long descent toward breakdown, exacerbated by climate changes we never meant to cause, has culminated in the leaders of the two basins breaking off joint negotiations over the future, and going home to their own two rivers to draft up mandates for each other.
Yet they all appear to be committed to hanging onto the Compact, like a drowning man hangs onto a straw.
Meanwhile, however, the people who were here first in the two river basins, and the canyons too, have cleared their throats, and announced again that they will not be ignored in planning the future of the river. Sixteen of the First People nations have submitted their thoughts on the future of the river to the Commissioner of Reclamation, with a list of considerations they want answers for. We will look at that next post, and maybe muse a little further on how to make one river out of two, or thirty-two. Or should we just go with two or more? Suggested reading: Go to your Trump Bible and read First Kings 3:16-28.
Native America in the Colorado River Basin. Credit: USBR
During recent years I’ve had the great fortune to work with some amazing scientists on some really interesting research projects focused on water use and food production in the American West. Due to widespread concerns over water scarcity in this region, the papers resulting from our studies have captured a lot of media attention, including one published last week that has already been covered in 77 news stories.
The most common question that reporters ask about our research is, “Why are we growing so much alfalfa?”
This question emanates from some of the key findings in our papers:
Alfalfa farms consume 26% of the Colorado River’s water.
Alfalfa farming accounts for 20% of water consumed in the western 17 states
Alfalfa and other grass hays are the most water-consumptive crops in 57% of river basins in the western US (see map below)
Color coding indicates which crop consumes the most water in each river basin. Alfalfa and other grass hays are the most water-consumptive crops in 57% of river basins in the western US (from Richter and others, 2023)
So why ARE we growing so much alfalfa if we have a water scarcity problem?
My simple response to this question: Because farmers and ranchers produce what we want to eat and are willing to pay for.
No, we don’t eat alfalfa. Not directly. But we eat beef, and we eat dairy products, and those foods come from cows that eat alfalfa and other grass hays.
It’s also important to clarify who the “we” is here because reporters are also asking how much gets exported out of the US. As of 2022, we exported about 7% of all alfalfa produced, and virtually all of that was grown in the western US. The leading recipients of those exports include China, Japan, and Saudi Arabia (see graph below). The reasons why these countries need to import alfalfa from the US are quite interesting, but I’ll leave that for a future blog.
Countries receiving US exports of alfalfa in recent years. Source: US Department of Agriculture
Consumer demands for alfalfa
In our 2020 Nature Sustainability paper we estimated that 2/3 of all alfalfa and grass hay grown in the western US goes to beef production, and 1/3 goes to dairy. However, those stats combine alfalfa with other hays, and can be misleading in the aggregate because most grass hay goes to beef production, and most alfalfa goes to dairy production. In major dairy producing states such as California, Idaho, and New Mexico, 75-80% of alfalfa production goes to dairies.
Overall milk production in the US has grown by 35% since 2000. That’s not because Americans want to drink more milk; in fact, per capita milk drinking has dropped by 27%. Instead, much more milk is being produced to meet increased demands for yogurt (+378%) and cheese (+72%).
Beef consumption has remained steady but very high. Americans consume four times more beef per person than the global average. On average, we eat the equivalent of a quarter-pound hamburger every single day per person.
Alfalfa pays well too
Farmers and ranchers are constantly paying attention to which crops might be most profitable. That largely explains the recent growth in alfalfa production — with associated increases in water consumption — in some farming regions in the western US: the price is right.
Credit: Sustainable Waters
In our 2023 Nature Water paper we highlighted the fact that in some of our study areas, water consumption by alfalfa has been increasingly sharply (see blue traces in each graph below), placing a great deal of added stress on scarce water resources. Increased demand for alfalfa in dairies is creating a lot of water stress in these regions.
Credit: Sustainable Waters
As mentioned previously, one-quarter of all of the Colorado River’s water goes to alfalfa farming. In the Great Salt Lake basin, one-third of the river flow that could have replenished the vastly diminished lake goes to alfalfa.
So what should we do?
Media reporters also commonly ask about possible solutions: what should we do?
To start, there’s a lot we can do in our homes and businesses. Minimize how much water you use outdoors on lawns and gardens, and use rainwater capture for your outdoor water to the extent feasible. Make sure your toilets and other indoor appliances are as water-efficient as possible. Those actions can relieve the pressure on overtaxed water supplies such as the Colorado River, and we all need to do our part.
Importantly, we also need to stop blame-shaming farmers for their business decisions. Nor should we try to regulate what farmers can grow, or who they can sell to. As I said previously, they grow what we want to eat and are willing to pay for. If you care about the water crises in the West, perhaps you should think about what you’re eating: how much yogurt, how much cheese, how many burgers and steaks? Farmers will shift to growing other crops when our demands of them change.
Lastly, we need to insist that those individuals and agencies managing our water supplies do a much better job of planning for a secure, ecologically-sustainable water future. We’re stuck on reactive, short-term strategies such as forcing annual curtailments on water deliveries every time the water levels in our reservoirs or aquifers drop. This is no way to manage a water crisis. We need to quantify how much water is going to be reliably, sustainably available for our use over the long term and set a firm legal cap on that volume of consumption. Once we do that, our cities, industries, and farms will make the decisions and investments needed to thrive within nature’s limits.
Hayfield message to President Obama 2011 via Protect the Flows


