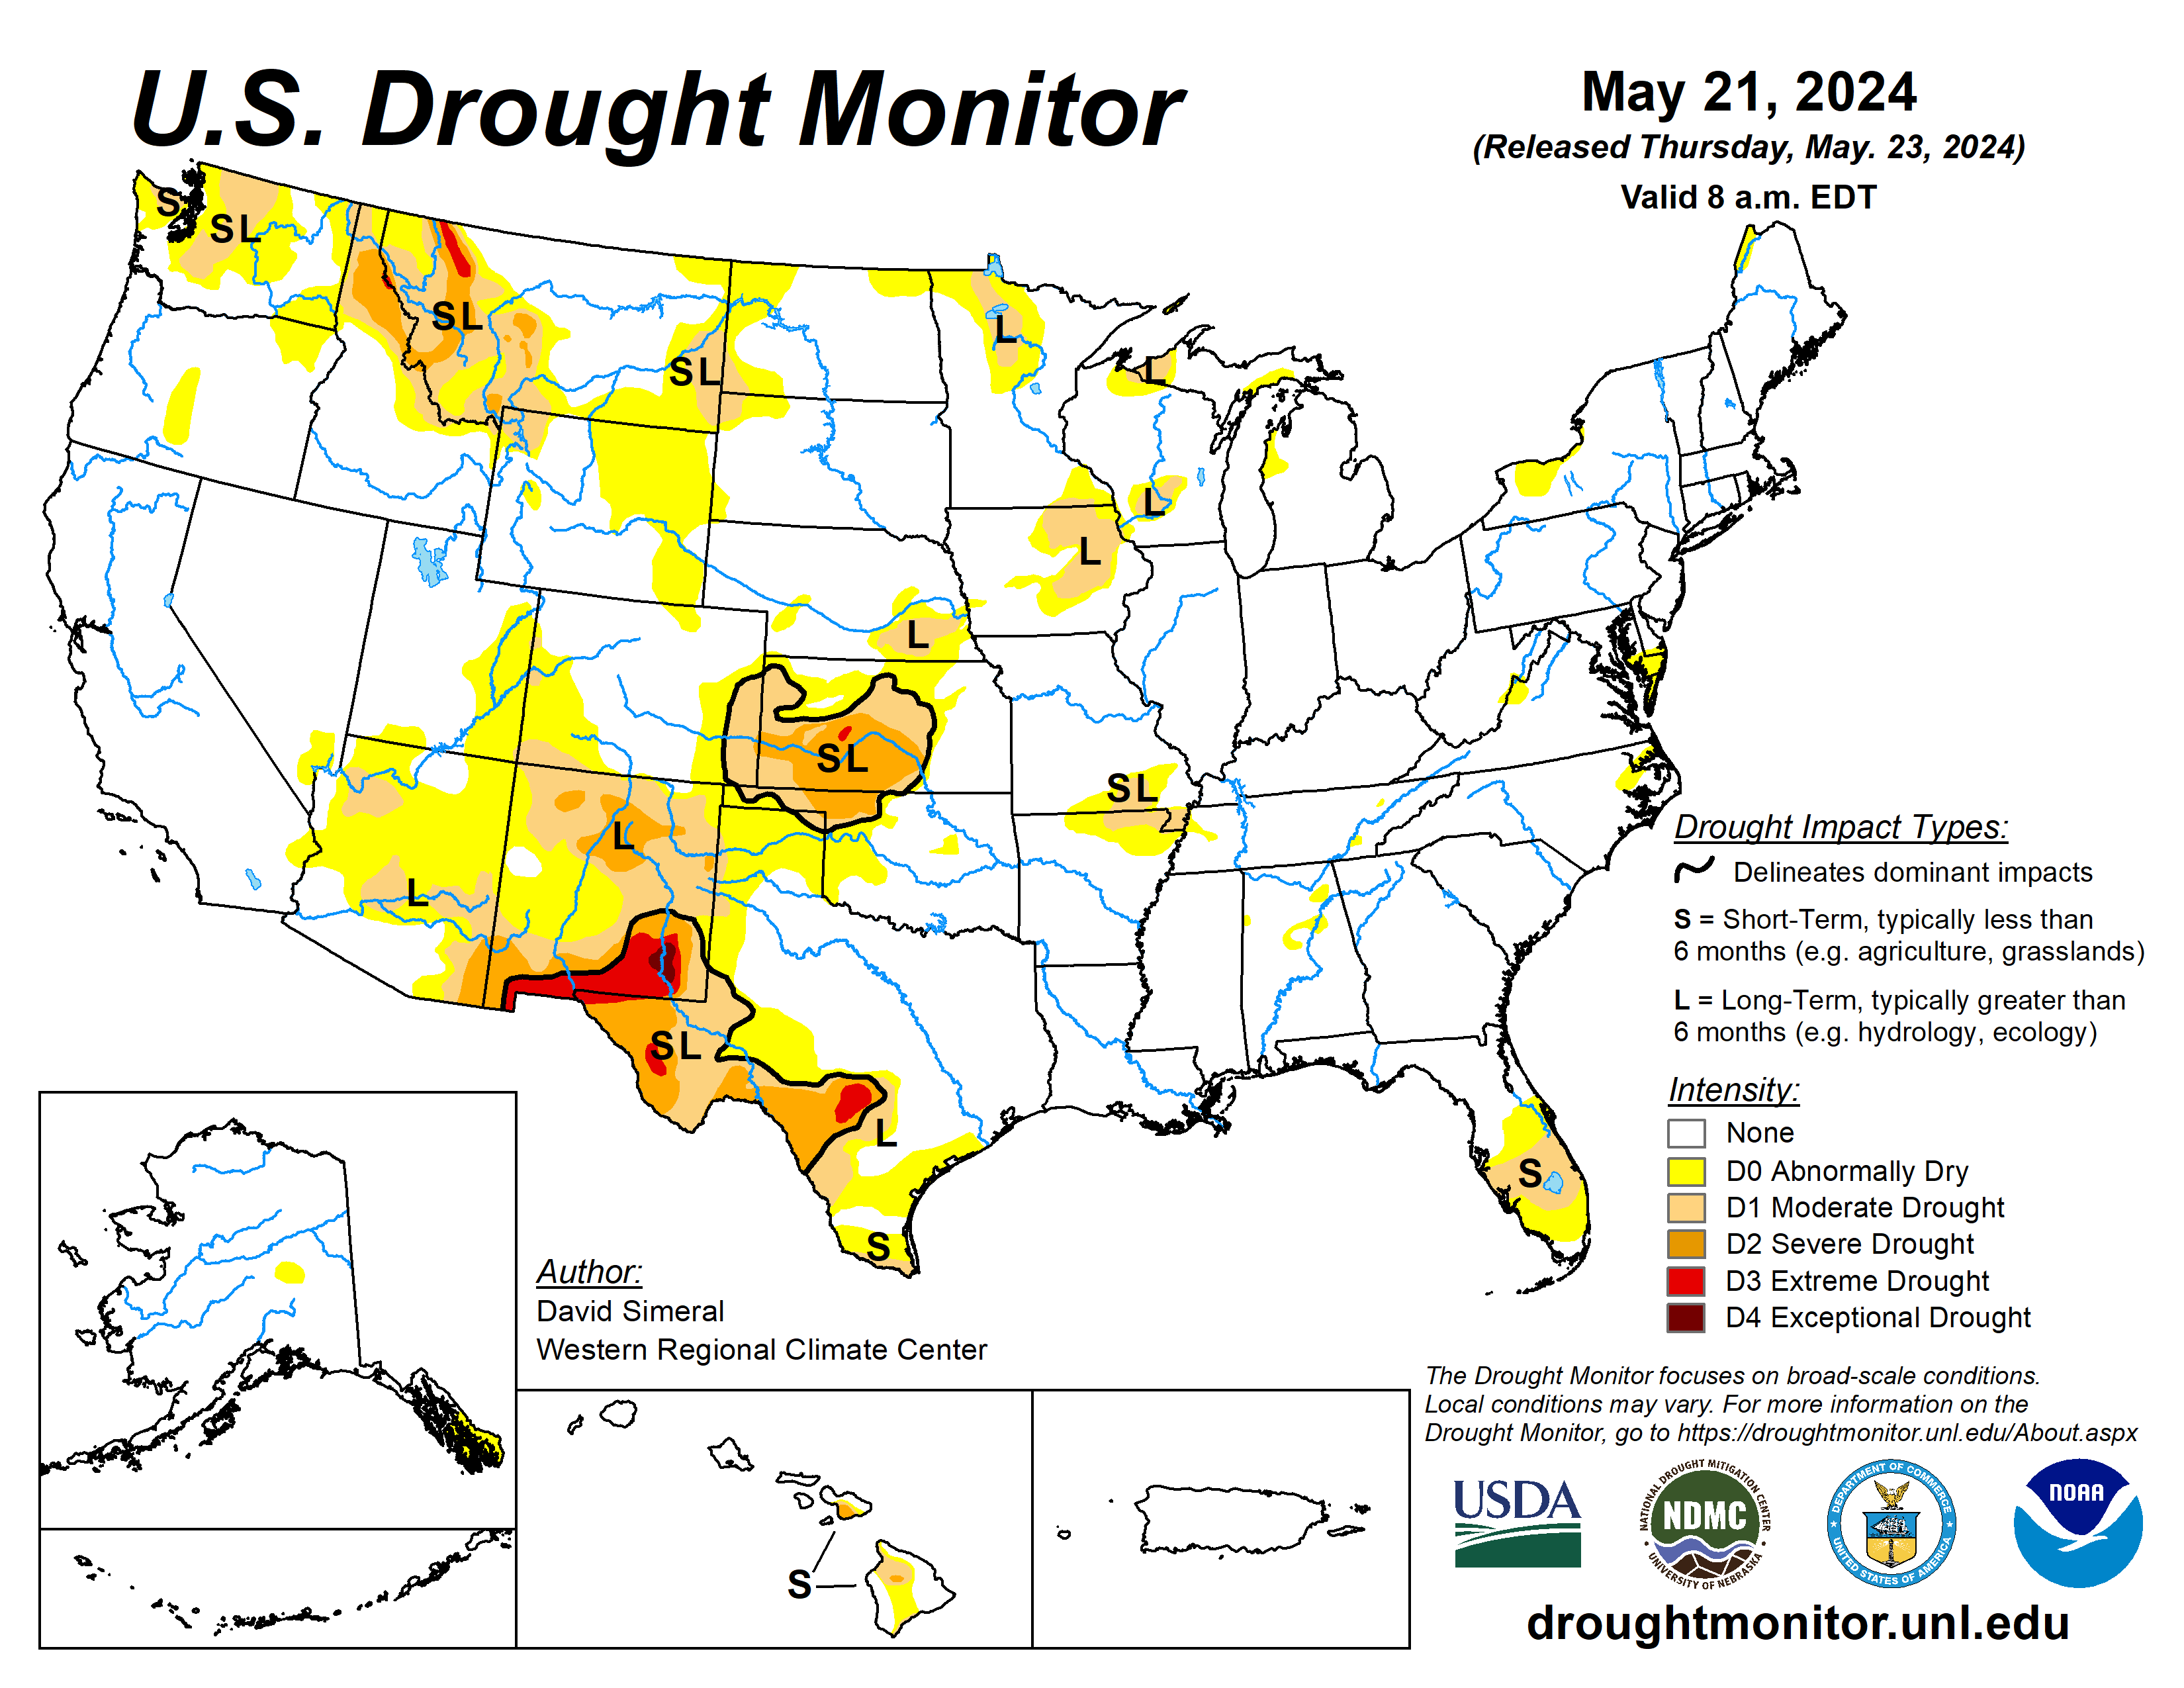
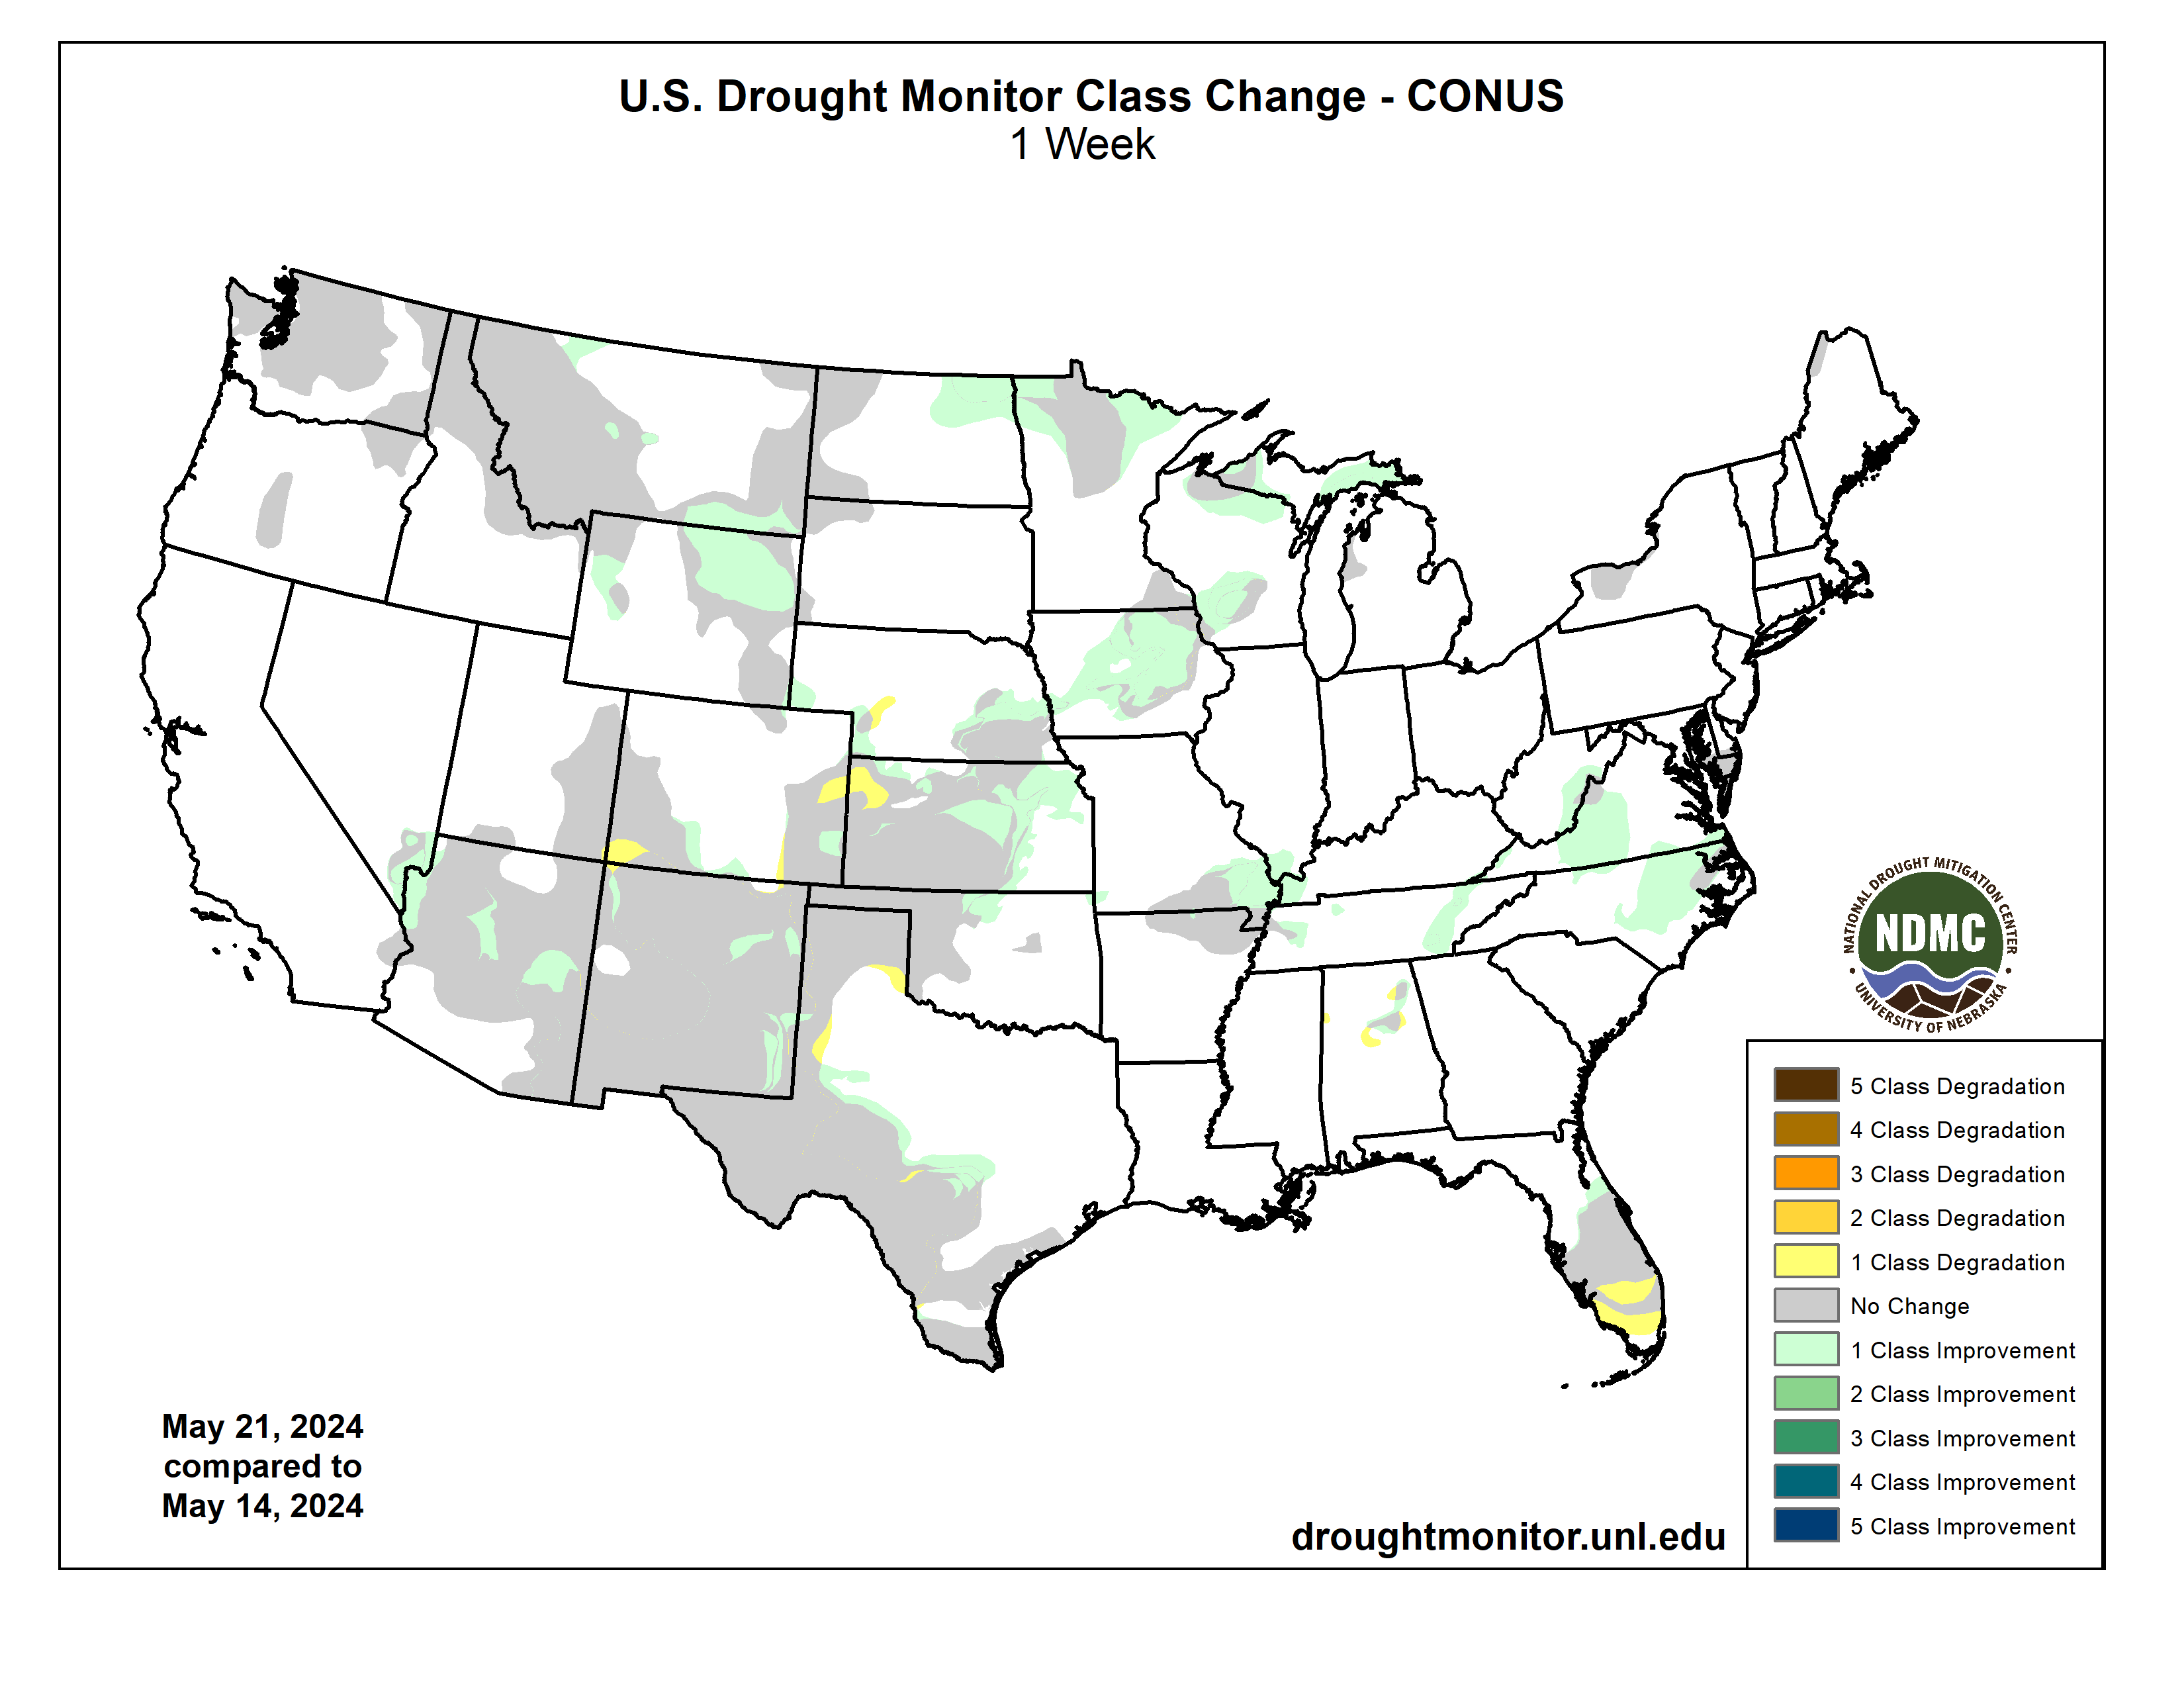
This U.S. Drought Monitor (USDM) week saw widespread improvement in drought-related conditions on the map across areas of the South, Plains, Midwest, Mid-Atlantic, and the West. In the Plains and Midwest, locally heavy rainfall accumulations (up to 7 inches) were observed in drought-affected areas of Oklahoma, Kansas, Nebraska, Missouri, and Iowa leading to continued improvements of conditions on the ground (vegetation health, soil moisture, surface water) as well as reductions in the longer-term precipitation deficits. Likewise, above-normal precipitation during the past several months led to removal of areas of drought on the map in Michigan’s Upper Peninsula as well as in southern Wisconsin. In the South, isolated areas of central and west-central Texas saw minor improvements in response to recent rains and improving conditions during the past 30-day period. In the Mid-Atlantic, 1-6-inch accumulations were observed in areas of North Carolina and Virginia this week leading to removal of areas of Abnormally Dry (D0). Out West, some minor improvements were logged in central and northern Arizona where precipitation has been above normal since January 1. In southeastern Montana, recent rains erased Water Year (since October 1) deficits and have improved soil moisture conditions and vegetation health. Across the border in the Bighorn Mountains of north-central Wyoming, areas of Moderate Drought (D1) were removed in response to above-normal snowpack conditions observed in its associated drainage basins. In California, the state’s reservoirs are above normal levels moving into the dry season with the state’s two largest reservoirs (Lake Shasta and Lake Oroville) at 115% and 126% of their historical average for the date (May 21), respectively. In the Southwest, Lake Powell is currently 33% full (58% of typical storage level for the date) and Lake Mead is 35% full (62% of average) with the total Lower Colorado system at 42% full as of May 20 (compared to 37% full at the same time last year), according to the U.S. Bureau of Reclamation. In Arizona, the Salt River Project is reporting the Salt River system reservoirs at 95% full, the Verde River system at 70% full, and the total reservoir system at 92% full (compared to 99% full a year ago). In New Mexico, the state’s largest reservoir along the Rio Grande is currently at 23% full (59% of average). In the Pacific Northwest, Washington’s Franklin D. Roosevelt Lake is at 87% full (176% of average for the date). In terms of degradations on the map this week, the only noteworthy ones were made in areas of South Florida where areas of Moderate Drought (D1) expanded in response to dry conditions during the past 60-day period with reports of various impacts including burn bans, lake levels dropping at Lake Okeechobee, reduced soil moisture, and some minor impact in the recreation sector due to low surface water levels. Overall, looking at the broader drought situation across the conterminous U.S., the total percentage of drought coverage is at its lowest since 2020…
On this week’s map, Kansas, Nebraska, North Dakota, and the eastern Plains of Montana saw improvements in drought-affected areas. In Kansas and Nebraska, moderate to heavy rainfall accumulations (2 to 7+ inches) led to a reduction in areas of drought and provided a boost in soil moisture and streamflow levels. In North Dakota, areas of Moderate Drought (D1) were reduced in response to above-normal precipitation during the past 30-to-90-day period as well as numerous recent field reports coming into the National Drought Mitigation Center’s Condition Monitoring Observer Reports (CMOR) system. According to the USDA (May 19), statewide pasture and range conditions rated good to excellent are as follows: North Dakota 68%, South Dakota 83%, Nebraska 56%, and Kansas 42%. According to the latest USDA Kansas Crop Progress and Condition Report (May 19), winter wheat condition was rated 11% very poor, 20% poor, 36% fair, 30% good, and 3% excellent. In terms of NOAA NCEI’s regional climatological rankings, the Great Plains Region observed its 44th wettest (near normal) and 12th warmest (+3.9 degrees F anomaly) January-April period on record…
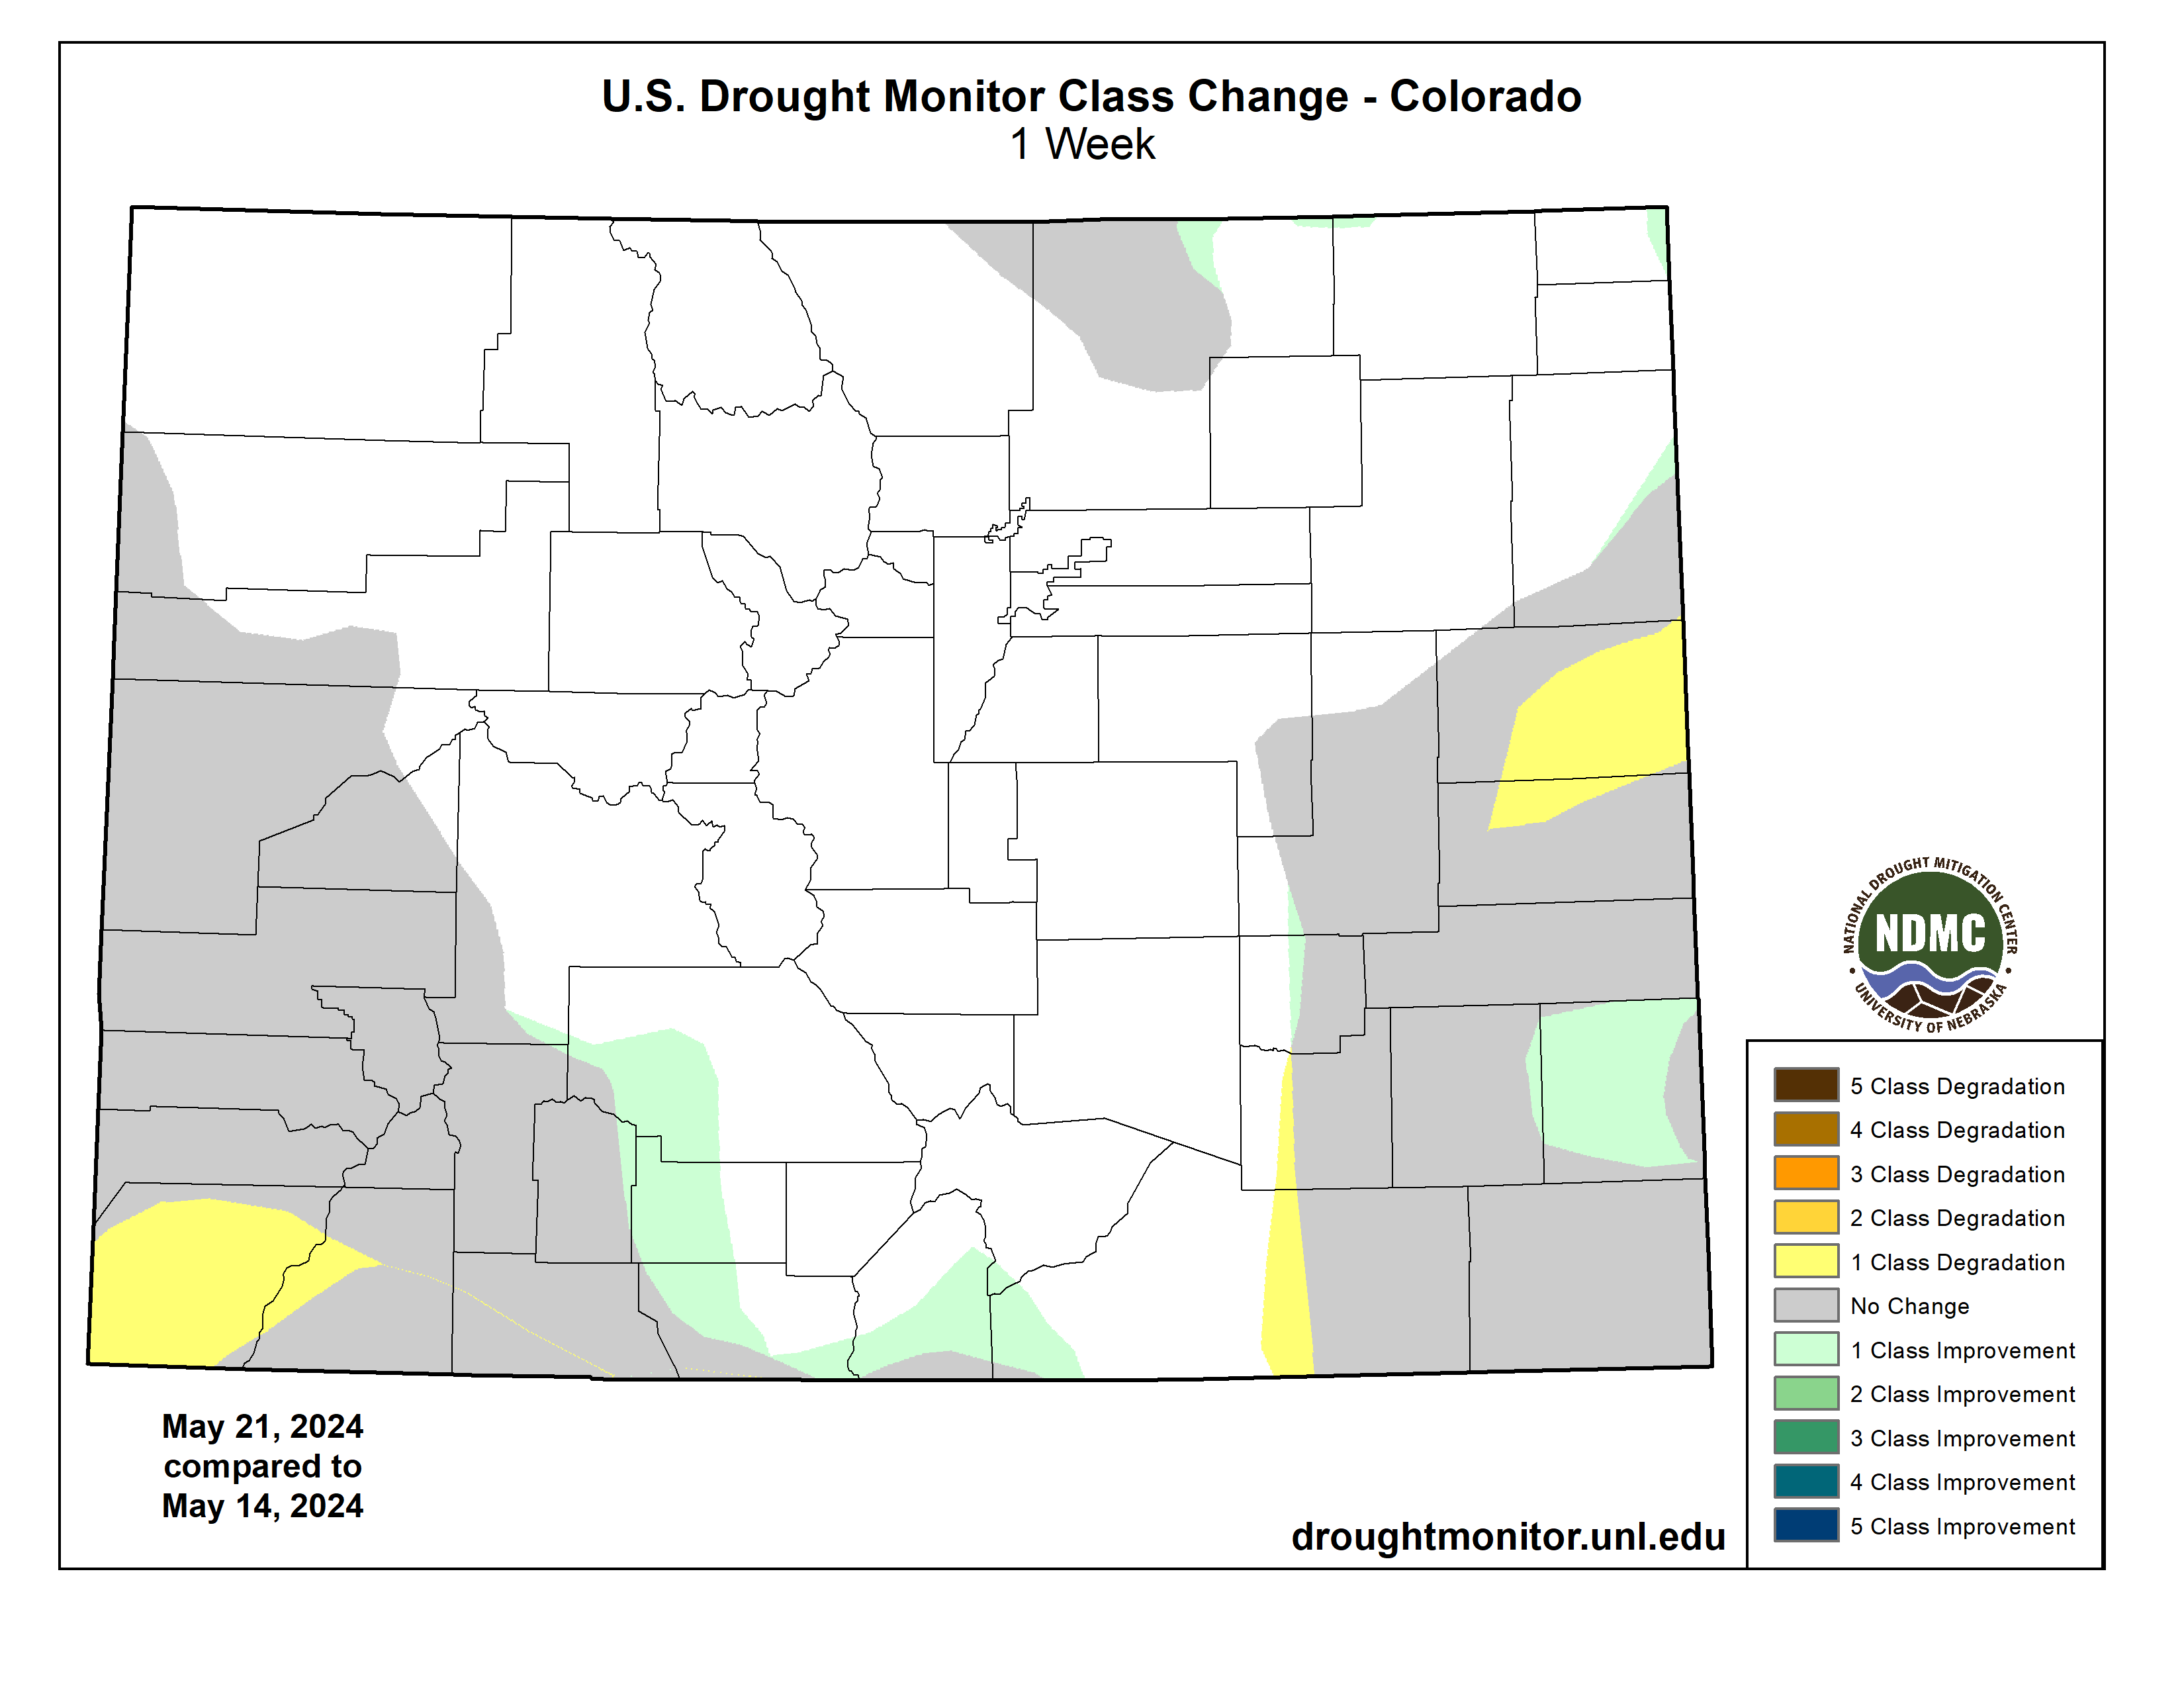
Drought Monitor one week change map ending May 21, 2024.
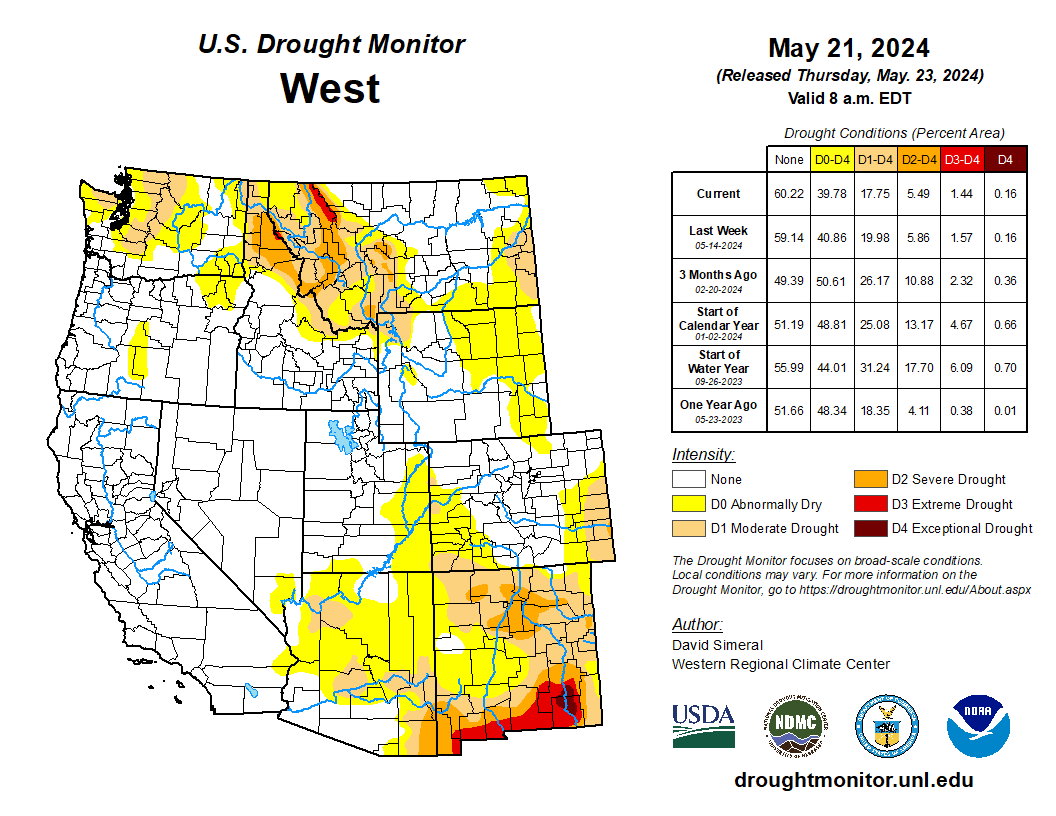
Out West, some minor improvements were made on the map in central and northern Arizona, eastern New Mexico, southern Colorado, southern Nevada, north-central Wyoming, and southeastern and central Montana. Looking at precipitation across the region, the start of the Water Year was not looking good with most of the region experiencing below-normal precipitation levels. However, the period from January 1 to current (May 21) was much more promising with above-normal precipitation observed across much of the region, with the exception of areas of the Pacific Northwest including Washington, northern Idaho, and western and central Montana as well as areas of the Southwest (eastern New Mexico and northwestern Arizona). In terms of snowpack, the Natural Resources Conservation Service SNOTEL network is reporting (May 21) the following region-level (2-digit HUC) snow water equivalent levels (percent of 1991-2020 median): Pacific Northwest 73%, Missouri 100%, California 147%, Great Basin 137%, Upper Colorado 112%, Arkansas-White-Red 140%, Lower Colorado 232%, and Rio Grande 52%. For the week, conditions were very dry across the region except for some isolated, light shower activity in eastern portions of New Mexico, Colorado, Wyoming, and Montana…
Across portions of the region, the active pattern continued with significant rainfall accumulations observed in portions of eastern Texas, southern Louisiana, and southern Mississippi, where 7-day totals ranged from 2 to 8 inches. Moreover, beneficial rainfall continued to help ease drought-related conditions in areas of Texas and Oklahoma. On the map, isolated rainfall activity this week led to some minor improvements in north-central Oklahoma, while areas of central and west-central Texas saw minor improvements. According to Water for Texas (May 22), statewide reservoirs are currently at 77.3% full with numerous reservoirs in the eastern part of the state near capacity, while many reservoirs in the western half of the state are experiencing below-normal levels. In terms of pasture and range conditions across the region, the USDA (May 19) is reporting statewide pasture and range conditions rated good to excellent as follows: Tennessee 74%, Mississippi 65%, Arkansas 61%, Louisiana 61%, Oklahoma 57%, and Texas 33%. Looking at climatological rankings for the January 2024-April 2024 period, the region experienced its 19th wettest (+2.32-inch anomaly) and the 11th warmest (+3.2 degrees F anomaly) on record, according to NOAA NCEI…
Looking Ahead
The NWS Weather Prediction Center (WPC) 7-Day Quantitative Precipitation Forecast (QPF) calls for moderate-to-heavy rainfall accumulations ranging from 2 to 5 inches across areas of the eastern portions of the Southern Plains (Oklahoma), South (northeastern Texas, Arkansas, northern Mississippi, Tennessee, Kentucky) and the Midwest (Illinois, Indiana, Ohio) while lesser accumulations (1 to 2.5 inches) are expected in areas of the Upper Midwest, Mid-Atlantic, Northeast, and out West in isolated areas of the Northern Rockies, and eastern plains of Montana. Dry conditions are expected across California, the Great Basin, the Southwest, and the southern extent of the Intermountain West. Likewise, much of the Gulf Coast region is expected to experience relatively dry conditions. The Climate Prediction Center (CPC) 6-10-day Outlook calls for a moderate-to-high probability of above-normal temperatures across much of the South, Southeast, lower Mid-Atlantic, and northern portions of the Northeast. Likewise, above-normal temperatures are expected across most of the western U.S., with the exception of the Far West coastal areas from California to Washington where near-normal temperatures are expected. Conversely, below-normal temperatures are expected in eastern portions of the Central Plains and across much of the Midwest. In terms of precipitation, there is a low-to-moderate probability of above-normal precipitation across the South, Southeast, Mid-Atlantic, and Northeast, while below-normal precipitation is expected across most of the western U.S., Northern Plains, and areas of the Upper Midwest.
US Drought Monitor one week change map ending May 21, 2024.
Click the link to read the article on the Big Pivots website (Allen Best):
May 14, 2024
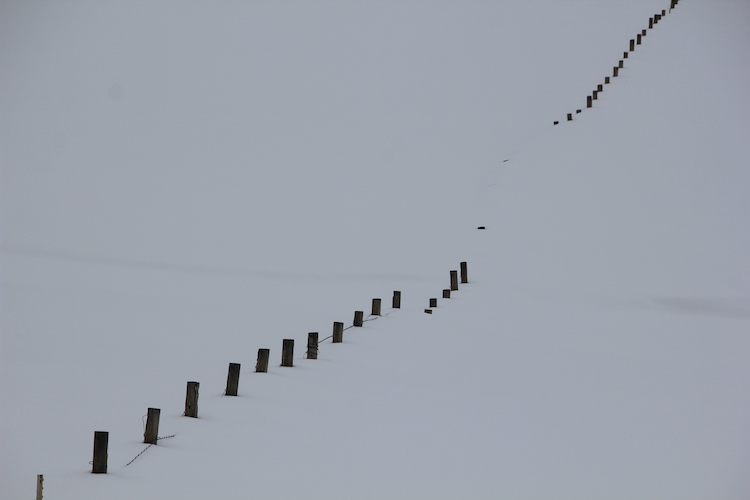
Ranchers in Colorado’s Yampa River Valley traditionally measured the severity of winters by snow accumulation on their stock fences. Plentiful accumulation put the snow at the top wire, making it a three-wire winter. Four wires have become the norm on stock fences. No matter. By early March 2023, those wires at the foot of Rabbit Ears Pass were covered too. The Yampa Valley was sublimely white. It was a winter like the old days.
As expected, runoff was big and thrashing. Creeks tumbling through Steamboat Springs in May spilled over their banks. Downstream 75 miles, the Yampa River at Maybell peaked on May 18 at 16,500 cubic feet per second, more than 200% the average peak streamflow at that gauging station.
What happened afterward was very different. By July, the Yampa’s meager flows in Steamboat so concerned water managers that they nearly closed the warming river to recreationists in order to protect fish.
Snow topped the stock fences at the foot of Rabbit Ears Pass on March 4, 2023. Photo/Allen Best
That big snowpack that resulted in head-high snowbanks along the streets in Steamboat? It produced a big runoff. But thievery had also occurred. Who or what absconded with the water? And how?
This mystery was not entirely new. April 1 snow depth in the Yampa and most of Colorado’s river basins has rarely correlated perfectly with runoff. Whether spring weather turns wetter and cooler or hotter and drier can alter the runoff dynamics. “There is always that component of what the temperature and precipitation regimes are from April 1 through July,” says Karl Wetlaufer, a hydrologist and assistant supervisor at the Natural Resource Conservation Service, the federal agency that delivers the longest-running and most-used runoff forecasts. “They really drive a lot of what those forecast errors end up being.”
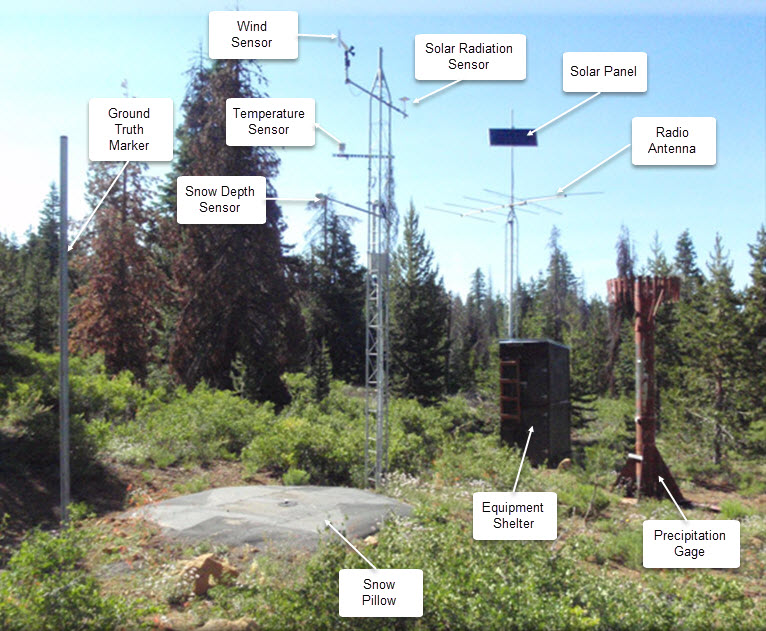
SNOTEL automated data collection site. Credit: NRCS
Then, too, the traditional methods for measuring snowpack have fallen short. Data from snow telemetry (SNOTEL) sites, is collected automatically from stations across Colorado. But those stations are relatively few compared to the complex geography. One station provides insights about one station, not a whole hillside or mountain. They provide an index.
A climate that has turned warmer and some say weirder during the last 10 to 20 years has some water managers wanting new tools. Whether in the San Luis Valley or the Yampa River Valley, what lies on the ground on April 1 remains the best predictor of river flows come July, August and September.
Water managers, from ranchers and farmers to reservoir operators and city staff, though, want improved models and data that more completely reveal the complexity of what is happening. They want to better understand why a huge snowpack can, by July and August, be such a dud.
What’s up with soil cracks and a changing climate?
Patrick Stanko, at his ranch four miles downstream from Steamboat Springs, has been puzzling over changes since he was a boy in the 1970s and 1980s. Summers have become hotter, winters less cold. Snow is gone sooner.
“The big snow banks of winter just disappear,” says Stanko. Water disappearing into the atmosphere is not a new process. But higher temperatures exacerbate it, whether that loss is to sublimation, where snow transforms directly into a gas, or evaporation, where snow melts and that water enters the atmosphere as a gas.
Milk Creek, which flows through the ranch that has been in his family since 1909, had become intermittent in its flows. Late-season grasses that his 100 head of cattle graze have become sparser with lessening summer rains.
Most striking are cracks in the ground that Stanko has noticed in recent years. He believes they have something to do with the shifted summer dynamics — dynamics that have implications into the next year’s runoff.
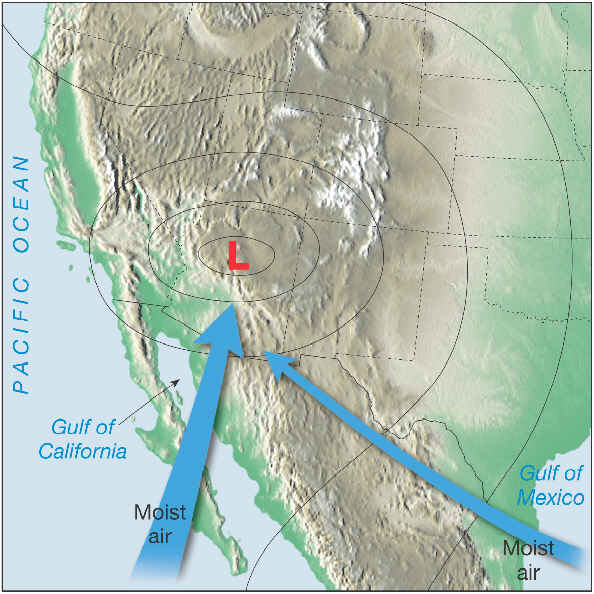
North American Monsoon graphic via Hunter College.
“We don’t get the rains that we used to get,” he says. “You used to be able to set your clock by the monsoon that would come.”
Haying in the Yampa River and other high country locations traditionally began in July or early August. Rain storms arrived almost simultaneously. If the rain forced ranchers to leave the grasses to dry, it was also helpful. Stanko says hay is best with 10% to 14% moisture content. Now, the timothy hay, brome grass and dryland alfalfa he grows on his 600 acres is often too dry after being cooked by hot winds.
Alfalfa growing on the Ute Mountain Ute land in southwestern Colorado in October 2022. Photo credit: Allen Best/Big Pivots
Drying soils in fall have implications for spring runoff—the soils want their share of water first. That could bite into the total runoff, particularly in dry winters. Rainstorms in September have the reverse effect.
The 2024 Climate Change in Colorado report confirms many of Stanko’s observed changes. For example, summer precipitation has decreased 20% across northwest Colorado in the 21st century as compared to 1951-2000. Models suggest drier summers may become the norm — even with increased winter precipitation.
And warming has made the atmosphere thirstier. Evaporative demand is another name for this thirst. Warm air can hold more moisture than cool air. If nothing else changes, warmer temperatures increase evaporative demand.
The Climate Change in Colorado report, which was commissioned by the Colorado Water Conservation Board, cites a measure of evaporative demand called potential evapotranspiration (PET). It refers to the amount of water that would be evaporated or sublimated from the snow, soil, crops, and ecosystem if sufficient water was available. Between 1980 and 2022, PET increased 5% during Colorado’s growing season. When the ground holds less moisture, more of the sun’s energy heats the land’s surface and the atmosphere above it instead of evaporating moisture. This drives faster warming and lowers humidity.
Since 2000, streamflow across Colorado’s major river basins has been 2% to 19% less compared to the half-century before. Modeling studies have attributed up to half the declines to warming temperatures. And with declining streamflows, the need to make the most of available streamflows is heightened.
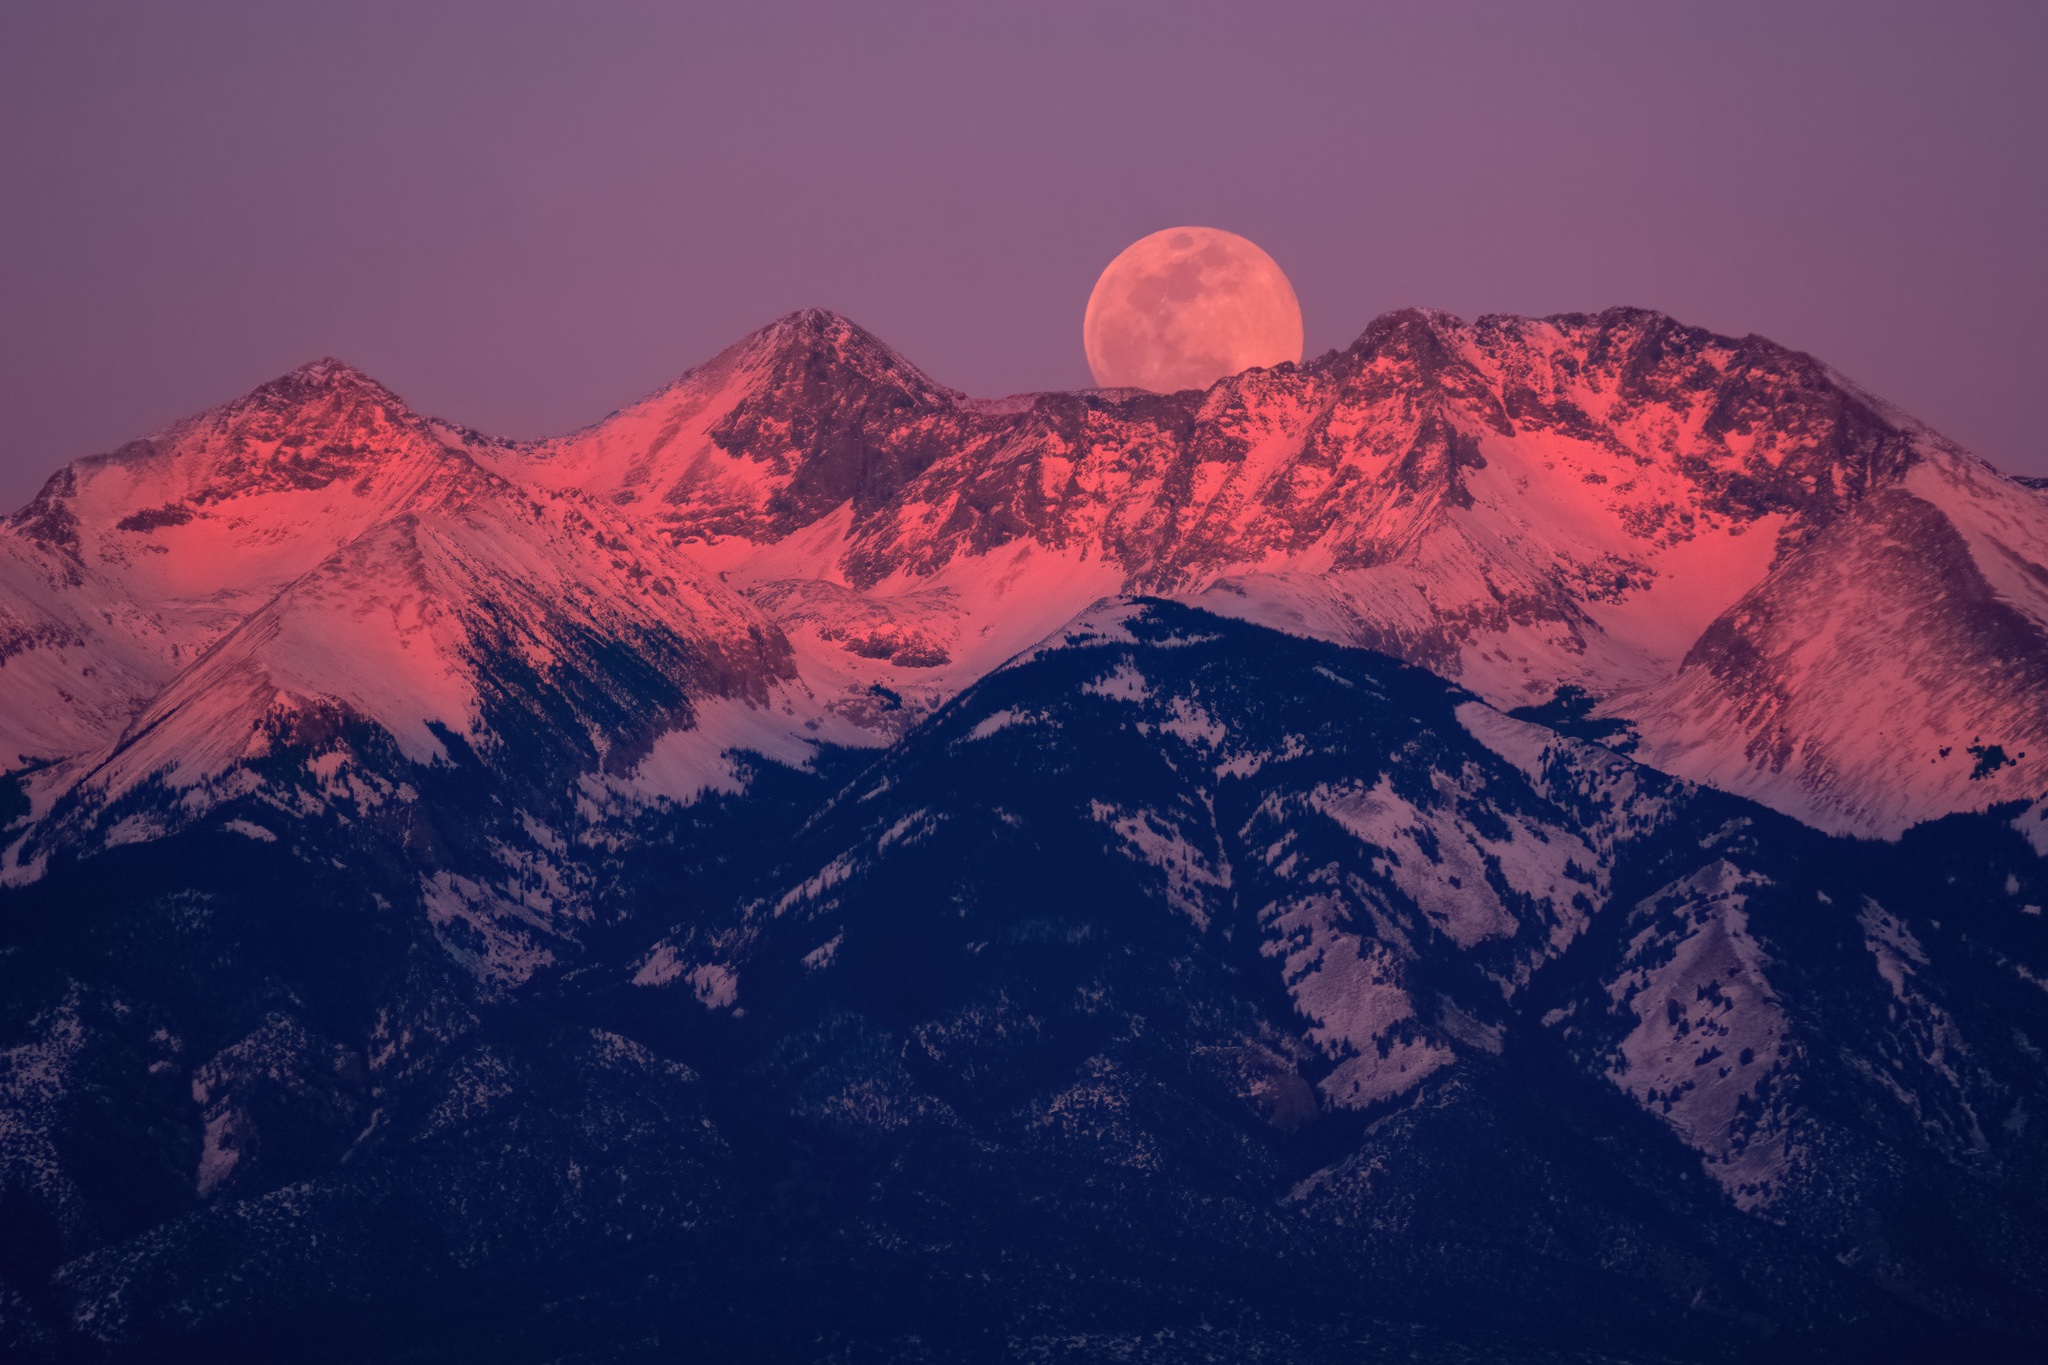
The Blanca massif, located just south of Great Sand Dunes, has been been a landmark for people for thousands of years. The #SnowMoon rising behind it is the full moon that occurs each February. Photo: NPS/Patrick Myers 2024
San Luis Valley and improved runoff forecasting
The story of dry conditions and low streamflows echoes 250 miles to the south in the San Luis Valley. There, water appropriation dates are older, elevations a little higher, and mid-summer temperatures a trifle toastier. Fifteen of the 20 hottest daily maximum temperatures recorded in Alamosa, including several in 2023, have occurred in the 21st century.
Snowfall in the San Juan Mountains largely determines how much alfalfa Cleave Simpson can grow on his farm south of Alamosa. The farm has water rights from 1879, but that isn’t senior enough to ensure reliable water deliveries, says Simpson, who is a Colorado state senator in addition to being a farmer and general manager of the Rio Grande Water Conservation District. State officials make adjustments to the water that can be diverted. “They do that every day,” says Simpson. “All in an effort to deliver to the state line as close as is possible the amount that we’re required to deliver.”
The Rio Grande Compact specifies how much water Colorado must deliver to downstream states. Depending on the year’s flows, Colorado sends between 35% and 70% of the Rio Grande’s water downstream. To ensure those deliveries, water managers must carefully calibrate flows they expect against demand from irrigators. Like those on the Yampa, water managers have wanted new ways of forecasting flows. “Because the old ways just aren’t working that well,” explains Craig Cotten, Colorado’s Division 3 water engineer, who leads administration in the Rio Grande Basin.
The old ways use primarily snow telemetry data, better known as SNOTEL data, which is automatically collected from stations across the state. That data is used to project flows using what Cotten describes as a “fairly simple regression analysis.” In other words, if X amount of snow in the past produced Y amount of water, then the same formula should hold today. But in the early 2000s, Cotten began to see that in some years, streamflow forecasts were not as accurate as he would have liked, he says.
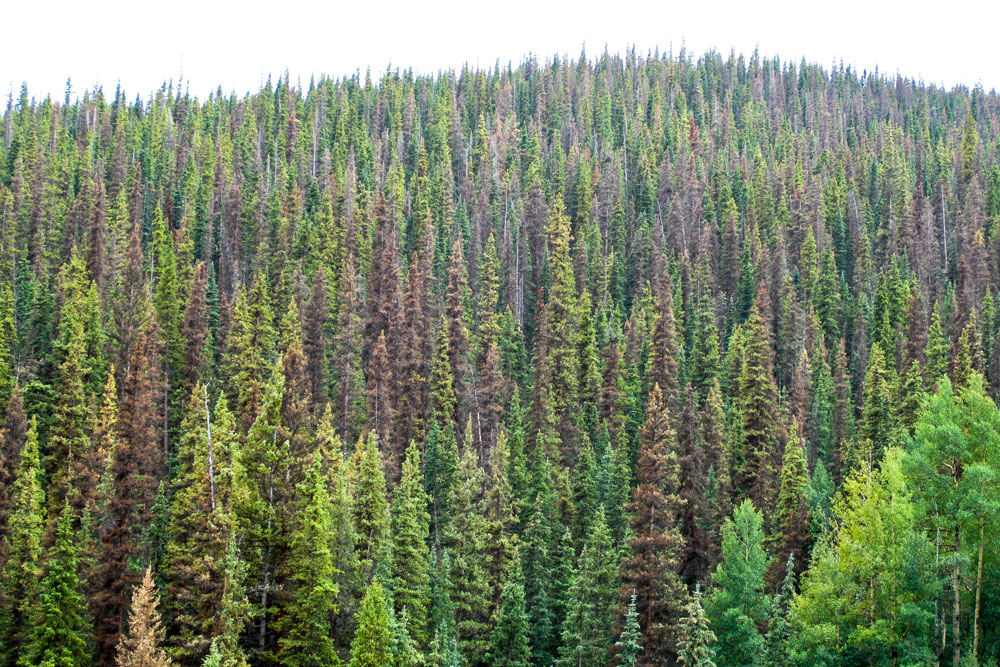
Spruce beetle-impacted forest in Southwestern Colorado with moderate levels of tree mortality. Photo credit: Sarah Hart
What changed? Bark beetle infestations, by stripping trees of needles and exposing more snow to sunlight, altered runoff. So did wildfires, which in 2013 scarred 113,000 acres in Rio Grande headwaters areas. “That changed the dynamics of the forest system and how it related to the snowpack melting and running into the streams,” says Cotten, a 33-year veteran with Colorado’s Division of Water Resources. Dust-on-snow events work the same way. Dust blown from distant deserts accumulates on snow, drastically reducing the albedo, or reflectivity. The warmed snow melts more rapidly.
Overall flows have trended down. Flows on the Rio Grande at a gauging station near Del Norte, upstream from most diversions, averaged 8% less from 2000 through 2022 than during the preceding 50 years.
Snowpack in the Rio Grande’s headwaters in the San Juan Mountains was above average in 2019 and again in 2023, Cotten points out. But late-summer seasonal flows were below average. “Even in a good year, our farms and ranches struggle in the late season because we have below-average streamflow at that time.” And always, there’s the need to meet compact obligations, a task that Cotten says has become harder because of tightening water supplies.
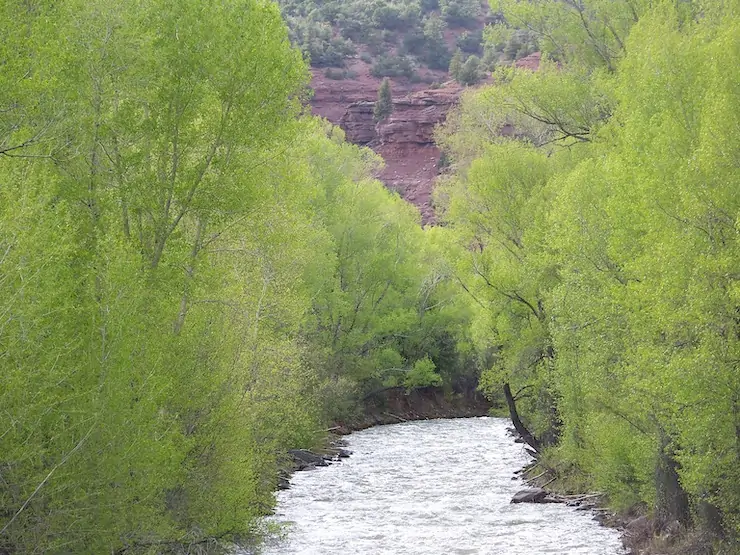
The Dolores River between Rico and Dolores in southwestern Colorado on Memorial Day 2009. Photo credit: Allen Best/Big Pivots
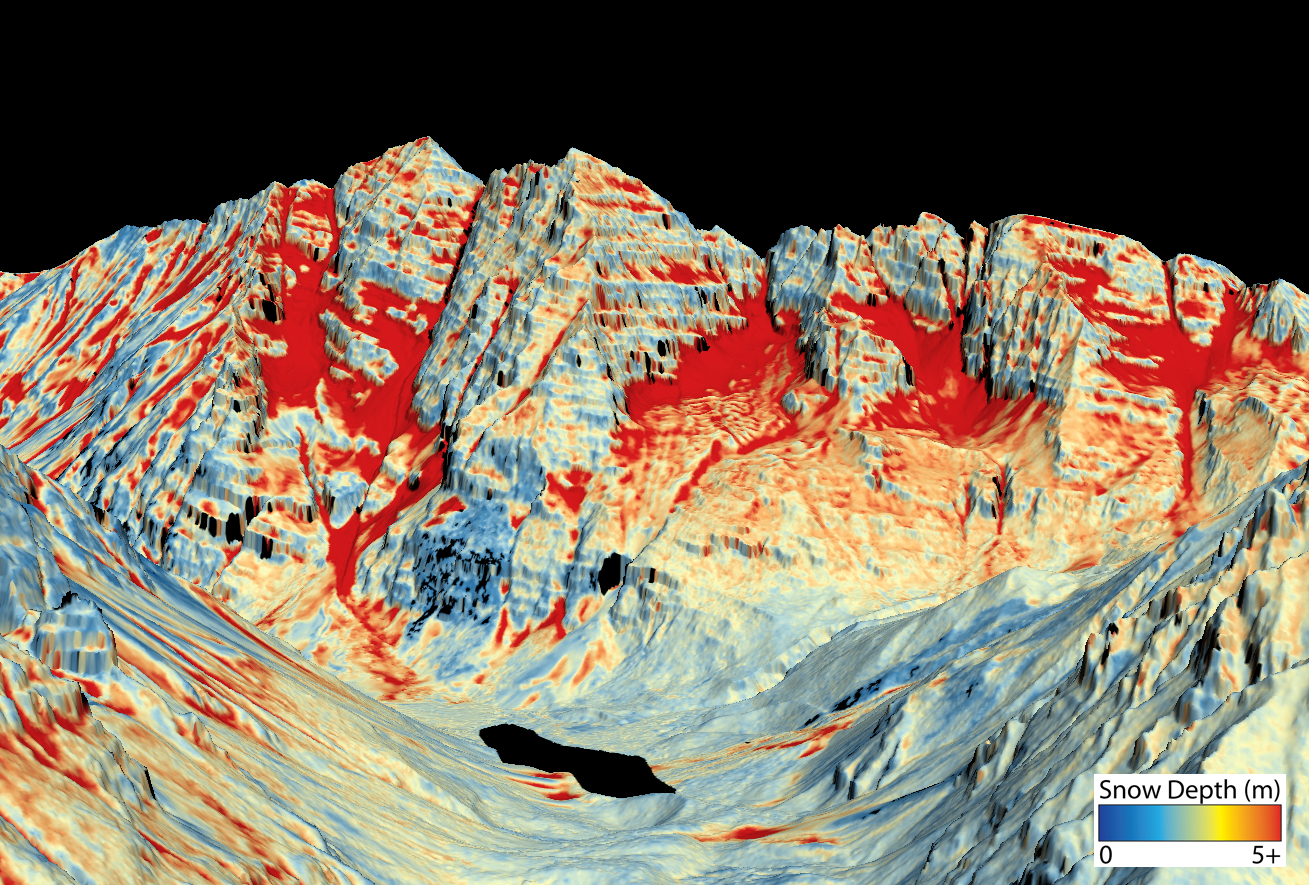
With stretched water supplies, accuracy in forecasting is increasingly important. A new tool, the high-resolution LiDAR of Airborne Snow Observatories (ASO) has meant better data on the amount of water contained in snowpack, and has improved runoff projections. Through ASO, a plane flies over entire watersheds or basins, collecting snow-depth data. Flights in 2024 include the Conejos River – of help to Cotten — and the Yampa and Elk rivers.
“Whether it’s a county commissioner, a dam operator, or maybe Craig Cotten or another division engineer, their challenge is that they’ve got a forecast of runoff, timing and volume,” says Jeff Deems, a snow scientist and part-owner of ASO. “They need to operate their headgates, their allocation, their dam, et cetera, while recognizing that their forecast is uncertain and that there’s a range of outcomes that could be undesirable. They need to make the best decision possible under that uncertain framework.”
This map shows the snowpack depth of the Maroon Bells in spring 2019. The map was created with information from NASA’s Airborne Snow Observatory, which will help water managers make more accurate streamflow predictions. Jeffrey Deems/ASO, National Snow and Ice Data Center
ASO claims it can achieve 98% accuracy in forecasting the amount of water contained in snow, known as the snow water equivalent, or SWE, across large areas. Water managers across Colorado, with the help of state funding, are contracting with ASO to collect data and boost their forecasting.
“It opens up understanding of different physical processes related to the snowpack that otherwise we may not understand very well,” says Angus Goodbody, of ASO. Goodbody is a forecast hydrologist with the NRCS.
While this data is invaluable to many water managers, NRCS can’t yet use ASO data in its modeling. But NRCS, too, is rolling out a new forecast system this winter. Goodbody describes the forecasting tools as improving incrementally. By using various forecasting tools and models to analyze data, NRCS aims to mitigate “the vulnerability of any one of those models on their own,” he says.
If a liquid like water is present in a way of tiny drops, in air, in a substance or on a surface we called it as moisture. But it is very difficult to define the “soil moisture”. Normally, soil moisture can be defined as the water that retain in between the spaces of the soil and rock particles. This is of two types. Those are: surface soil moisture; and, root zone soil moisture. Credit: Modern Farming
Digging into soil moisture
New tools have also topped Andy Rossi’s wish list for the Yampa. From the Steamboat Springs office of the Upper Yampa Water Conservancy District, where he has been the district’s general manager since 2020, Rossi directs operations of the district’s two upstream reservoirs, Stagecoach and Yamcolo, which provide water to ranches and municipalities, including Steamboat Springs.
When he started working for the Upper Yampa district as an engineer in 2009, runoff forecasts were “becoming more and more unreliable and really difficult for us to get our arms around what was going on in the basin,” he explains.
Temperature records for the Yampa Basin were very good. Soil moisture records? Not so much. Runoff predictions from past years mentioned soil moisture but relied solely on models. “There was no direct measurement of soil moisture going into our forecasting,” Rossi says. He decided the Yampa Valley needed more diverse measuring infrastructure to better collect data about soil moisture and atmospheric processes in order to see if and how soil moisture factors into runoff. Were dry soils sapping runoff, preventing it from reaching rivers? The puzzle was missing pieces. Integrating more non-snow data into runoff projections might result in better forecasts.
A partnership began to coalesce in 2018 between the Yampa Valley Sustainability Council, Colorado Mountain College, and the Scripps Institution of Oceanography’s Center for Western Weather and Water Extremes. Guided by a team of 15, the collaboration yielded a pilot soil moisture and weather monitoring station in September 2022 near Stagecoach Reservoir. In 2023, with aid from the Colorado Water Conservation Board and the Colorado River District, two additional stations were installed in the basin. The team in early 2024 was working on six more stations upstream of Craig. The stations collect continuous soil moisture measurements and data on meteorological conditions with the goal of sharing that data so that stakeholders can make management choices about changing water supplies.
The aim, in part, was to generate new and valuable data that wasn’t being collected elsewhere, says the sustainability council’s Madison Muxworthy, the project manager. “We didn’t want to duplicate existing efforts, such as SNOTEL stations,” she says.
The sustainability council has collaborated with the NRCS to install more soil moisture sensors at SNOTEL stations to go along with snowpack, precipitation and temperature data. The team will install four stations this summer and two more in 2025.
It’s still too soon to know the results of this monitoring. Measurements obtained from these new stations may reveal short-term changes, but other insights may require 10 to 20 years of data.
A similar network of soil moisture stations already exists in Colorado’s Roaring Fork Valley. There, 10 stations have been installed in an elevation band of 5,880 feet from Glenwood Springs to above 12,000 feet at Independence Pass. All stations have sensors to monitor soil moisture at depths of 5, 20 and 50 centimeters, and monitor soil temperature at 20 centimeters deep. They also record air temperature, relative humidity, rainfall, and more, recording measurements at least hourly.
This network was created by the Aspen Global Change Institute in response to local interest in measuring soil moisture in the Roaring Fork watershed. In 2012, as bark beetles proliferated, scientists at a small meeting on forest health identified soil moisture as a critical, understudied component of ecosystem vitality. With more than a decade of measurements, the data may help answer questions about hydrology and ecology in mountain systems.
A rambunctious Fryingpan River in the vicinity of Norrie was in a hurry to get to Ruedi Reservoir in late June 2018. Photo credit: Allen Best/Big Pivots
Key research questions for the Roaring Fork network include how will climate change impact water availability and timing in the watershed? And how can in-situ soil moisture data be used in water supply forecasts and models to better inform decision making for water managers and cities?
Elise Osenga, the Aspen Global Change Institute’s community science manager, stresses the complexities of runoff now further confused by climate change. Soil moisture plays a role, but it’s among many factors.
“You’re trying to predict the future based on how conditions played with each other in the past,” explains Osenga. “And now in the future, different wrenches will be thrown into the system where the past may not be a perfect representation.”
If dry soils only tell a small percentage of the story of this runoff thievery, that’s where the institute’s microscope is being applied. “Finding the quantitative relationship between a dry soil and change in runoff is going to be hard because it’s a small percent to begin with. It’s not that it doesn’t matter, but it’s also not the silver bullet,” Osenga says.
Soil moisture refers to water held in the pores of soil. Going deeper – the depth varies but often begins around a meter down—takes you to a saturated zone of groundwater. Groundwater adds further complexity to the question about runoff prediction. Rosemary Carroll is conducting research on that interplay. She’s a research professor in hydrology affiliated with the Desert Research Institute but based at Colorado’s Mt. Crested Butte.
Groundwater, she says, moderates flows between the years of big water and high flows and those of lesser runoff. During the big years, the water goes into storage in the form of groundwater. It stabilizes flows.
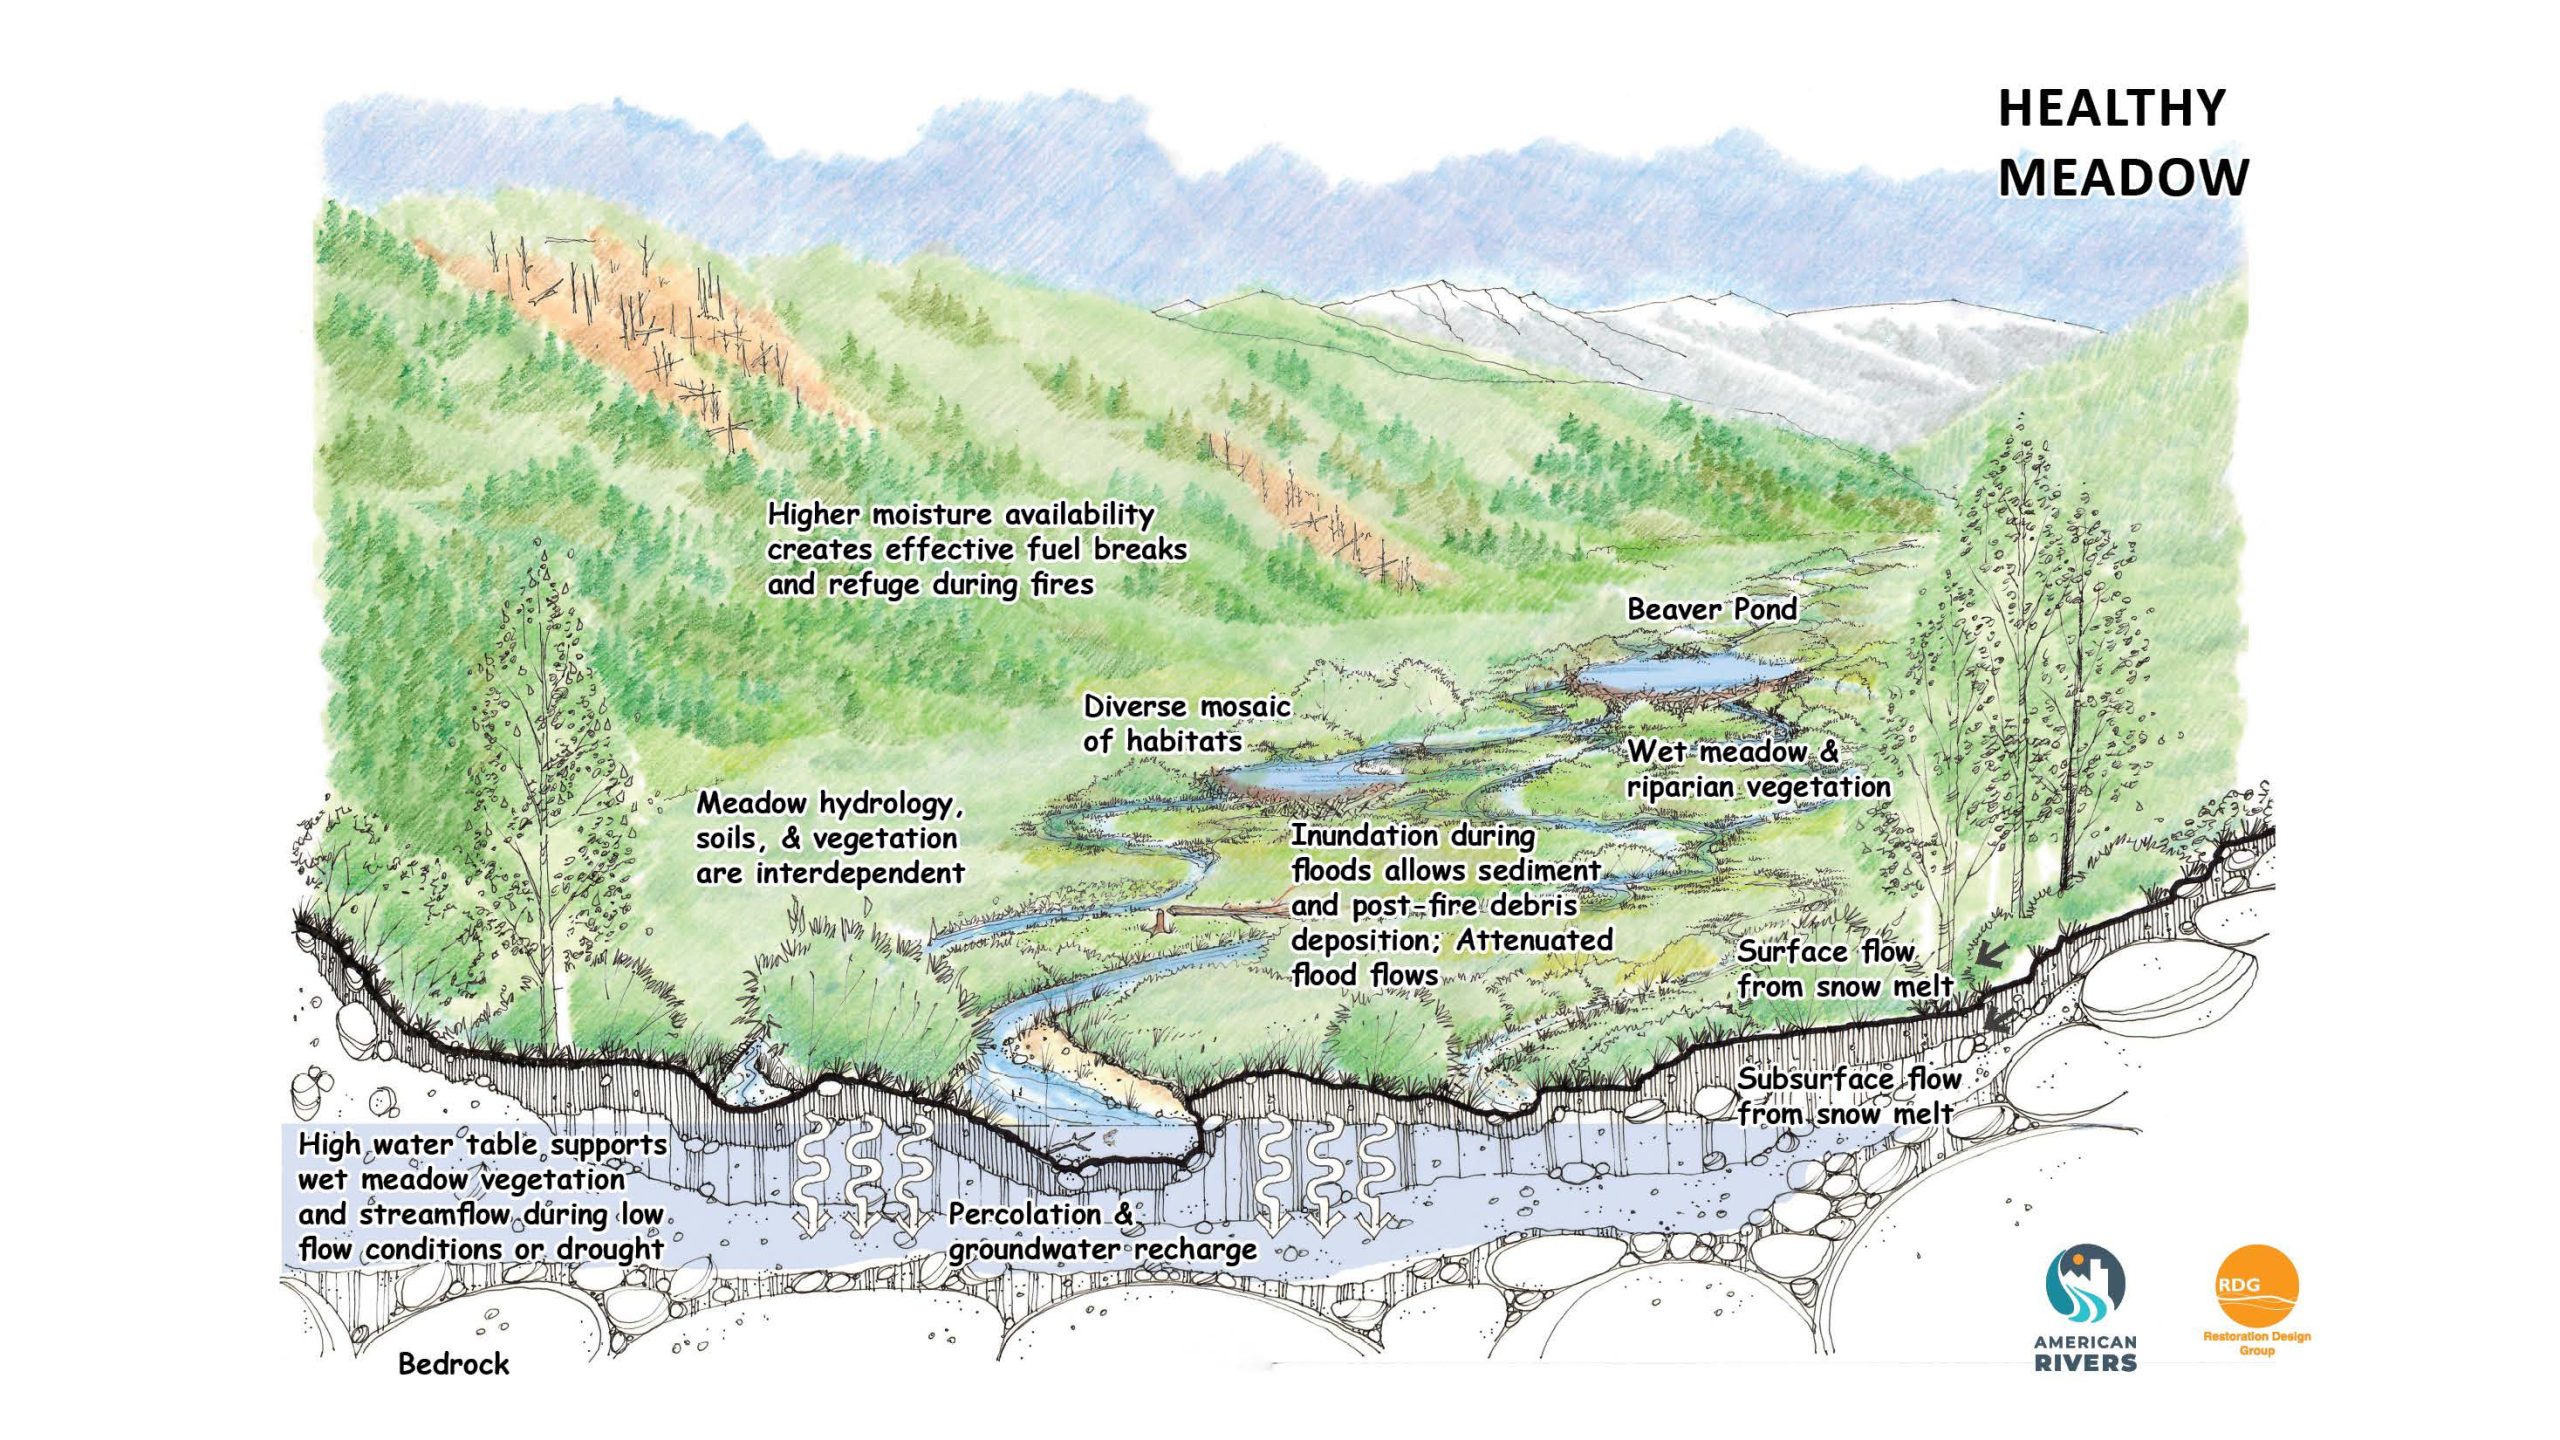
Healthy mountain meadows and wetlands are characteristic of healthy headwater systems and provide a variety of ecosystem services, or benefits that humans, wildlife, rivers and surrounding ecosystems rely on.
The complex of wetlands and connected floodplains found in intact headwater systems can slow runoff and attenuate flood flows, creating better downstream conditions, trapping sediment to improve downstream water quality, and allowing groundwater recharge. These systems can also serve as a fire break and refuge during wildfire, can sequester carbon in the floodplain, and provide essential habitat for wildlife. Graphic by Restoration Design Group, courtesy of American Rivers
But groundwater declines during hotter and drier years—think 2002, 2012 and 2018. Streamflow is sensitive to declines in groundwater storage, Carroll says, so flows also drop. Modeling that Carroll has worked on shows a loss of 30% in streamflows over the next century or so, assuming a 4 degree temperature increase.
Groundwater may seem to be on the margins of why runoff predictions on April 1 fail to materialize in July, but Carroll believes it needs to be part of the discussion. That connection will become more important in coming decades as temperatures continue to rise. “It’s really important, and it’s not often talked about,” she says.
Late season weather prediction accuracy
Despite all this research that seeks to narrow the uncertainty, uncertainty will remain in streamflow forecasting for the foreseeable future. That’s the conclusion drawn by Peter Goble, of the Colorado Climate Center, and Russ Schumacher, Colorado State Climatologist, in a study published in the Journal of Hydrometeorology December 2023 issue.
“What influences seasonal runoff more: antecedent soil moisture and groundwater conditions or meteorological conditions following April 1?” they asked. Sifting through evidence from 2020 and 2021, they reached a clear conclusion: “This study demonstrates that existing soil moisture and groundwater models are unlikely to provide ‘low-hanging fruit’ for improving forecasts.”
Improved weather forecasting skills will matter more, Goble and Schumacher said.
Weather forecasts are remarkably good for a week to 10 days. Beyond? Not so much. Will that change? Goble and Schumacher indicate little optimism.
Then there’s the shifting climate. If weather continues to become more variable, “that is only going to decrease our ability to predict ahead of time what the runoff is going to be,” Goodbody says. Too, if warmer winter temperatures produce more rain, there will be less snow to measure. “Then predictability by definition goes down until we actually can predict the future [after April 1] weather with more certainty,” Goodbody says.
The Little Snake River is about to join the Yampa River on Oct. 8, 2020. Photo credit: Allen Best/Big Pivots
Improved forecasts, however, won’t deliver more water. For management purposes, stored water still matters greatly. Consider the Yampa River after that three-wire winter of 2023. The rapidly slackening flows of the river through Steamboat during July surprised water managers and state officials. That year, the snowpack in the Yampa River Basin was dusty, moving the snow to melt and runoff to occur earlier than usual. Officials came close to closing the river to commercial fishing access, as they had the four previous years because of either low flows, high temperatures, or both.
Through a water lease agreement orchestrated by the Colorado Water Trust—a nonprofit that uses voluntary water-market transactions to restore streamflows—the Upper Yampa district released between 18 cubic feet per second and 40 cfs from Stagecoach from late August through late October to keep the Yampa flowing and at a cooler temperature. This added water helps the City of Steamboat Springs stay in compliance with federal water quality standards governing stream temperatures below the city’s wastewater treatment plant. It also benefits fish and those angling at them.
“We thought we were in great shape and thought we wouldn’t need [special] releases out of Stagecoach [Reservoir],” says Julie Baxter, water resources manager for the City of Steamboat Springs.
“It was definitely a big surprise.”
This story was published in the Spring 2024 issue of Headwaters magazine, a publication of Water Education Colorado. See the full contents here.