
Click the link to read the report on the NOAA website:
Temperature
NOAA’s National Centers for Environmental Information calculates the global temperature anomaly every month based on preliminary data generated from authoritative datasets of temperature observations from around the globe. The major dataset,NOAAGlobalTemp version 6.0.0, uses comprehensive data collections of increased global area coverage over both land and oceansurfaces. NOAAGlobalTempv6.0.0 is a reconstructed dataset, meaning that the entire period of record is recalculated each month with new data. Based on those new calculations, the new historical data can bring about updates to previously reported values. These factors, together, mean that calculations from the past may be superseded by the most recent data and can affect the numbers reported in the monthly climate reports. The most current reconstruction analysis is always considered the most representative and precise of the climate system, and it is publicly available through Climate at a Glance.
July 2025
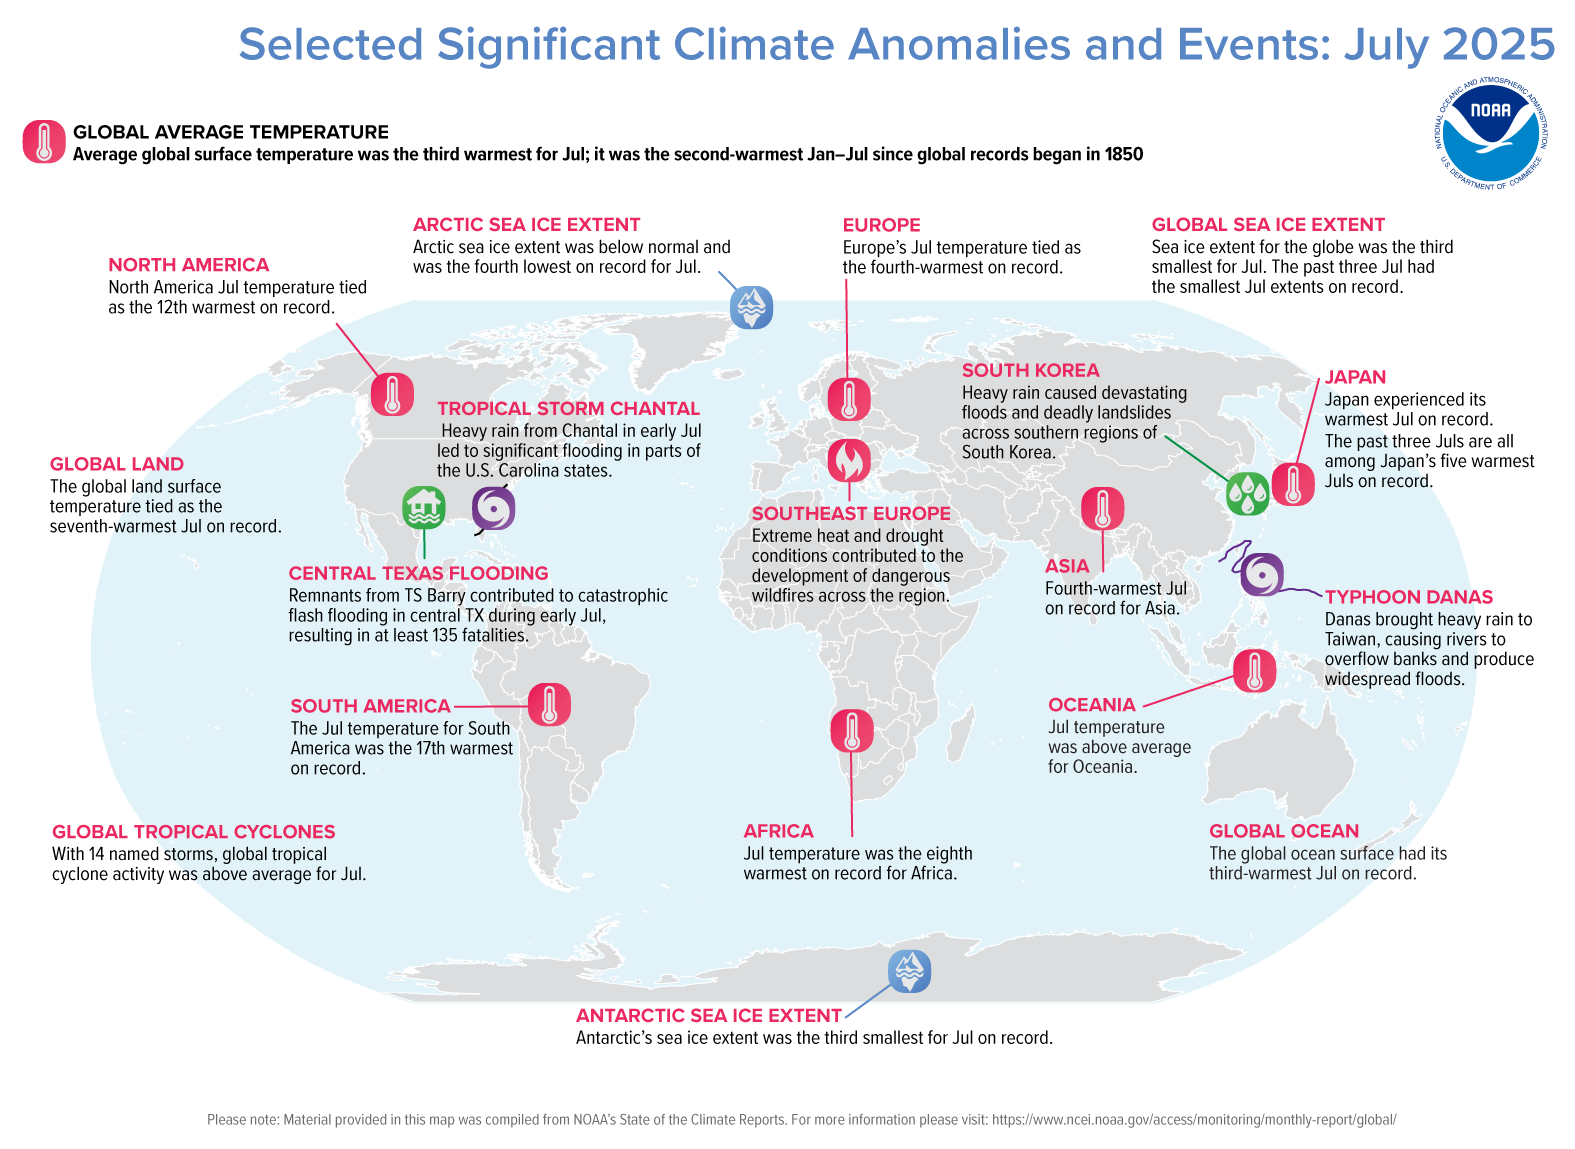
July 2025 recorded a global surface temperature 1.00°C (1.80°F) higher than the 20th-century average, making it the third-warmest July since records began in 1850. Only July of 2024 (warmest) and July 2023 were warmer. All ten warmest Julys on record have occurred since 2016. July 2025 also marks the 49th consecutive July with above-average global temperatures.

The global ocean-only surface temperature for July was the third-highest on record, at 0.92°C (1.66°F) above average. This was cooler than July 2023 (warmest) and July 2024. For land areas, the global land-only surface temperature in July tied as the seventh-warmest on record, at 1.20°C (2.16°F) higher than the 20th-century average. This was the smallest July land temperature anomaly since 2019 and the smallest for any month since December 2022 (+1.16°C / +2.09°F).
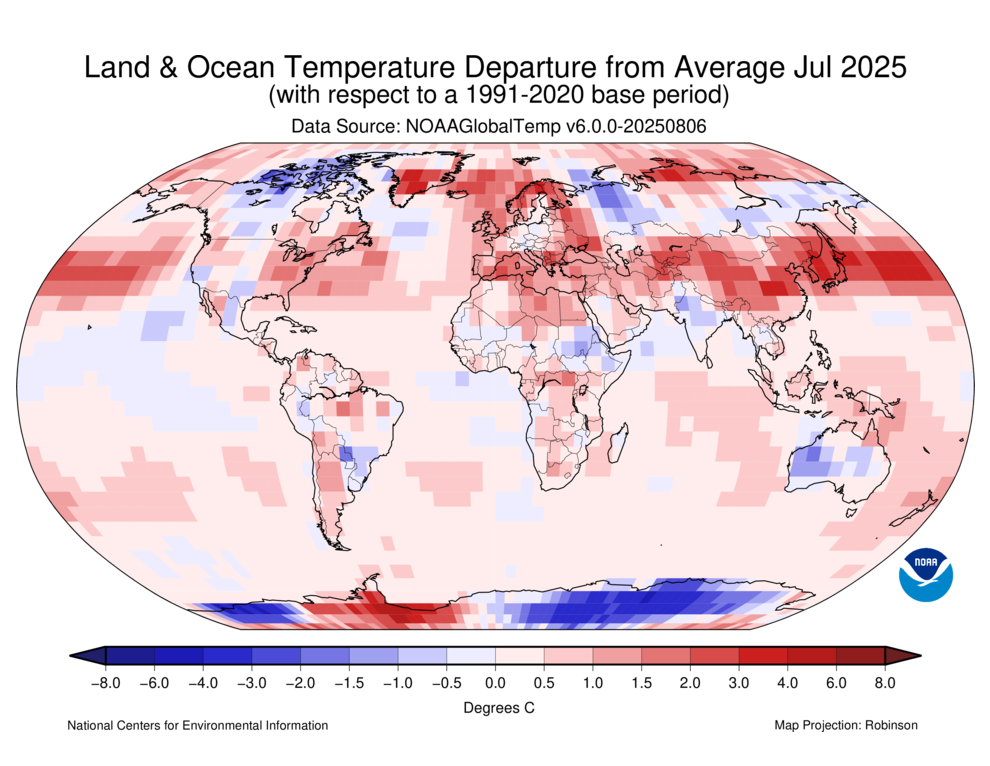
A smoothed map of blended land and sea surface temperature anomalies is also available.
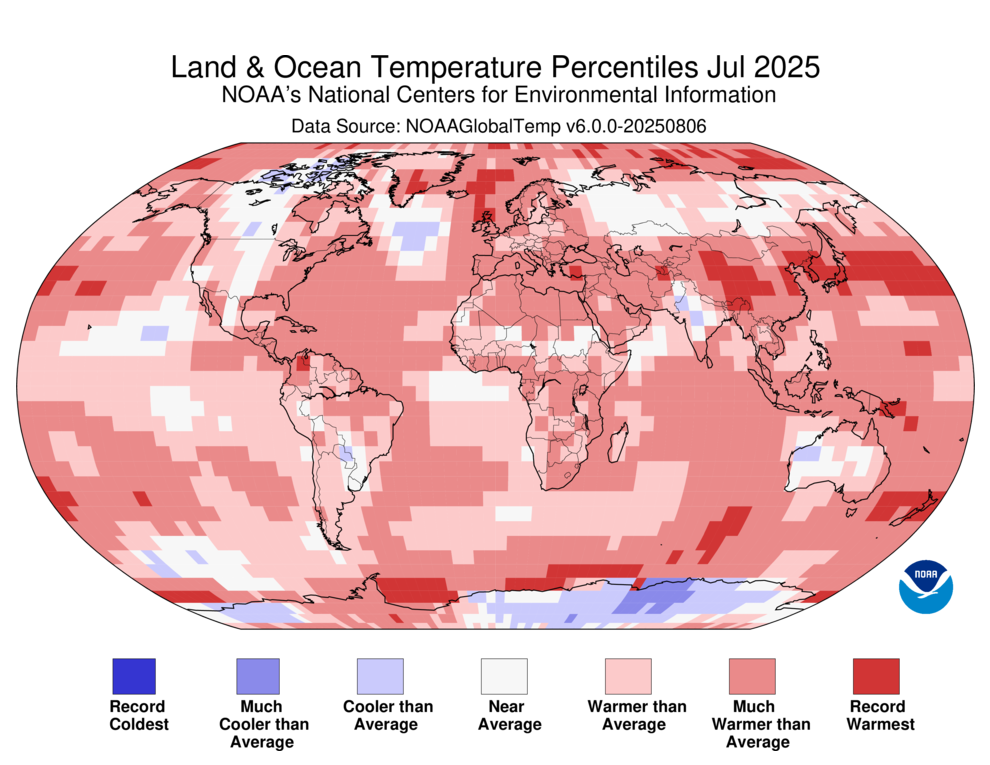
In July 2025, most of the globe experienced much-warmer-than-average temperatures. The most significant high temperature anomalies, exceeding 1.0°C (1.8°F) above average, occurred over Europe, southern Asia, the northern Pacific Ocean, and parts of North and South America, central-western Antarctica, and the North Atlantic Ocean. Record-high July temperatures were limited to areas within southern and eastern Asia, the Arctic region, the western and southern Pacific Ocean, and parts of the Southern Ocean. Overall, record-high July temperatures were observed across close to 6% of the Earth’s surface.
In contrast, parts of northern North America, the North Atlantic, India, and western and eastern Antarctica had cooler-than-average conditions during July 2025. Notably, no land or ocean areas recorded record-cold July temperatures.
Regionally, Asia and Europe (tied) had their fourth-warmest July on record. The Arctic region, Africa, and the Caribbean region had their seventh-warmest, eighth-warmest, and ninth-warmest (tied) July on record, respectively. North America, South America, Oceania, and the Hawaiian region all had above-average July temperatures, though none ranked among their ten warmest Julys on record. Contrasting with other regions, the Antarctic region had a slightly below-average July temperature departure of -0.02°C (-0.04°F). This was the coldest July for the region since 2016.
July temperature summaries provided by national meteorological services and media reports include:
- The average temperature in the United Kingdom (U.K.) for July 2025 was 16.8°C (62.2°F), which is 1.5°C (2.7°F) above average. This ranked as the nation’s fifth-warmest July on record. Minimum (nighttime) temperatures were notably high, with the U.K. experiencing its second-warmest July on record for minimum temperatures, according to the Met Office.
- Ireland experienced its ninth-warmest July on record, and the 12th-warmest month overall in 126 years of record-keeping. The temperature was 1.21°C (2.18°F) above the 1991–2020 average. Notably, Ireland’s five warmest Julys have all occurred since 2001.
- In July 2025, the Kingdom of Bahrain recorded an average temperature of 36.1°C (97.0°F). This temperature was 1.0°C (1.8°F) above the monthly average and was the sixth-highest July mean temperature since national records began in 1902. Additionally, it was reported that Bahrain experienced 18 days in July where maximum temperatures surpassed 40°C (104°F).
- Australia recorded an above-average national temperature in July, at 0.60°C (1.08°F) above normal. However, this did not place it among the ten warmest Julys on record for the country. All of Australia’s states experienced above-average mean temperatures for July. Western Australia’s mean temperature, at 0.07°C (0.13°F) above average, was the lowest since 2016.
- Most of New Zealand experienced above-average temperatures during July 2025, resulting in a national average temperature of 9.2°C (48.6°F), or 1.1°C (2.0°F) above average. This was New Zealand’s fourth-warmest July since national records began in 1909. Nine locations had their warmest July on record.
- Japan experienced an intense heat wave in July, with maximum temperatures above 35°C (95°F). July 30 became Japan’s hottest day on record with maximum temperatures reaching 41.2°C (106.2°F) in Tamba, Hyōgo Prefecture (Central Japan). This surpassed the previous record from 2018 and 2020 by a narrow margin of 0.1°C (0.2°F). Heat stroke alerts were reportedly issued for 33 of Japan’s 47 prefectures. As a result of the heat, more than 10,800 people were hospitalized with heat-related illnesses. Additionally, July 2025 was Japan’s warmest July on record, with temperatures averaging 2.89°C (5.20°F) above normal. This surpassed the previous record, set in 2024, by 0.73°C (1.31°F). The past three years (2023, 2024, and 2025) are all among Japan’s five warmest years on record.
- South Korea experienced a significant heat wave in mid to late July, leading to record-breaking temperatures. Notably, Seoul recorded a new high of 22 tropical nights (minimum temperatures above 25°C / 77°F), surpassing the 1994 record of 21 since records began in 1907. One of these nights saw a record-breaking low of 29.3°C (84.7°F), marking the hottest July night on record. Media reports indicated the extreme heat caused record power demand.
- Persistent above-average temperatures affected Greece and Turkey from mid- to late July. Temperatures consistently exceeded 35°C (95°F), with some weather stations recording over 40°C (104°F). In Greece, popular tourist attractions were closed due to lingering extreme temperatures. On July 25, a new all-time national maximum temperature record for Turkey was set in Silopi, reaching 50.5°C (122.9°F). This shattered the previous record from August 2023 by 1.0°C (1.8°F) and marked the first time a temperature of 50°C (122°F) was recorded in Turkey. The extreme heat and drought conditions contributed to the development of dangerous wildfires across the region.
Year-to-date Temperature: January–July 2025
The global surface temperature for January–July 2025 was the second-highest in NOAA’s 176-year record, at 1.18°C (2.12°F) above the 20th-century average. This is just 0.10°C (0.18°F) shy of tying the record set from January–July 2024. A statistical analysis by NCEI scientists indicates a very high likelihood (greater than 99% chance) that the year 2025 will be among the five warmest years on record, with less than a 1% chance of being the warmest year on record.
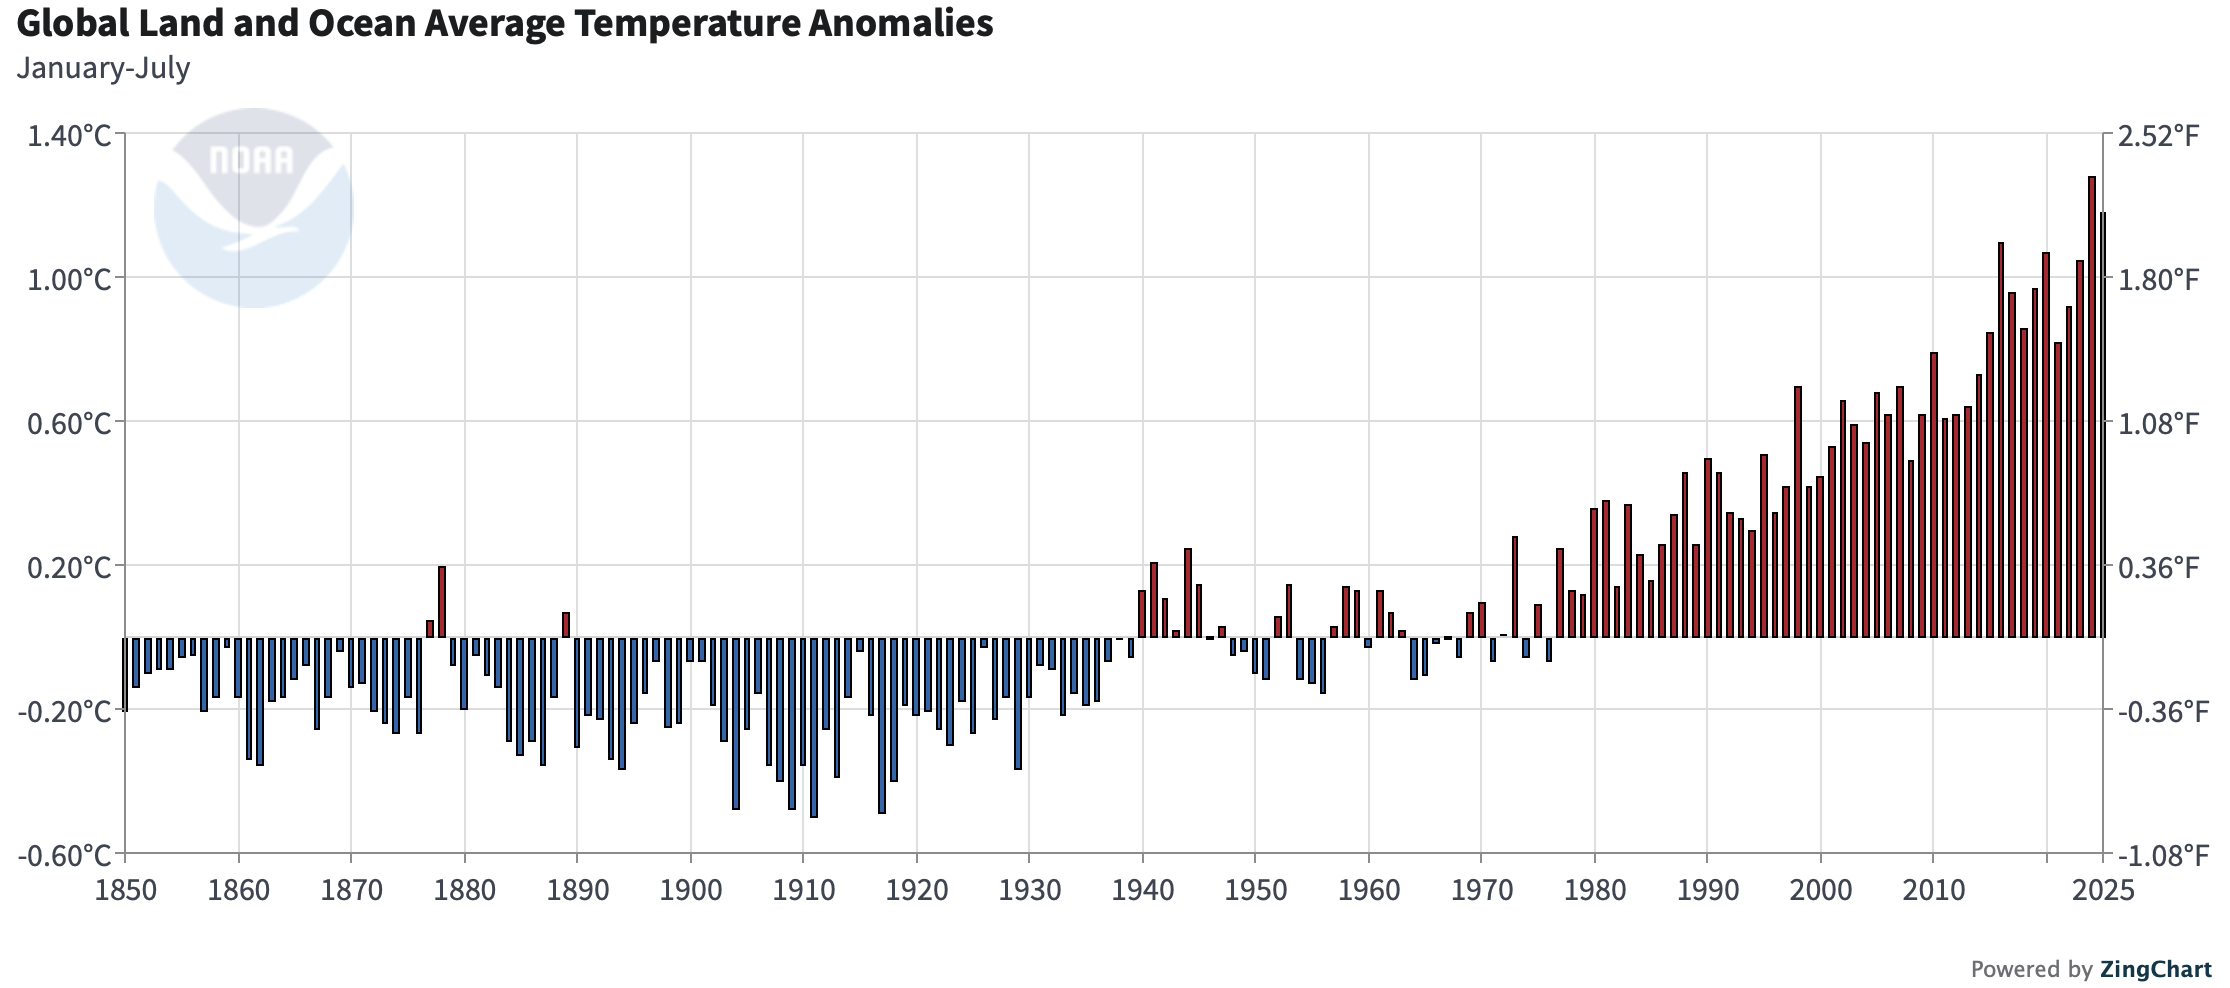
Separately, both the global land-only and global ocean-only temperatures for January–July were the second warmest on record. For both, only January–July of 2024 was warmer.
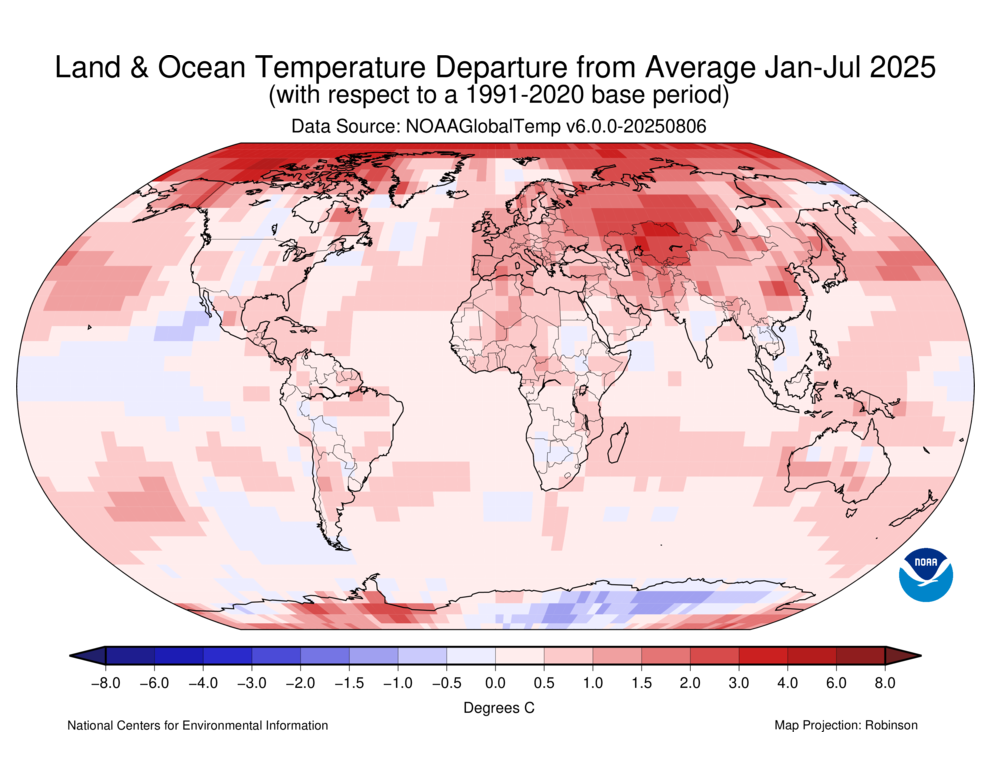
A smoothed map of blended land and sea surface temperature anomalies is also available.
During January–July 2025, warmer-than-average temperatures were prevalent across much of the Earth’s land and ocean surfaces. The most significant high-temperature anomalies, 1.5°C (2.7°F) above average or higher, were observed in the Arctic region, northern North America, much of Asia, and western and eastern parts of Antarctica. Record-high temperatures for the January–July period were observed in western Europe, the British Isles and the surrounding North Atlantic Ocean, across parts of the Arctic and western Antarctic regions, southern Asia, southwestern and southern Australia, the western and central Pacific Ocean, and the Indian Ocean.
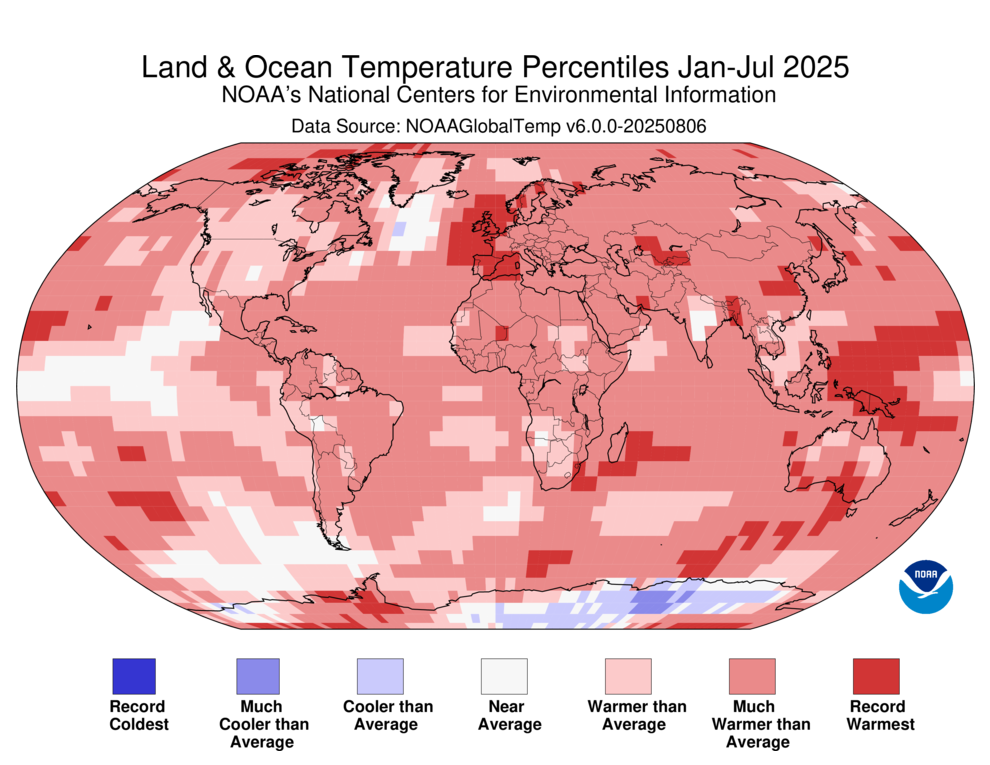
In contrast, based on the percentiles map, cooler-than-average temperatures during this seven-month period were largely confined to central and eastern Antarctica. However, no land or ocean areas experienced record-cold temperatures during January–July.
During January–July 2025, several regions saw notably high temperatures. Europe, Asia, Oceania, and the Arctic region each recorded their second-warmest January–July period on record. Africa and the Caribbean region had their fourth-warmest, the Hawaiian region its fifth-warmest, and North America’s year-to-date temperature tied as the sixth-warmest on record. South America’s year-to-date temperature tied as the seventh-warmest on record. Although the Antarctic region had an above-average January–July temperature, it did not rank among its ten warmest on record.
Precipitation
Precipitation data from the Global Historical Climatology Network (GHCN)-Monthly are augmented by data with greater spatial coverage from the Global Precipitation Climatology Project (GPCP).
July 2025
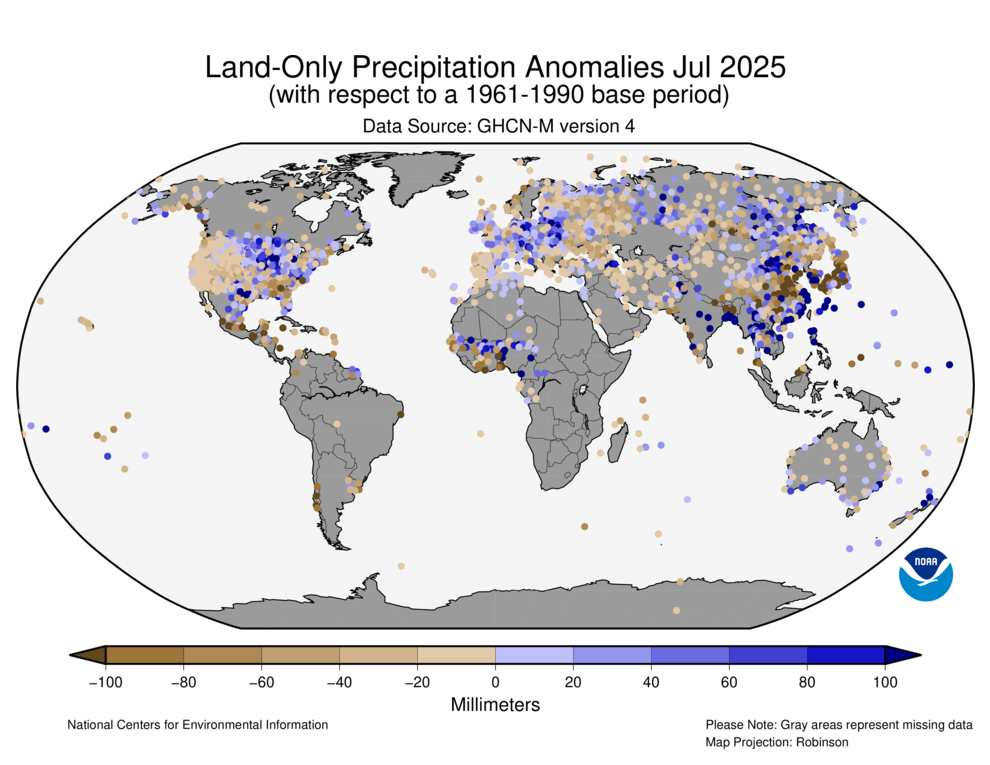
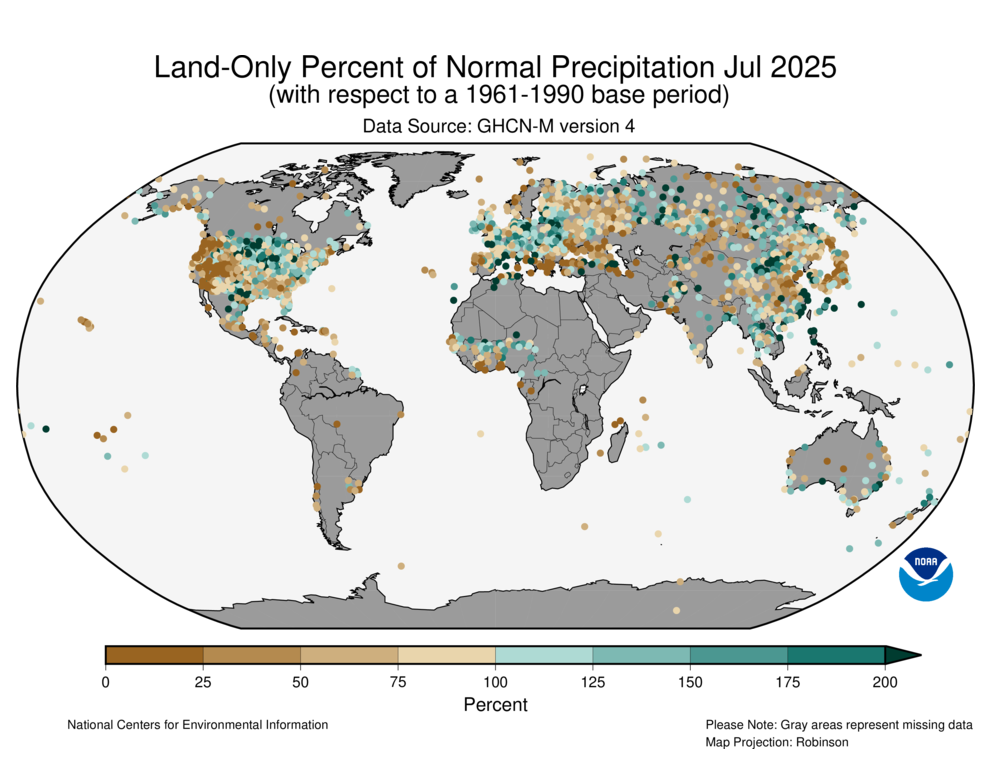
As is typical, precipitation patterns varied globally during July 2025. Drier-than-average conditions were observed across the western, southeastern parts of the contiguous U.S., Alaska and Hawaii, southern Mexico, southern Europe, central parts of Australia, and across parts of western and central Asia. Eastern Asia, however, experienced contrast in precipitation totals, with some locations along the eastern coast and the northeast receiving more than double the monthly average precipitation. Wetter-than-average July conditions were also observed across the northern and northeastern contiguous U.S., northern Mexico, the British Isles, central and northeastern Europe, central and southeastern Russia, and across northeastern and southeastern Asia.
July precipitation summaries provided by national meteorological services and media reports include the following:
- Precipitation varied across Australia in July; however, the nation as a whole experienced a slightly wetter-than-average month. Regional differences were notable: Queensland, Tasmania, and the Northern Territory had drier-than-average conditions, while New South Wales, Victoria, and South Australia had wetter-than-average conditions. According to Australia’s Bureau of Meteorology, South Australia recorded its wettest July since 1998, and New South Wales and Victoria had their wettest July since 2010 and 2016, respectively.
- On July 6, Typhoon Danas, an equivalent Category 3 typhoon, made landfall on Taiwan’s central-western coast. This was reportedly the first typhoon to make landfall in Chiayi County in nearly 120 years. Danas brought heavy rainfall to affected areas, including southern Taiwan, where rainfall totals reached 500–600 mm (20–24 inches). The torrential rain caused rivers, including the Gangkou River, to overflow their banks, leading to flash floods that submerged homes, roads, and farmlands, and damaged infrastructure. The storm also disrupted power, water, and communication services.
- During mid- to late July, thunderstorms brought heavy rain and flooding to parts of the United Kingdom (U.K.). Several locations in Northern Ireland experienced their wettest July day on record; notably, Killowen received 69 mm (2.7 inches) and Murlough received 61 mm (2.4 inches) on a single day. Across England, Wales, Scotland, and Northern Ireland, the floods caused major property damage and transportation disruption.
- The state of Jalisco, Mexico, was affected by heavy rain and flash floods during July 14–18. Reports stated that over 100 homes were damaged.
- From July 16–21, heavy rain caused devastating floods and deadly landslides across southern regions of South Korea. During this six-day period, affected areas reportedly received 600–800 mm (24–31 inches) of rain, setting numerous records. More than 10,000 residents evacuated their homes. The floods submerged roads and farmland, damaged or destroyed thousands of homes and buildings, and resulted in the loss of approximately 1.5 million livestock. At least 19 people died, with the death toll expected to rise.
- Torrential rain from severe thunderstorms affected parts of northern and central France during July 23–24. Notably, Bohain-en-Vermandois, Aisne, in northern France received nearly a month’s worth of rain (70–80 mm / about 3 inches) in just one hour on July 23. This intense rainfall caused floodwater to rise rapidly, inundating homes and streets and damaging infrastructure.
- China experienced several heavy rainfall events during July 2025. These events included:
- Remnants of Typhoon Dana, in combination with the East Asian monsoon, brought heavy rain to parts of southern and eastern China on July 10, according to reports. This resulted in floods, affecting approximately 10,000 people in Sichuan and Yunnan provinces. Reports indicated that 25 rivers exceeded alarming levels, with the Chishui River in Guizhou province reaching its highest recorded level since 1953 and the Xiaocao River reaching a 29-year high. One county in Yunnan province had 227.8 mm (9.0 inches) of rain fall in a 24-hour period — the highest single-day total since 1958. In addition to floods, the intense rainfall triggered landslides, leading to evacuations and property damage.
- Typhoon Wipha made landfall in Guangdong province, southern China, on July 20 as an equivalent Category 1 storm. It weakened as it moved southwest and made landfall in northern Vietnam on July 22 as a tropical storm. Wipha brought heavy rain and strong winds to the affected areas, resulting in uprooted trees, power outages, disrupted travel, damaged infrastructure, and in some instances, triggering landslides.
- Storms brought nearly a year’s worth of rainfall—about 449 mm (17.7 inches)—to Baoding City in northern China within a 24-hour period (July 24–25). Reports indicate that Baoding’s annual average precipitation is slightly over 500 mm (19.7 inches). The torrential rain triggered flash floods, caused power outages, and damaged bridges and roads. Over 19,000 people were evacuated from the affected regions.
- In late July, strong storms brought torrential rain and catastrophic flooding to Beijing and neighboring provinces, affecting over 300,000 people. Beijing’s Miyun district was hard hit, receiving nearly a year’s worth of rain in just a few days. This caused rivers to overflow and resulted in deadly flash floods, which tragically killed at least 31 people at an Elderly Care Center. Reports indicate the Miyun Reservoir reached its highest level since 1959. The floodwaters also damaged roads and infrastructure, disrupting power and communication services.
References
- Adler, R., G. Gu, M. Sapiano, J. Wang, G. Huffman 2017. Global Precipitation: Means, Variations and Trends During the Satellite Era (1979-2014). Surveys in Geophysics 38: 679-699, doi:10.1007/s10712-017-9416-4
- Adler, R., M. Sapiano, G. Huffman, J. Wang, G. Gu, D. Bolvin, L. Chiu, U. Schneider, A. Becker, E. Nelkin, P. Xie, R. Ferraro, D. Shin, 2018. The Global Precipitation Climatology Project (GPCP) Monthly Analysis (New Version 2.3) and a Review of 2017 Global Precipitation. Atmosphere. 9(4), 138; doi:10.3390/atmos9040138
- Gu, G., and R. Adler, 2022. Observed Variability and Trends in Global Precipitation During 1979-2020. Climate Dynamics, doi:10.1007/s00382-022-06567-9
- Huang, B., Peter W. Thorne, et. al, 2017: Extended Reconstructed Sea Surface Temperature version 5 (ERSSTv5), Upgrades, validations, and intercomparisons. J. Climate, doi: 10.1175/JCLI-D-16-0836.1
- Huang, B., V.F. Banzon, E. Freeman, J. Lawrimore, W. Liu, T.C. Peterson, T.M. Smith, P.W. Thorne, S.D. Woodruff, and H-M. Zhang, 2016: Extended Reconstructed Sea Surface Temperature Version 4 (ERSST.v4). Part I: Upgrades and Intercomparisons. J. Climate, 28, 911-930, doi:10.1175/JCLI-D-14-00006.1.
- Menne, M. J., C. N. Williams, B.E. Gleason, J. J Rennie, and J. H. Lawrimore, 2018: The Global Historical Climatology Network Monthly Temperature Dataset, Version 4. J. Climate, in press. https://doi.org/10.1175/JCLI-D-18-0094.1.
- Peterson, T.C. and R.S. Vose, 1997: An Overview of the Global Historical Climatology Network Database. Bull. Amer. Meteorol. Soc., 78, 2837-2849.
- Vose, R., B. Huang, X. Yin, D. Arndt, D. R. Easterling, J. H. Lawrimore, M. J. Menne, A. Sanchez-Lugo, and H. M. Zhang, 2021. Implementing Full Spatial Coverage in NOAA’s Global Temperature Analysis. Geophysical Research Letters 48(10), e2020GL090873; doi:10.1029/2020gl090873.