As evaporation rates increase and inflow from the Colorado River falls, Lake Mead’s water volume will shrink but the total mass of dissolved minerals will remain relatively stable. This creates a concentration effect where minerals like calcium, magnesium, and salts, become more densely packed in the remaining water. Without sufficient fresh inflow to dilute these minerals, the water becomes increasingly “hard,” reaching salinity levels that pose significant challenges for regional water management.1
This increasingly hard water is a silent but growing threat to household appliances owned by residents of Las Vegas, because when hard water is heated or left to evaporate, minerals like calcium and magnesium precipitate out of the liquid, forming a rock-hard crust known as limescale. This buildup acts as an insulator in water heaters, forcing them to work harder to heat water, and clogs the delicate internal components of dishwashers and washing machines. Over time, these deposits restrict water flow and corrode seals, leading to premature mechanical failure and leaks.2
The financial burden of these mineral-heavy waters translates to shorter lifecycles for major appliances and higher utility bills. Residents may find themselves replacing water heaters every 8 years instead of the typical 12 to 15, and the efficiency loss from scale buildup can increase energy costs for water heating by as much as 25%. Between more frequent appliance replacements, the cost of professional plumbing repairs, and the potential need for expensive water softening systems, the long-term economic impact on a single household can reach thousands of dollars.3
While drinking water with elevated TDS is generally considered safe by regulatory standards, it can have some noticeable effects. Very high concentrations of minerals like sulfates can cause a laxative effect or gastrointestinal discomfort in sensitive individuals or those unaccustomed to the water. While the body requires minerals like calcium and magnesium, excessive levels can affect the water’s smell and its taste, which may motivate residents to rely more on bottled water or on in-home filtration units like reverse-osmosis, which incrementally drives up the cost of living.4
A 2013 complaint that Texas was being deprived by New Mexico of its equitable apportionment of Rio Grande Compact water has finally been resolved and the compact decree approved by the special master in the case.
In a Fourth Interim Report dated Feb. 6, Hon. D. Brooks Smith agreed with the negotiated settlement by the states and the federal government that specifies how much compact water released by Colorado ends up with New Mexico and how much with Texas.
The proposed compact decree, which has to be accepted by the U.S. Supreme Court, employs use of the “Effective El Paso Index (‘Index’),” which provides a means of tracking the movement of water below Elephant Butte Reservoir for Texas’ accounting.
“Much like the river whose water the parties have quarreled over for decades, this original action has proceeded in a meandering fashion. First articulated by Texas in its 2013 Complaint, the dispute, in some sense, began about 8,000 years ago, in ancient Mesopotamia, when the Sumerians invented the concept of irrigation and incited a run on Earth’s navigable waterways,” Smith wrote in his report to the U.S. Supreme Court.
For its part, New Mexico countered that it was “excess water consumption in Texas” that interfered with the compact reporting. The standoff between the two states, with Colorado as a third party, lasted until July 3, 2023, when then-Special Master Michael J. Melloy issued a Third Interim Report (“TIR”) on the matter, which began: “Texas, New Mexico, and Colorado . . . have filed a joint motion to enter a consent decree compromising and settling ‘all claims among them arising from the 1938 Rio Grande Compact.’”
The proposed 2023 compact decree was filed with the U.S. Supreme Court, which rejected it at the request of the federal government, and appointed a new special master in Smith. He brought the states and federal government back together for another round of talks, and in June of 2025 visited the lower Rio Grande to talk to farmers and to familiarize himself with the features of the basin.
“I am grateful to the parties, the amici, and all of counsel for their cooperative efforts in organizing and carrying out what was a highly informative and comprehensive real-time view of both the waters of the Lower Rio Grande and the Project,” Smith wrote in his report.
The Effective El Paso Index (“Index”), which is a feature of the proposed compact decree, measures compliance based on the amount of water that actually passes through the El Paso Gage.
“I am pleased that the Special Master has recommended the U.S. Supreme Court accept the parties’ proposed settlement of the Rio Grande Compact litigation. The settlement is the result of collaboration between Texas, New Mexico, Colorado, and the United States; it includes entry of a proposed Compact Decree and dismissal of the United States’ claims,” said Colorado Attorney General Phil Weiser. “I appreciate the Special Master’s thoughtful engagement in the matter and his recommendation supporting this collaborative result. His recommendation gets even closer to the finish line.”
The last step will be a decision from the Supreme Court, which Weiser said he hopes to receive by June.
Map showing new point to deliver Rio Grande water between Texas and New Mexico, at an existing stream gage in East El Paso. (Courtesy of Margaret “Peggy” Barroll in the joint motion)
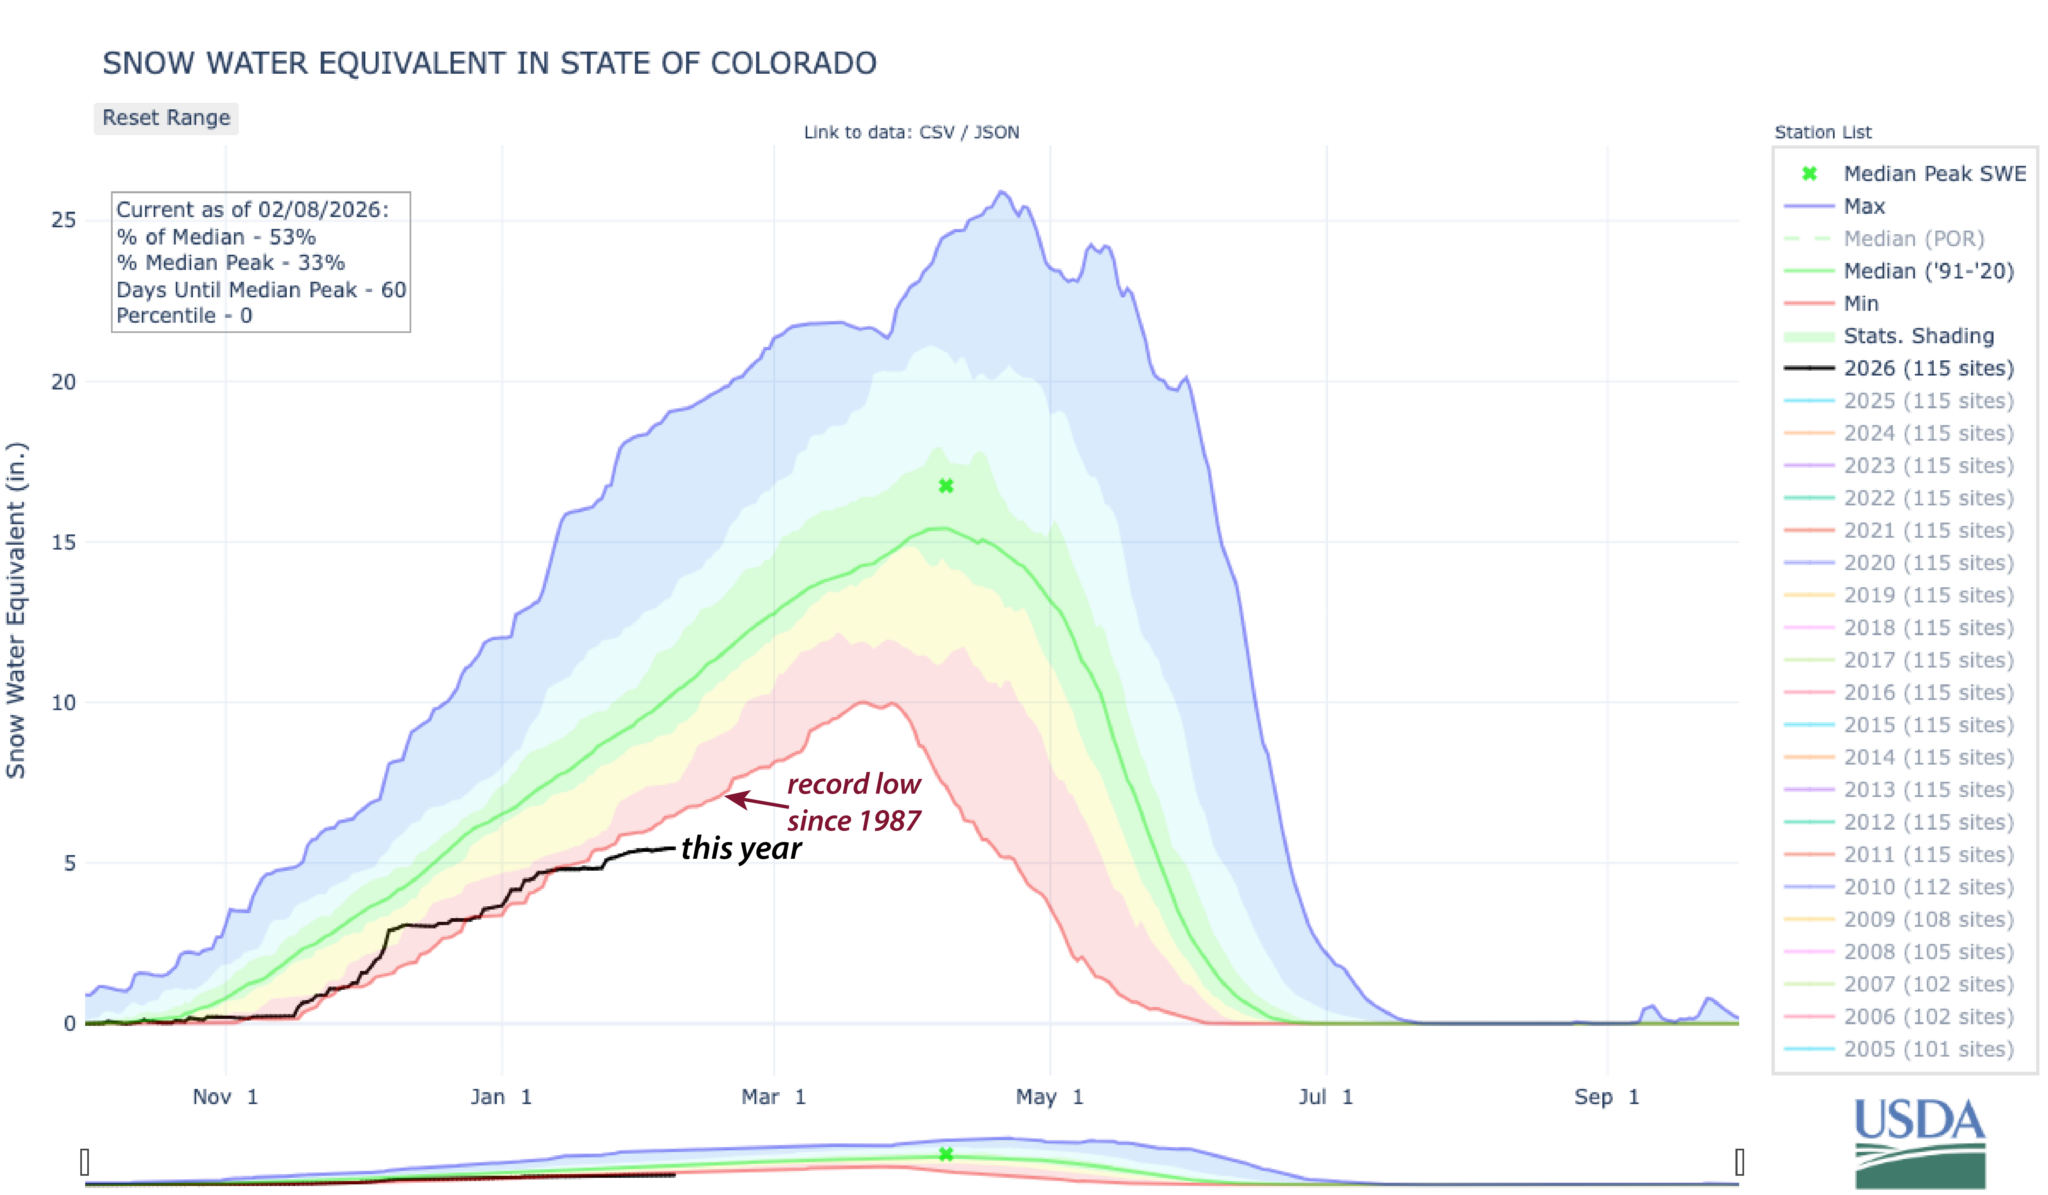
Colorado’s mountain snowpack is in bad shape this year. It’s been extremely warm, and snowstorms have been few and far between. Based on data from the SNOTEL network, the amount of water stored in the snow is the lowest at this point in the winter since at least 1987. Sometimes when one part of the state is lacking for snow, another region is doing ok, but not this year. Essentially all of Colorado is in a snow drought.
Graph of snow water equivalent for the state of Colorado as of February 7, 2026, based on 115 automated SNOTEL stations. The current year (2026) is in black, and as of early February is lower than all other years going back to 1987. Graph from USDA/NRCS.
Snow droughts have been getting more common in Colorado in the 21st century. But those who have been around Colorado longer than I have may also remember two other terrible winters for snow: 1976-77 and 1980-81. In fact, some photos sit on my desk from former state climatologist Nolan Doesken from tours through the mountains in those years. At that time, snowmaking was uncommon at the ski resorts, and there were serious concerns about whether the ski industry would survive through those two historic snow droughts. (This story from 2012 by Jason Blevins, then at the Denver Post, now at the Colorado Sun, has some relevant background.) We’ve been fielding quite a few questions about how the snowpack this winter compares to those brutal years, so let’s take a closer look.
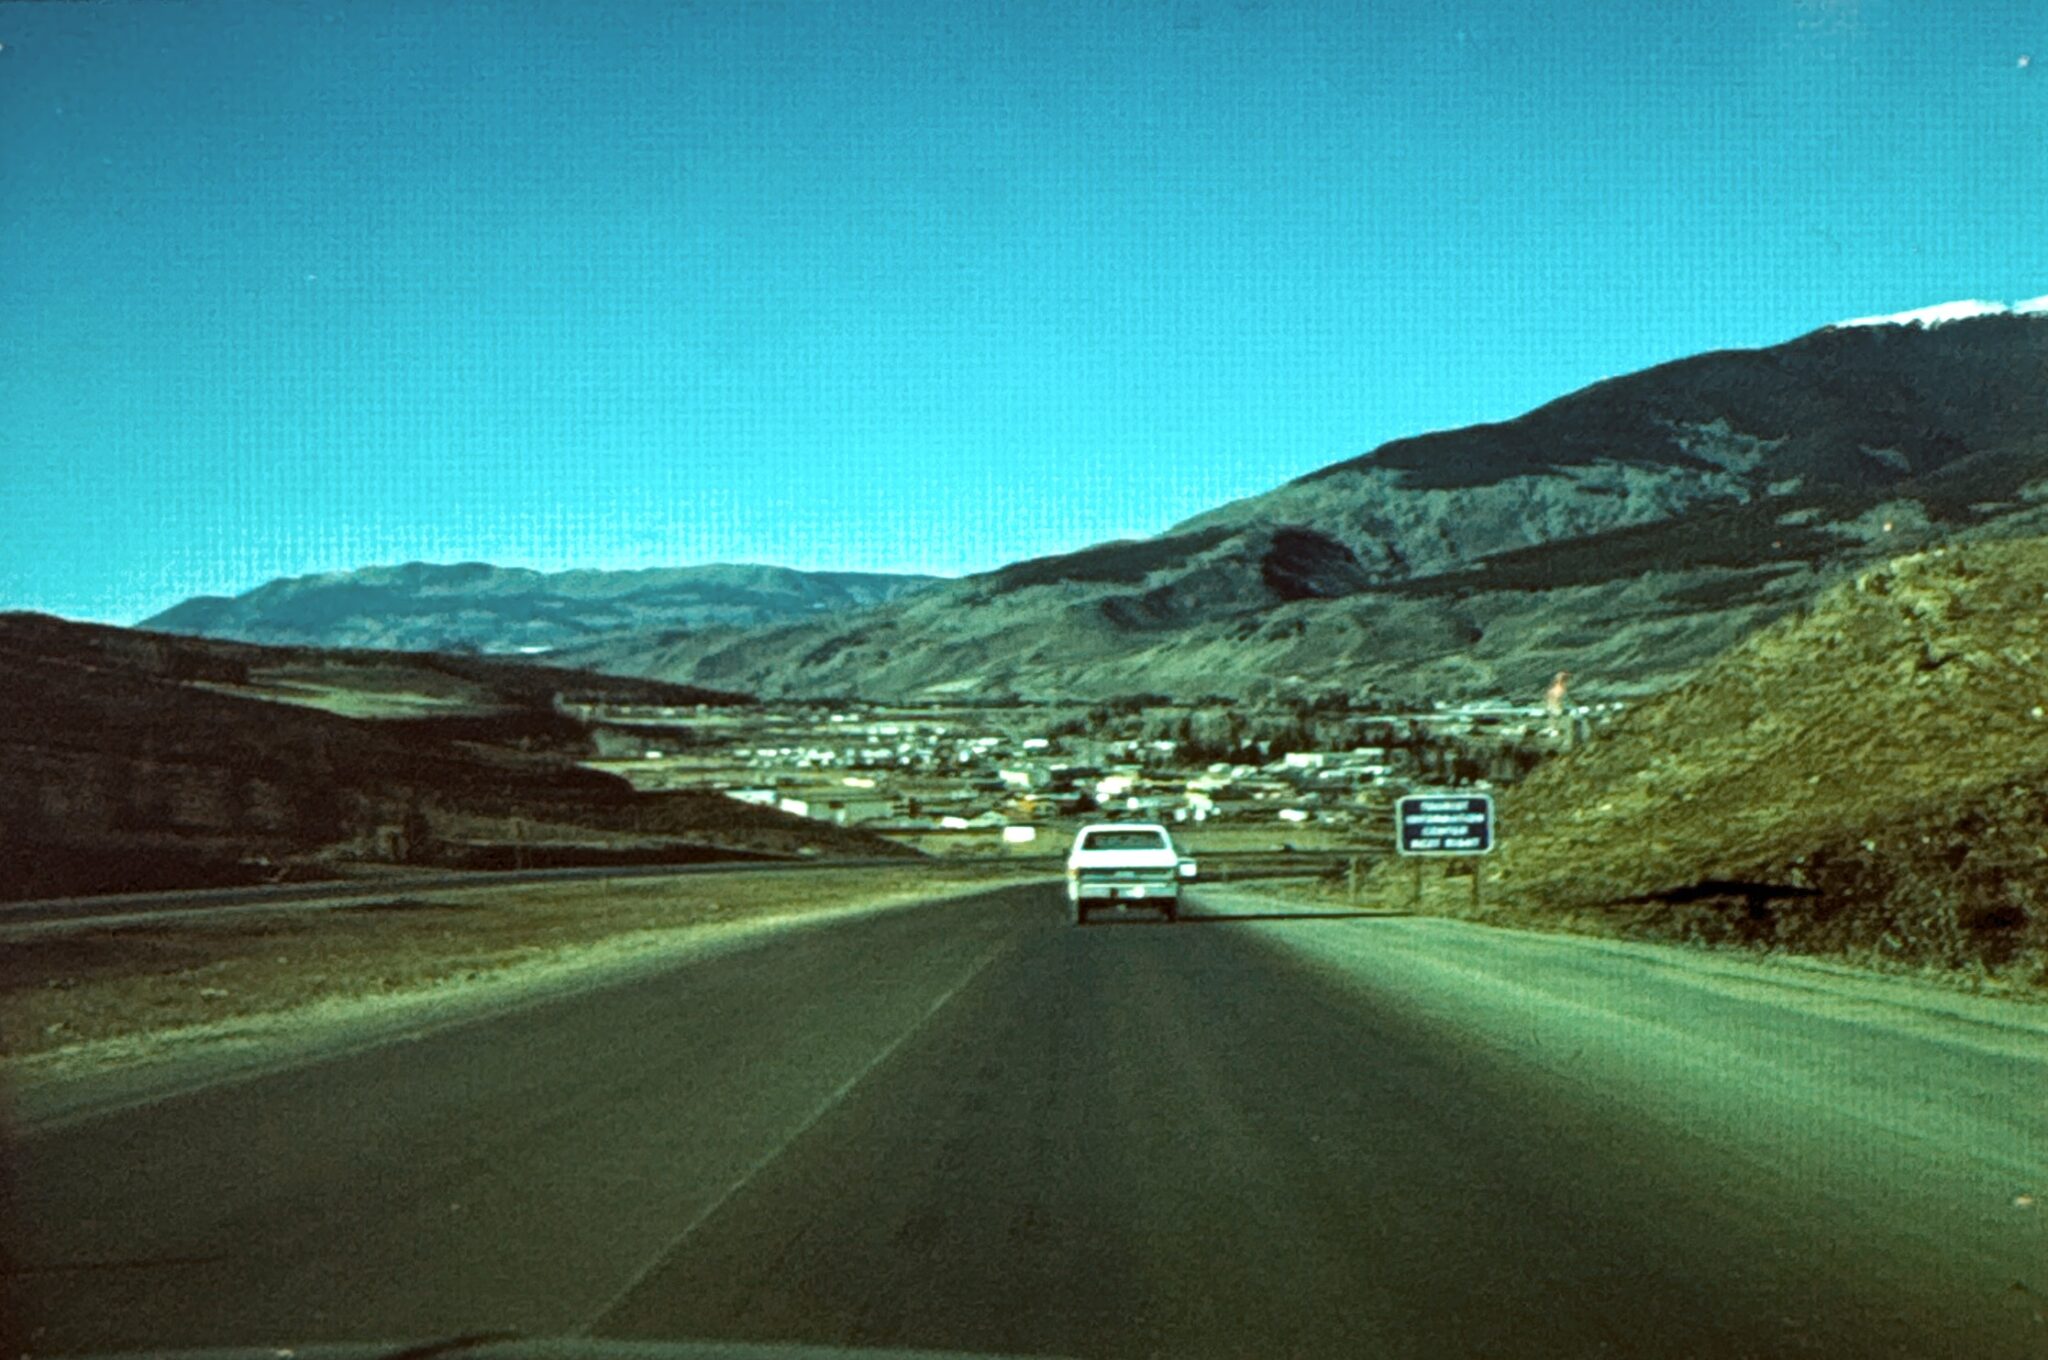
Slides of photos of “Drought, 1/21/81”, provided by Nolan Doesken
Photo from 1/21/1981, approaching Dillon, provided by Nolan Doesken
First, a bit about snow measurements
Because of the importance of mountain snow to water supplies, the federal government (specifically, the Department of Agriculture) has for decades collected snowpack data across the western US. The USDA snow survey was established in the 1930s, with routine “snow course” measurements in the winter and spring. These are manual measurements of the snow depth, snow water equivalent, and so on. (Here’s some archival footage of snow surveying. I believe that smoking a pipe while taking the measurements is discouraged these days.)
Photos of USDA staff taking snow measurements. From the Colorado Snow Survey website.
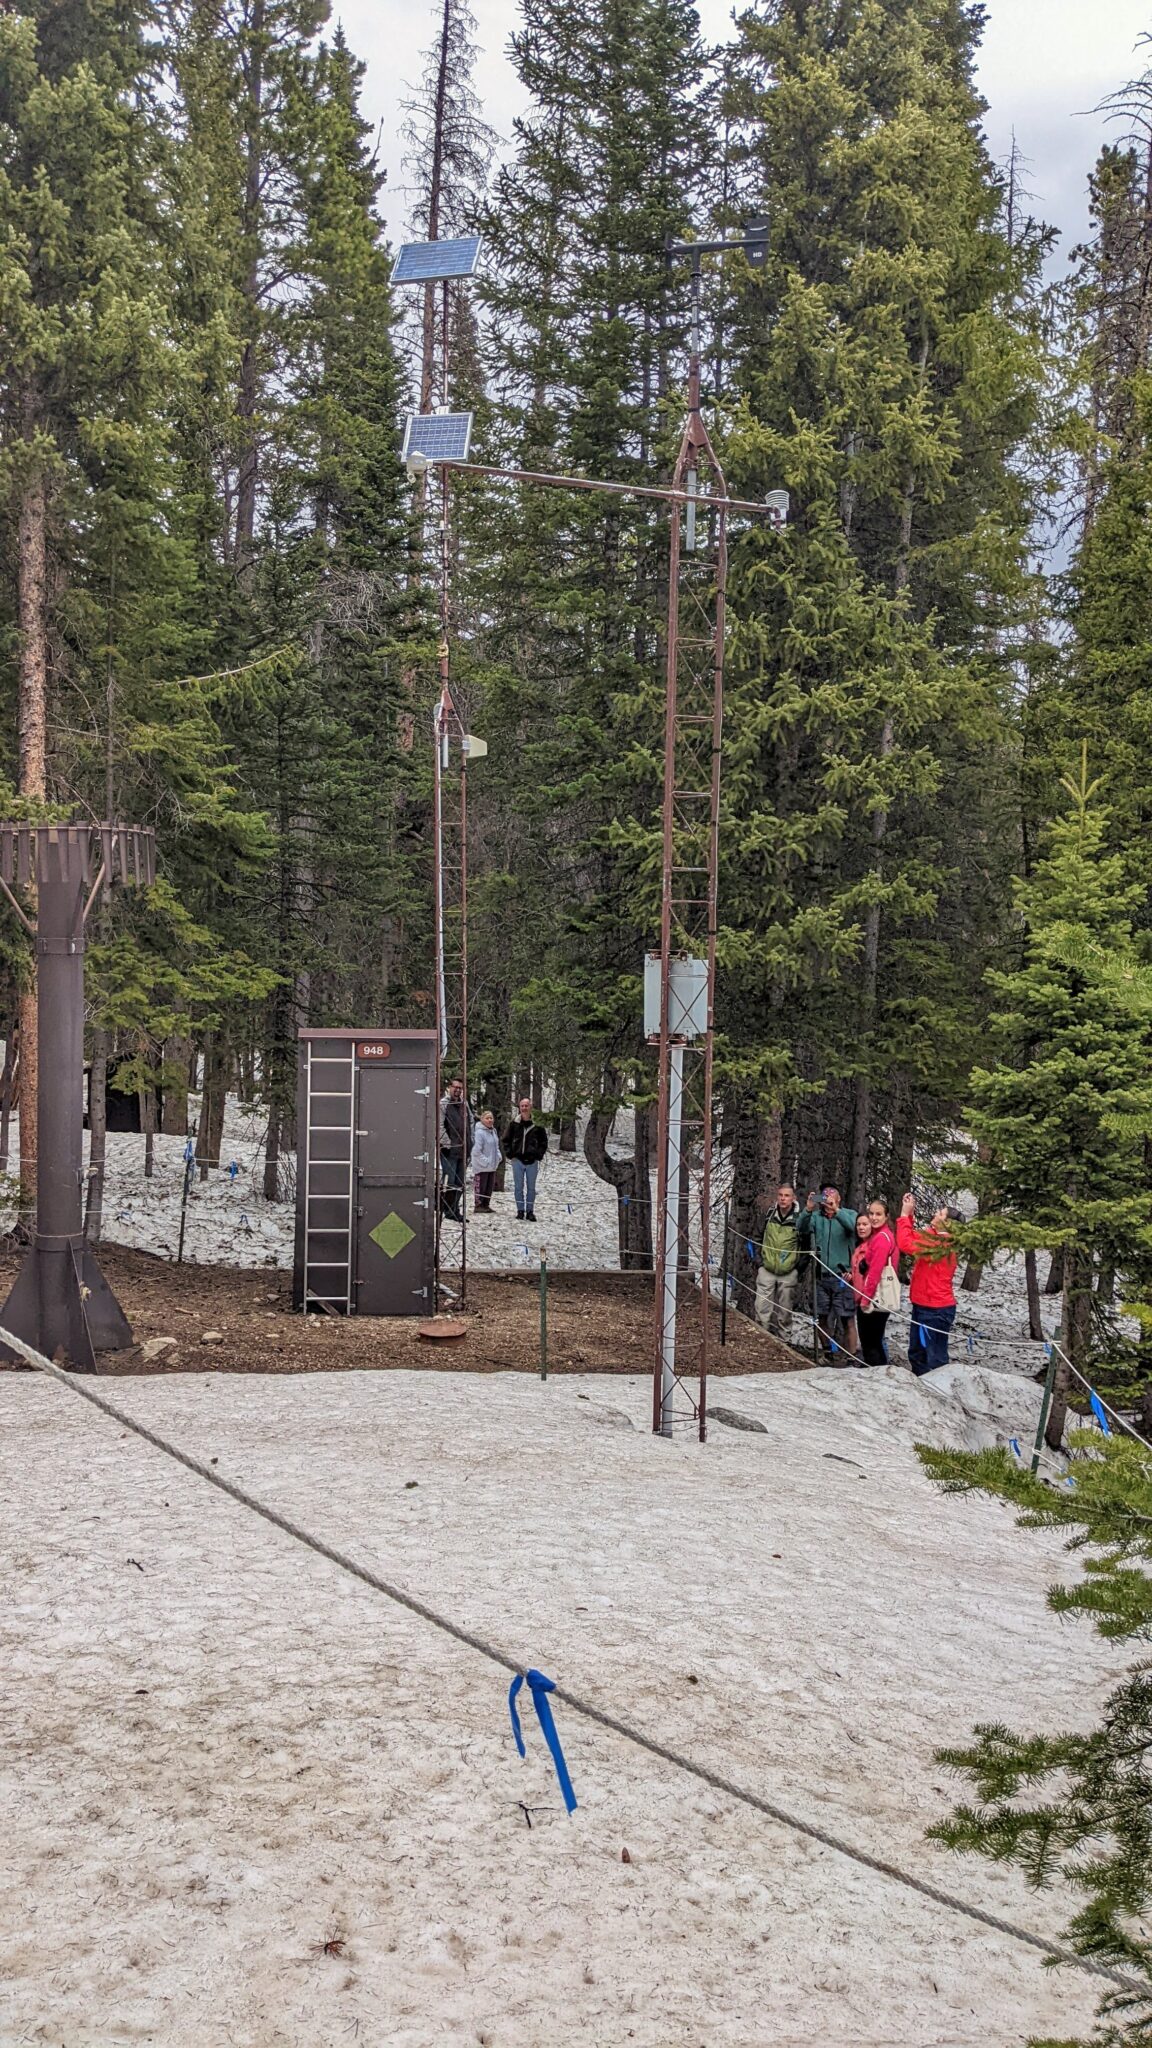
The Bear Lake SNOTEL station in Rocky Mountain National Park in May 2022, photo by Russ Schumacher.
Measuring snow this way takes a lot of time and effort, however. So the 2nd pillar of the USDA’s snow survey program, the “Snow Telemetry” or SNOTEL network, was established starting in the 1960s. These are automated stations that use a “snow pillow” to measure the weight of the snow, and convert that into an amount of liquid water, among other measurements. SNOTEL data allow agricultural producers, water managers, climatologists, and the public to keep tabs on the snowpack in near-real-time. The snow course measurements have the advantage of a longer period of record to compare to, but are only collected once a month from February through May; the SNOTEL data are available daily from over 100 stations but with a shorter period of record.
What do the data show for this winter?
The graph up at the top shows that in the SNOTEL era, Colorado’s snowpack is the worst on record as of early February. However, there weren’t yet any SNOTEL stations in Colorado for the 1976-77 winter, and the network was still being built out as of 1980-81. So, if we want to compare the current snowpack to those two years, we’ll have to take a look at the tried-and-true snow course measurements, which the USDA has been collecting for the first time this season over the last week or so.
When comparing the snow water equivalent on February 1st at 62 snow courses with more than 50 years of data, there are eight sites where this year (2026) is the lowest on record. They are shown with the dark brown circles on the map below. Another fourteen sites have either the 2nd or 3rd lowest snowpack on record, and many more are in the bottom 10 years historically.
Rank of February 1 snow water equivalent at snow course sites with more than 50 years of observations. The color shading in the background shows elevation, with blue/white colors representing higher elevations. Credit: Colorado Climate Center
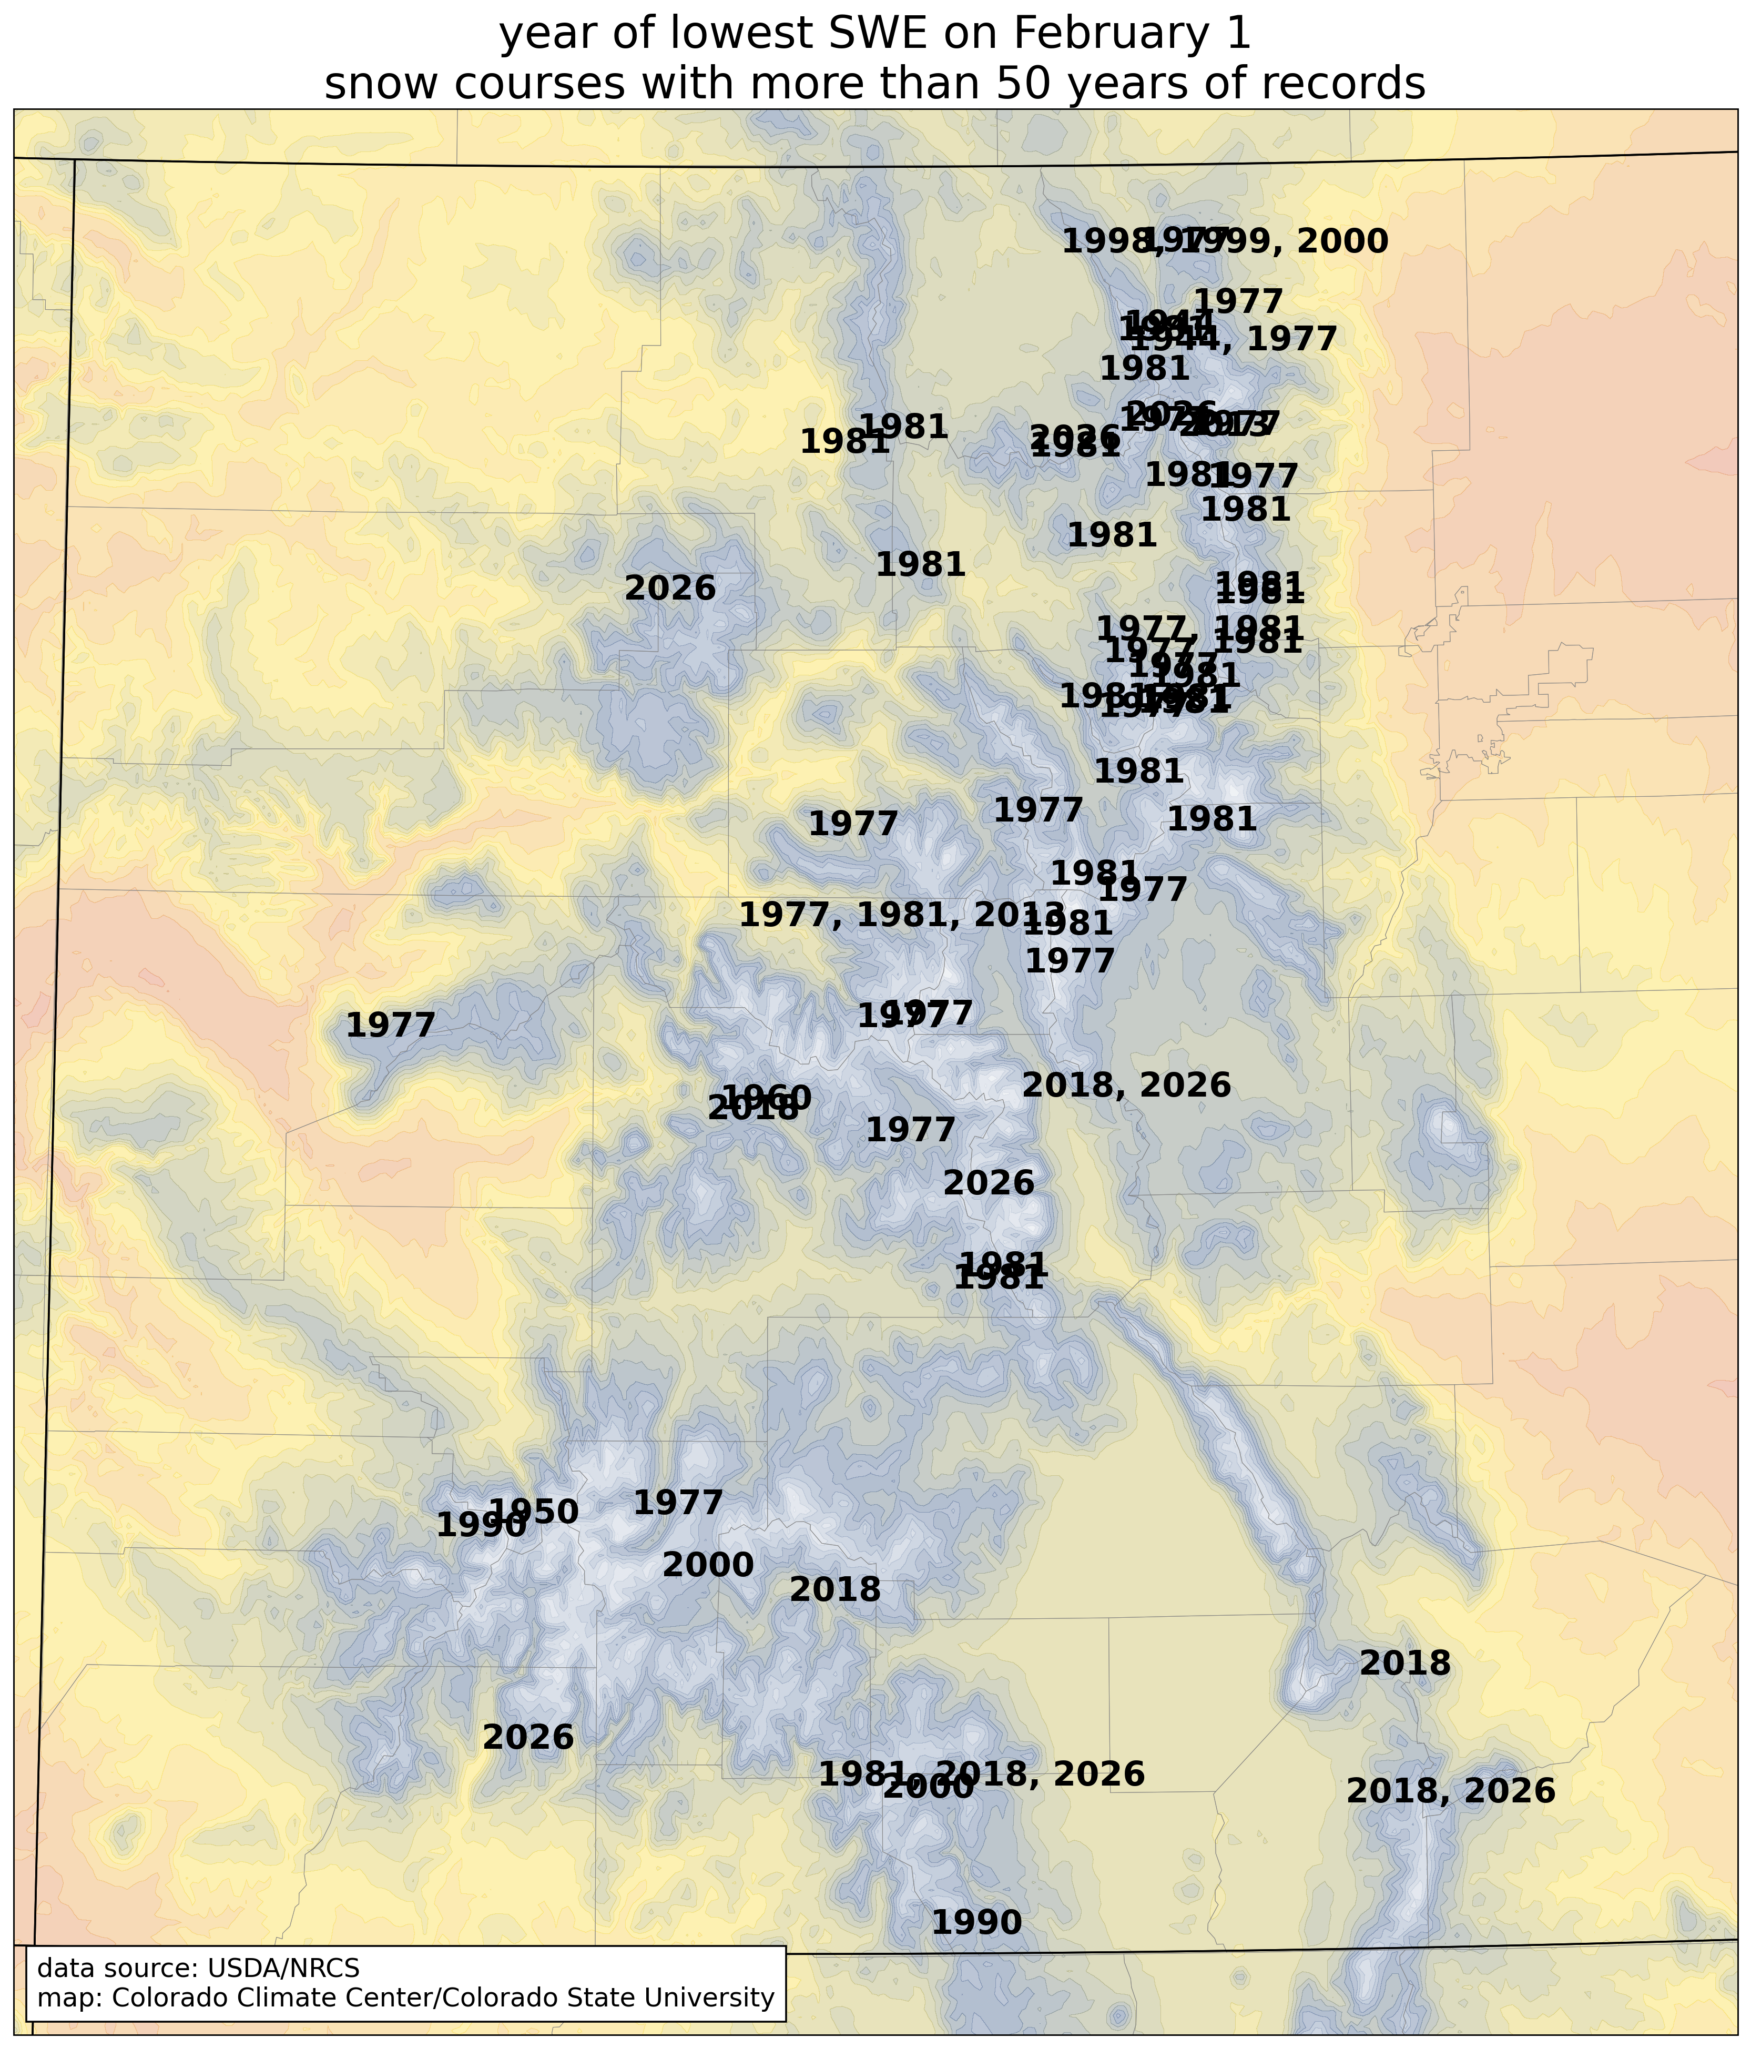
We can also look at which years had the lowest SWE as of February 1. At the locations where this year isn’t the worst snowpack, the worst February conditions were generally either in 1977 or 1981 (with some dishonorable mention to 2018 in the southern mountains.)
Water year with the lowest snow water equivalent at snow course sites with more than 50 years of records. Credit: Colorado Climate Center
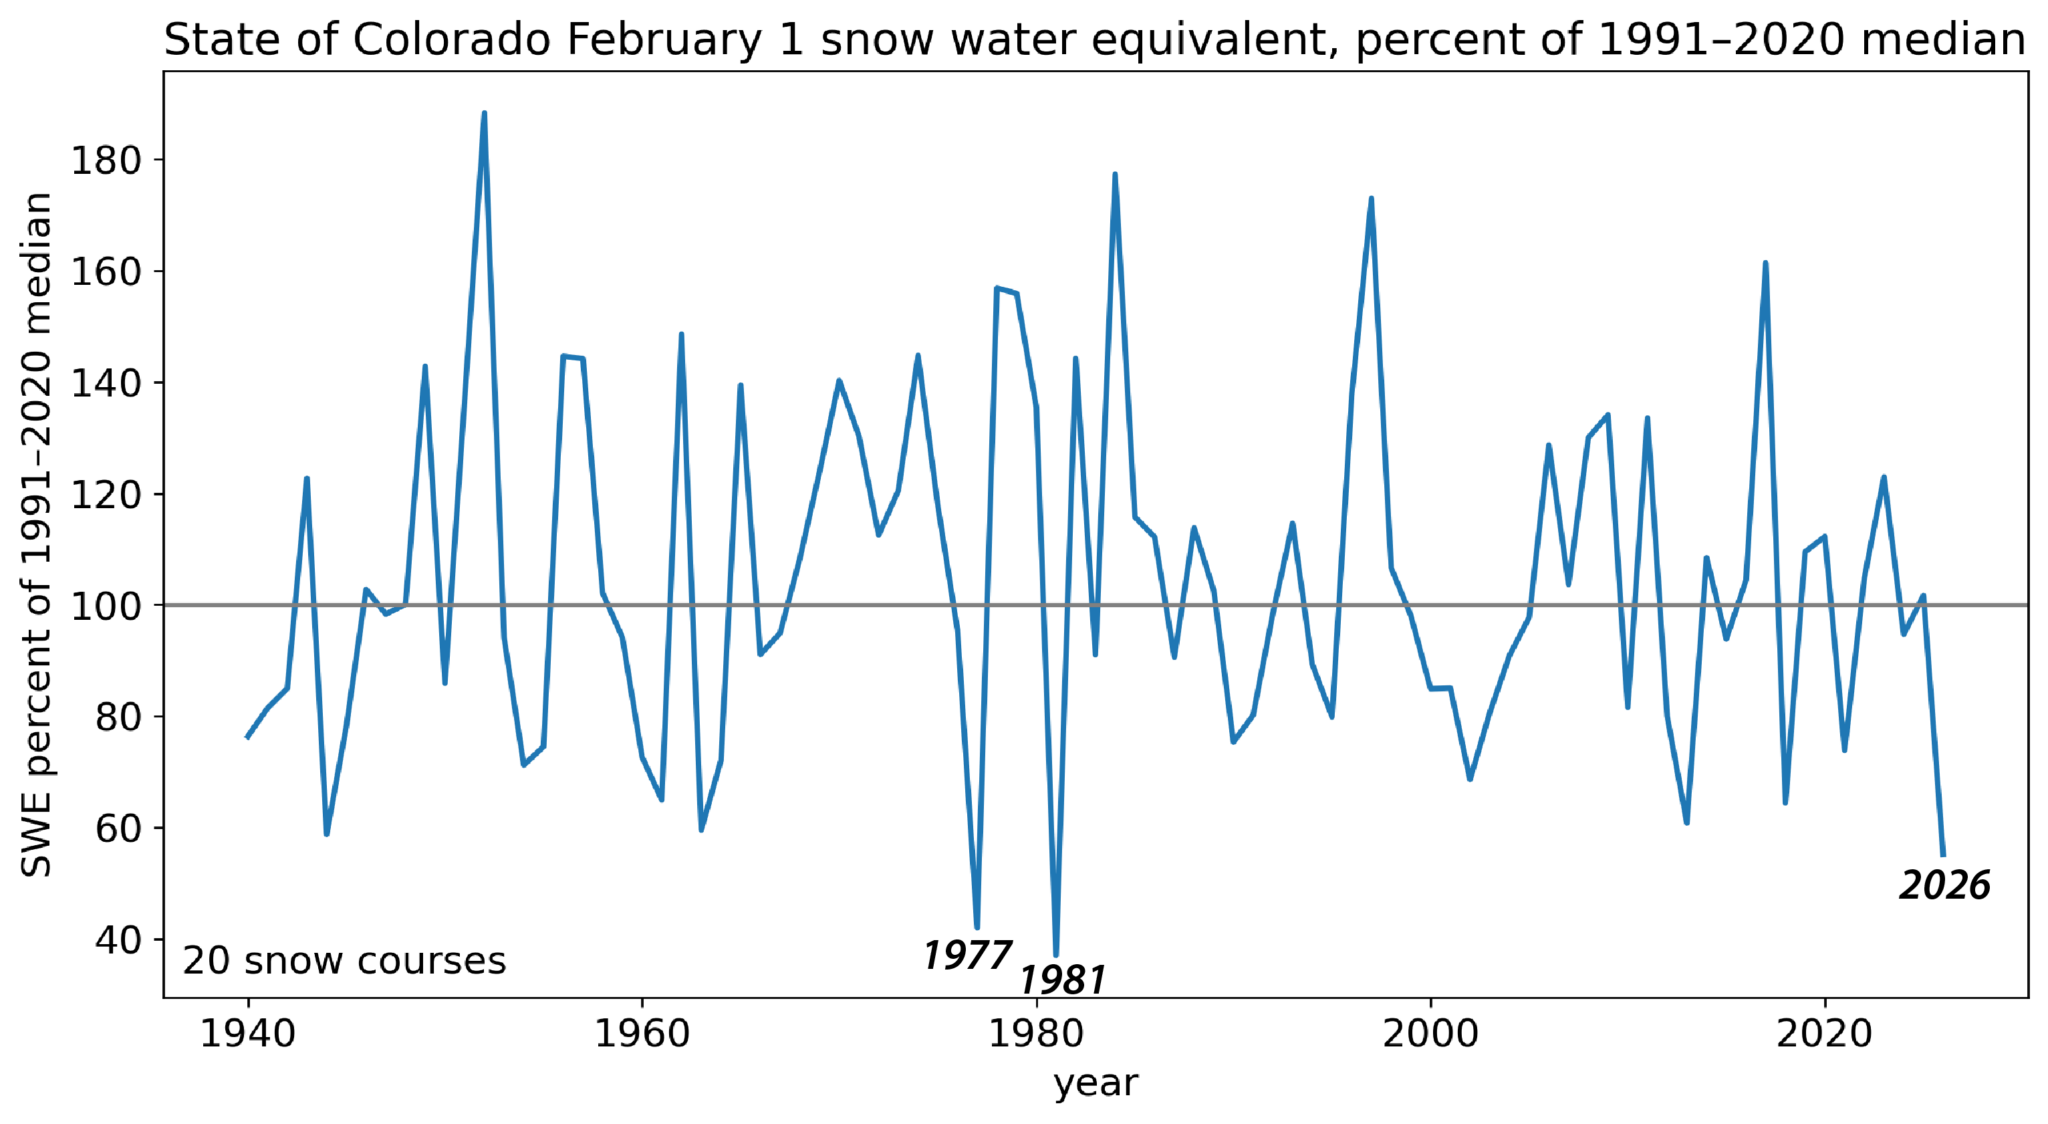
Using data from 20 snow course sites in Colorado with consistent data back to at least 1940, we can see that this year has the lowest snow water equivalent since the two terrible years of 1977 and 1981, and lower than any of the other years in the record.
February 1 snow water equivalent at 20 snow courses in Colorado, as a percent of the 1991-2020 median. Data from USDA/NRCS. Credit: Colorado Climate Center
So, it’s fair to say that this year so far has the worst snowpack in Colorado in over 40 years. But in most locations it’s not quite as bad as the conditions were in 1976-77 and 1980-81.
However, obviously a lot of things have changed since the late 1970s! Nearly all ski areas now have robust snowmaking operations, which allow them to keep terrain open even when there’s not much snow falling from the sky. On the flip side, the population of Colorado has grown immensely—approximately twice as many people live in the state now as did in 1980. Which means that the demand for water (and for winter recreation) is much greater, and thus the potential impacts of a snow drought are much greater as well.
What has really set this water year apart thus far is how warm it’s been. For Colorado statewide, we just had the 3rd warmest November and the warmest December in over 130 years of records. January was very warm as well. Official numbers for January will be released this week (make sure you’re signed up to get our monthly summaries), but it clearly ranked among the top 20 warmest Januarys, and early February has continued the streak of warmth. The warmest start to a water year we’ve ever seen, combined with a lack of the snowstorms we typically see in winter, has brought us to the worst mid-winter mountain snowpack in decades.
We do still have about 2 months to go before the mountain snowpack typically hits its peak, which means there is still time to chip away at the deficit. Looking back at the major mid-winter snow droughts discussed above, in 1977 it remained dry in late winter and spring, and that season still holds the record for worst April 1 snowpack at many locations in Colorado. In contrast, the spring of 1981 was fairly active; at least enough to emerge above record-low territory for much of the state.
This week, the pattern will finally shift away from warm and sunny conditions to more consistent chances for snowfall. However, it’s too early to say how long the incoming pattern will stick around, and unfortunately there aren’t any blockbuster storm cycles on the horizon in the near term. An active spring would certainly be very welcome, but the odds of rebounding to near normal peak snowpack conditions are dwindling. More realistically, we are just hoping to get enough snow to avoid a historically bad year.
*special thanks to Brian Domonkos of the USDA/NRCS Colorado Snow Survey for providing useful details about this year’s snow course measurements
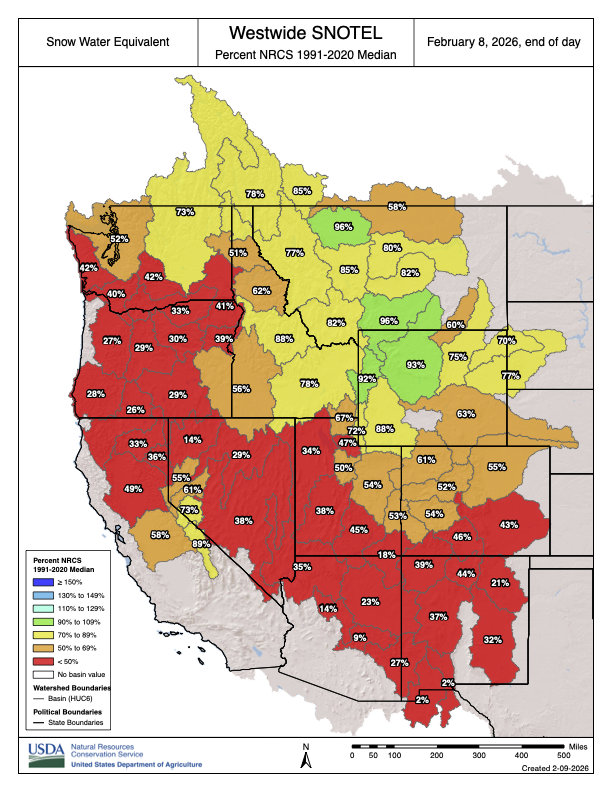
Westwide SNOTEL basin-filled map February 9, 2026.