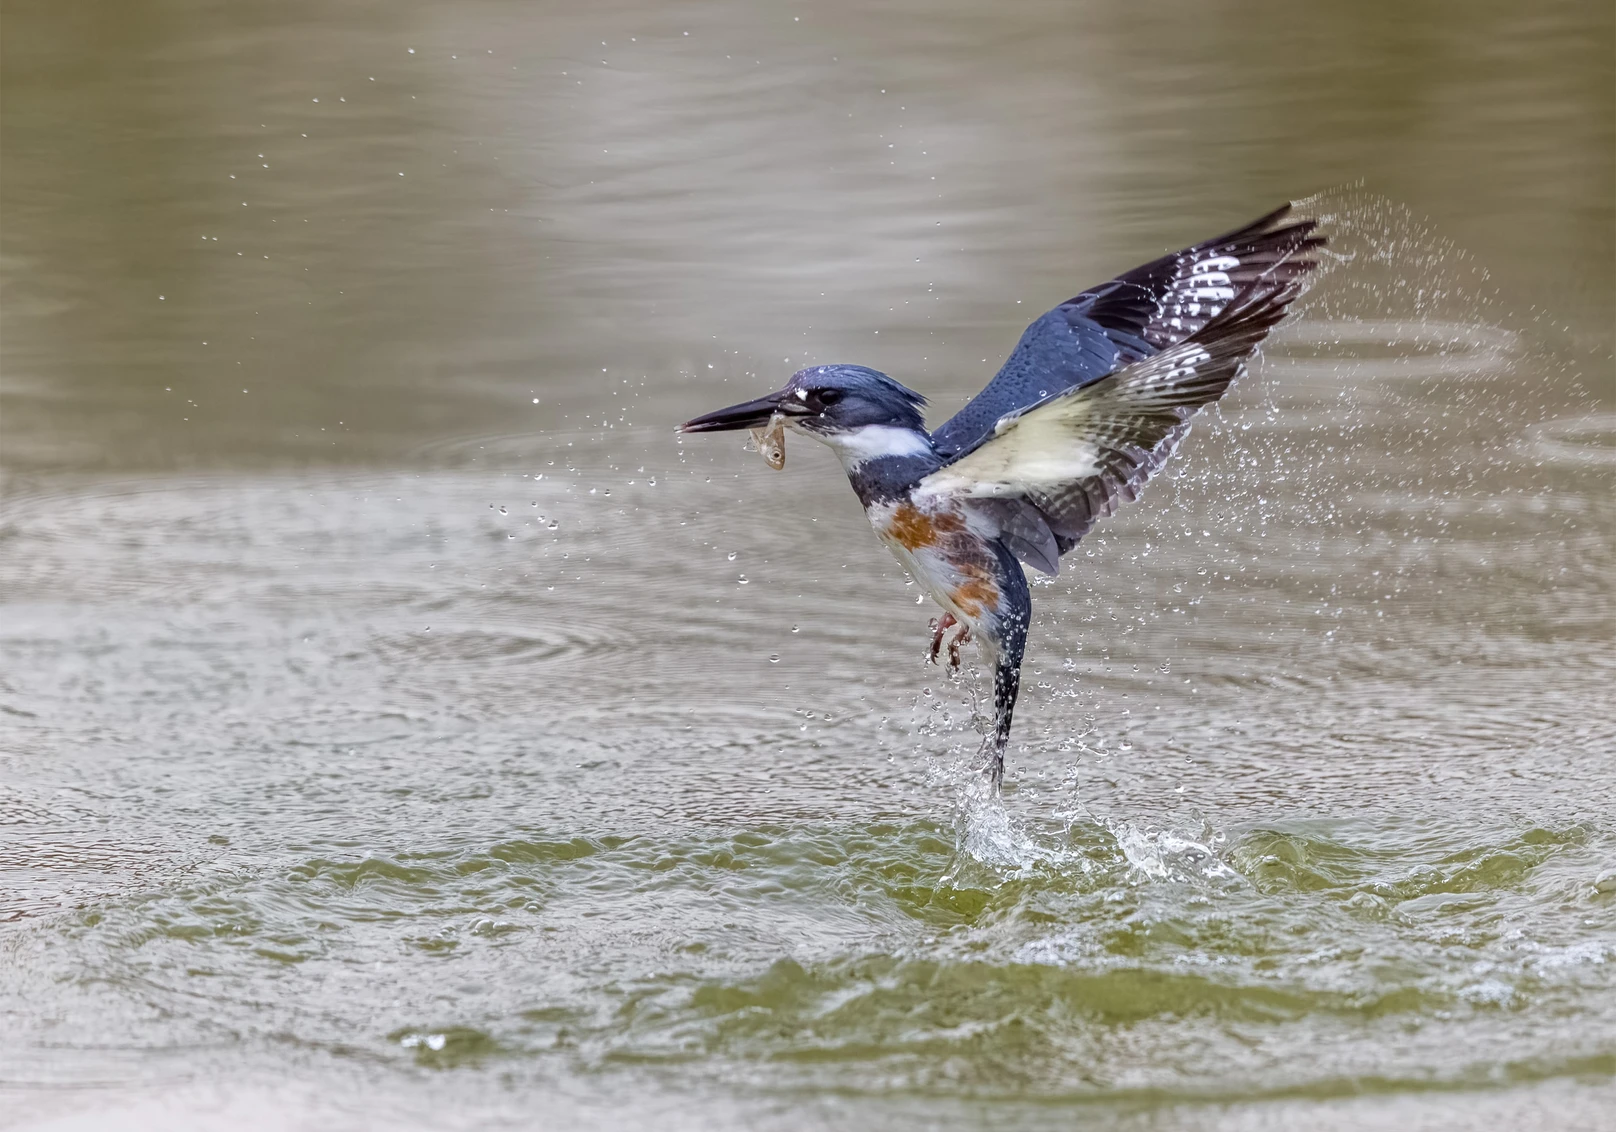
Belted Kingfisher. Photo: Jerry amEnde/Audubon Photography Awards
Click the link to read the article on the Audubon website (Jennifer Pitt):
November 12, 2026
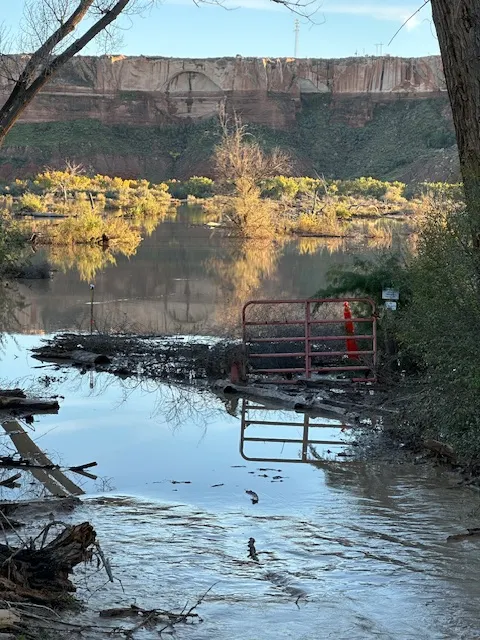
In recent weeks, powerful storms battered the Four Corners region. The San Juan River reached some of its highest flows on record, and the Animas and Dolores rivers each logged their fifth-highest levels. Families in Pagosa Springs, Colo., in Bluff, Utah, and Navajo Nation communities now face months of recovery. Though for some observers, there was at least some hope: after years of drought, perhaps all that water would provide a meaningful boost to replenish Colorado River reservoirs, recharge aquifers, and benefit some wildlife habitat.
The gain is small compared to the Colorado River’s deficit. Some of that floodwater reached the Colorado River system. Lake Powell has risen since October 1 by about 19 feet, a gain of roughly one million acre-feet of water. Every drop counts, but Powell holds roughly 24 million acre-feet when full and is still nearly three-quarters empty. Powell and Lake Mead, the system’s two largest reservoirs, each hold less water today than at this time last year. Meanwhile, water users in Arizona, California, Nevada and Mexico face significant supply reductions in 2027 under new federal guidelines designed to stabilize reservoir storage.
Whiplash is the new normal. Colorado River flows have always varied from year to year. That variability hits hardest when reservoirs are depleted, and it affects water users who depend on unregulated streamflow. Scientists expect a warming climate to bring more intense storms while drying the basin over the long term. And despite strong El Niño conditions this year, history suggests they are not a reliable predictor of above-average Colorado River flows. After last winter’s near-record-low runoff, a second poor snow year would further stress reservoirs that remain well below capacity. It would pose a serious challenge for Lake Powell, which is dangerously close to the elevations where water can no longer pass through Glen Canyon Dam. That impact would cascade downstream to Lake Mead, triggering larger supply reductions and pushing the reservoir closer to its own crisis.
What’s needed now. The storms caused devastating damage. They also added modestly to the river’s supply, but this is a reprieve, not a rescue. The storms are not a reason to stop working on the Colorado River crisis—they are a sign that we urgently need to make progress. Federal and state managers must keep working toward durable, basin-wide demand reductions and a negotiated, consensus agreement on sharing water shortages and managing the river, one that avoids a court-imposed outcome. Congress can also help affected communities by responding to a $2 billion request made by more than 100 Colorado River stakeholders—including irrigation districts, municipal water providers, Tribes, and conservation NGOs, including Audubon—to fund projects that help people and birds by building resilience to both drought and intense storms. These investments include floodplain restoration, forest health, and water conservation and reuse projects that can replenish reservoirs, strengthen communities’ resilience to drought and flooding, and support bird habitat across the Colorado River Basin.
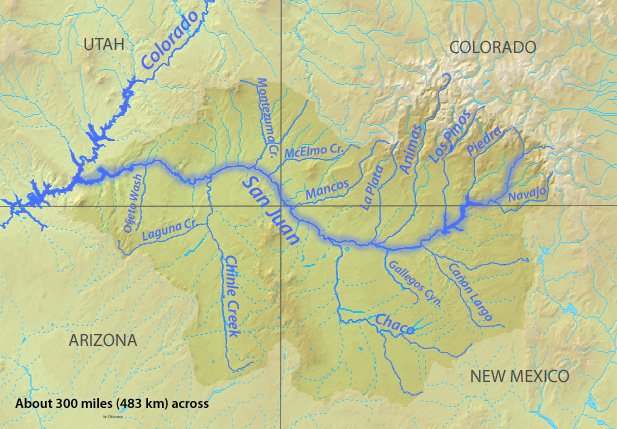
Map of the Colorado River drainage basin, created using USGS data. By Shannon1 Creative Commons Attribution-Share Alike 4.0
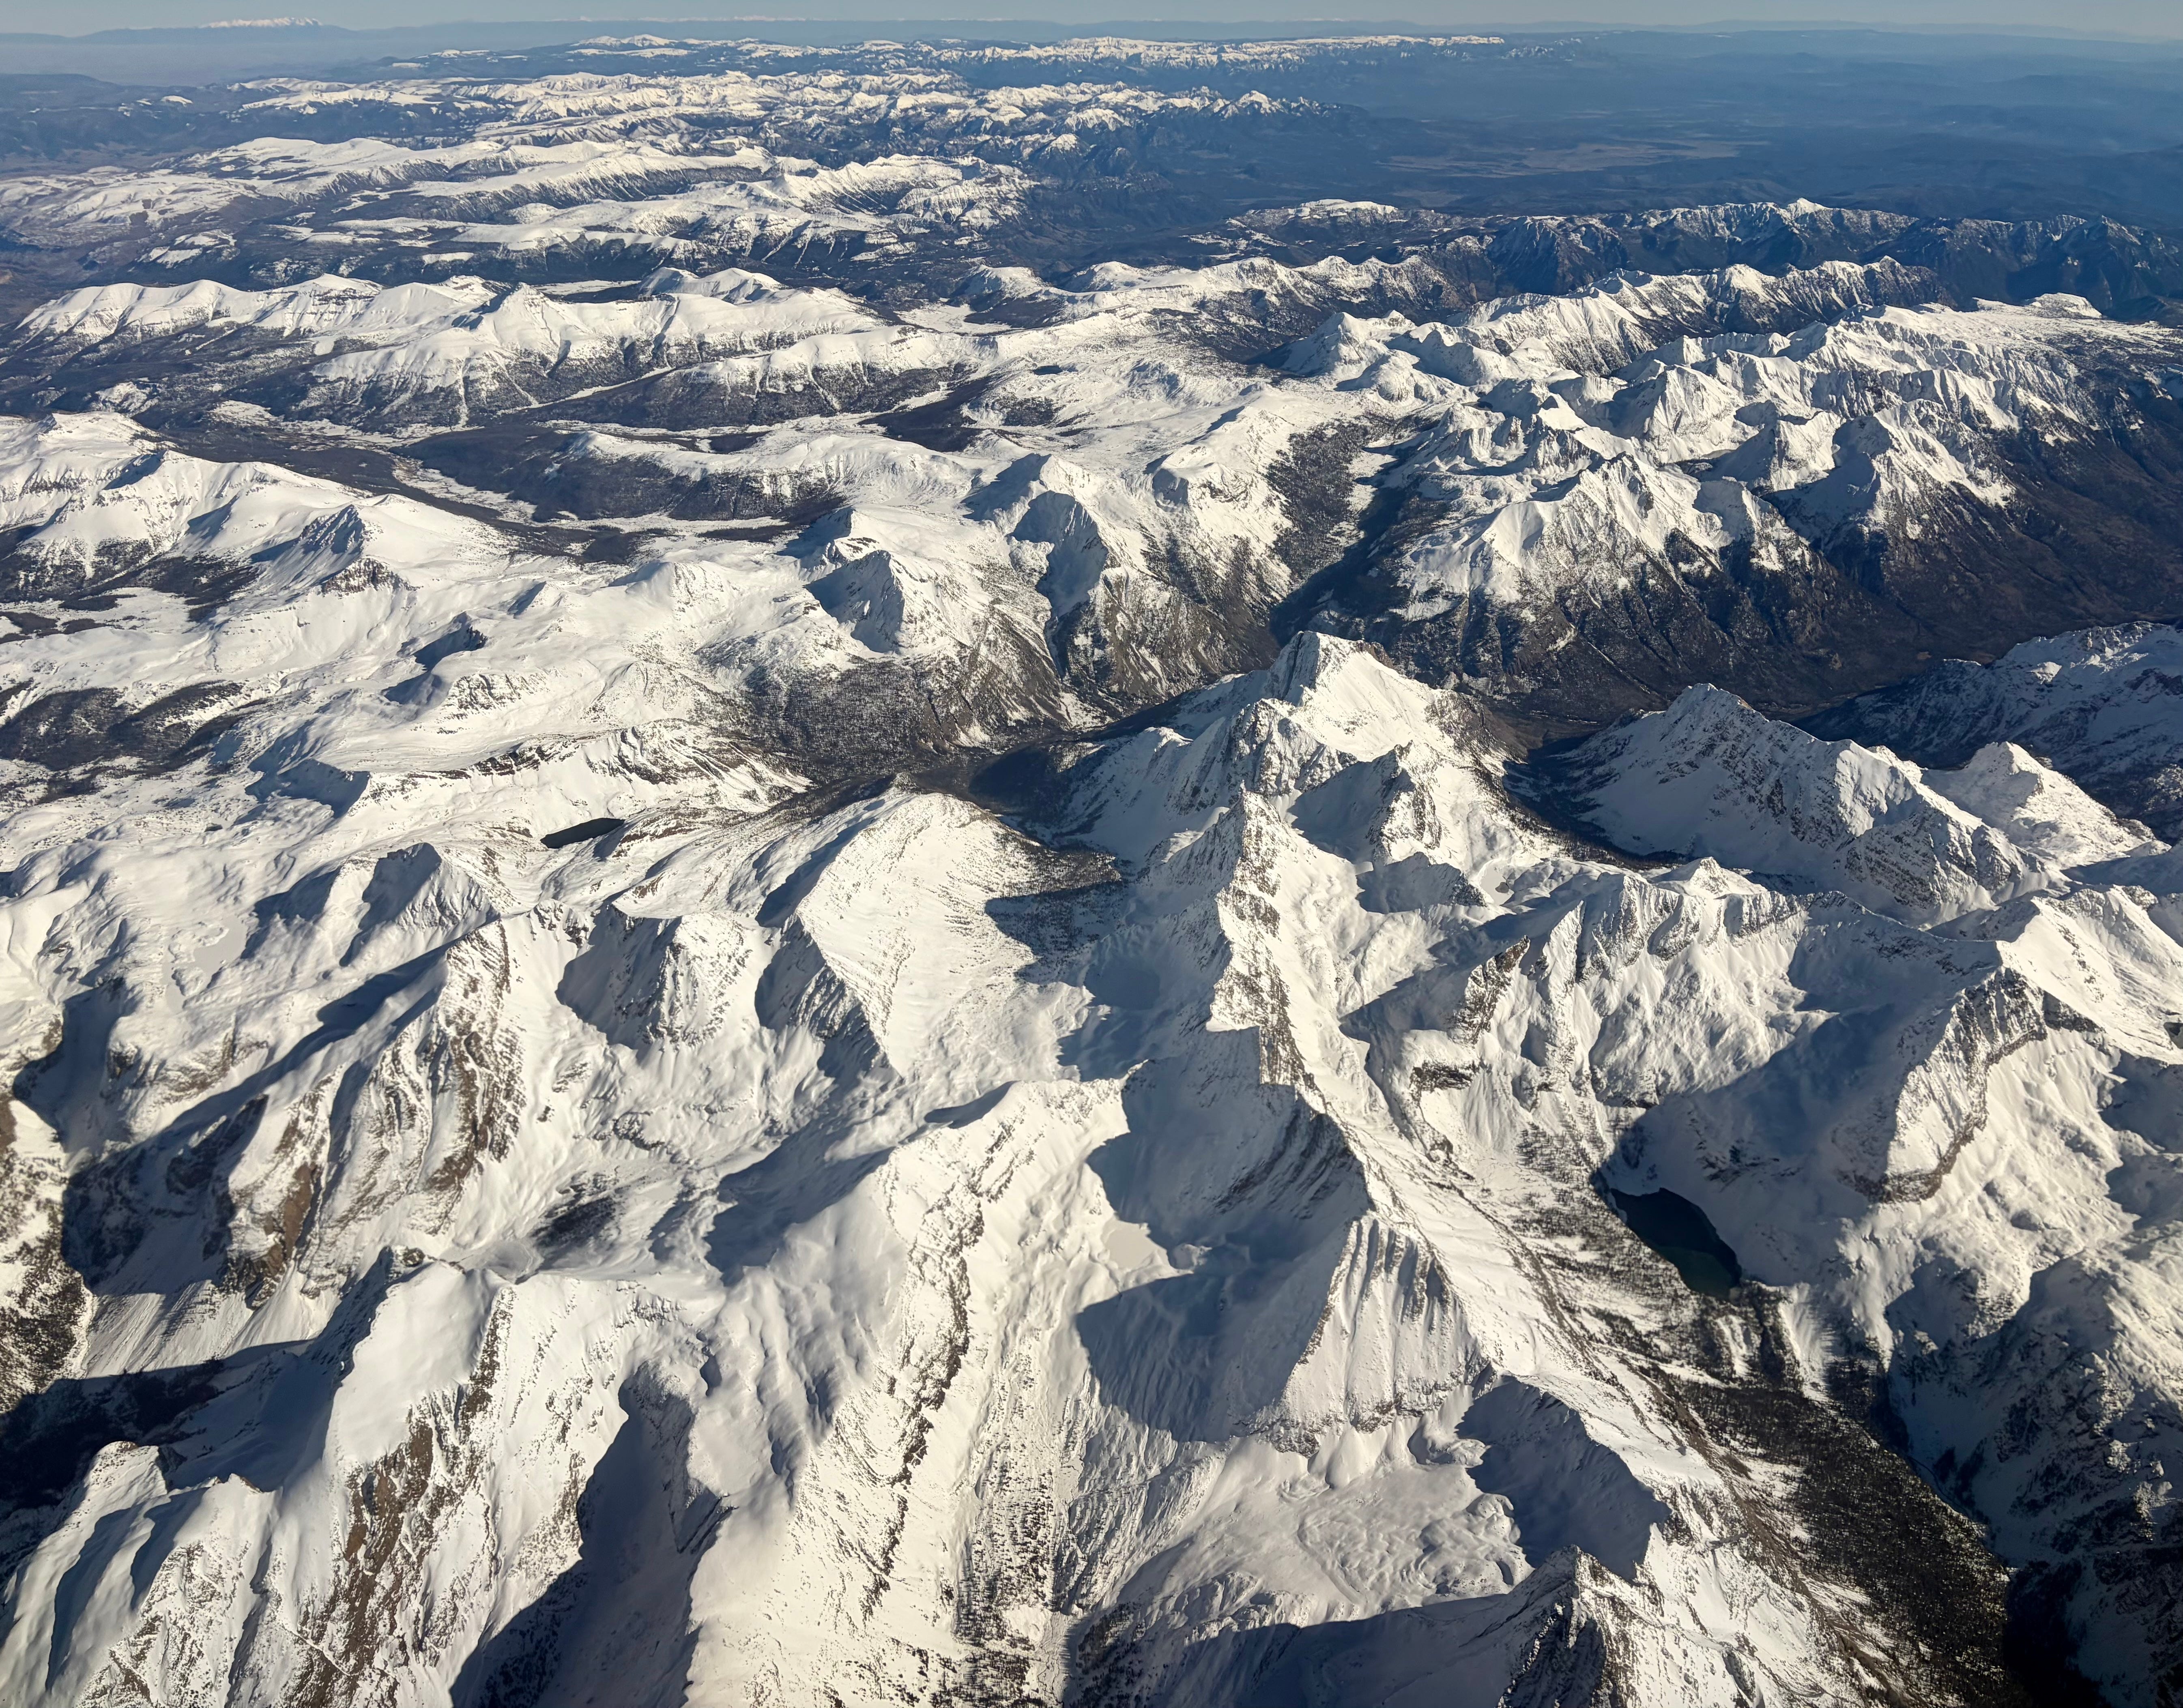
The San Juan Mountains on Nov. 9, 2026, sporting a nice blanket of dense snow — at least above 10,000 feet in elevation or so. Vestal Peak is just visible in the lower right hand side of the image. Jonathan P. Thompson photo.
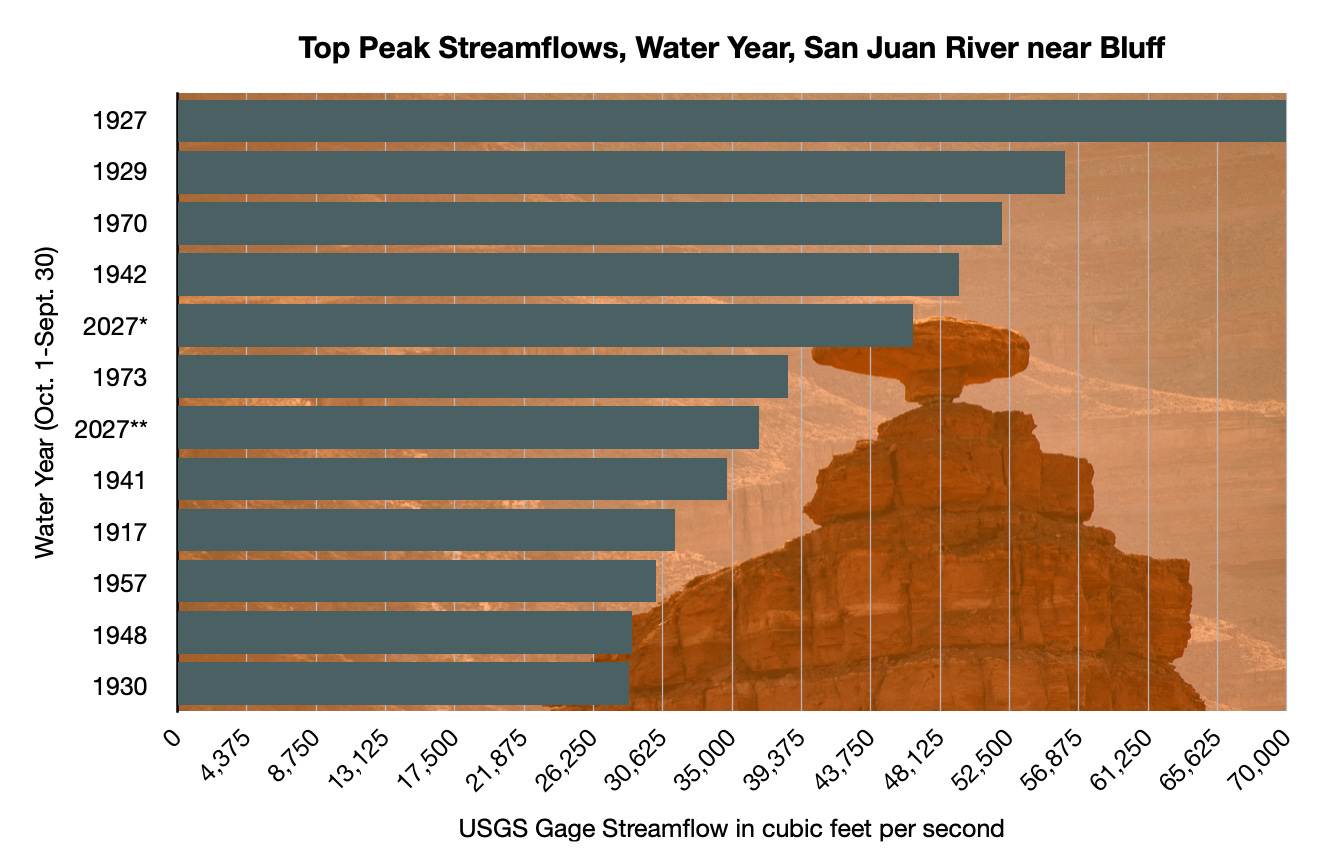
On the morning of October 26, 2026 — a few days after a huge storm had slammed the region — a USGS field measurement on the San Juan River at Mexican Hat, Utah, recorded a streamflow of 49,500 cubic feet per second, high enough to get within several feet of the iconic bridge crossing the river here, and to cause widespread flooding upstream in the community of Bluff, significantly damaging homes and businesses south of Highway 191.
Less than a week later, another round of tropical moisture rumbled into the region, raising fears of a repeat. Residents thought they would have a little bit of time to prepare, however, since the peak pulse of the San Juan would take a few days to reach the desert town. Yet even as they anxiously watched the river slowly rise, Cottonwood Wash, an intermittent stream that gets its start in the Abajo Mountains north of town, became a river-sized monster that dug a new channel, scoured the canyon bottom, uprooted massive cottonwood trees and moved house-sized boulders, and backed up behind the highway bridge, causing water to flow into the north side of town and inundating homes, businesses, the post office, and the Bluff Fort.
My wife Wendy and I passed through Bluff a few days after the Cottonwood Wash flash flood after driving across a mud-mired Navajo Nation. The post office was still surrounded by several inches of mud and water, a stack of waterlogged and red-brown-stained mattresses were piled up outside a lodging establishment, and three women in mud-spattered hazmat suits and masks sat by the road next to a still-inundated home. We stopped by Cow Canyon Trading Post to see how the proprietor, Liza Doran, was doing. The place is located such that it was mostly unscathed by either the San Juan or the Cottonwood flooding, but the trauma of repeated evacuation notices, uncertainty about when or from where the next deluge might come, and from seeing so many neighbors suffering, was palpable.
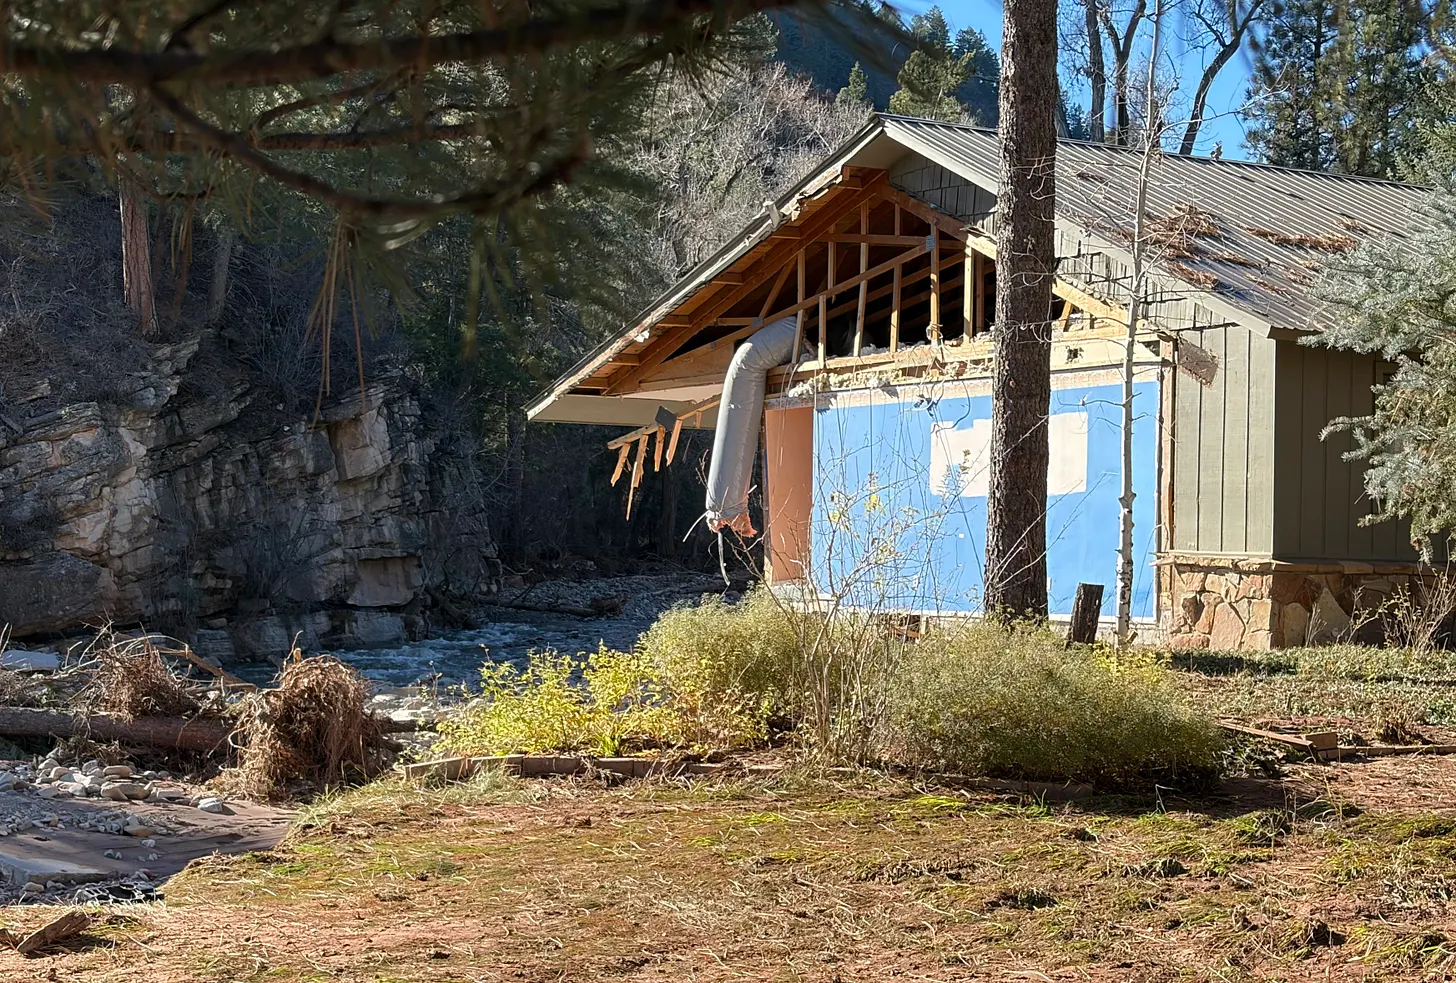
The tragic and devastating scene was repeated in various levels of severity across the Four Corners Region, from the Verde River Valley in Arizona, to Pagosa Springs and the San Luis Valley in Colorado, to Rock Point on the Navajo Nation, to the Hermosa and Junction Creek drainages near Durango. The raging water wrecked or soaked hundreds of homes, washed out roads and bridges, destroyed trails, and deposited tons and tons of silt and mud — often contaminated with raw sewage — in homes and on lawns and streets.
Mucking out and making repairs will take months. The psychological toll, meanwhile, will linger indefinitely. We all must reckon with the fact that this place we call Home, and the very things that draw us to it — the burbling brook up the road, the sparkling waters of the river in which we find solace, the gorge in which we hike — also carry violence and the power to reshape the landscape and, yes, destroy our homes.
Comparing this year’s floods to past ones in the Four Corners Country isn’t as straightforward as I would like it to be: Some critical streamflow gages don’t go back far enough to offer a full historic picture, and even when they do it’s not always clear that some of the older records are accurate. Even the most recent floods knocked some of the gages out of commission, leaving the actual peak flows a mystery.
Also, there’s only so much the numbers — whether it’s precipitation amounts, gage height, or streamflow — can tell us about the actual severity and impact of the floods. There are far more human-made obstructions in the streambeds now than there were in, say, 1911, which can exacerbate the effects. North of Durango in the Animas Valley, for example, some of the most significant impacts came from debris getting caught under the railroad bridge across Hermosa Creek, creating a dam that diverted much of the swollen stream directly into residential areas. In the case of Durango North Village, a mobile home park, Highway 550 ended up acting like a dam, trapping the murky water in the neighborhood and allowing it to masticate the homes.
Judging merely from the data available to us, however, the October and November 2026 floods were not the largest to hit the region since the beginning of white settlement. But from what I can tell, this may be the first time on record that the region has been hit by three consecutive extremely high water events within the period of one month.
One thing is clear: It has been a wet autumn around here. Really, there have been at least four major rain events this fall. The first was in mid-September, which caused some flash flooding and brought streams up from all-time lows, and the second was in mid-October, when I marveled at rivers reaching 2,000 cfs. Those seemed like some serious storms and streamflows at the time, but they were humbled by what followed on October 23 and then Nov. 1, which led to actual flooding.
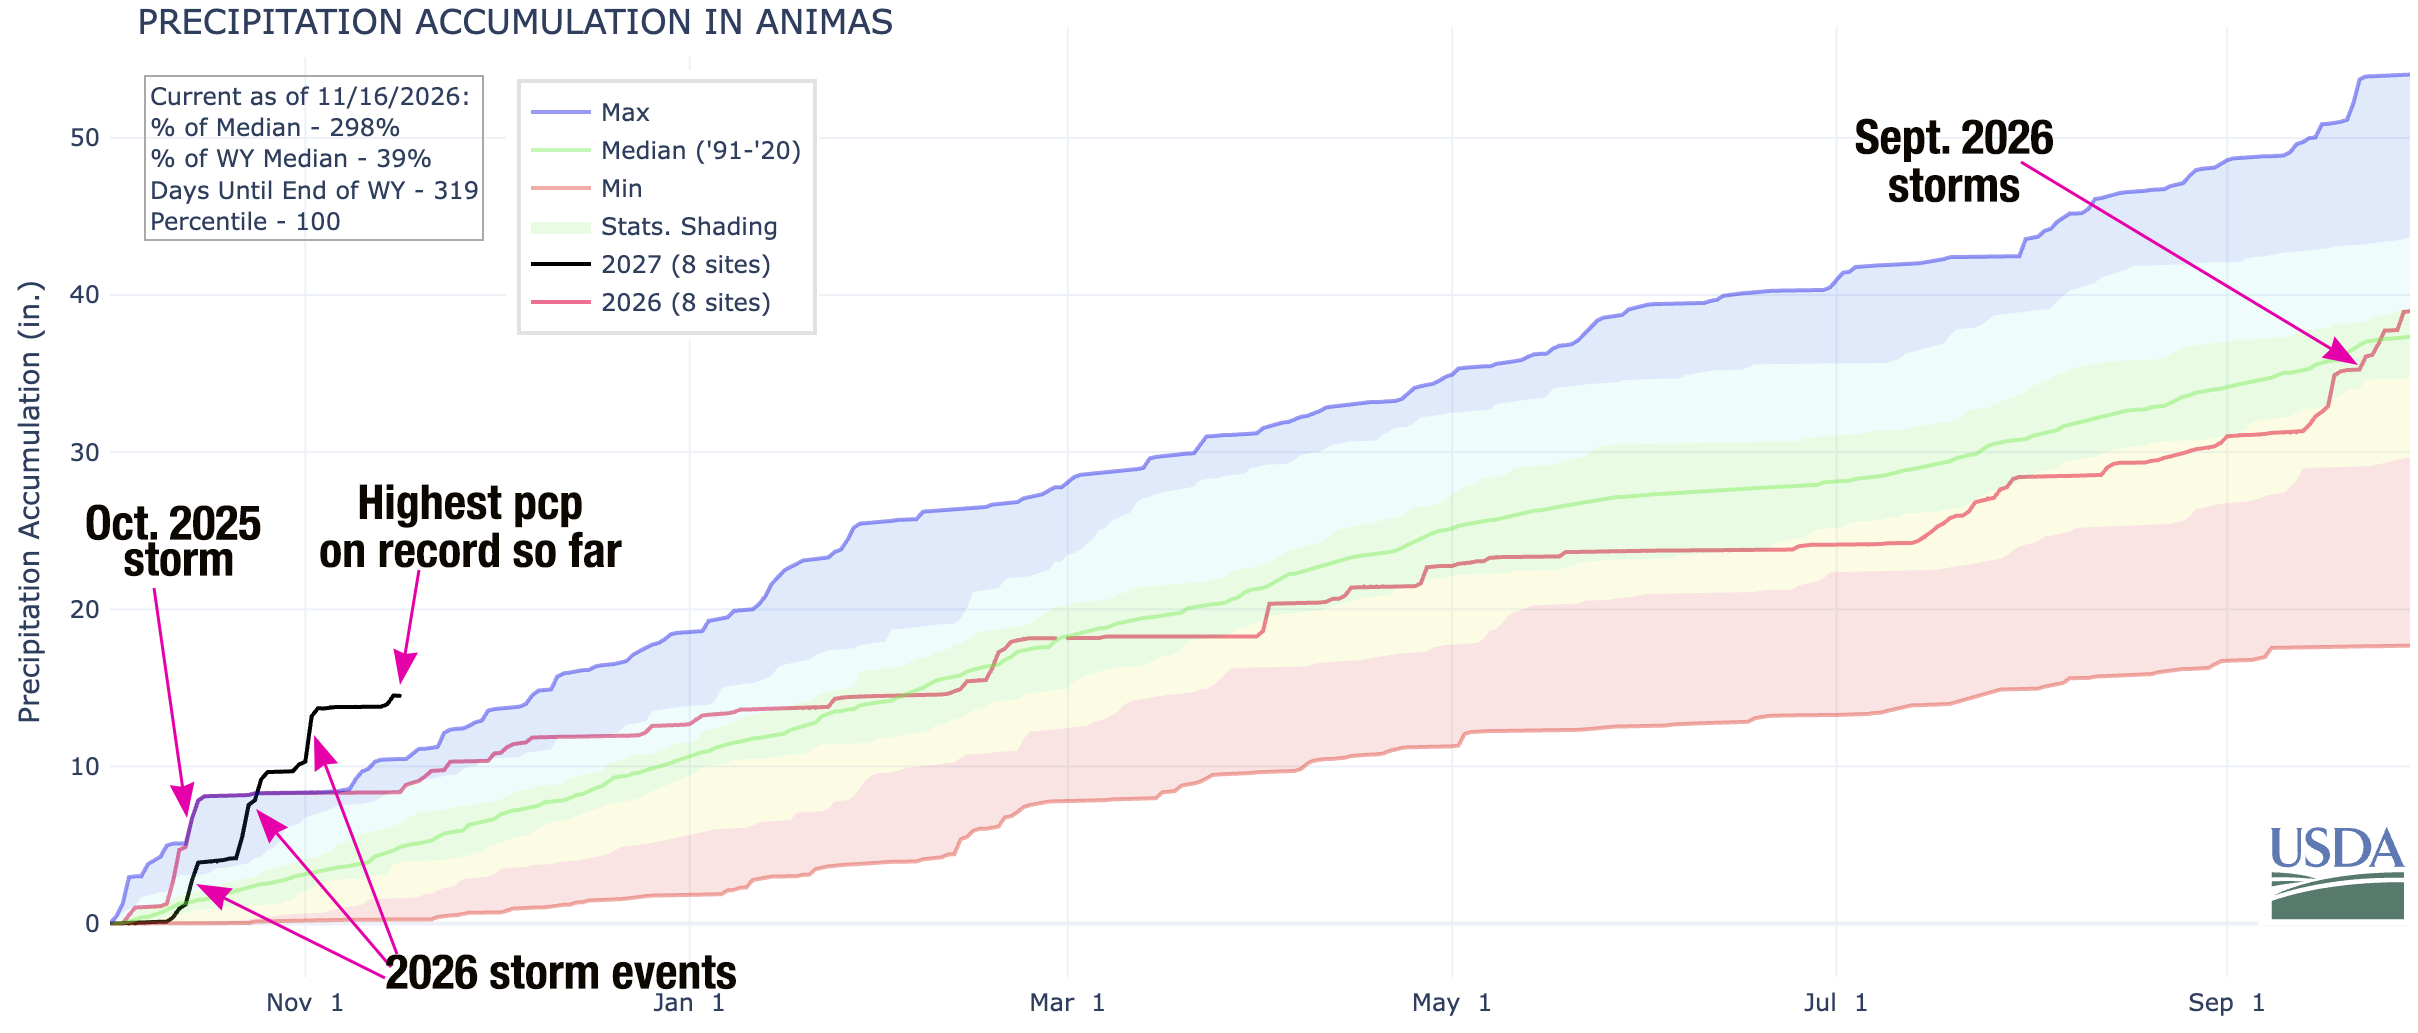
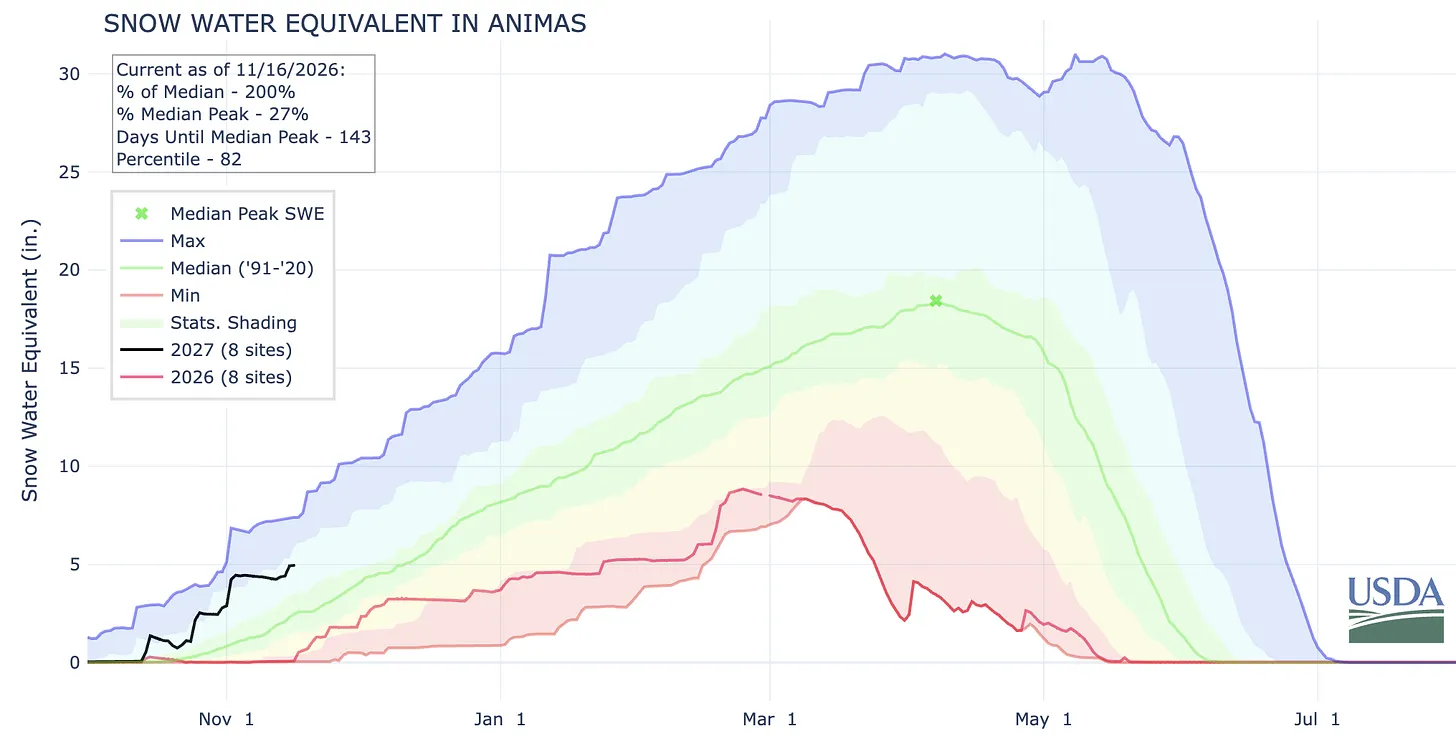
The Animas River watershed — which is representative of other San Juan Mountain watersheds — has received about 3 times more precipitation than median levels for 1990-2020 since Oct. 1, the beginning of the water year, eclipsing even last year’s October precipitation (which came all in one blast and set a record at the time). Source: USDA NRCS SNOTEL sites.
Last year’s October storms fell almost entirely as rain, even in the high mountains. This year’s storms were also accompanied by unusually warm temperatures, but it was still cool enough (at least with the second and third rounds) to leave a nice blanket of wet snow in the higher elevations. Wolf Creek ski area had enough of a base to open for the season on Halloween, only to have to shut down the next day due to forecasted flooding on both sides of the Divide and the subsequent road damage and closures. The ski slopes reopened for the 11/14-15 weekend, only to have to shut down again as CDOT closes Wolf Creek Pass to do further flood repair and maintenance. So far the snowpack is about 200% of normal for this date; keep in mind that this is a measure of snow water equivalent, not snow depth. Source: USDA NRCS.
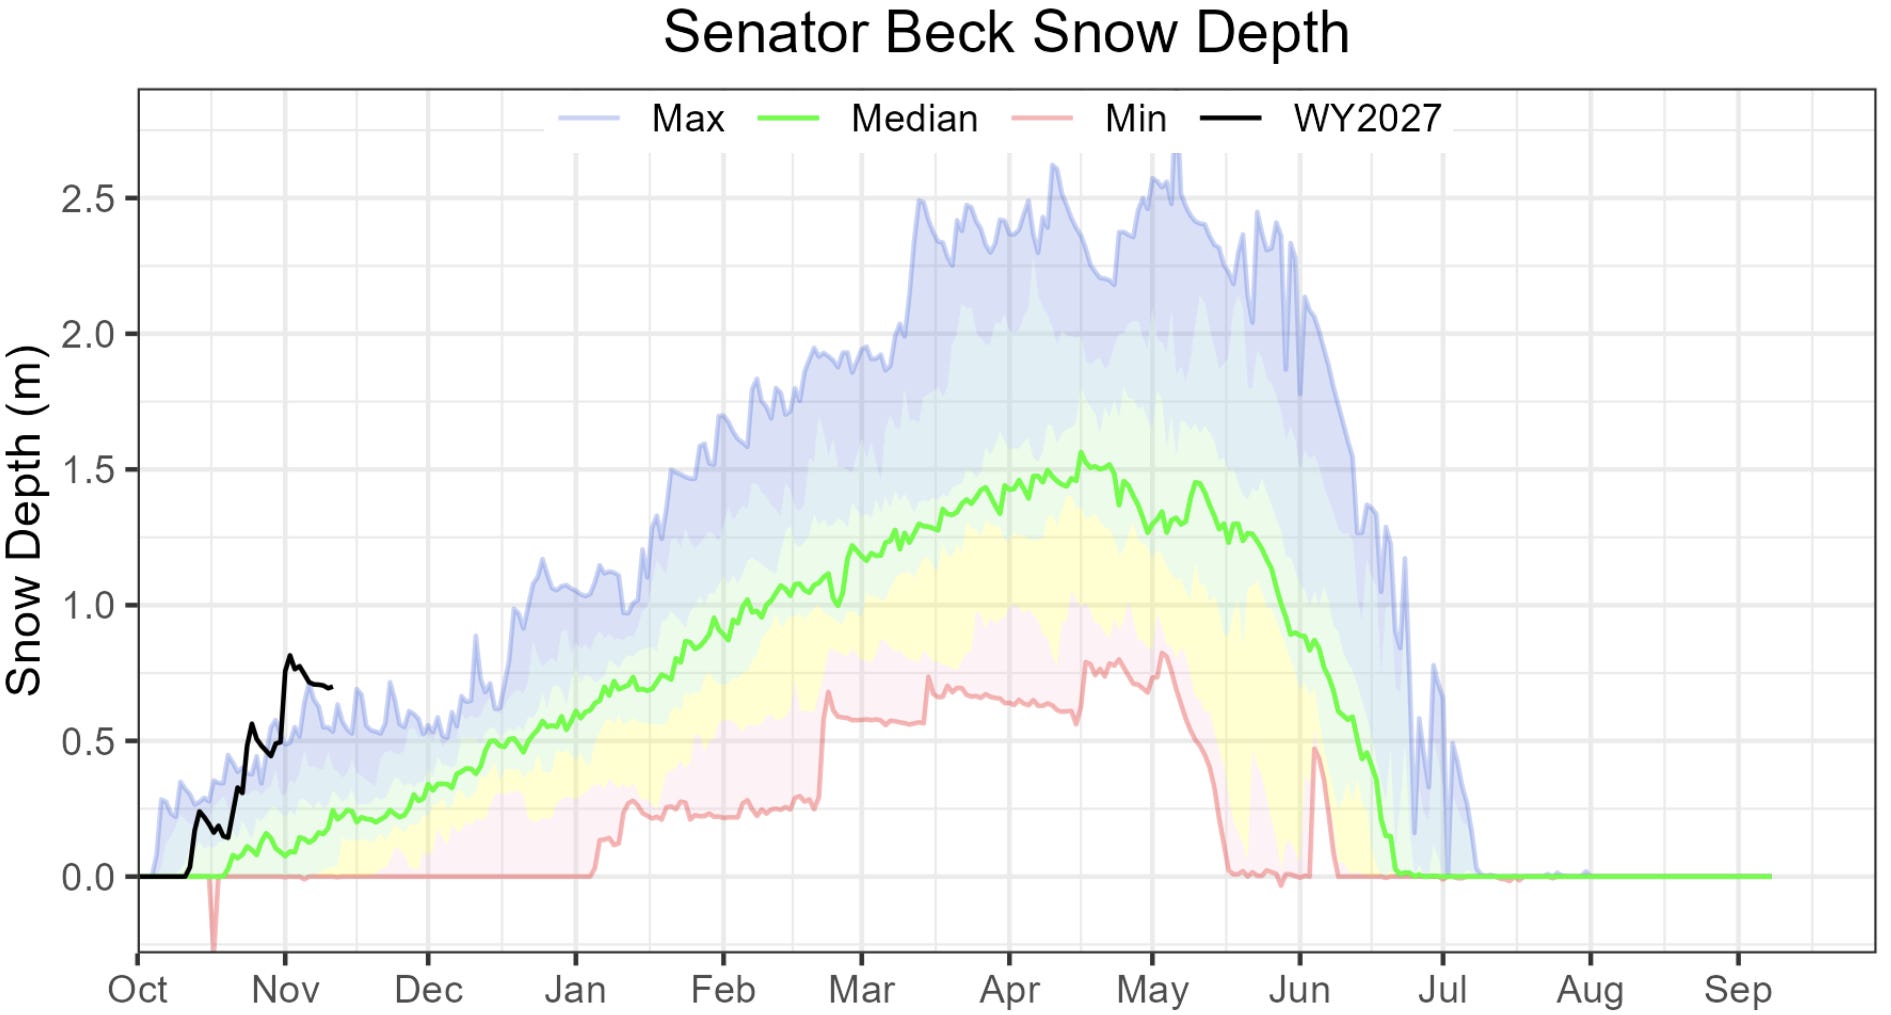
This graph from the Center for Snow and Avalanche Studies shows the actual snow depth at its Senator Beck study plot near Red Mountain Pass. Note how the snow settles after each storm but, according to the previous graph, retains most of its water content (meaning it’s not melting). Source: CSAS.
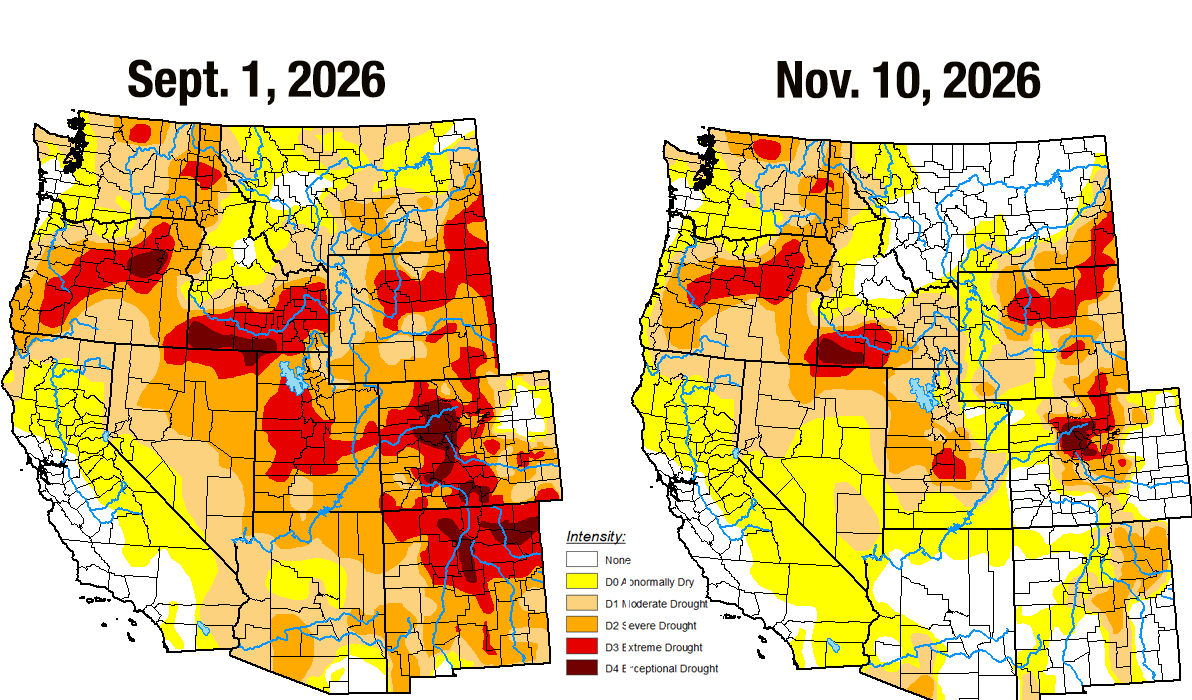
So far, the storms have mostly followed a typical El Niño pattern, which is to say that the moisture has been concentrated in the Southwest, while more northern areas have stayed relatively dry — or at least less moist. While drought has eased in or disappeared from the Four Corners region, it persists at extreme and exceptional levels in north-central Colorado, near where the Colorado River begins. In other words, the Upper Colorado River Basin is basically split in half, meaning relatively dry conditions near the headwaters could offset abundant moisture in the San Juans and other more southern mountain ranges. Of course, it’s still too early to tell where the El Niño lines dividing the unusually wet areas from the average and below normal precipitation areas will fall during the heavy snowfall months.
Numbers from the CoCoRaHS Mapping System illustrate just how wet it was during the first five weeks of the water year. The following are some accumulated precipitation totals from 10/31 to 11/3 for select locations:
7 miles NW of Pagosa Springs: 4.61 inches
In Pagosa Springs: 3.88 inches
Durango: 3.46 inches
Electra Lake (Terminal Dam in table below): 4.78 inches
Four miles west of Mancos: 4.04 inches
Silverton: 2.5 inches (this is a 24-hour total reported on the morning of Nov. 2 by Freddie Canfield, Silverton weather-observer extraordinaire. There is no CoCoRaHS observer in the area.)
Cherry Creek (between Hesperus and Mancos; this was the closest observer to the old Fort Lewis south of Hesperus): 4.13 inches
Chromo: 3.24 inches
5 miles east-northeast of Dolores: 4.13
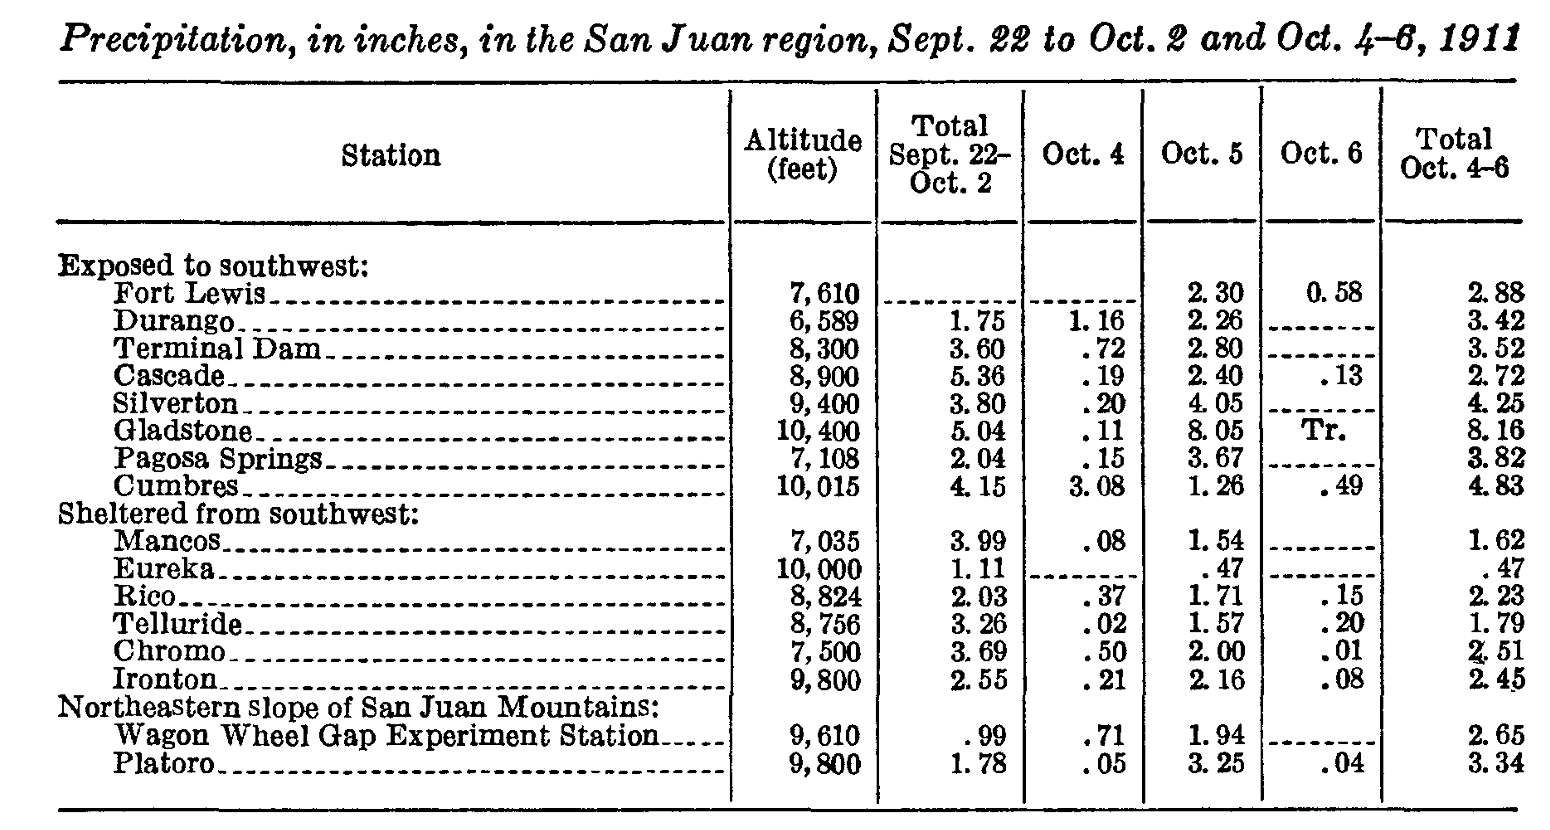
Now compare those amounts to rainfall amounts in the storms preceding the October 1911 flood.
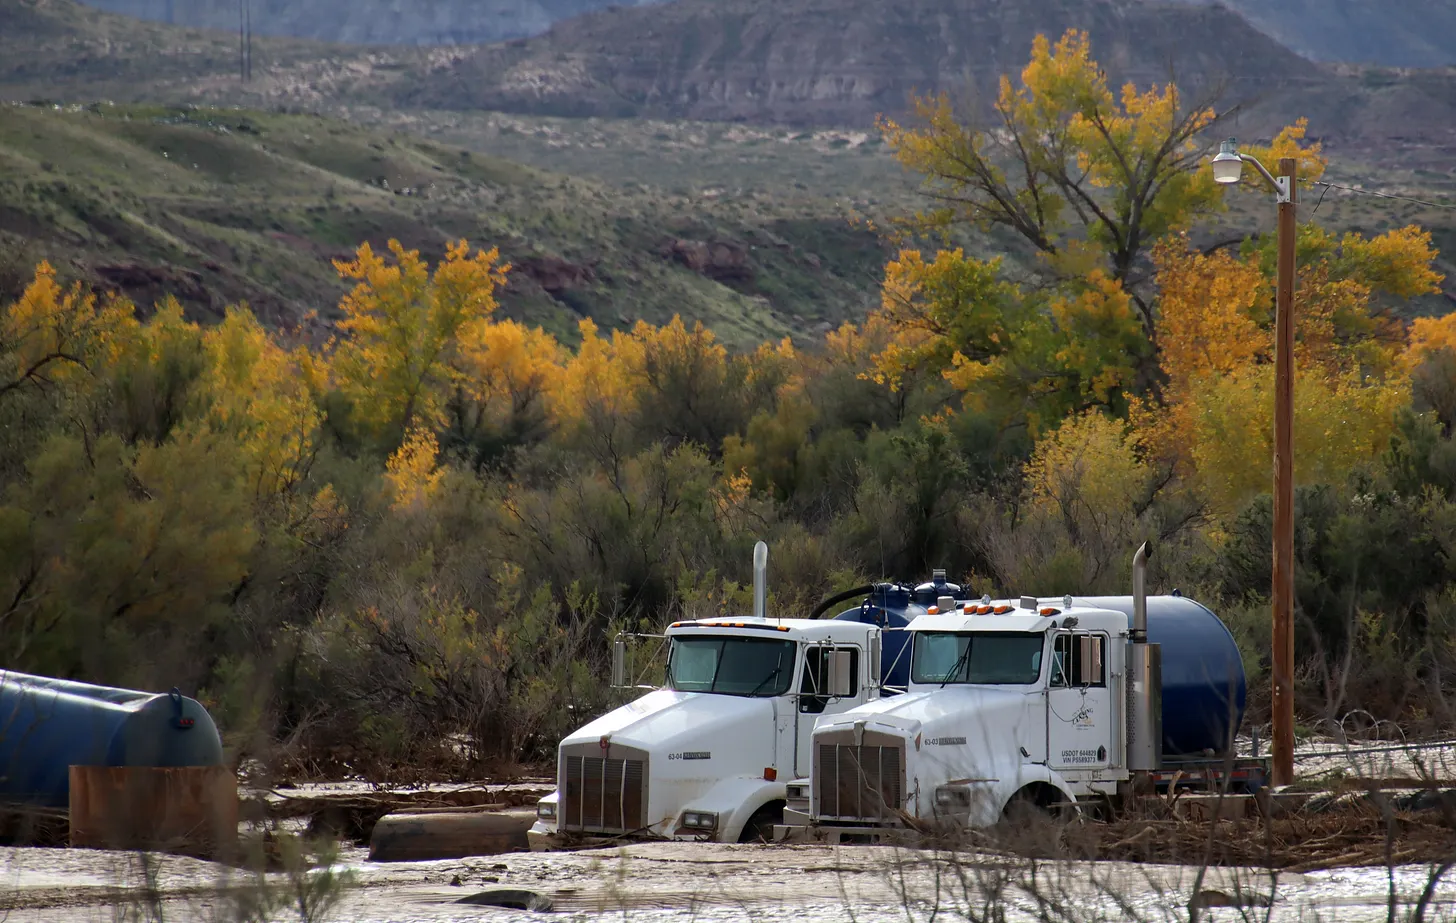
Oilfield service trucks mired in at least a foot of mud and debris near the confluence of Montezuma Creek and the San Juan River. Jonathan P. Thompson photo.
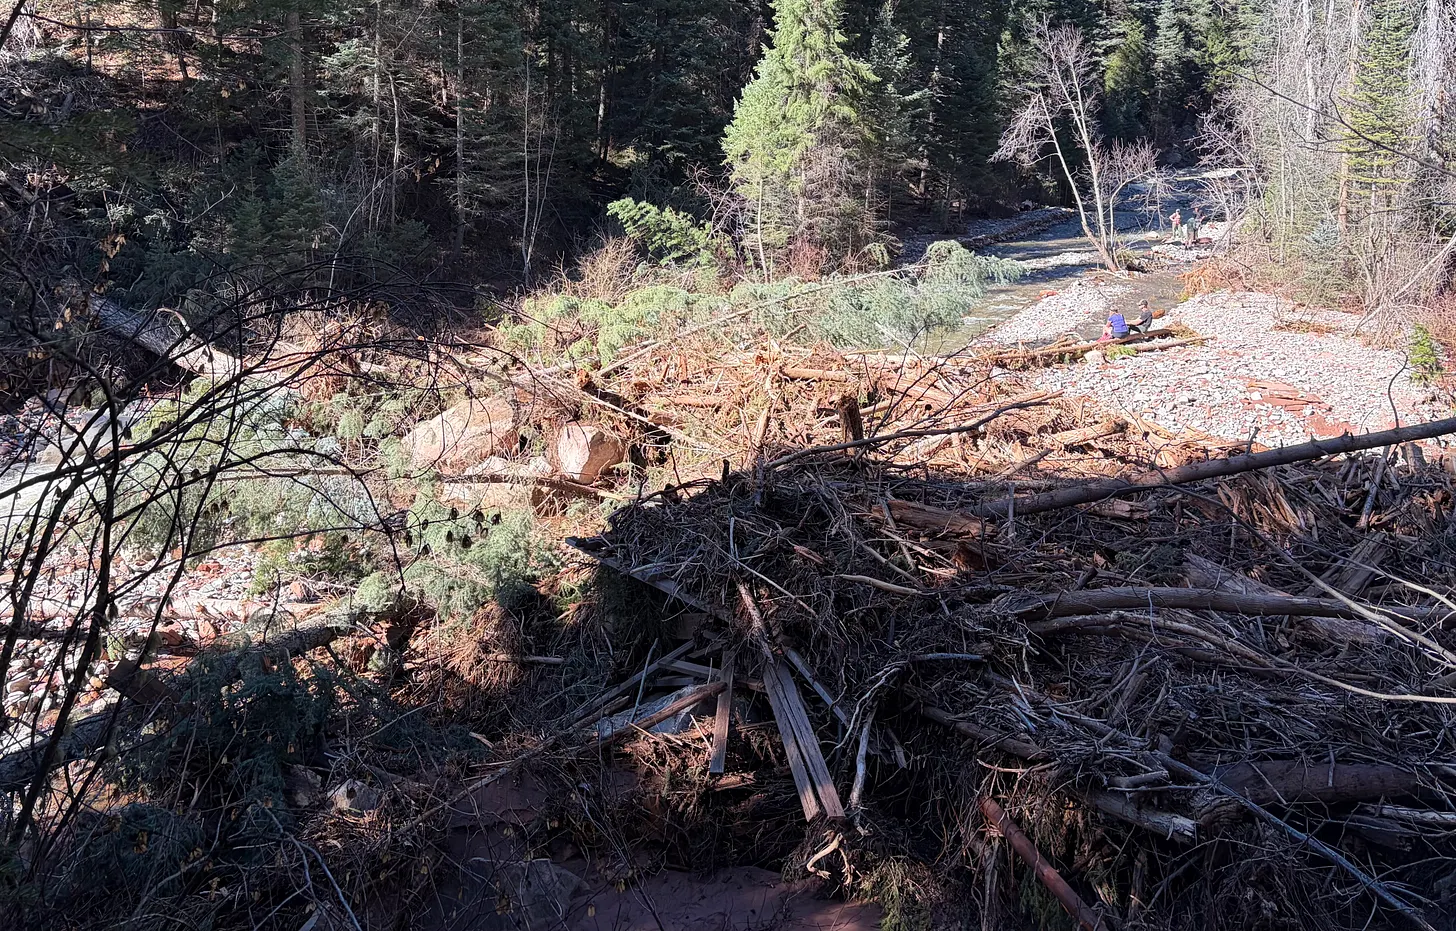
Logjam just downstream of where the Colorado Trail once crossed Junction Creek via a bridge. The flood demolished the bridge (the cut lumber seen in the logjam is all that remains). The U.S. Forest Service says it will likely begin rebuilding trail segments and bridges after the snow melts next spring. Jonathan P. Thompson photo.
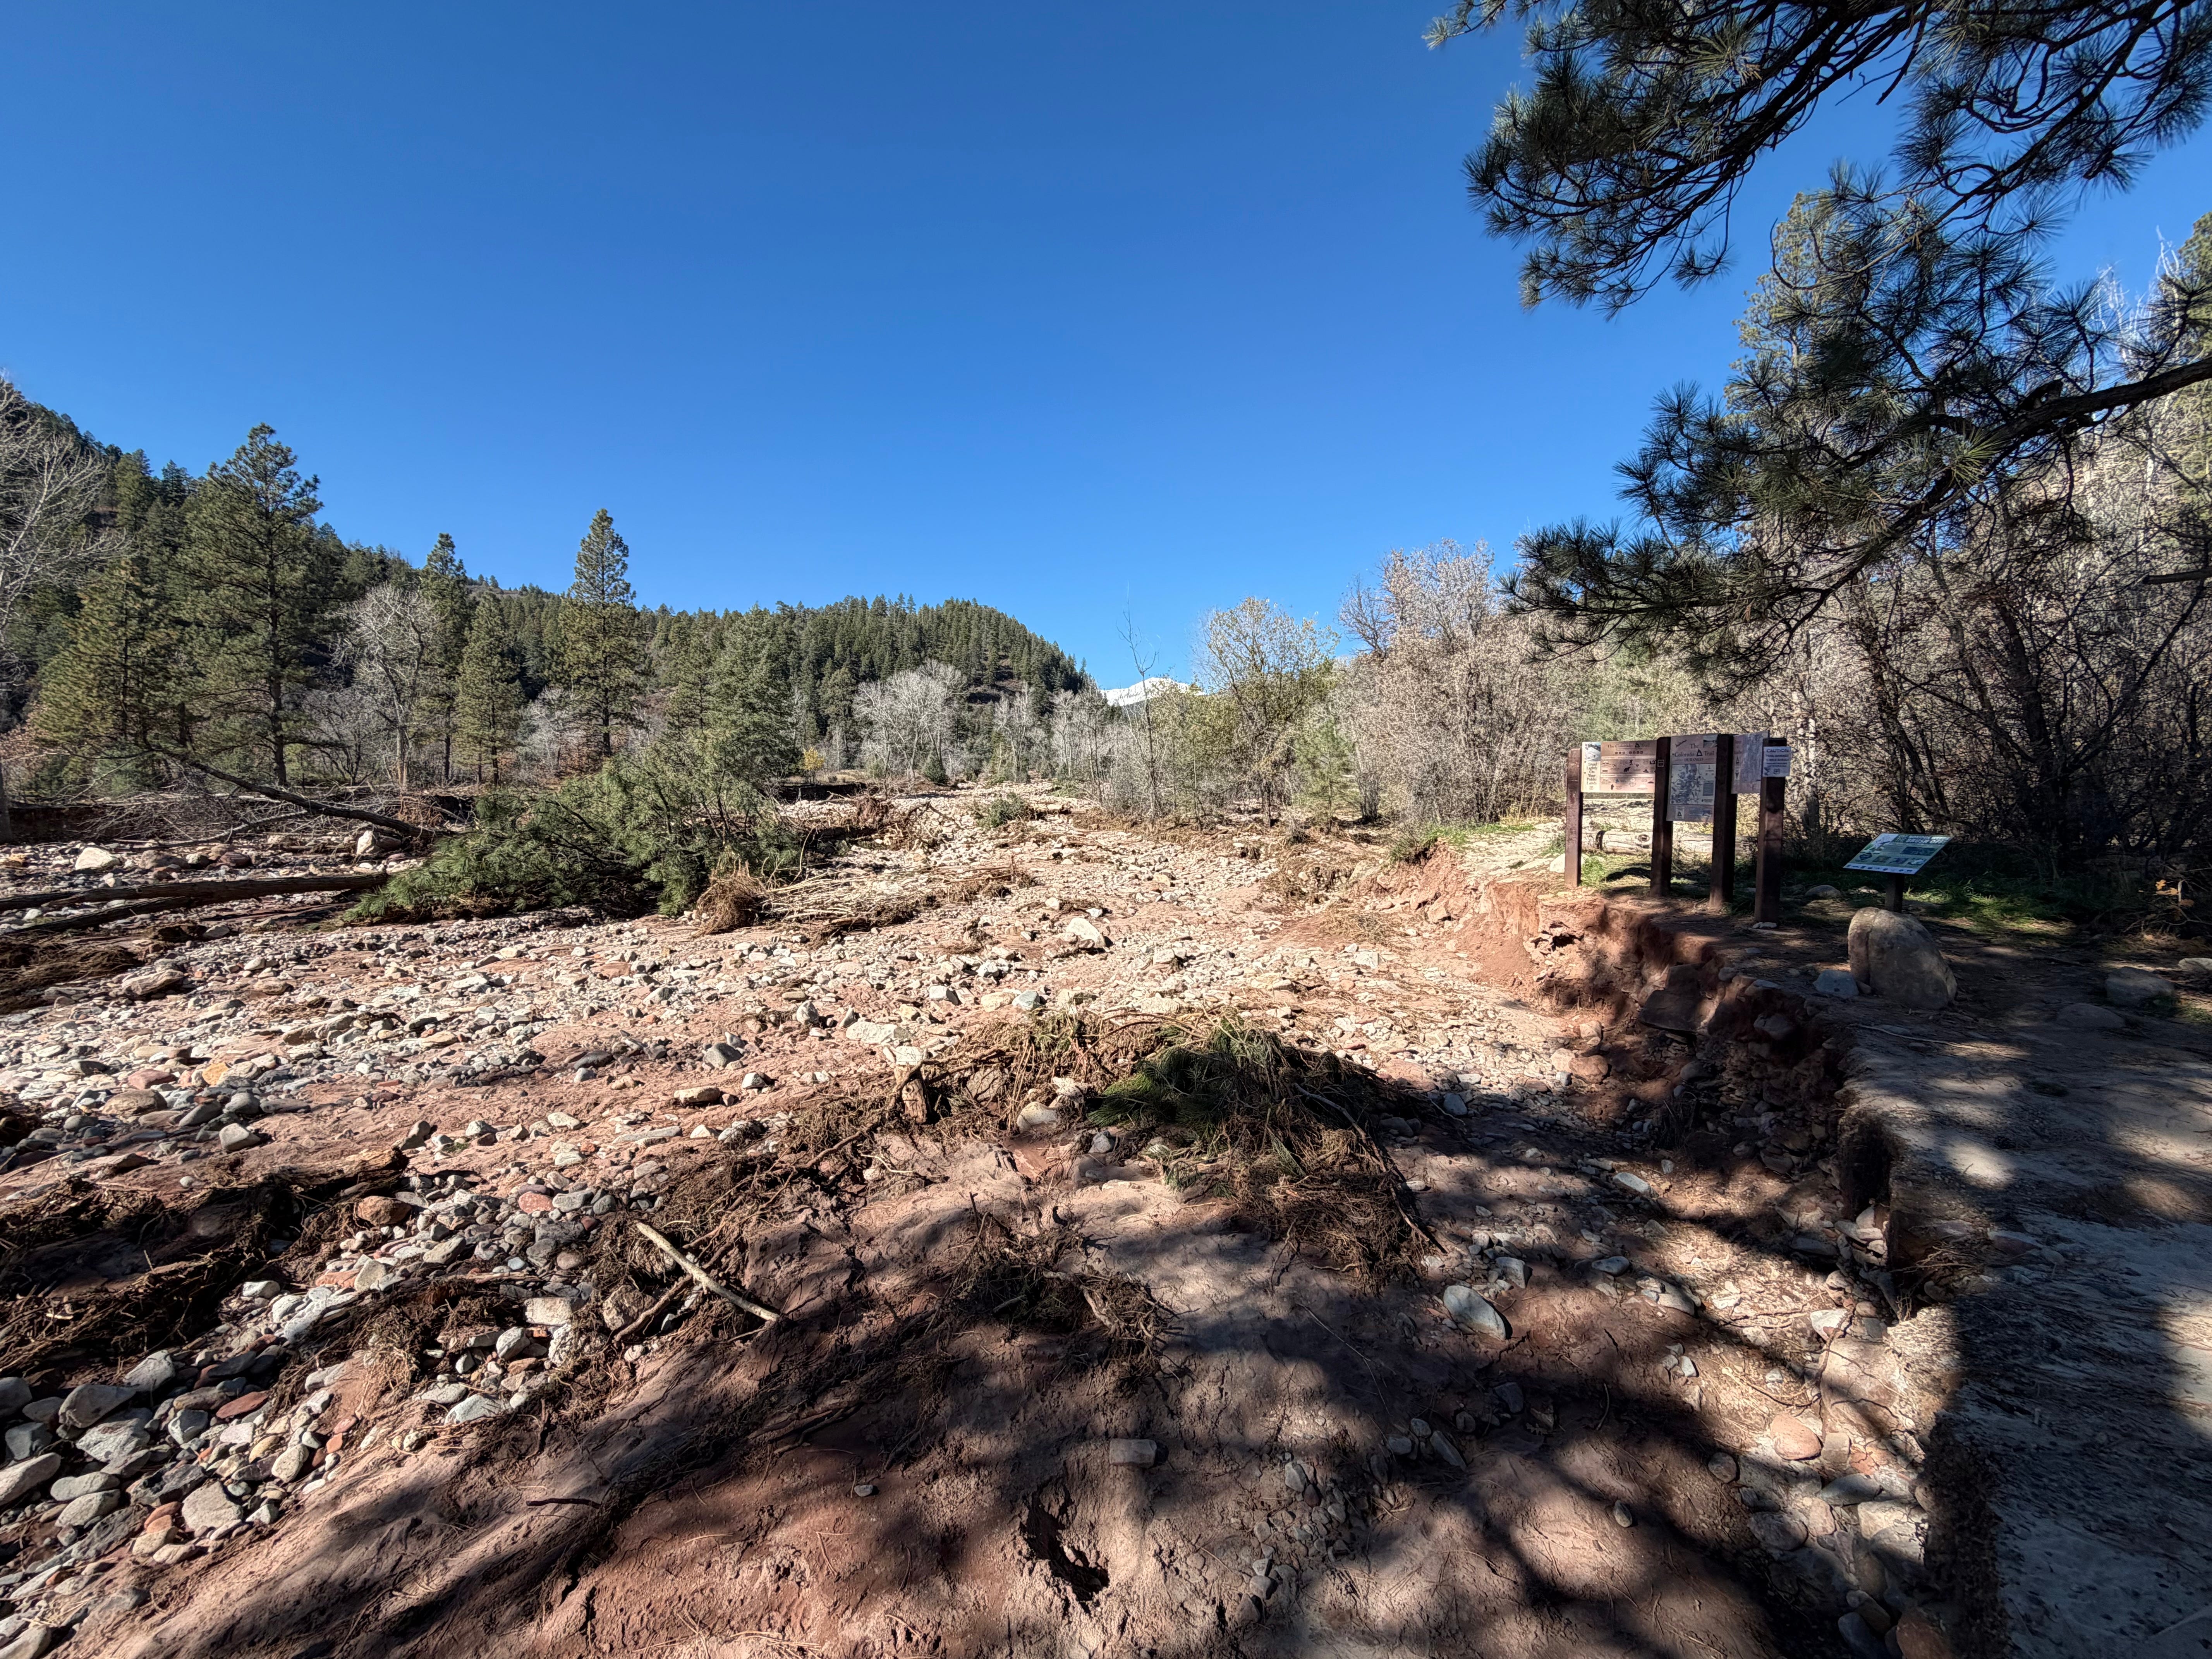
The Colorado Trail signs survived the flood, this segment of the Colorado Trail did not as a raging Junction Creek plowed a new, vastly enlarged streambed. Jonathan P. Thompson photo.
Flood damaged home along Junction Creek just downstream from the Colorado Trailhead. Jonathan P. Thompson photo.
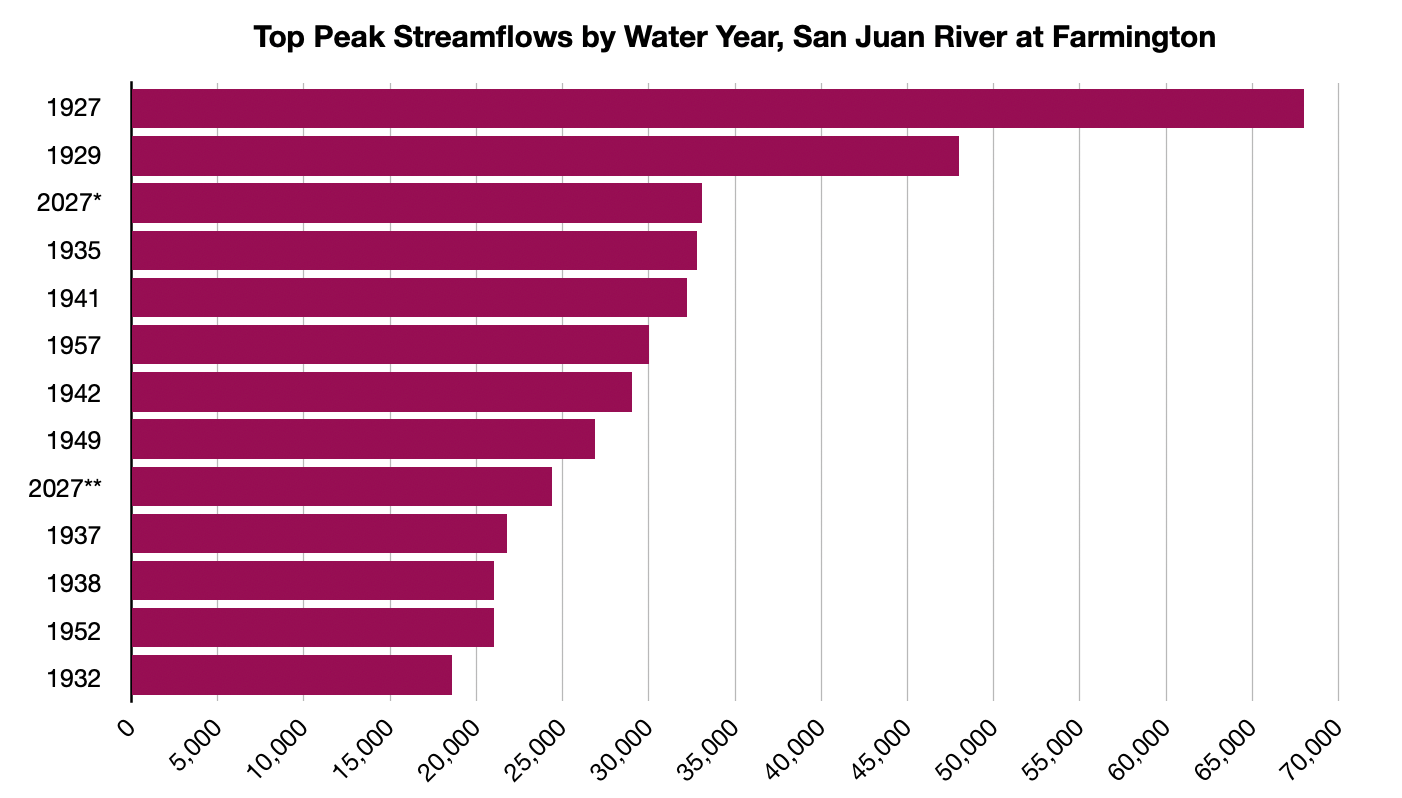
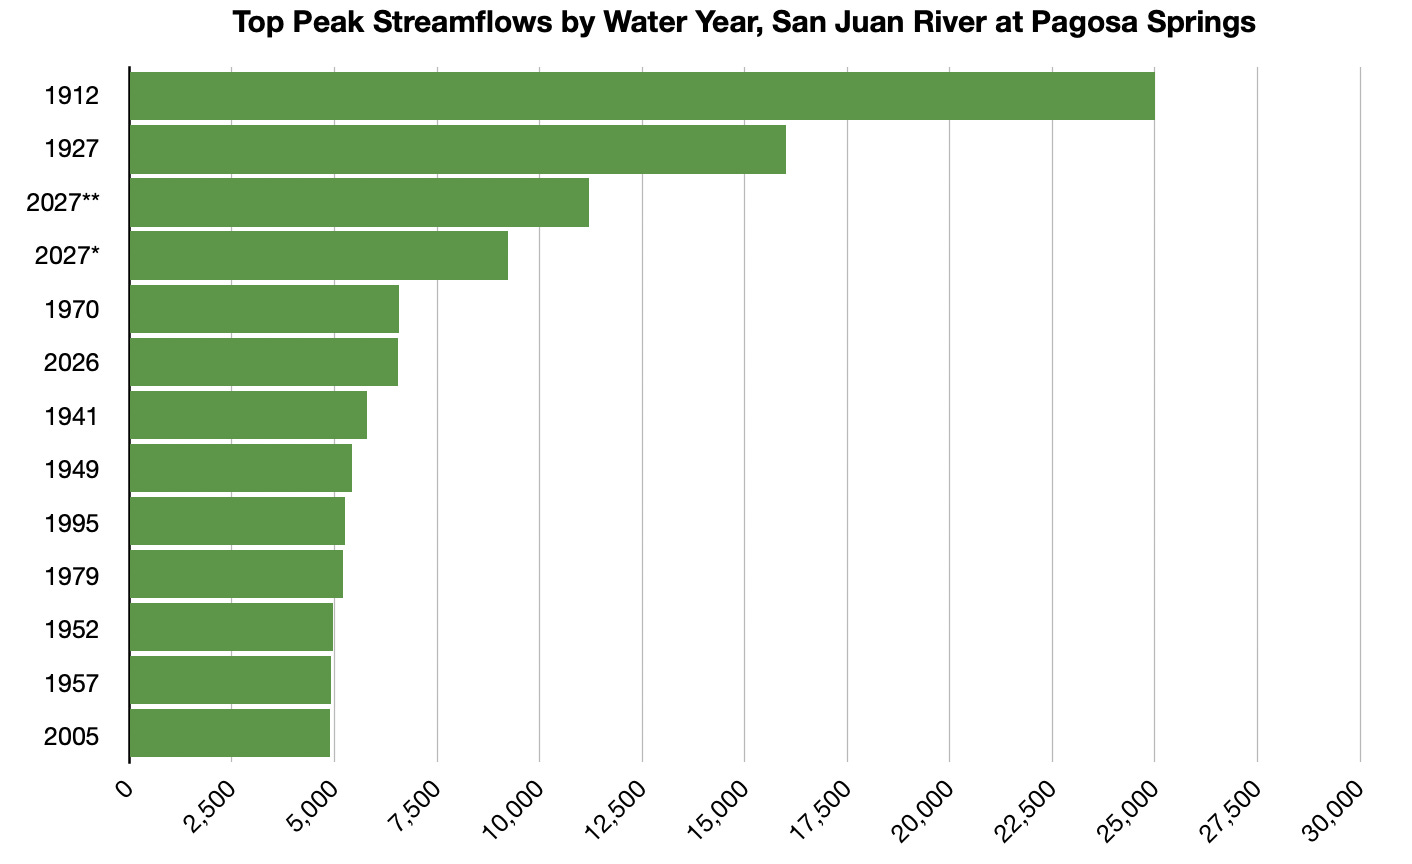
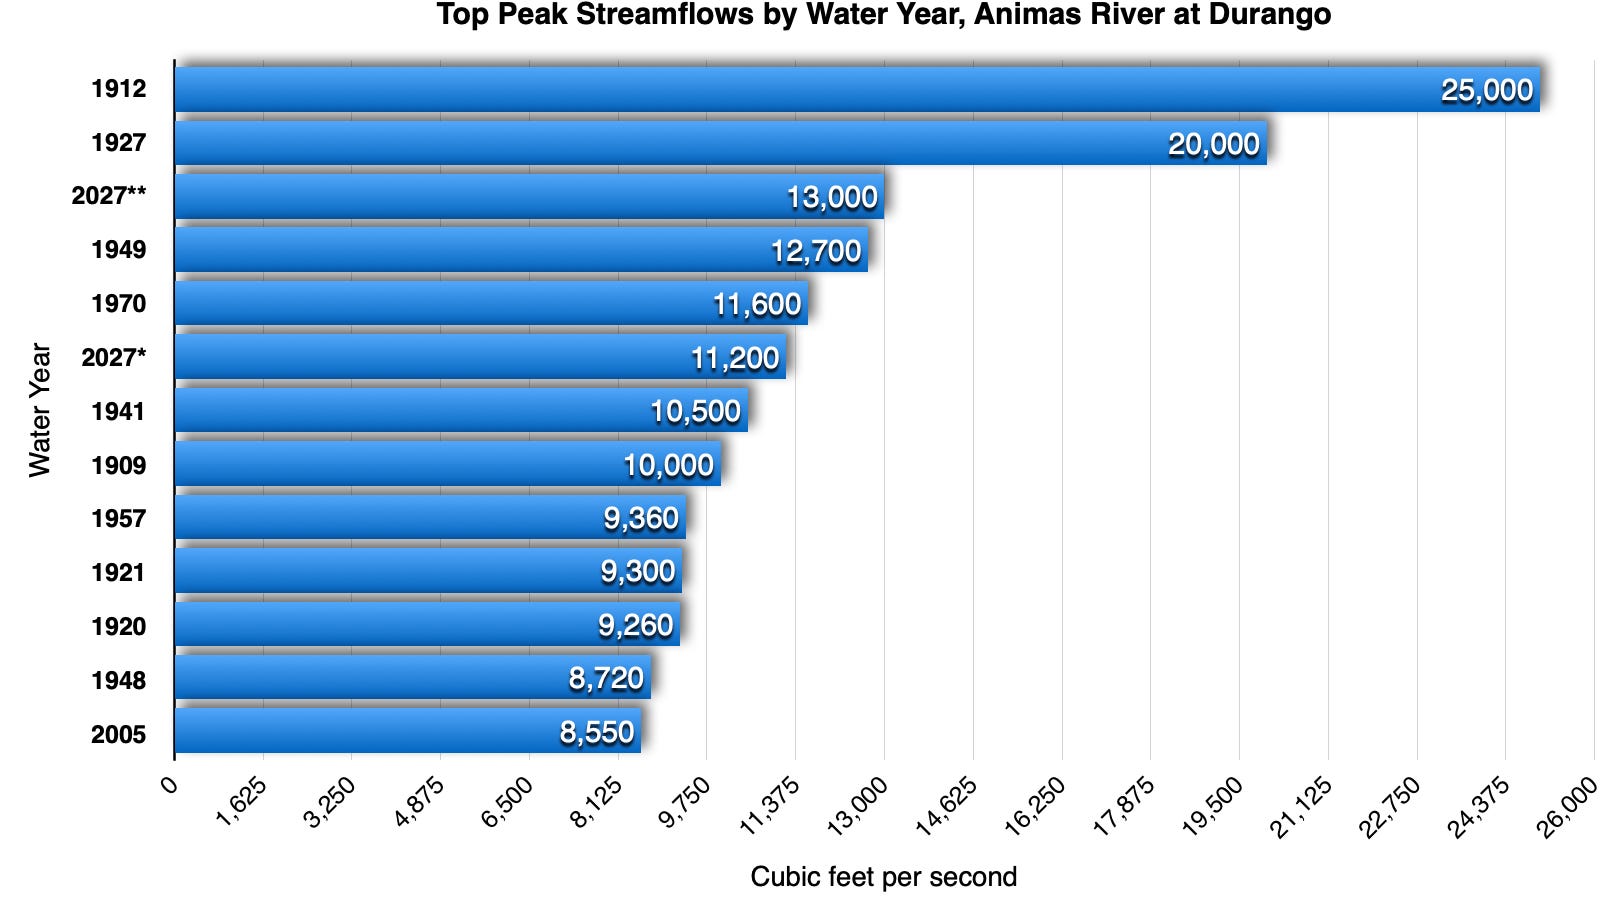
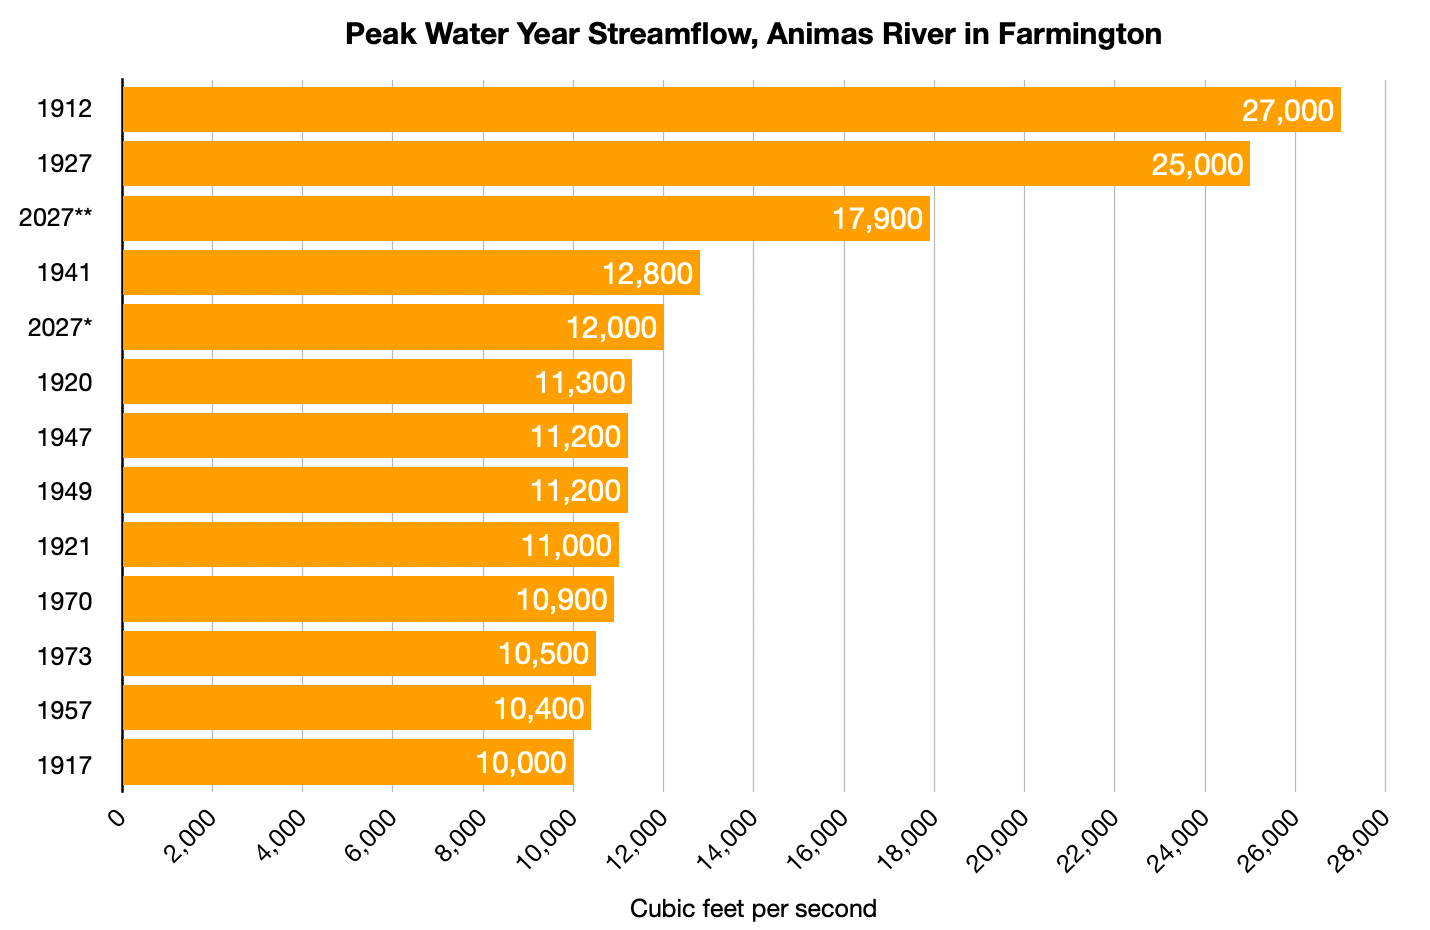
The graphs below are for water years (10/1-9/30), not calendar years (1/1-12/31). It’s a better timeframe for conceptualizing water, because the calendar year cuts the critical snow season in half, which doesn’t really allow you to compare one winter to another. The Water Year, on the other hand, begins right about when snow starts falling in the high country, and ends after the irrigation season. The USGS’s peak streamflow data is compiled by water year, not calendar year. Water Year 2027 began on Oct. 1, 2026, and ends on Sept. 30, 2027. That’s why this year’s floods show up as 2027 (and the Oct. 1911 flood shows up as 1912).
I also use streamflow (cubic feet per second) rather than gage height. I do this for two reasons: 1. I find that streamflow is less dependent on place and enables you to compare the San Juan River in Pagosa, for example, to the Animas River in Durango, because 2,000 cfs is the same amount of water in each place. Gage height doesn’t transfer from one place to another as easily, because it’s more dependent on the channel depth and width and so forth. 2. The USGS data does not show gage heights for every year on record, even when it does show streamflows.
*Late October 2026; **Early November 2026. The records do not go back to 1911, but a paleo-flood investigation in 2001 estimated that the river was flowing at about 150,000 cfs at or near this gage during that flood. This gage is actually near Mexican Hat, not Bluff, and has recently been renamed accordingly on the USGS site. Land Desk graph using USGS data.
*Late October 2026 (the gage malfunctioned at this level, so flows may have been higher); **Early November 2026. This gage’s records do not go back to 1911, which is why it’s missing from the chart. Judging by historic accounts, however, the flows in 1911 almost certainly would have exceeded those in 1927 at this site. Notice also that the October event’s flows were quite higher than the November event’s, even though flooding on the upper San Juan at Pagosa and on some San Juan tributaries was more severe during the latter event. Land Desk graph using USGS data.
*Late October 2026; **Early November 2026. On the Upper San Juan the flows were greater during the November event than during the October event, but in both cases they exceeded those in 1970. Notice that last year’s October event was nearly equal to the 1970 flood. Land Desk graph using USGS data.
*Late October 2026; **Early November 2026. The Animas River reached 13,000 cfs on Nov. 2, turning Smelter Rapid into something that most boaters are more accustomed to seeing in the Grand Canyon. It surpassed the 1970 flood by a considerable amount, but was still just over 50% of the 1911 flows.
*Late October 2026; **Early November 2026. The Animas River appears to have gained a whopping 4,900 cfs between the Durango gage and the Farmington one, which is just upstream from the confluence with the San Juan, during the early November event. It only gained 800 cfs during the October peak. It appears that a good portion of the extra water came from Lightner Creek, which enters the Animas about a mile downstream from the Durango gage (and which flooded severely enough to turn Highway 160 in Durango into a virtual river), as well as the Florida River. Tributaries to the Animas such as Hermosa Creek, Junction Creek, and Lightner Creek ran far larger during the second event than during the first one. Land Desk graph using USGS data.
6,072 feet: Surface level of Navajo Reservoir on Nov. 14, 2026, 62 feet above the Sept. 14 level. It went from just 46% full to 86% full in two months, during which it captured an estimated 700,000 acre-feet of water, equivalent to more than twice Nevada’s total annual allotment from the Colorado River.
63,368 cubic feet per second: Volume of water flowing into Lake Powell on Oct. 22, 2026. That’s the highest daily inflow since May 21, 2023, when an abundant snowmelt raised inflows to just over 74,000 cfs.
1.28 million acre-feet: Volume of water that flowed into Lake Powell during October 2026, the largest monthly inflow since June 2024.
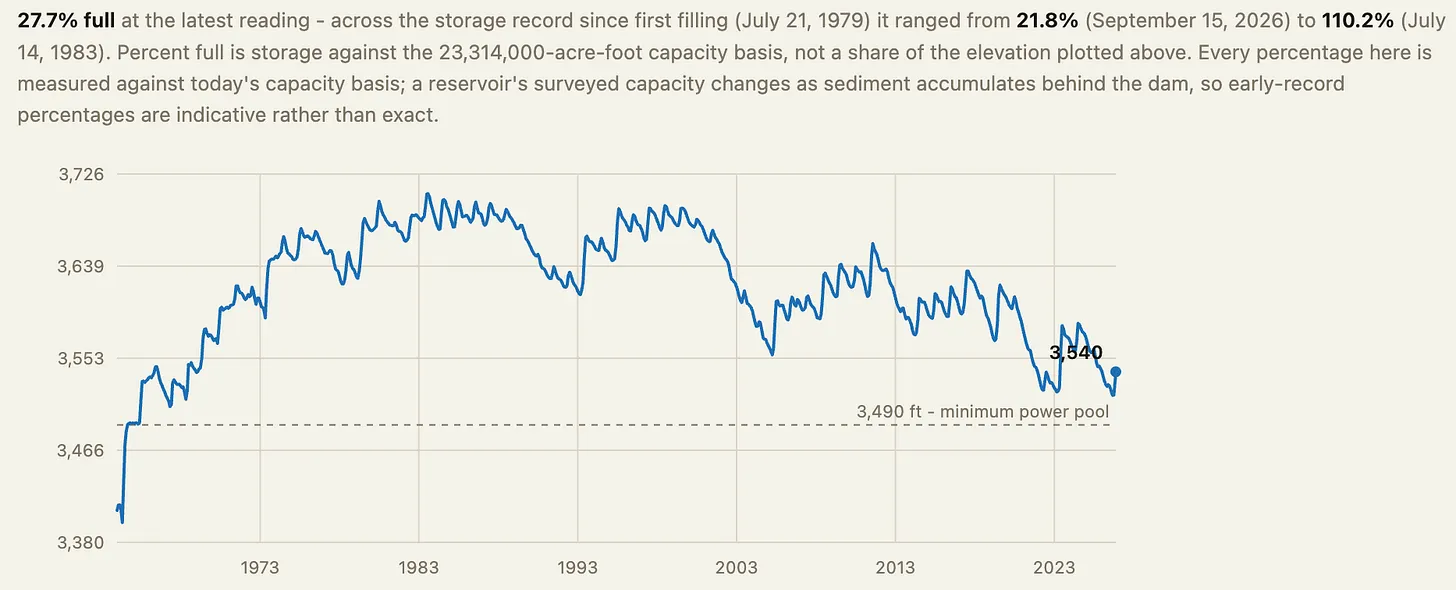
3,540 feet: Surface level of Lake Powell on Nov. 15, 2026, 24 feet above the Sept. 19 level of 3,516 feet, which was an all-time low and just six feet above the level (3,510) that the Bureau of Reclamation had vowed to “defend” by limiting releases from Glen Canyon Dam. While the boost buys dam operators (and Colorado River users and managers) some time, the level remains about four feet below what it was on this same date last year, and the reservoir is only 27% full.
Lake Powell’s surface elevation from 1963 to Nov. 16, 2026. Source: Reservoirbench
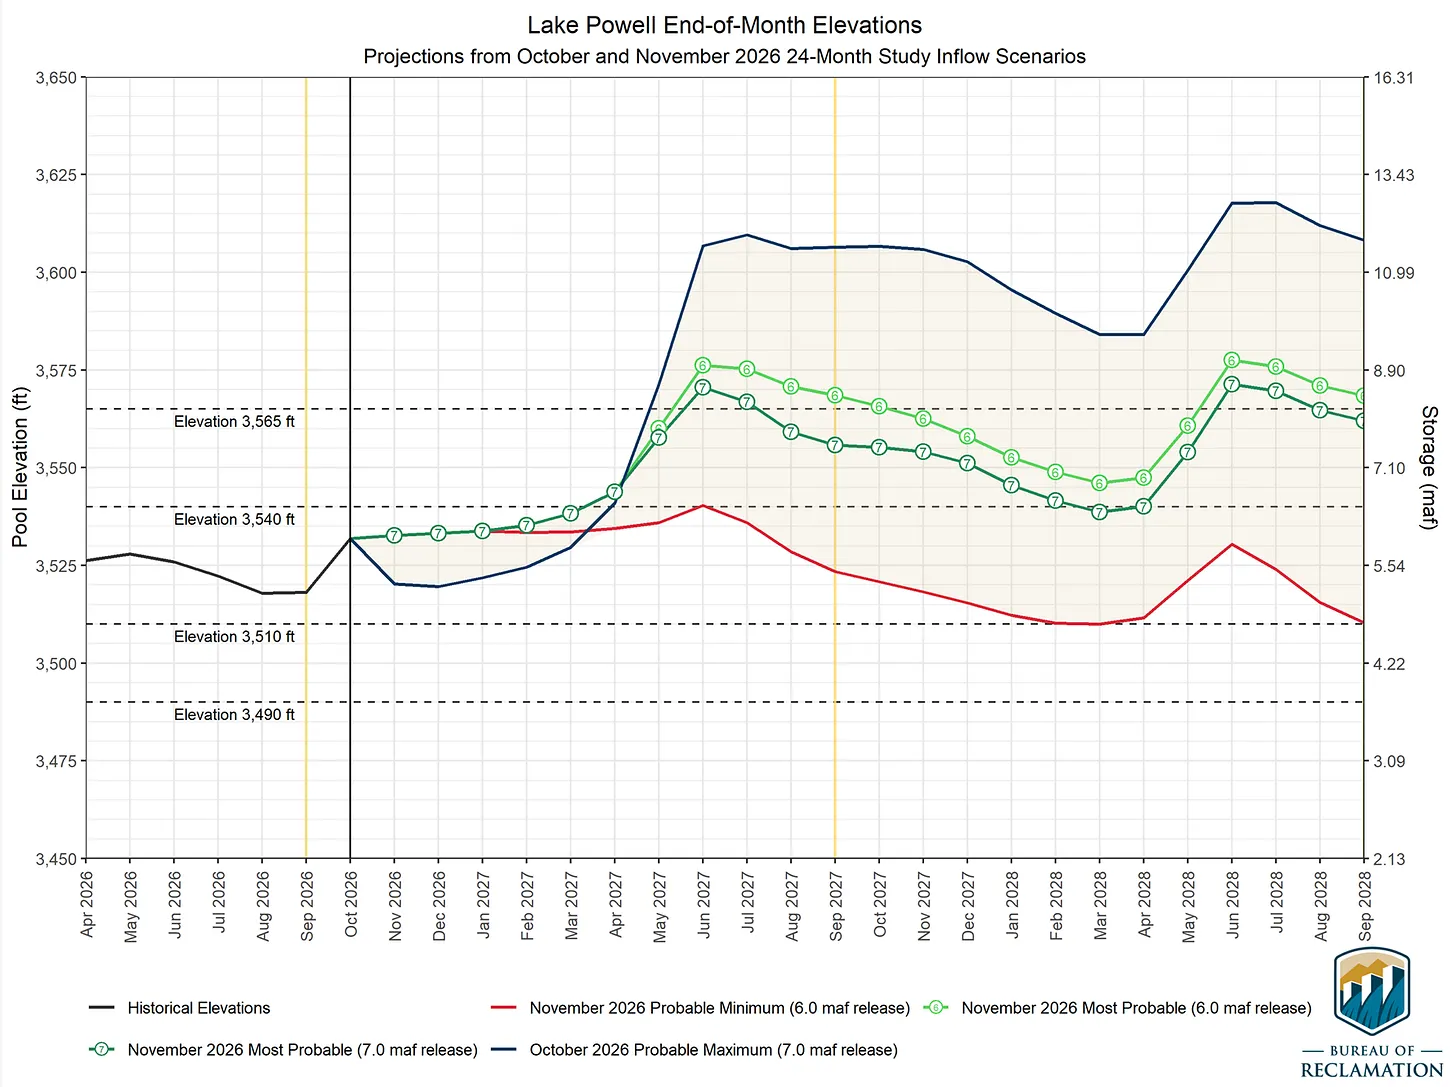
The deluge, and an apparent assumption that the weather pattern will continue throughout the winter, has brightened water managers’ outlook for Lake Powell (as seen in the graph below). But these “most probable” projections rely not only on a big 2026-27 winter, but also an abundant 27-28 winter, both with limited downstream releases from Glen Canyon Dam (6 MAF and 7 MAF). And even then, it has the reservoir ending water year 2028 at just about half of capacity, gains that could be wiped out in just one or two below-average winters.
The urgency to cut consumption throughout the river basin, in other words, remains.
📸 PARTING SHOT 🎞️
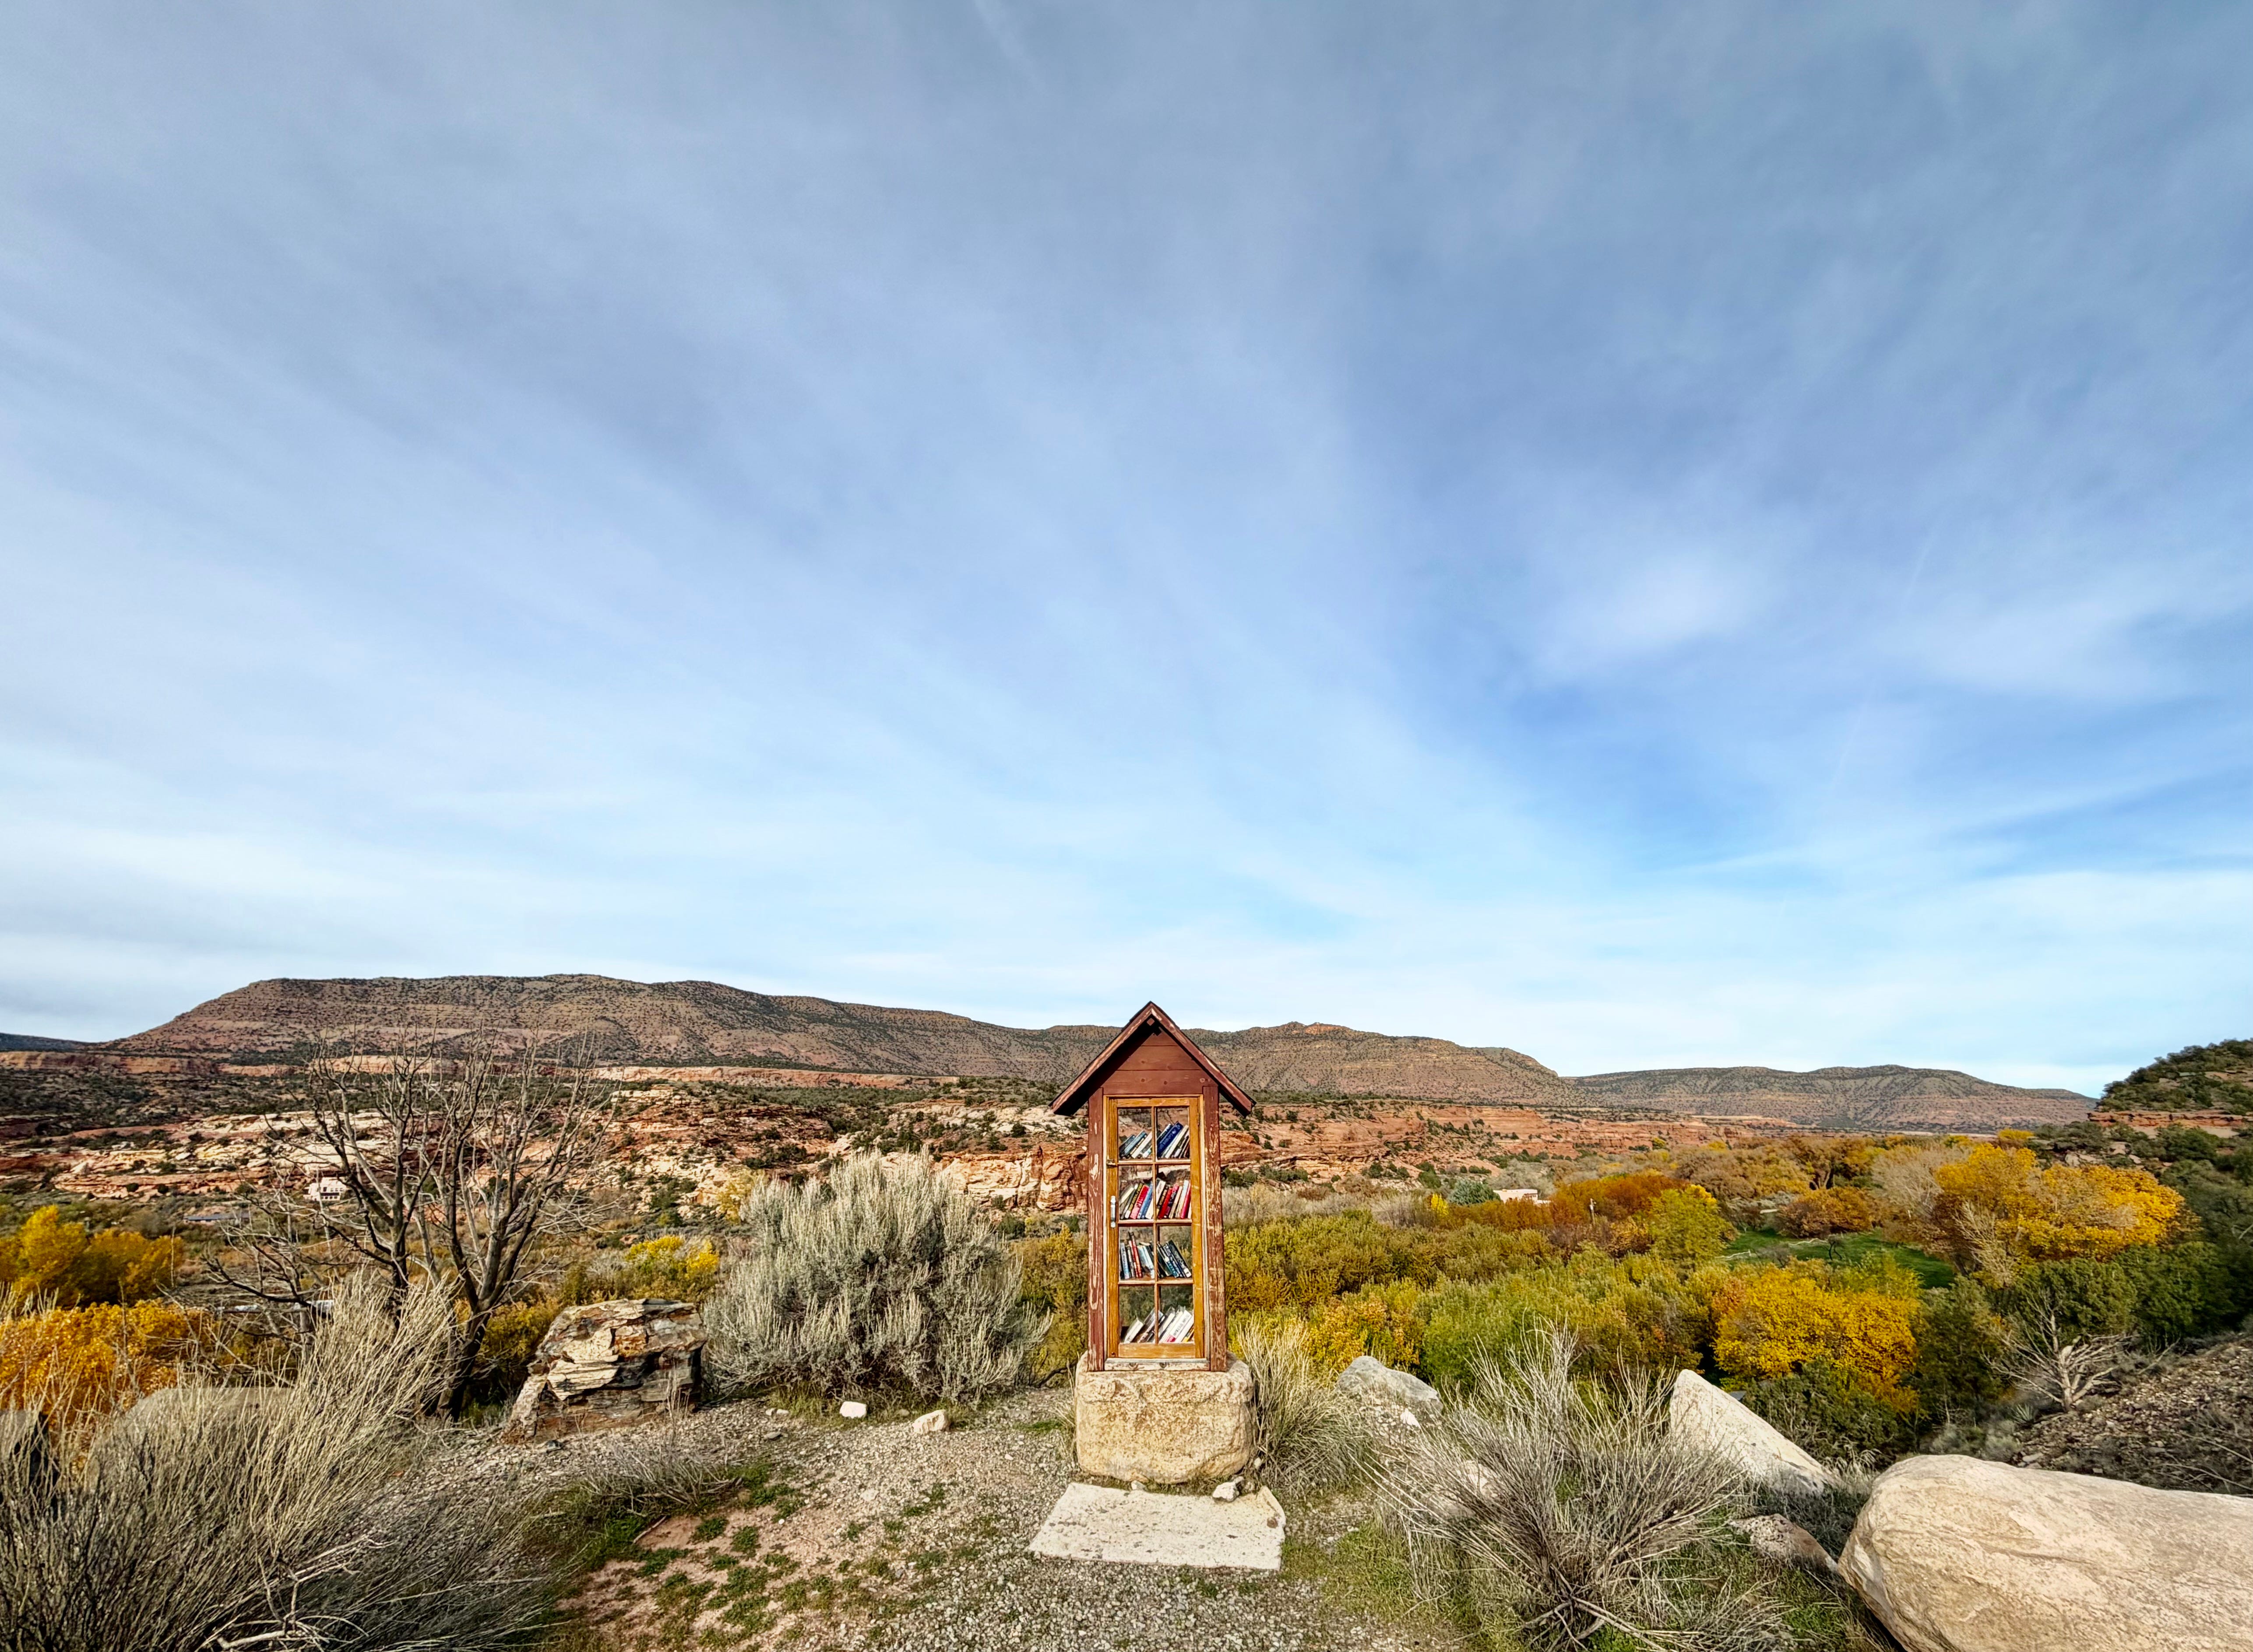
McElmo Canyon tiny library. The most scenic one of all? Jonathan P. Thompson photo.