#Snowpack news: #SanJuanRiver Basin SWE = 80.4% of normal

From The Pagosa Springs Sun (Chris Mannara):

This week, snow water equivalency (SWE) is 25.9 inches. Last week, it was 26.4 inches.

The SWE median has increased, however, going from 31.7 inches to 32.2 inches this week.

This week, SWE data is 80.4 percent of median, compared to last week, when it was 83.3 percent of median.

This week, precipitation data is recorded at 26.5 inches. Last week, it was 25.9 inches.

The precipitation median has increased as well, going from 33.5 inches to 34 inches this week.
Precipitation data is 79.9 percent of median this week. Last week, it was 78.8 percent of median.

Westwide SNOTEL basin-filled map April 10, 2020 via the NRCS.

April 2020 “Confluence” newsletter is hot off the presses from @CWCB_DNR

Cache la Poudre River from South Trail via Wikimedia Foundation.

Click here to read the newsletter. Here’s an excerpt:

Governor Polis Signs Bill to Expand Voluntary Loans Process for Instream Flows

On March 20, Governor Jared Polis signed into law House Bill 1157 (HB20-1157), which provides additional tools to the Colorado Water Conservation Board (CWCB) for managing voluntary loans from water rights owners for the purposes of preserving and improving the natural environment… Read More

Aspinall Unit operations update: April 1st runoff forecast for Blue Mesa Reservoir predicts 78% of average for April-July inflows

Aspinall Unit dams

From email from Reclamation (Erik Knight):

Releases from the Aspinall Unit will be increased to 1450 cfs on Thursday, April 9th. Releases are being adjusted to accommodate the change in diversions to the Gunnison Tunnel, which will occur on Friday, April 10th. Snowpack in the Upper Gunnison Basin is currently at 101% of normal. The April 1st runoff forecast for Blue Mesa Reservoir predicts 78% of average for April-July inflows.

Flows in the lower Gunnison River are currently above the baseflow target of 1050 cfs. River flows are expected to stay above the baseflow target for the foreseeable future.

Pursuant to the Aspinall Unit Operations Record of Decision (ROD), the baseflow target in the lower Gunnison River, as measured at the Whitewater gage, is 1050 cfs for April and May.

Currently, Gunnison Tunnel diversions are 720 cfs and flows in the Gunnison River through the Black Canyon are around 430 cfs. After this release change Gunnison Tunnel diversions will be around 920 cfs and flows in the Gunnison River through the Black Canyon will be around 530 cfs. Current flow information is obtained from provisional data that may undergo revision subsequent to review.

@Northern_Water increases 2020 C-BT quota to 70 percent #ColoradoRiver #COriver #aridification

Screenshot of the Colorado-Big Thompson Project boundaries via Northern Water’s interactive mapping tool , June 5, 2019.

Here’s the release from the Northern Colorado Water Conservancy District:

Above average regional water storage coupled with above average snowpack prompted the Northern Water Board of Directors to increase its 2020 quota allocation for the Colorado-Big Thompson Project to 70 percent.

The Board unanimously approved the allocation at its meeting Thursday, April 9, 2020, which was held via video to comply with state stay-at-home orders as part of the global coronavirus (COVID-19) outbreak.

Luke Shawcross, manager of the Water Resources Department at Northern Water, outlined snowpack and forecasted streamflows and discussed the available water supplies in regional reservoirs.

When setting the quota the Board considers current regional reservoir storage levels, forecasted snowpack runoff, availability of water within the C-BT system and public input.

The Board has been setting C-BT quota since 1957 and 70 percent is the most common quota declared. It was also the quota set for the 2019 water delivery season.

The quota increases available C-BT Project water supplies by 62,000 acre-feet from the initial 50 percent quota made available in November. Water from the C-BT Project supplements other sources for 33 cities and towns, 120 agricultural irrigation companies, various industries and other water users within Northern Water’s 1.6 million-acre service area. According to recent census figures, approximately 1 million residents now live inside Northern Water’s boundaries. To learn more about Northern Water and the C-BT quota, visit http://www.northernwater.org.

Six Feet in Solidarity – Week 4: Water Reuse — @WaterEdCO

From Water Education Colorado (Caitlin Coleman):

The Promise of Reuse

For decades, Colorado has been recycling water for landscaping purposes. More recent has been indirect potable reuse, where treated wastewater flows through an environmental buffer, such as a river, before being extracted for further treatment to make it suitable for drinking and other domestic uses.

Now, Colorado and several other water-stressed states are moving toward direct potable reuse. “Widespread development of potable reuse will be an important facet of closing the future water supply-demand gap,” said the Colorado Water Plan, published in 2015 in Chapter 6.3.2, the Water Supply Management-Reuse chapter, which includes information on reuse beginning on page 6-75.

Potable reuse most certainly won’t be a cure-all for Colorado’s water shortages. It’s just one potential tool in a kit, applicable for specialized settings. But wide adoption of direct potable reuse relies, at least in part, on adoption of state standards governing treatment processes and monitoring protocols. Read about it in “Purified” from our Fall 2018 issue of Headwaters magazine, which focused on water reuse.

Is Colorado working on state regulations to govern direct potable reuse?

Yes. A new report, crafted by a National Water Research Institute-organized panel of reuse experts, details potential Colorado Department of Public Health and Environment regulations for direct potable reuse (DPR), which isn’t addressed in current regulations.

The report is part of WateReuse Colorado’s efforts to follow up on the water plan, which said Colorado needed a clear regulatory framework on reuse if reuse is to help address the future water supply-demand gap.

Getting this framework in place will give utilities the certainty they need to pursue DPR, which is critical for optimizing supplies they already have, says Laura Belanger from Western Resource Advocates.

Read what the report says and next steps in Colorado in the story “Getting Closer to Governing Direct Potable Reuse” from the new Spring 2020 issue of Headwaters magazine.

How does reuse optimize water supplies?

Check out the graphic below to conceptualize the multiplying effect of reuse:

Graphic credit: Water Education Colorado

Is water reuse on the rise?

In February, 2019, WEco offered a webinar exploring this question. Watch it to hear local experts discuss why more communities are turning toward water reuse and what regulations, policies, or other next steps need to fall into place for water recycling to grow. Watch it here</a

Animas Valley gravel mine plans to close, go commercial — The Durango Herald

Lake Nighthorse and Durango March 2016 photo via Greg Hobbs.

From The Durango Herald (Jonathan Romeo):

Public worries about access point on Animas River

An inactive gravel mine in the Animas Valley plans to formally shut down and repurpose the land for a large-scale commercial development. The move has some in the rafting community wondering what will become of a popular river put-in along the Animas River.

For the past few years, the nearly 50-acre gravel mine owned by Four Corners Materials, Inc. at 876 Trimble Lane (County Road 252), near Trimble Crossing and along the Animas River, has sat idle.

On Thursday, however, the owners requested a change in land-use designation for the property, from industrial to commercial, which would allow a range of new developments on the land…

The main issue at a La Plata County Planning Commission meeting Thursday was the fate of the river access point to the Animas River, just downstream of the Trimble bridge.

The boat ramp is privately owned by Four Corners Materials, but for years, the company has allowed the public to access the Animas.

During public comment, residents worried future development plans would close off the access point.

Kent Ford, a professional kayaker who lives in Durango, stressed the importance of the boat ramp, which is the only take-out for boaters who run the Animas down from Bakers Bridge, and the only put-in for river runners traveling to Oxbow Park or 32nd Street.

TomTalks Episode 1: Italy, Colorado, and their Water Connection — @OWOW_MSUDenver

From the One World One Water Center at Metropolitan State University of Denver:

The OWOW Center has launched a new series of educational videos to help us all feel a bit more connected during this very disconnected time. Every couple weeks Tom Cech will sit down with experts, some new faces and some you may recognize, to discuss and dissect the many facets of water in Colorado and around the world. So top off your water bottle and join us for the very first episode of TomTalks!

Tom Cech, co-director of the One World One Water Center at Metropolitan State University of Denver. Source: University of California, Berkeley

As oil crashes, ‘America’s untapped energy giant’ could rise — Grist #ActOnClimate #KeepItInTheGround

Geothermal Electrical Generation concept — via the British Geological Survey

From Grist (Emily Pontecorvo):

The coronavirus pandemic has mostly yielded bad news for renewable energy. Disruptions to supply chains and slowdowns in permitting and construction have delayed solar and wind projects, endangering their eligibility for the soon-to-expire investment tax credits they rely on. There’s another form of renewable energy, however, that might see a benefit from the recent global economic upheaval and emerge in a better position to help the United States decarbonize its electricity system: geothermal…

Unlike wind and the sun, subsurface heat is available 24/7, perpetually replenished by the radioactive decay of minerals deeper down. But compared to wind and solar farms, geothermal power plants are expensive to build. The cost can range from $2,000 to $5,000 per installed kilowatt, and even the least expensive geothermal plant in the U.S. costs more than double that of a utility-scale solar farm. Engineers have to drill thousands of feet into the ground to reach reservoirs of water and rock hotter than 300 degrees F in order for the plants to be economical. Plants generate electricity by pumping steam or hot water up from those reservoirs to spin a turbine which powers a generator.

Experts told Grist that drilling can account for anywhere between 25 to 70 percent of the cost of a project, depending on where it is, the method of drilling, and the equipment required. But now, the companies that supply the machinery and services for drilling are starting to slash rates.

That’s because they are the same suppliers the oil industry uses, but oil companies are idling drilling rigs and cutting contracts left and right. They’re getting pummeled by the largest oil price crash in decades, the result of plunging demand due to the pandemic and a glut in supply because of a price war between Saudi Arabia and Russia. On Tuesday, the U.S. Energy Information Administration revised its short-term outlook for crude oil production, predicting a steep decline through 2021. All of the suppliers who are normally digging for oil are now eager for new business.

Tim Latimer, a former drilling engineer for the oil and gas industry and now the cofounder and CEO of Fervo Energy, a geothermal energy company (and a 2020 Grist 50 Fixer) said suppliers have already been willing to knock 10 percent off quotes they gave him a few weeks ago. In a recent Twitter thread, Latimer predicted that drilling costs could drop by as much as 20 to 40 percent. On top of that, interest rates are down, and recovery bills with new funding for clean energy are potentially around the corner.

Lowering the up-front cost of building a geothermal power plant would allow plant operators to bring down electricity prices, which could attract new interest in geothermal from utilities. “If you can bring that price down even a little bit,” Latimer said, utility buyers “get a lot more excited about it because they want to have something in their portfolio that can produce electricity at night.”

In California, which has set a target of 100 percent clean electricity by 2045, energy providers are starting to recognize the benefits of geothermal’s round-the-clock power and have agreed to purchase power from two new plants being built in the state. But in states where there isn’t as much pressure to decarbonize, it’s a tough sell: The cost of electrons from a geothermal plant can be more than three times as high as those from solar and wind.

Part of the problem, according to Susan Petty, the chief technology officer, president, and co-founder of geothermal company AltaRock Energy, is that utilities don’t place extra value on geothermal’s ability to generate electricity all the time. She said bringing drilling costs down will help, but it would help even more if there were parity in the tax incentives for renewables: This year, geothermal electricity projects were eligible for a 10 percent investment tax credit, compared to a 26 percent credit for solar and wind.

Geothermal faces other hurdles, like a lengthy permitting process that stretches out project timelines. It can be challenging to find investors during the early, risky stages of a project, before the viability of developing a given site has been proven. Geothermal also suffers from a PR problem — people just aren’t as familiar with it as they are with wind and solar. The technology has been around in the U.S. since the 1960s, but for these reasons and others, geothermal still only makes up 0.4 percent of the U.S. electricity mix.

Map of Western US geotthermal areas via the USGS

Feds approve drilling plan for North Fork Valley that endangers communities — Western Slope Conservation Center #ActOnClimate #KeepItInTheGround

Courtesy of EcoFlight via The High Country News.

Here’s the release from the Western Slope Conservation Center (Ben Katz):

[On February 10, 2020]…the Bureau of Land Management released its Uncompahgre Field Office Resource Management Plan despite concerns and formal protests from stakeholders in the North Fork Valley and beyond. While Colorado’s governor and the public are focused on a major health crisis in the state, the BLM released a plan that could open up 95% of the public lands in the area to oil and gas development, threatening local farmers and businesses in the region.

Community leaders say the plan fails to protect public health, provide ecological well-being, or promote a sustainable rural economy on Colorado’s Western Slope. These leaders say that at a time when small businesses are shutting their doors and communities of the rural Western Slope are telling visitors to stay away, the Trump Administration should not be barreling forward with land use planning that harms our community and environment.

The final plan, which the BLM began revising in 2010, is meant to guide all activities and development in the Uncompahgre Field Office planning area for the next two decades. Today we see the final plan opens the entirety of the North Fork Valley to oil and gas leasing and development while removing or limiting critical protections to safeguard the local community’s air, water, wilderness, and wildlife. Despite making minor changes at the request of Governor Polis, the plan is dramatically out of step with the protections local residents have requested for a decade.

The most disappointing aspect of the final plan is that it undermines years of collaboration and local engagement, completely disregarding a community crafted plan for the North Fork Valley. In 2014, a diverse group of North Fork stakeholders, including agricultural, tourism, realty, business, and conservation organizations, came together and developed a “community alternative” – essentially a locally grown vision and set of guidelines – for oil and gas management in the area. Called the North Fork Alternative Plan, the balanced proposal would allow for the consideration of regulated energy development on up to 25 percent of the area’s federal lands with additional protections for lands important to hunting, fishing, and other outdoor recreation activities. The agency’s final plan ignores this community proposal, and in turn, dismisses the community’s own vision for a sustainable future and diverse economy.

Recently released documents by Public Employees for Environmental Responsibility (PEER) through the Freedom of Information Act show beyond a doubt the final plan is the result of political maneuvering by the Trump administration to impose its “energy dominance” agenda on Colorado. The internal documents acquired by PEER reveal that Trump administration officials at the national BLM office overruled local agency staff and ignored local public input in order to “align the preferred alternative with administration priorities” such as deregulation of the oil and gas industry. Ironically, this decision comes at a time when the BLM is relocating its headquarters from Washington, DC to Grand Junction ostensibly to allegedly “delegate more responsibility to the field,” according to acting BLM Director William Perry Pendley.

The following are quotes from several organizations and stakeholders who have been working for decades to advance conservation efforts in Colorado and have been participating in the BLM UFO RMP revision process:

“An administration that supports a resilient local economy wouldn’t move forward with a plan that clearly disrespects the best interests of the North Fork community, yet this is exactly what’s happening. This plan is a triple threat: it ignores a decade’s worth of community input, it undermines our economic future, and it endangers the very public lands and waters that our local farms, ranches, vineyards, and recreation businesses depend on. As Colorado’s Western Slope residents and the rest of the country battle with a national emergency, the BLM is charging ahead to open lands that aren’t essential for the country’s oil and gas resources. Kicking our small businesses and communities while they’re down is just plain shameful.” – Patrick Dooling, Executive Director, Western Slope Conservation Center

“It’s disgraceful that Secretary Bernhardt and BLM Acting Director William Perry Pendley are using the COVID-19 pandemic as cover for their continued efforts to sell out our public lands. Coloradans are rightfully focused on the health and safety of our loved ones during this trying time, yet the BLM is jeopardizing the livelihoods of farmers and business owners who depend on this region’s beautiful land and pristine water. Opening 95% of the lands in this area to potential development shows that the administration puts drilling above all else, no matter the cost to air, water or people’s way of life, or even our health.” – Jim Ramey, Colorado State Director, The Wilderness Society

“The Trump administration dropping this broadly opposed plan now, in the midst of a pandemic, only adds insult to the deep injury many North Fork farms and businesses are already suffering. We came together as a community and presented a plan to the BLM, which it has ignored in releasing this mess. We worked in good faith and that was betrayed, but we’re not done standing up for our farms and families.” – Pete Kolbenschlag, Executive Director, Colorado Farm & Food Alliance

“I grow food in the farm-to-table capital of Colorado, the Lower Gunnison watershed. Over the past nearly ten years I’ve worked to identify to the BLM what I need them to consider as they make their land-use decisions for the lands around and upstream of me. For my farm, and the nearly 100 other Valley Organic Growers Association (VOGA) producers in this valley, this means clean air, clean water, and an understanding that our reputation for clean delicious food is easily destroyed. I am disappointed that the BLM has ignored the agricultural community of the North Fork in its RMP, and has failed to listen to and consider the input we’ve worked hard to give them.”- Mark Waltermire, owner, Thistle Whistle Farms

“The North Fork Valley has felt the impacts of oil and gas development on our local economy before and has successfully diversified its economy away from fossil fuel development. The real estate markets were thriving prior to COVID-19 and are holding steady with buyers continuing to close on properties they completed contracts on prior to the statewide lockdown. With this impending plan, the BLM is sending our community backwards, setting us up to be at the whims of the oil and gas industry development and threatening the local economy. At a time when we can’t even show homes or hold open houses due to COVID-19, the release of this plan feels like salt in the wound.” – Patti Kaech, Broker/Owner, Colorado Premier Partners Realty

“When the coal mines began to close, everyone said the sky was falling. Yet, we worked hard to build and diversify our local economy based on local business, renewable energy, sustainable outdoor recreation, and organic farming. We are stronger now and people are moving here to embrace this way of living, not to be surrounded by industrial oil and gas development. Despite that, the energy-dominance agenda the BLM has in mind is at odds with our vision of the future. Furthermore,the Trump Administration says they are here to help small businesses, yet seem to put another nail in our coffin at this unprecedented time. The BLM needs to re-engage with the community and develop a plan to protect the public lands in the North Fork Valley that support our diverse economy.” – Chelsea Bookout, co-owner, Remedy Juice and Cafe

“Right now, we have the opportunity to bolster a sustainable and long term recreation industry in the Lower Gunnison watershed. We have the wildlands, the community, and the ambition needed to develop and maintain a strong recreation sector of the local economy. Turning the valley into a short term oil and gas haven is not compatible with this local vision. The BLM must listen to the communities who will be most affected by this decision.” – Sven Edstrom, Chair, Delta Area Mountain Bikers

“President Trump has failed to take charge in addressing the COVID-19 pandemic, instead leaving it to the Governors to figure it out. But as the documents acquired by PEER show, when it comes to oil and gas development and the UFO RMP, his administration is quick to overrule local wishes. The Bureau of Land Management must go back to the drawing board and consider the vision of local communities, and their own experts, in this planning process.” – Chandra Rosenthal, Rocky Mountain Director, Public Employees for Environmental Responsibility

“The BLM’s Uncompahgre plan is a terrible disservice to conservation and support of local economies transitioning to sustainable recreation and agriculture. Secretary Bernhardt and acting BLM director William Perry Pendley have overwritten the locally-developed earlier plan to strip out conservation protections for wildlands and to grease the skids for their friends in the oil and gas and mining industries. Our public lands and local communities like Naturita and Hotchkiss will suffer the impacts.” – Scott Braden, Director, Colorado Wildlands Project

The April 1, 2020 #Colorado Water Supply Outlook Report is hot off the presses from the NRCS

Click here to read the report. Here’s an excerpt:

#Colorado #Snowpack is Near Normal as Peak Accumulation Approaches — NRCS #runoff

Here’s the release from the NRCS (Brian Domonkos):

Despite below average precipitation across much of the state in March, Colorado’s snowpack is currently very near normal at 99 percent of median statewide. There is a south to north trend in snowpack with below normal snowpack across southern Colorado and above normal snowpack across the northern half of the state. The Gunnison, combined San Miguel, Dolores, Animas, and San Juan, Rio Grande, and Arkansas basins have very similar snowpack amounts, near 90 percent of normal. The Colorado and combined Yampa and White River basins both have 104 percent of normal snowpack, right behind the North Platte at 106 percent of normal. The South Platte basin is holding the most substantial snowpack in the state at 110 percent of normal. NRCS Hydrologist Karl Wetlaufer notes “This is a very important time of the year when it comes to water resources because peak snowpack accumulation generally occurs in mid-April. Notable snowmelt has already been observed at a substantial amount of SNOTEL sites across the state”.

Colorado basin-filled snowpack map April 9, 2020 via the NRCS.

Despite a generally near normal snowpack, streamflow forecasts are mostly for lower values than would commonly be expected given snow amounts. These lower forecast values are the result of a very dry late summer and fall experienced by much of the state last year. “Those conditions led to very low soil moisture amounts going into the snow accumulation season, a deficit which will have to be replenished by melting snow and will likely reduce streamflow volumes.” Wetlaufer explains.

Reservoir storage has remained relatively steady over the last few months, with respect to normal. Only the Arkansas and Rio Grande basins in southern Colorado are currently holding below average storage volumes. Statewide reservoir storage is 107 percent of average.

While snow can certainly continue to accumulate in the high country this is a very pivotal part of the year when it comes to water resources. Much can still change over the coming months but it is an encouraging start to have near normal snowpack and reservoir conditions in most of the state. Now that substantial snowmelt is being observed at SNOTEL sites across the state it will be worth keeping a close eye on changing conditions given the dynamic nature of mountain weather conditions during the spring season.

For more detailed information about April 1 mountain snowpack refer to the April 1, 2020 Colorado Water Supply Outlook Report. For the most up to date information about Colorado snowpack and water supply related information, refer to the Colorado Snow Survey website.

Colorado River Basin Climate and Hydrology: State of the Science (2020) — Western Water Assessment #ColoradoRiver #COriver #aridification

Click here to go to the Western Water Assessment website to download the report:

Navigating a river of knowledge

In recent decades, increasing water demand, dry conditions, and warming temperatures have impacted the Colorado River, creating greater uncertainty about the future of the basin’s water supply. With support and guidance from over a dozen federal, state, and local water agencies, WWA researchers teamed up with leading experts to integrate nearly 800 peer-reviewed studies, agency reports, and other sources to assess the state of the science and technical practice relevant to water resources in the Colorado River Basin.

Colorado River Basin Climate and Hydrology: State of the Science aims to create a shared understanding of the physical setting and the latest data, tools, and research underpinning the management of Colorado River water resources. In identifying both challenges and opportunities, the report will guide water resource managers and researchers in efforts to improve the short-term and mid-term forecasts and long-term projections for the basin’s water system.

Editors and Lead Authors:

Jeff Lukas (WWA) and Elizabeth Payton (WWA)

Graphic credit: Western Water Assessment

Protecting farm labor during the COVID-19 pandemic — Purdue University

Photo credit: Purdue University

From Purdue University (Abby Leeds):

Maintaining a healthy farm workforce is more important than ever to limit the spread of COVID-19 and to ensure a successful harvest. Purdue Extension recommends the following procedures to protect farm labor from COVID-19.

Farms should continue to enforce food safety best practices already in place such as proper hand-washing, monitoring for employees with symptoms of illness and training them on proper procedures if they experience any sickness.

It is imperative that growers review and follow the U.S. Centers for Disease Control and Prevention (CDC) guidelines to limit the spread of COVID-19. Guidelines include keeping workers at least six feet apart to comply with social distancing, frequent hand-washing, avoiding touching your eyes, nose and mouth, and staying home if you are sick. If a task doesn’t allow for workers to maintain social distancing, farms could consider using personal protective equipment (PPE) to protect their workforce. Growers are encouraged to repurpose PPE that is already on the farm such as dust masks, face shields and nitrile gloves.

If possible, PPE must be thoroughly cleaned and sanitized after every use. PPE that cannot be thoroughly cleaned and sanitized should be designated for use by a single employee, and it should not be shared. Directions for sanitizing PPE can be found here.

Growers may also need to adjust transportation methods at the farm to maintain social distancing. If possible, workers should refrain from driving personal vehicles to production areas. If that is unavoidable, the farm needs to provide a designated parking area away from harvesting activities. All vehicles need to be cleaned and sanitized frequently.

Supervisors must continue to review and enforce proper hand-washing and educate workers on recognizing COVID-19 symptoms. A list of COVID-19 symptoms can be found here.

Finally, it is recommended that supervisors and owners monitor and document the health of their workforce. A daily health check could include asking workers prior to their shift if they are experiencing respiratory illness symptoms or using a touchless thermometer to take their temperature. Supervisors should use PPE to limit the spread of COVID-19 if they are within six feet of employees during these health checks.

“Our best chance for having a healthy labor force to bring in the crops at harvest time is to start at the beginning of the season by aggressively managing and monitoring the health of our workers,” said Scott Monroe, food safety extension educator for Purdue Extension.

Additional COVID-19 resources for produce growers can be found at Safe Produce Indiana and Purdue Extension.

You received a water filter from Denver Water. Now what? — News on TAP

More than 100,000 water pitchers and filters are being delivered to older homes through the summer as part of the Lead Reduction Program. The post You received a water filter from Denver Water. Now what? appeared first on News on TAP.

via You received a water filter from Denver Water. Now what? — News on TAP

The latest #ENSO discussion in hot off the presses from the Climate Prediction Center

Click here to read the discussion:

ENSO Alert System Status: Not Active

Synopsis: ENSO-neutral is favored for the Northern Hemisphere summer 2020 (~60% chance), remaining the most likely outcome through autumn.

During March 2020, above-average sea surface temperatures (SSTs) were observed across most of the tropical Pacific Ocean. The latest weekly Niño-3.4 and Niño-3 indices were slightly elevated (+0.6°C), while the Niño-4 and Niño-1+2 index values were +0.7°C and +0.8°C, respectively. Equatorial subsurface temperatures (averaged across 180°-100°W) remained above average overall, but the anomalies decreased during the month due to the expansion of below-average temperatures into the central Pacific at depth. Also during the month, low-level wind anomalies were easterly in the eastern Pacific, while upper-level wind anomalies were westerly over the central and eastern portions of the basin. Tropical convection was near average around the Date Line, and slightly suppressed over parts of Indonesia. Overall, the combined oceanic and atmospheric system remained consistent with ENSO-neutral.

The majority of models in the IRI/CPC plume favor ENSO-neutral (Niño-3.4 index between -0.5°C and +0.5°C) through the Northern Hemisphere autumn. While the Niño 3.4 index values remained elevated during March, the consensus of forecasters expects these values to decrease between the spring and summer. In summary, ENSO-neutral is favored for the Northern Hemisphere summer 2020 (~60% chance), remaining the most likely outcome through autumn (click CPC/IRI consensus forecast for the chance of each outcome for each 3-month period).

@ColoradoClimate: Weekly #Climate, #Water and #Drought Assessment of the Intermountain West

Click here to read the current assessment. Click here to go to the NIDIS website hosted by the Colorado Climate Center. Here’s the summary:

Summary: April 7, 2020

The first week of April in the Intermountain West saw mainly less than 0.50 inches of new liquid precipitation, with the majority of the southern IMW seeing less than 0.10 inches or no precipitation. The main outlier in the dryness was northwestern Wyoming, where Teton and Park counties saw widespread amounts of up to 2 inches.

March precipitation across the IMW was a bit of a mix, with below-normal precipitation through much of Wyoming, Western Utah, central and southeastern Colorado, and northeastern New Mexico. Southern New Mexico and Arizona were the winners with much higher than normal precipitation. Parts of eastern Utah and northeastern Colorado also saw much above normal precipitation for the month of March.

Looking at the longer-term time scales (90-days and greater) of the Standardized Precipitation Index, the pattern of dryness for much of Utah and much of Colorado is persisting and worsening in southern Colorado and western Utah. Northern New Mexico is continuing to see sustained dryness as well. SPIs for the rest of the IMW, Arizona, the rest of New Mexico and much of Wyoming are near or above the normal.

Now that April is here, the focus from snowpack starts to shift gears to see what that snowpack will do with runoff. Currently, the majority of basins in the Upper Colorado River Basin have near and above normal snow to melt off. Most basins in the UCRB normally see peak snowpack this week. The northern basins are at or above the normal peak snowpack while the southern basins are showing up below normal snowpack. Eyes will soon be on the rivers to see what this snowpack does.

Not helping the dryness that was seen in March was the above normal temperatures seen last month with the majority of the IMW region seeing 2 – 6 degrees above normal temperatures, the warmest areas in southeast Colorado and northeast New Mexico. The western portion of the IMW region was near normal.

The outlook for the next week ending Tuesday, April 14 shows a few systems coming through, mainly benefiting Wyoming and Colorado, however, the majority of the region should see some moisture. The 8-14 day outlook is showing favorable chances of above normal precipitation for the entire IMW region.

#Drought news: Minor improvements in NE #Colorado, #NewMexico experiences 10th wettest March on record

Click on a thumbnail graphic to view a gallery of drought data from the US Drought Monitor.

Click here to go to the US Drought Monitor website. Here’s an excerpt:

This Week’s Drought Summary

This U.S. Drought Monitor week saw drought expansion across portions of the South (Louisiana, Mississippi) and Southeast (Florida) where warm and dry conditions prevailed during the past 90-day period causing declines in soil moisture and streamflow levels. In Texas, significant rainfall across parts of the state led to improvement in drought-related conditions in South Texas and the Hill Country while areas along the Texas Gulf Coast missed the heavier accumulations. In the northern Plains, record-breaking cold affected the region including eastern portions of Wyoming and Montana. Further West, another series of Pacific storms delivered beneficial rainfall to coastal areas and valley locations in California and Oregon while significant mountain snowfall was observed across the Sierra Nevada, Trinity Mountains of northern California, Cascades, and the northern Rockies. For the month of March, the contiguous U.S. experienced its 30th wettest on record as well as its 10th warmest including record-warmth observed in areas of Texas, Louisiana, Mississippi, Alabama, Georgia, and Florida…

High Plains

On this week’s map, areas of the region—including northeastern Colorado, west-central Kansas, and southwestern Nebraska—saw minor improvements in areas of Abnormally Dry (D0) in response to above-normal precipitation during the past 30-day period. Elsewhere, drought-related conditions deteriorated in southwestern Kansas and south-central Colorado in the San Luis Valley where an area of Severe Drought (D2) was added to the map. In northern portions of the Sangre de Cristo Range, situated on the east side of the San Luis Valley, numerous NRCS SNOTEL observing stations were reporting below-normal, snow-water- equivalent levels (SWE) levels. Elsewhere in the region, average temperatures were well-below normal for the week with numerous locations reporting daily record-low temperatures including Worland, Wyoming which dipped to 2° F on April 3. Interestingly, Worland broke the daily high-temperature record on April 6 soaring to 70° F. For the week, moderate-to-heavy snowfall accumulations were observed across portions of South Dakota, North Dakota, and Wyoming as well as the central Rockies of Colorado. For the month of March, North Dakota experienced its 12th driest on record. According to the NRCS SNOTEL network, basins (6-digit HUC) across Wyoming and Colorado were reporting near-normal to above-normal SWE levels…

West

On this week’s map, recent precipitation events and improving SWE levels led to minor improvements in drought-affected areas of west-central Oregon (areas of D1 and D2) and in south-central Idaho (areas of D2) where snowpack conditions received a needed boost in the Big Lost, Big Wood, and Little Wood basins. In west-central Utah and east-central Nevada, a small area of Moderate Drought (D1) was added in response to short-term dryness during the past 30–90 days. In California, another round of late-spring storms impacted the state delivering beneficial precipitation to the higher elevations of the Sierra Nevada and Trinity Mountains of northern California. In addition, the central California coastal ranges as well as the Transverse Ranges of southern California received rainfall accumulation ranging from 2 to 6 inches leading to removal of areas of Abnormally Dry (D0) from Monterey County southward to San Diego County. As of April 7, the California Cooperative Snow Surveys were reporting the statewide snowpack at 63% of normal with the regional breakdown as follows: North 67%, Central 67%, and South 53%. Elsewhere in the West, the NRCS SNOTEL network is reporting the following region-level (2-digit HUC) SWE levels: Pacific Northwest 110%, Missouri 111%, Upper Colorado 103%, Great Basin 94%, Lower Colorado 105%, Rio Grande 79%, and Arkansas-White-Red 90%. According the NCEI’s climatological rankings, both Arizona and New Mexico experienced their 10th wettest March on record…

South

On this week’s map, drought-affected areas of Texas saw widespread improvements in areas of Moderate (D1), Severe Drought (D2), Extreme Drought (D3), and Exceptional Drought (D4) in response to moderate-to-heavy to rainfall accumulations (ranging from 2-to-5 inches) in South Texas as well as in the Hill Country during the past 7-day period. Drought-stricken areas along much of the Gulf Coast of Texas, however, received accumulations of generally less than one inch. According to the USDA, topsoil moisture in Texas was rated 27% short to very short while Louisiana rated 18% short to very short. In Louisiana and Mississippi, areas of Abnormally Dry (D0) and Moderate Drought (D1) expanded along southern portions in response to another week of warm and dry conditions with numerous streamflow gaging stations reporting 7-day average streamflow levels below the 25th percentile. In the Oklahoma Panhandle, dry conditions persisted this week leading to minor expansion of areas with Abnormally Dry (D0), Moderate Drought (D1), and Severe Drought (D2) ratings. As a region, the South Climate Region experienced its 13th wettest March and 5th warmest…

Looking Ahead

The NWS WPC 7-Day Quantitative Precipitation Forecast (QPF) calls for light-to-moderate accumulations ranging from 1 to 3 inches across portions of the South including Louisiana and Mississippi as well as parts of the Southeast including Alabama, the Florida Panhandle, and Georgia. Along most of the Atlantic Seaboard, accumulations of <2 inches are expected. Elsewhere, the southern half of California is forecasted to continue to receive precipitation (ranging from 1-to-3 inches liquid) while further eastward the central and northern Rockies are expected to receive liquid accumulations of <2 inches. The CPC 6-10-day Outlook calls for a moderate probability of above-normal temperatures in California and western portions of Nevada, Oregon, and Washington as well as Alaska. Likewise, above-normal temperatures are expected in Florida and coastal areas of Georgia and South Carolina with the highest probabilities in southern Florida. For the rest of the continuous U.S., below-normal temperatures are expected. In terms of precipitation, there is a moderate-to-high probability of above-normal precipitation across the eastern third of the U.S. as well as across much of the Southwest extending northward into Colorado, Utah, and Wyoming. In Alaska, above-normal precipitation is expected with probabilities ranging from 33% to 50%. Elsewhere, there is a moderate-to-high probability of below-normal precipitation in northern California, the Pacific Northwest, and the northern Great Basin. In the northern Plains as well as central and western portions of Texas, there is a low-to-moderate probability of below-normal precipitation.

And, here’s the one week change map ending April 7, 2020.

US Drought Monitor one week change map ending April 7, 2020.

As temperatures rise, Arizona sinks — @HighCountryNews

From The High Country News (Jonathan Thompson):

Arizona is sinking. The combination of groundwater pumping and warmer temperatures is shrinking aquifers and lowering water tables. And as the land subsides, fissures open, 2-mile wounds that devour infrastructure and swallow livestock. Four of Arizona’s five economic pillars — cattle, cotton, citrus and copper — use huge amounts of water, while the fifth, the state’s climate, is changing, making water scarcer. Development and growth are intensifying the problem, despite relief from state laws and the existence of the Central Arizona Project, which began delivering Colorado River water to Phoenix and Tucson in the 1980s.

Today, where subsidence is worst, groundwater pumping isn’t even monitored, and big agricultural and anti-regulatory ideologues try to stymie any efforts to keep tabs on how much water is being pumped. Big corporate farms are sprouting in areas without CAP water and virtually no regulation on groundwater pumping. More and more farms produce alfalfa, one of the thirstiest crops on Earth; the number of acres in hay production more than doubled between 1987 and 2017, and tonnage nearly tripled. Meanwhile, Arizona is getting even hotter.

That kind of heat, according to a recent study published in Nature Communications, strains groundwater reserves, too. The study “Evapotranspiration depletes groundwater under warming over the contiguous United States” found that warming also stresses plants, forcing them to suck up more groundwater and further lowering water tables. “These changes show that even the most moderate warming projection can shift groundwater surface water exchanges and lead to substantial and persistent storage losses,” the study notes, adding that with just 1.5 Celsius (2.7 Fahrenheit) warming, the nation’s groundwater reservoirs collectively will lose about four times the total volume of Lake Powell over four years.

Warming stresses plants in the same way in the arid West, Laura Condon, an assistant professor of hydrology at the University of Arizona and one of the study’s authors, said. Since the water tables here are deeper, however, the effect on groundwater is less pronounced — at least under natural conditions. But when crops are stressed by warming, more groundwater pumping is needed. “Humans are short-circuiting the natural system,” Condon said.

In other words, Arizona is sinking, getting hotter and getting thirstier. Groundwater pumping is increasing, water tables are plummeting, and many rural residents are watching their wells go dry, according to a recent investigation by Rob O’Dell and Ian James for the Arizona Republic. Not long ago, the football field at western Arizona’s Salome High School was reduced to dust thanks to water restrictions at the groundwater-dependent town, which has a number of large corporate alfalfa farms nearby.

What does all this look like on the ground?

Jonathan Thompson is a contributing editor at High Country News. He is the author of River of Lost Souls: The Science, Politics and Greed Behind the Gold King Mine Disaster. Email him at jonathan@hcn.org.

Democratic governors are quicker in responding to the coronavirus than Republicans — The Converstion


Florida Republican Gov. Ron DeSantis, who did not issue a stay-at-home order for his state until April 1, 2020.
Joe Raedle/Getty Images

Luke Fowler, Boise State University; Jaclyn Kettler, Boise State University, and Stephanie Witt, Boise State University

While the coronavirus pandemic is a national and international concern, state and local officials find themselves on the front lines of the public health battle.

Governors, in particular, have been in the spotlight in recent weeks. New York’s Andrew Cuomo has been praised by news outlets for his leadership at the epicenter of the U.S. outbreak, while others have been criticized for slow responses.

A clear partisan gap has emerged in how quickly governors have declared emergencies and issue stay-at-home orders. Democratic governors have issued orders three to four days sooner than Republican governors, on average.

Timing pivotal

We study state governments, including their interactions with the federal government. Our previous work on federalism and state politics has identified partisan conflict between national, state and local government. Federalism is the distribution of power and authority across levels of government, and partisan conflict involves disagreements and competition between political parties. Partisan conflict over policy is nothing new.

But the coronavirus has put some governors in an ideologically compromising position. Republicans, who traditionally advocated for states’ rights, now find themselves deferring to the federal government.

Meanwhile, Democrats are leading the nation on pandemic responses and reaping the political rewards. They are also pushing for more federal coordination efforts, especially in obtaining high-demand medical supplies.

Although the same policies are being used across the country, the timing of decisions is likely to prove pivotal in mitigating how hard COVID-19 hits communities, as experiences in South Korea and Italy suggest. Earlier emergency declarations and stay-at-home orders increase the chances of a better outcome for the health of people in the state.

President Trump’s early discounting of the danger of the coronavirus may have stalled action by Republican governors.
Jabin Botsford/The Washington Post via Getty Images

A trend – with exceptions

Based on a review of emergency declarations, we found that the median date for instituting a state of emergency for Democratic governors was March 10, and for Republican governors, March 13.

Although stay-at-home orders have only been issued in 41 states as of April 4, a similar trend is emerging there.

So far, all 24 Democratic governors have issued such an order with a median date of March 24. On the other hand, only 17 of 26 Republican governors have, and of those the median date is March 30.

Some argue that states led by Republicans were hit by COVID-19 later or not as hard as states led by Democrats. Yet based on data from the COVID Tracking Project, there was little difference in the number of cases in each state when governors announced these orders.

Most governors used boilerplate language citing public health experts in their announcements. But some evidence shows that Republican governors were responding to leadership from President Donald Trump, who largely downplayed the severity of the pandemic for weeks, which discouraged governors from taking actions that contradicted the leader of their party. For instance, on March 7, he said “I’m not concerned at all,” and on March 10 he claimed “it will go away. Just stay calm.”

Additionally, nearly half of Republican governors declared emergencies on the same day – March 13 – that the president declared a national emergency, and a few have explicitly cited Trump as a reason behind their decisions.

Georgia Republican Gov. Brian Kemp said, “Based on President Trump’s emergency declaration, I will declare a public health emergency.”

Florida’s Ron DeSantis, a Republican who had resisted issuing a stay-at-home order despite mounting pressure from public health officials and the media, cited the shift in Trump’s tone and demeanor as the signal it was time to issue a stay-at-home order to contain the pandemic in his state.

Michigan Democratic Gov. Gretchen Whitmer declared a state of emergency on March 10.
AP Photo/David Eggert

Other Republican governors acted earlier. One factor in those cases is Trump’s approval ratings: Republicans in states where the president is unpopular moved more quickly.

Trump’s net approval – the portion of survey respondents approving of Trump’s job performance minus the portion disapproving –
in states with Republican governors that declared emergencies before March 13 averages +1; in Republican states declaring emergencies on or after March 13, it averages +8. For Democratic states, Trump’s net approval averages -9 before March 13, and -10 on or after March 13. Clearly, Trump’s net approval is important to the Republican governors.

Ohio’s Mike DeWine was the first governor to call for a statewide closure of schools on March 12, and Maryland’s Larry Hogan, who has been vocal in criticizing the White House’s leadership, was the first Republican governor to declare an emergency, on March 5. Trump’s net approval in Ohio is 0 and in Maryland, -24.

Partisan conflict evident

In contrast, Democratic governors have advocated for more aggressive response efforts at both state and federal levels.

In addition to Andrew Cuomo, who has become a key figure in recent weeks, Michigan’s Gretchen Whitmer has traded jabs with the president. New Jersey’s Phil Murphy has called for a “postmortem” on the federal response to understand why it has gone so wrong.

While conflict between political parties is usually most visible in Congress, the coronavirus has put partisan conflict between the president and governors on full display as federal and state governments try to contain this pandemic.

[Get facts about coronavirus and the latest research. Sign up for The Conversation’s newsletter.]The Conversation

Luke Fowler, Associate Professor and MPA Director, Boise State University; Jaclyn Kettler, Assistant Professor of Political Science, Boise State University, and Stephanie Witt, Professor of Public Policy, Administration and Political Science, Boise State University

This article is republished from The Conversation under a Creative Commons license. Read the original article.

The April 2020, “The Current” newsletter is hot off the presses from the #Colorado Water Center

Click here to read the newsletter. Here’s an excerpt:

Hydrology Days 2020 Webinar Conference

Each year the American Geophysical Union Hydrology Days meeting brings together water scientists, researchers, and students to discuss the current state of the science and latest water-related research findings. Although the traditional on-campus conference has been canceled, an online web conference will be held on April 13-14.

The Colorado Water Center is also accepting submissions to the Hydrology Days special issue of Colorado Water. Authors may submit a short article for consideration by April 15. Please visit our submission guidelines for more information.

R.I.P. John Prine: “In spite of ourselves we’ll end up a-sittin’ on a rainbow”

From 1970: John Prine’s first review, by Roger Ebert: https://chicago.suntimes.com/2020/4/7/21199183/john-prine-dead-review-first-roger-ebert-sun-times-1970-fifth-peg

From The New York Times (William Grimes):

John Prine, the raspy-voiced country-folk singer whose ingenious lyrics to songs by turns poignant, angry and comic made him a favorite of Bob Dylan, Kris Kristofferson and others, died on Tuesday in Nashville. He was 73.

The cause was complications of the coronavirus, his family said.

Mr. Prine underwent cancer surgery in 1998 to remove a tumor in his neck identified as squamous cell cancer, which had damaged his vocal cords. In 2013, he had part of one lung removed to treat lung cancer.

Mr. Prine was a relative unknown in 1970 when Mr. Kristofferson heard him play one night at a small Chicago club called the Fifth Peg, dragged there by the singer-songwriter Steve Goodman. Mr. Kristofferson was performing in Chicago at the time at the Quiet Knight. At the Fifth Peg, Mr. Prine treated him to a brief after-hours performance of material that, Mr. Kristofferson later wrote, “was unlike anything I’d heard before.”

A few weeks later, when Mr. Prine was in New York, Mr. Kristofferson invited him onstage at the Bitter End in Greenwich Village, where he was appearing with Carly Simon, and introduced him to the audience.

“No way somebody this young can be writing so heavy,” he said. “John Prine is so good, we may have to break his thumbs.”

The record executive Jerry Wexler, who was in the audience, signed Mr. Prine to a contract with Atlantic Records the next day.

Music writers at the time were eager to crown a successor to Mr. Dylan, and Mr. Prine, with his nasal, sandpapery voice and literate way with a song, came ready to order. His debut album, called simply “John Prine” and released in 1971, included songs that became his signatures. Some gained wider fame after being recorded by other artists.

They included “Sam Stone,” about a drug-addicted war veteran (with the unforgettable refrain “There’s a hole in Daddy’s arm where all the money goes”); “Hello in There,” a heart-rending evocation of old age and loneliness; and “Angel From Montgomery,” the hard-luck lament of a middle-aged woman dreaming about a better life, later made famous by Bonnie Raitt…

Mr. Dylan, listing his favorite songwriters in a 2009 interview, put Mr. Prine front and center. “Prine’s stuff is pure Proustian existentialism,” he said. “Midwestern mind trips to the nth degree. And he writes beautiful songs.”

John Prine was born on Oct. 10, 1946, in Maywood, Ill., a working-class suburb of Chicago, to William and Verna (Hamm) Prine. His father, a tool-and-die maker at the American Can Company, and his mother had moved from the coal town of Paradise, Ky., in the 1930s.

Mr. Prine later wrote a ruefully bitter song titled “Paradise,” in which he sang:

John grew up in a country music-loving family. He learned guitar as a young teenager from his grandfather and brother and began writing songs…

…Roger Ebert, the film critic for The Chicago Sun-Times, wandered into the club while Mr. Prine was performing. He liked what he heard and wrote Mr. Prine’s first review, under the headline “Singing Mailman Who Delivers a Powerful Message in a Few Words.”

[…]

Mr. Prine went on tour in 2018 to promote “Tree of Forgiveness,” and after a two-night stand at the Ryman Auditorium in Nashville — known there as the mother church of country music — Margaret Renkl, a contributing opinion writer for The New York Times, wrote, under the headline “American Oracle”:

“The mother church of country music, where the seats are scratched-up pews and the windows are stained glass, is the place where the new John Prine — older now, scarred by cancer surgeries, his voice deeper and full of gravel — is most clearly still the old John Prine: mischievous, delighting in tomfoolery, but also worried about the world.”

#Snowpack news: All basins except the #SouthPlatteRiver are in the normal range, Statewide = 104% of normal

Click on a thumbnail graphic to view a gallery of snowpack data from the NRCS.

And, here’s the Westwide SNOTEL basin-filled map for April 7, 2020 from the NRCS.

Westwide SNOTEL basin-filled map April 7, 2020 via the NRCS.

Government secrecy is growing during the #coronavirus pandemic — The Conversation #COVID19


Chicago Mayor Lori Lightfoot’s administration said it would reject all freedom of information requests – and then reversed itself after public outcry.
AP/Teresa Crawford

David Cuillier, University of Arizona

Students at the University of Florida who want to know how they are being protected from the COVID-19 pandemic can’t find out.

The university is hiding its emergency response plan under a legal loophole intended to keep terrorists and enemy combatants – not viruses – from exploiting government weaknesses.

Since the spread of coronavirus accelerated in recent weeks, local, state and federal officials throughout the United States have locked down information from the public. Examples include:

The city of Palestine, Texas, banned a news reporter from a city council meeting on March 23, even though fewer than a maximum of 10 people would be in the room, and did not allow the public to listen in on the meeting through a toll-free phone number, as required by state law.

The Council of the District of Columbia decided on March 19 that district employees do not have to respond promptly to public records requests any more.

The FBI no longer accepts requests for information online or by email because of the virus. If anyone wants information they must mail their request, which ironically is more apt to pass along the virus.

Throughout the country, journalists are barred from talking to staff at public hospitals and locations serving the sick. And with administrators limiting access to the hospital itself, journalists are unable to tell the public what is happening. Precautions can be taken to protect the health of everyone concerned and protect the privacy of patients.

Government agencies are closing down or slowing the public’s access to information.
FBI

‘Cloudy Week’?

And this is just in the United States. The Philippines threatens journalists with prison time for spreading false news about the virus, and the Committee to Protect Journalists is tracking the arrests of reporters in Venezuela, Niger, India and elsewhere, regarding coronavirus coverage.

Ironically, most of these information crackdowns started in mid-March, during national Sunshine Week, a time when news organizations and others promote citizens’ rights to access government information.

Some agencies are making the case that responding to records requests is not an essential need or function. Research suggests that access to government information is indeed essential for our health and well-being. Studies have shown that making government information open leads to cleaner drinking water, safer restaurant food, less corruption and more confidence in government.

James Hamilton, an economist from Stanford University, found that for every $1 spent by news organizations on public records-based investigative reporting, the public derives $287 in benefits. The free flow of information makes for a better society and a better economy. It’s a smart return on investment.

Indeed, businesses use public information more than anyone else – studies have shown that at some federal agencies three-quarters of Freedom of Information Act requests are submitted by commercial interests. Maintaining a free flow of information actually greases the nation’s economic machine, which could be more important than ever given its state today.

The City Council of Palestine, Texas, banned a reporter from a city council meeting on March 23 and did not allow the public to listen in on the meeting electronically.
City of Palestine, Texas, screenshot

Crisis as opportunity

The recent information closures are reminiscent of actions immediately following the terrorist attacks of Sept. 11, 2001, when governments closed massive amounts of information, including records showing the dilapidated conditions of bridges and dams.

Rather than limiting public information, however, agencies can use this crisis as an opportunity to take governance to the next level – making government even more accessible to the public it serves.

A statement signed by 132 nonprofits from a broad spectrum of industries and political persuasions was issued on March 20, urging a measured response that serves the public interest.

“We strongly urge government branches and agencies to recommit to, and
not retrench from, their duty to include the public in the policy-making process, including policies relating to COVID-19 as well as the routine ongoing functions of governance,” the organizations wrote.

The National Freedom of Information Coalition, a nonprofit that provides education and research for citizens in acquiring government information, organized the statement. I serve as the coalition’s president, have testified before Congress several times regarding the Freedom of Information Act, teach classes on accessing information and publish research on the state of access in the United States.

Some of the recommendations included:

  1. Postpone nonessential government business decisions until after the pandemic has subsided, when the public can once again fully engage.

  2. Move necessary decisions online in live-streamed meetings accessible to all, including opportunities for public input and questions. Record the streams and post the recordings so people can view it later.

  3. Do not conduct the public’s business via private channels, such as social media, texting and phone calls. (This holds true all the time, but especially now.) All official communications should be preserved and made accessible to the public online.

  4. Post documents and data online as a matter of course so people don’t have to request it and government workers don’t have to take the time to retrieve and disseminate them.

  5. Officials can provide journalists greater access to hospitals and other health installations, applying safety precautions and protecting the privacy of victims.

Efforts to make government more accessible now can result in permanent improvements in the future, to better serve citizens who are homebound or too busy with work and child-rearing to attend a local government meeting.

Sometimes it takes a crisis to pull together and move forward, as citizens and government working together, fully engaged and well-informed.

Editor’s note: The University of Florida is a funder of The Conversation US.

[Get facts about coronavirus and the latest research. Sign up for The Conversation’s newsletter.]The Conversation

David Cuillier, Associate Professor, School of Journalism, University of Arizona

This article is republished from The Conversation under a Creative Commons license. Read the original article.

Shoshone agreement keeps water flowing down #ColoradoRiver while hydro plant is inoperable — @AspenJournalism #COriver #aridification

The penstocks and main building at the Shoshone hydropower plant, which uses water diverted from the Colorado River to produce electricity. The Shoshone Outage Protocol keeps water flowing down the Colorado River when the hydro plant is inoperable. Photo credit: Brent Gardner-Smith/Aspen Journalism

From Aspen Journalism (Heather Sackett):

The Shoshone hydropower plant in Glenwood Canyon has been down since at least Feb. 14 and could be down until June, but a 2016 safety-net agreement has kept water flowing down the Colorado River.

The Shoshone Generating Station, owned by Xcel Energy, is the keeper of one of the largest water rights on the main stem of the Colorado River. In February, ice jams on the spillway caused water to flood the plant and damaged equipment inside, according to Xcel media-relations representative Michelle Aguayo.

Xcel said the COVID-19 crisis is complicating repair plans.

“Given the current circumstances, it’s more challenging to get contractors to repair equipment, but even so, we expect to be back in June,” Aguayo said in a prepared statement.

Xcel said service to electric customers will not be impacted by the outage.

The inoperable plant would be a major concern to water users on the Western Slope, except for the 2016 Shoshone Outage Protocol, which mimics conditions as if the plant were still operating and using its full amount of water.

When the plant is operating, a senior water right from 1902 draws 1,250 cubic feet per second of water downstream to meet the plant’s needs. That means that upstream junior water-right holders must leave enough water in the river for Shoshone to receive its full amount. It also means that the 1,250 cfs is available for other downstream users on the Western Slope.

The water used by the Shoshone plant is diverted at a low riverwide dam about two miles above the plant near the Hanging Lake exit on Interstate 70. The water is then sent through pipes along the cliffs to penstocks that send it down to the plant, where it spins turbines. All of the water is then released back into the river via a spillway at the top of what’s called the “Shoshone” section of the Colorado River, which is about five miles east of Glenwood Springs and is popular with kayakers and rafters.

This water is crucial for endangered fish in the often-dry, 15-mile reach near Grand Junction; for boaters and rafters near Glenwood; and for Grand Valley irrigators, who have begun filling their canals for the start of irrigation season, which began Wednesday.

In the past, if the hydropower plant was not operating, the water right tied to it is not being put to beneficial use and cannot be used. The 1,250 cfs could have been lost — either diverted to the Front Range or kept locked in reservoirs. But the Shoshone Outage Protocol took effect March 1 to keep water flowing in the river.

“We are very happy that the outage protocol exists,” said Andy Mueller, general manager of the Colorado River Water Conservation District. “It’s to make sure the water keeps flowing this way. It’s really about the fish as well as bringing the water to the Grand Valley.”

Formalized in 2016, the agreement is signed by many Colorado River water users, water providers and government agencies, including the U.S. Bureau of Reclamation, the Colorado Division of Water Resources, Denver Water, the River District and the Grand Valley Water Users Association.

Between Feb. 14 and March 1, flows were kept up by a winter maintenance outage agreement, according to Victor Lee, an engineer with the Bureau of Reclamation.

Lee said that about 1,400 acre-feet of water from Green Mountain Reservoir in Summit County has been released so far to meet the Shoshone Outage Protocol requirements. He said the protocol will probably be relaxed in the next week or two because spring runoff will begin to naturally boost river flows.

The Shoshone plant and its big water right have long been a concern for the River District, especially since outages have increased in recent years, including a penstock rupture in 2007. Since about 2018, River District officials have been in talks with Xcel about ways to preserve the Shoshone water right for the Western Slope.

“Those efforts are ongoing,” Mueller said. “We still view that as a significant priority for western Colorado.”

Aspen Journalism collaborates with The Aspen Times, the Glenwood Springs Post-Independent and other Swift Communications newspapers on coverage of water and rivers.

Number of days the Shoshone outage protocol, or ShOP, was in effect, and stages of the agreement.

Prowling the bowels of #HooverDam — The Mountain Town News

Hoover Dam from the Arizona side. Photo credit: Allen Best/The Mountain Town News

From The Mountain Town News (Allen Best):

It’s a good thing I got over my claustrophobia. I was in the bowels of Hoover Dam, the giant plug of the Colorado River, trying not to think about the mass of concrete around me or the volume of water behind me.

The concrete poured during the 1930s into that narrow chasm of Black Canyon 24 miles from Las Vegas was enough to pave a two-lane highway from San Francisco to New York City. The dam is 660 feet thick at the bottom, wider than two football fields narrowing to 45 feet at the top. It is shaped like a huge curved axe-head.

Arizona power house at Hoover Dam December 2019. Each of the 17 hydroelectric generators at Hoover Dam can produced electricity sufficient for 1,000 houses. Photo credit: Allen Best/The Mountain Town News

Our guide on a special tour for reporters shared a subterranean wormhole in the concrete. Hunched down, I made my way toward the glint of sunshine. There, I laid my hands on the face of the great 776 feet-tall dam.

Los Angeles Times columnist Michael Hiltzik several years ago captured the magnificence of the human endeavor with the title of his book: “Colossus: Hoover Dam and the Making of the American Century.”

In the early 20th century, the river was a beast, its spring floods of water from the mountains of Colorado, Wyoming, and Utah predictably unruly, its water an anomaly in the arid American Southwest. In the baking but fertile sands of the Mojave Desert, agriculturalists saw great potential. Los Angeles saw water but also the hydroelectric power needed to create a great city.

LA could not do it on its own. An agreement among the seven states of the Colorado River Basin to apportion the waters was needed. That compact forged in 1922 delivered the political foundation for federal sponsorship of the dam’s construction, which began in 1930.

The December day we visited was coolish. The canyon can become an oven, though. During construction, 112 deaths were reported. But that does not include 42 people who died from pneumonia, many from tunnels bored into the canyon with equipment that produced thick plumes of exhaust gases and helped produce heat of up to 60 degrees C ( 140 degrees F).

Still, the dam’s construction represented triumph during a time of despair. The United States and much of the world was in depression. In the American heartland, giant clouds of dust caused misery and literally suffocated fowl and beast, but humans, too. Hoover Dam—at first called Boulder Canyon Dam—represented a story of human success. Look at what we’re capable of doing, it said, when we set our minds to it!

Water from the dam has been filled to overflowing just twice. One of those times was in 1983. I remember it very well. I was working at the headwaters of the Colorado River in the Colorado resort town of Winter Park. We had an average winter. Spring was anything but. It started snowing in March and didn’t quit until mid-June. The water that gushed downstream took dam operators by surprise.

Since 2002, the principal problem has been too little water. Droughts, as severe as any before recorded, have repeatedly left Colorado’s slopes snowless when normally they would be thick with snow. New evidence also comes of rising temperatures, which rob streams and meadows of water through increased evaporation and transpiration.

Then there was the faulty promise of that compact struck in 1922, an assumption of far more water than the river has routinely delivered. That, however, did not stop the cities and farmers from inserting their straws into the river and its reservoirs. When I visited in December, the reservoir was 40% full—or, if you prefer, was 60% empty.

Hoover Dam has enough concrete fora four-foot-wide sidewalk around the Earth at the Equator. Photo credit: The Mountain Town News/Allen Best

Energy, not water, powered my desire to see Hoover. When completed, the 13 hydroelectric generators provided a large amount of electricity in the Southwest. Now, the output is dwarfed by other sources, increasingly renewables. Increasingly, our guide said, the water is released to generate electricity in ways that shore-up the intermittent renewables.

Hoover Dam may also play a role in our future of renewable energy. Los Angeles Water and Power has been investigating whether the dam’s generators and Lake Mead can be used to create what constitutes a giant battery. The water would be released again and again, when power is needed most to fill the gaps between renewable energy, then pumped back into the reservoir when renewable power is plentiful, such as during sunny afternoons.

The answer is of interest far beyond Los Angeles. In places like Denver, utilities say they can now see the way to 80% emission-free power generation by 2030. But to 100%? Lithium-ion batteries may be part of that answer, but they can store energy for just four hours. Maybe another, partial solution can be found at Hoover and other dams. We do need the answers soon, as the need to reduce our emissions has become pressing.

Colorado River, Black Canyon back in the day, site of Hoover Dam

@USBR is prepared for releases from Green Mountain Reservoir for the #ColoradoRiver “15-mile reach” if needed to prevent dryups

The 15-Mile Reach is located near Grand Junction, Colorado

From The Grand Junction Daily Sentinel (Dennis Webb):

Though it’s looking like it won’t be needed, officials have been standing by with 6,500 acre-feet of water set aside in Green Mountain Reservoir in Summit County. They’re ready to release it if needed in order to avoid what’s referred to as an “April hole” in rivers flows in the Colorado River between Palisade and the river’s confluence with the Gunnison River.

That stretch is known as the 15-Mile Reach, a focal point for protecting flows for the sake of endangered fish in the Colorado River. If flows fall too low between where irrigation water is diverted and the Gunnison flows boost water volume, endangered fish can be left more vulnerable to predators, reduced habitat and potentially less food availability.

Upper Colorado River Endangered Fish Recovery Program

Four endangered fish — the humpback chub, bonytail, Colorado pikeminnow and razorback sucker — are the focus of recovery efforts in the Colorado River and its tributaries in Colorado, Utah and Wyoming.

A court case and operating policy at Green Mountain, which is managed by the Bureau of Reclamation, have resulted in establishment of a 66,000-acre-foot historic users pool there that is available to irrigators, municipal and other water users to replace water that otherwise wouldn’t be available to them due to calls by holders of senior water rights.

Victor Lee, a Bureau of Reclamation engineer, said that as part of another court case, it was decided that when the pool isn’t needed for those other uses, it could be used to augment flow in the 15-Mile Reach, for the sake of the fish. The pool is the largest single source of water for boosting flows in that reach, with 40,000 or 50,000 acre feet sometimes available for that purpose, he said.

Typically that water has helped boost flows in late summer and early fall, but over the last few years its use has been expanded to include the startup of the irrigation season when needed.

Lee said usually that startup can occur without excessively drawing down flows in the 15-Mile Reach. But the “April hole” can develop in circumstances such as when there’s little rain and a cold snap halts the beginning of spring runoff flows.

In recent years user pool managers including the Bureau of Reclamation, irrigators and state started considering how they might use, in April, water they didn’t deliver the prior fall. Last year they went a step further, decided to intentionally hold over some of the water that normally would have been released in the fall and keep it available for use this spring if need be…

The Government Highline Canal, near Grand Junction, delivers water from the Colorado River, and is managed by the Grand Valley Water Users Association. Representatives from the Grand Valley Water Users Association invited members of the Front Range Water Council to discuss demand management, but the FRWC declined. Photo credit: Brent Gardner-Smith/Aspen Journalism

The goal is to keep flows in the 15 miles at 810 cubic feet per second or more. On Monday the stretch had flows of about 1,440 cfs, but the Grand Valley Irrigation Co. was expected to begin diverting the same day, and the Grand Valley Water Users Association had begun increasing diversion. Lee has been consulting regularly with irrigation entities, weather and runoff forecasters and reservoir managers. While he thinks the flows in the crucial stretch will fall to 850 cfs, it looks like they will increase from there as temperatures warm and more moist weather arrives, likely making it unnecessary to augment flows to bridge the gap before spring runoff season begins in earnest.

Green Mountain Reservoir, on the Blue River between Kremmling and and Silverthorne, was built for Western Slope interests. Photo/Northern Colorado Water Conservancy District via The Mountain Town News.

Mountain #snowpack ‘looking good’ heading into spring — News on TAP

Big storms in February played a key role in boosting water supply. The post Mountain snowpack ‘looking good’ heading into spring appeared first on News on TAP.

via Mountain snowpack ‘looking good’ heading into spring — News on TAP

snowpackcolorado03162020

COVID-19 doesn’t stop Denver Water’s lead program — News on TAP

Public health initiative pivots to focus on work that can be done at a distance. The post COVID-19 doesn’t stop Denver Water’s lead program appeared first on News on TAP.

via COVID-19 doesn’t stop Denver Water’s lead program — News on TAP

Already Braced for #COVID19, Towns Watch the Rising #MississippiRiver With Fear — Bloomberg Green #coronavirus

Created by Imgur user Fejetlenfej , a geographer and GIS analyst with a ‘lifelong passion for beautiful maps,’ it highlights the massive expanse of river basins across the country – in particular, those which feed the Mississippi River, in pink.

From Bloomberg Green (Leslie Kaufman):

With the coronavirus already stretching supplies and budgets, local leaders worry that a flood could overwhelm them.

New Orleans is a hot spot for Covid-19, and thousands of cases locally means [Belinda Constant, Mayor of Gretna, LA, is] working with a skeletal staff under lockdown conditions. Meanwhile, the Mississippi has risen more than a foot in the past week, triggering emergency flood measures. And the rains keep coming.

Gretna itself is below sea level, and currently some 11 feet below the surging river. All that’s keeping the city dry is a levee built by the U.S. Army Corps of Engineers after Hurricane Katrina in 2005. Constant says she prays every day that it doesn’t rain any more, or that one of the enormous cargo ships making its way down the river doesn’t get caught in the currents and swept into the barrier…

Louisiana, along with the rest of the Mississippi Valley region, is in the middle of its annual wet season, which usually peaks in April. This year’s floods are predicted to be more moderate than 2019’s, which covered a record expanse of 19 states, starting in January and lasted for an unprecedented nine months and affected 14 million people.

Even a milder season could be devastating to many, however. The U.S. National Weather Service says they might still affect more than 128 million people, and several areas are approaching flood stage already.

Colin Wellenkamp is the executive director of the Mississippi River Cities & Towns Initiative, which coordinates and organizes towns along the entire river corridor. He says Mayor Constant’s anxieties are shared by many local officials. “We are averaging a 100- to 200-year flood event annually somewhere on the river,” he says. As a result, many towns’ emergency capabilities were already tapped out before Covid-19, he says.

The Federal Emergency Management Agency and the U.S. Army Corps of Engineers are promising the same amount of help to states as in previous years. Yet FEMA , by its own accounting, is well below its own 2015 targets for field staffing for emergencies. And even if the big agencies could provide the level support local communities have come to depend on, that still may not be enough. “The challenges are just so much bigger this year,” says Wellenkemp.

For starters, just like everywhere else, towns facing flooding are also facing extreme shortages of protective equipment such as face masks and gloves. Not only are doctors and nurses worried about shortages, so are first responders who may have to rescue people and property during an emergency. Most towns also rely heavily on volunteers for everything from filling sandbags to moving equipment to stocking shelters for displaced families. If officials can’t guarantee adequate safeguards for health, they aren’t sure people will show up…

Town officials have similar concerns related to institutions like the Red Cross, which they rely on to set up shelters when needed. Many wonder how they’ll cope in an era where group shelters such as gyms or tents are no longer an option.

Bob Gallagher, the mayor of Bettendorf, Iowa, isn’t one of them. He’s working with both state and federal officials and is optimistic that his city could handle flooding if it occurred. For now he’s sheltering homeless people in local hotels instead of group shelters, and says that’s working fine. But he acknowledges that the outlook might not be so rosy for smaller towns that have to rely almost entirely on volunteers in big emergencies.

The good news, says Wellenkamp, is that FEMA has made spending on Covid-19 preparations reimbursable by the federal government, a standard practice for damage from natural disasters that reach the level of federal emergency. The bad news is that FEMA still hasn’t reimbursed municipalities for the 2019 flooding, and many are already carrying heavy debt. “The economic impact from this will be greater than even last year’s record flood,” he says.

#​Colorado Basin River Forecast Center (CBRFC) April 1, 2020 Water Supply Forecast Discussion #ColoradoRiver #COriver #aridification

Click here to read the discussion:

The ​Colorado Basin River Forecast Center (CBRFC)​ geographic forecast area includes the Upper Colorado River Basin, Lower Colorado River Basin, and Eastern Great Basin.

Water Supply Forecast Summary

The weather pattern during the month of March was favorable for bringing storm systems across the Lower Basin into southern Utah/Colorado, while generally missing much of the northern portions of Utah/Colorado and Wyoming. March maximum temperatures across the Great Basin and Colorado River Basin were near to below normal. This helped preserve snow, even at lower elevations, that will contribute to seasonal runoff volumes. Observed snow water equivalent (SWE) conditions as of early April are generally near to slightly above normal (median) across the Upper Colorado River Basin and Great Basin.

April-July water supply volume forecasts are generally near to below average throughout the Upper Colorado River Basin and Great Basin. The highest forecast volumes with respect to average are in the Upper Colorado River mainstem, White/Yampa, and Virgin basins, where volume forecasts are generally near the 1981-2010 historical average. Lower Colorado River Basin January-May volume guidance increased during the past month due to above average March precipitation. Most Lower Basin April 1 water supply forecasts are much above median.

Virgin River Basin water supply forecasts increased by as much as 40% during the past month as a result of a wet March. April 1 SWE is generally 130-170% of normal over the Virgin Basin. Volume forecasts during the past month generally remained the same or increased slightly (5-10%) in the Duchesne, Dolores, and San Juan basins. The improvement in forecast guidance was due to above average precipitation and increased snowpack in these areas during March. Water supply volume forecasts generally declined around 5% in the White/Yampa and Upper Colorado River mainstem due to below average March precipitation. Green River and Gunnison March precipitation was more variable, and water supply forecasts followed the trend of observed March precipitation.

April-July unregulated inflow forecasts for some of the major reservoirs in the Upper Colorado River Basin include Fontenelle Reservoir 650 KAF (90% average), Flaming Gorge 880 KAF (90% of average), Blue Mesa Reservoir 525 KAF (78% of average), McPhee Reservoir 200 KAF (68% of average), and Navajo Reservoir 440 KAF (60% of average). The Lake Powell inflow forecast is 5.6 MAF (78% of average), a two percent decrease from March 1.

Water supply volume guidance in the Great Basin is most favorable in the Bear and Six Creeks basins, where forecasts are near to below average. Conditions in the Provo and Utah Lake Basins range from near normal in the headwaters of the Provo to below and much below normal for Utah Lake and Spanish Fork locations. The water supply outlook in the Weber River Basin is near to below average, with notable increases (5-10%) at East Canyon and Pineview reservoir inflows. Sevier River Basin forecasts generally increased in the past month due to above average March precipitation.

F​or specific site water supply forecasts​ click ​here

Water Supply Discussion
Weather Synopsis / March Precipitation & Temperature

The weather pattern during the month of March was favorable for bringing storm systems across the Lower Basin into southern Utah/Colorado, while generally missing much of the northern portions of Utah/Colorado and Wyoming. A slow moving cutoff low pressure system produced multiple days of heavy precipitation from March 10-12 over much of Arizona and southern Utah. Widespread 2-4 inches of precipitation fell over this period across the western half of Arizona (Bill Williams, Agua Fria, Verde basins) with 2-3 inches in the mountainous areas of southern Utah (Virgin basin). Another storm system on March 18-19 moved northeastward from Arizona into southern Colorado, producing another round of impressive precipitation. These two storm systems were generally too far south to significantly impact the northern half of Utah/Colorado and Wyoming, with the exception of the Uinta mountain range. A late month storm system on March 24-25 over the Great Basin targeted northern Utah and Wyoming, producing modest precipitation amounts.

March precipitation was variable across the Great Basin and Upper Colorado River Basin. Precipitation was near normal across the Upper Green Basin in Wyoming and the Bear/Weber basins in northern Utah. Precipitation was below average across the Upper Colorado mainstem and White/Yampa basins in northwest Colorado and the Six Creeks basin in Utah. Basins in southwestern Colorado (San Juan, Dolores) in addition to the Lower Green in northeast Utah fared better with slightly above (110-130%) average precipitation. As mentioned earlier, the Lower Basin saw much above average precipitation amounts during March with many SNOTEL locations in the Verde and Salt basins in the 80-90th percentile (or 150-200% of average). March maximum temperatures across the Great Basin and Colorado River Basin were near to below normal. This helped preserve snow, even at lower elevations, that will contribute to seasonal runoff volumes.

Snowpack

Observed snow water equivalent (SWE) conditions as of early April are generally near to slightly above normal (median) across the Upper Colorado River Basin and Great Basin. SWE conditions as a percent of the 1981-2010 median improved the most during March in the Virgin River Basin in southern Utah after a wet March. As of April 1, SWE is generally 130-170% of normal over the Virgin Basin. With the exception of the highest elevations of the Salt basin, snowpack has almost entirely melted out across the mountainous areas of the Lower Colorado River Basin (Arizona).

Upper Colorado River Basin SWE conditions as a percent of the 1981-2010 median improved during March in the Duchesne, Lower Green, and southwest Colorado (Gunnison, Dolores, and San Juan) basins. Duchesne SWE conditions are currently slightly above normal while the Lower Green, Gunnison, Dolores, and San Juan basins are near the early April historical median. Snow conditions in the Upper Green, White/Yampa, and Upper Colorado River mainstem declined slightly during March due to below average precipitation. SWE conditions as of early April remain above normal in the Upper Colorado River mainstem and near normal in the Upper Green and White/Yampa basins.

Great Basin SWE conditions did not change significantly during the past month when compared to the percent of historical median. Early April snowpack conditions remain above normal in the Six Creek basin, and near normal in the Bear, Weber, Provo/Utah Lake, and Sevier basins. Early April observed (SNOTEL) conditions as a percent of the 1981-2010 historical median are shown in the image below.

The image below is the representation of early April CBRFC model snow conditions in areas that provide the greatest contribution of April-July runoff. Model snow conditions closely correlate to SNOTEL conditions throughout the Colorado River and Great Basins.

For updated SNOTEL information refer to click ​here
For CBRFC hydrologic model snow click ​here

Soil Moisture

CBRFC hydrologic model soil moisture parameters are adjusted in the fall after the irrigation season and prior to the winter snowpack accumulation to accurately reflect observed baseflow conditions. CBRFC model fall soil moisture conditions impact early season water supply forecasts and potentially the efficiency of spring runoff. Above average fall soil moisture conditions have a positive impact on early season water supply forecasts while below average conditions have a negative impact. The impacts are most pronounced when soil moisture conditions and snowpack conditions are both much above or much below average.

Modeled soil moisture conditions as of November 15, 2019 were variable across the Upper Colorado River Basin and Great Basin, with conditions generally declining from north to south. In the Great Basin, soil moisture conditions were near average. Within the Upper Colorado River Basin, the Upper Green and Duchesne basins entered the winter with the most favorable soil moisture conditions, while the White, Yampa, and Colorado River mainstem basins entered the winter with below average soil moisture conditions. The Gunnison, Dolores, and San Juan basins in southwest Colorado entered the winter season with much below average soil moisture conditions, primarily due to the poor 2019 monsoon season.

Soil moisture conditions tend to fluctuate more in the Lower Colorado River Basin of Arizona and New Mexico in the winter due to the frequency of rain events and possibility of melting snow. Soil conditions in the fall are less informative than they are in the northern basins that remain under snowpack throughout the winter season.

After the unfavorable 2019 monsoon season, winter soil moisture conditions have improved significantly throughout the Lower Colorado River Basin during the past several months due to a combination of above average water year (October-March) precipitation and snowmelt runoff. Lower Colorado River Basin early April soil moisture conditions are generally above average, as shown in the image below.

Upcoming Weather

A cutoff low pressure system will develop off the California coast this weekend into early next week. An increase in ridging and southwesterly flow across the Colorado River Basin will bring a period of warming to much of the region, with near to slightly above normal temperatures expected. The cutoff system is forecast to slowly move eastward into Arizona and then into southern Colorado by Tuesday through Thursday of next week (April 7-9).

Precipitation chances will increase across Arizona into portions of Utah/Colorado as this system moves through the region. Overall, only modest precipitation amounts are expected at this time.The weather pattern becomes more uncertain in the 8-14 day period (April 10-16); however, a weak mean trough across the Intermountain West suggests slightly increased odds for below normal temperatures and above normal precipitation.

Basin Conditions and Summary Graphics
​Green River Basin
​Upper Colorado River Basin
San Juan River Basin
​Great Salt Lake Basin
Sevier River Basin
​Virgin River Basin

End Of Month Reservoir Content Tables [ed. the links below did not work as we went to press.]
​Green River Basin
​Upper Colorado River Basin ​San Juan River Basin
​Great Salt Lake Basin ​Sevier Basin

Paper: Virological assessment of hospitalized patients with COVID-2019 — Nature #coronavirus #COVID19

Click on the image to go to the Twitter thread. Nice explanation.

Click here to read the “Accelerated Article Preview” of the paper. From the paper:

Coronavirus disease 2019 (COVID-19) is an acute respiratory tract infection that emerged in late 2019. Initial outbreaks in China involved 13.8% cases with severe,and with critical courses. This severe presentation corresponds to the usage of a virus receptor that is expressed predominantly in the lung. By causing an early onset of severe symptoms, this same receptor tropism is thought to have determined pathogenicity, but also aided the control, of severe acute respiratory syndrome (SARS) in 2003. However, there are reports of COVID-19 cases with mild upper respiratory tract symptoms, suggesting the potential for pre- or oligosymptomatic transmission. There is an urgent need for information on body site-specific virus replication, immunity, and infectivity. Here we provide a detailed virological analysis of nine cases, providing proof of active virus replication in upper respiratory tract tissues. Pharyngeal virus shedding was very high during the first week of symptoms (peak at 7.11 × 10⁸ RNA copies per throat swab, day 4). Infectious virus was readily isolated from throat- and lung-derived samples, but not from stool samples, in spite of high virus RNA concentration. Blood and urine never yielded virus. Active replication in the throat was confirmed by viral replicative RNA intermediates in throat samples. Sequence-distinct virus populations were consistently detected in throat and lung samples from the same patient, proving independent replication. Shedding of viral RNA from sputum outlasted the end of symptoms. Seroconversion occurred after 7 days in 50% of patients (14 days in all), but was not followed by a rapid decline in viral load. COVID-19 can present as a mild upper respiratory tract illness. Active virus replication in the upper respiratory tract puts the prospects of COVID-19 containment in perspective.

Cranes of Blue Water: Ancient Creatures Over Historic Waters — Platte Basin Timelapse

Here’s a great story map from Kylee Warren that you can access on the Platte Basin Timelapse website. Click through to read and view the whole thing and to view the beautiful images.. Here’s an excerpt:

It was 2008, and I was on a family road trip through familiar lands. My aunt and uncle generously included me on their thirtieth wedding anniversary vacation to see the spring sandhill crane migration. I had never seen a crane before, and little did I know this journey would change my life…

But I knew this road well. I traveled Highway 92 many times while living with my grandparents during my childhood summers. At this moment, the only unfamiliarity was the group of many tall, silvery birds feeding and lingering in spent corn fields in front of the railroad tracks. The cranes also surprised my aunt and uncle. They grew up in this area but did not remember seeing so many cranes on this stretch of highway. I wanted to linger in Lewellen to get a closer look, but I heard I would see plenty of cranes on the 70 mile stretch of river between Kearney and Grand Island.

Sustainable mushroom production

From The North Forty News (Blaine Howerton):

When growing mushrooms biological diversity and sustainable agricultural practices create environments through the interdependence of natural ecosystems and recycling of by-products from farming and forest activities, species diversity and biological succession.

Fungi transform wood and other carbon material into amazing soil. In sustainable mushroom farming gourmet and medicinal mushrooms are involved as key organisms in the recycling of agricultural and forest by-products, creating an environment that produces intensive levels of productivity.

Mushrooms are a protein-rich food source and the by-products of mushroom cultivation provide nutrients for other members of the ecological community in the ecosystem. Recycling nutrients back into the ecosystem boosts the soil and makes mushroom farming very sustainable for plants, animals, insects and soil microorganisms that consume the recycled nutrients.

Fungi facilitate the transmission of nutrition from the soil to a plant’s roots and also from plant to plant. There are 10,000 known species of mushrooms but only about 100 are cultivated commercially.

The choice of deciding which mushrooms to grow is probably the hardest part of the process. When starting out in mushroom farming it is best to start with one species and expand from there.

You will have to consider what available space you have access to and also consider if you are going to grow indoors or outdoors. Indoor cultivation provides a more controlled environment, but set up costs can be quite high.

Commercial mushrooms are usually grown in sterile, climate-controlled laboratory-like settings. Growing mushrooms outside is more simple due to it’s low set up costs. Outdoor cultivation also allows for more location choices as well as more growing space.

I recommend that beginners start out with a small kit to learn the art of mushroom cultivation before investing in a commercial mushroom operation. Many kits for gourmet and medicinal mushrooms are available from a variety of online shroom suppliers.

Many mushroom species that can be incorporated into the sustainable farm or garden. The addition of mushrooms in a sustainable farm or garden will take you to another level because when fungi is incorporated into sustainable farms or gardens the ecological health of the whole ecosystem benefits immensely.

Shiitakes are the easiest to grow with the highest rate of success. They grow on fresh-cut hardwood logs that you inoculate with spores. These logs can be partially buried or lined up in fence-like rows.

Once the logs have stopped producing, the softened wood can be broken up, sterilized, and re-inoculated. Indoors, these mushrooms can be grown on sterilized substrates or on logs.

Oyster Mushrooms can be grown indoors on pasteurized corn stalks, wheat and a wide range of other materials including paper and pulp by-products. Oyster mushrooms can also be grown on hardwood stumps and logs. The waste substrate from Oyster production is useful as fodder for cows, chickens, & pigs.

The waste straw can be mulched into soils to provide structure and nutrition. Oyster mushrooms are available in several colors, including blue, white, pink and bright yellow. Under ideal conditions, fruiting can occur as quickly as three weeks.

King Stropharia mushrooms are an ideal element in the recycling of complex wood debris and garden wastes, and thrives in complex environments. Vigorously attacking wood (sawdust, chips, twigs, branches), the King Stropharia also grows in wood-free substrates, particularly soils supplemented with chopped straw.

Acclimated to northern latitudes, this mushroom fruits when air temperatures range between 60-90° F which usually translates to ground temperatures of 55-65° F. King Stropharia is an excellent edible mushroom when young, but edibility quickly declines as the mushrooms mature.

Reishi mushrooms are also an excellent choice for the sustainable mushroom farmer. Logs and stumps can be inoculated which provides opportunities for stump culture in regions where hardwoods predominate.

Shaggy Mane mushrooms grow in rich manured soils, disturbed habitats, in and around compost piles, and in grassy and gravel areas. Shaggy Manes are extremely adaptive and tend to wander. Shaggy Mane patches travel great distances from their original site of inoculation in their search for fruiting niches. Morels grow in a variety of habitats, from abandoned apple orchards and diseased elms to gravelly roads and stream beds.

The complex habitat of a compost pile also supports Morel growth. When planting cottonwood trees, you can introduce spawn around the root zones in hopes of creating a perennial Morel patch. Growers should note that Morels are fickle and elusive by nature compared to more predictable species like King Stropharia, Oyster and Shiitake mushrooms.

Mycorrhizal species can be introduced via several techniques. The age-old, proven method of satellite planting is probably the simplest. By planting young seedlings around the bases of trees naturally producing Chanterelles, Truffles or other desirable species, you may establish satellite colonies by replanting the young trees after several years of association.

Sustainable mushroom farming doesn’t have to be complicated or expensive. By using spores from reliable sources and following the basic steps, shrooming can be a fun and easy way to make your farm or garden more sustainable.

#Colorado #climate webinar to discuss decarbonization, energy, #climatechange — @CUBoulderNews

Click on the graphic to go to the website for all the inside skinny.

Tuesday, April 7, 2020
5:00 – 6:30 PM
ONLINE ONLY THROUGH ZOOM

Registration Required | More Info

The Power Dialog will support College and University partners across the US, focused on the potential to solve the energy side of climate change by 2030. Here in Colorado, the Dialog gives students and community members a voice in critical decisions that will determine their future, and the future of the earth.

5:00-6:30 PM MESSAGES ON COVID19+CLIMATE
Messages from National PowerDialog and Governor Jared Polis

LIVE PANEL DISCUSSION
On A Just Transition in Colorado& Beyond

COMMUNITY FORUM
Ask Questions & Talk with Panelists

Panelists

  • Phaedra Pezzullo, Environmental Communication,CU Boulder
  • Bill Ritter, Former Governor of Colorado, Center for the New Energy Economy, CSU
  • Jorge Figueroa, Co-Founder and Director, El Laboratorio
  • Max Boykoff, Center for Science and Technology Policy Research
  • Here’s the release from the University of Colorado:

    CU Boulder will host the regional version of a national effort to “make climate a class.”

    Associate Professors Max Boykoff (Environmental Studies) and Phaedra Pezzullo (Communication) along with undergraduate student Andrew Benham (Engineering) are hosting the webinar “Power Dialog: Climate Solutions for Colorado“—mainly targeted to college and high school educators—on Tuesday, April 7. The aim is to foster discussions focused on decarbonization, energy and climate change in Colorado over the next decade.

    The event in Boulder is taking place simultaneously with similar online events in every U.S. state and also in Puerto Rico, as well as in Washington, D.C.

    Colorado Gov. Jared Polis will first offer his comments on these issues in a prerecorded message specific for the event. Then, Boykoff will moderate a panel called “A Just Transition in Colorado and Beyond.”

    Panelists include: former Gov. Bill Ritter, founder of the Center for the New Energy Economy at Colorado State University and author of Powering Forward—What Everyone Should Know About America’s Energy Revolution; Phaedra Pezzullo, founding co-director of the Just Transition Collaborative and co-director of Inside the Greenhouse; and Jorge Figueroa, a Water Education Colorado board member who runs El Laboratorio to promote agricultural and food security in Puerto Rico after Hurricane Maria.

    Teachers of all disciplines are encouraged to use this webinar to “make climate a class,” and help refocus the nation and the world on the challenge that still lies beyond COVID-19: climate change. The recorded webinar, plus subject-area online resources, will be available through May.

    “The success of these efforts in Colorado over the coming decade will depend on each of us recognizing that our individual perspectives and expertise have great value when confronting a set of collective-action challenges like energy, decarbonization and climate change,” said Boykoff.

    This Colorado discussion is part of a national effort of 55 university-hosted webinars, led by Eban Goodstein from Bard College in New York, with support from David Blockstein from the Association of Environmental Studies and Sciences. For more information, visit http://solveclimateby2030.org.

    “We are living through a unique moment in the history of this country where the role of states in safeguarding the wellbeing of its peoples is highlighted like never before,” Boykoff said. “We are seeing in real time the criticality of cooperation, civic-mindedness and trust across our communities and institutions. Going forward, we must continue to invest in these values for the benefit of Colorado.”

    This event is co-sponsored by the Colorado Energy Office, the Conference on World Affairs, the Center for Science and Technology Policy Research, the Boulder Faculty Climate Science & Education Committee, the Media and Climate Change Observatory, and Inside the Greenhouse at CU Boulder.

    Registration is required. Those who RSVP will be emailed the log-on information just before the event to participate.

    Spring brings more fears for #MissouriRiver flooding — The Kirksville Daily Express

    2019 Nebraska flooding. Photo Credit: University of Nebraska Lincoln Crop Watch

    From The Kirksville Daily Express (Mike Genet):

    A year after flooding battered the Missouri River’s levee system, inundating towns and farmland and causing multiple closures to the nation’s interstate highway system, early forecasts warn that more of the same could be on the way: above-normal rainfall, greater than normal spring runoff. A USA TODAY Network analysis delves into records of an aging system of nearly a thousand levees where nobody knows how many were damaged last year or how many were repaired…

    The forecast is a veritable index of meteorological plagues: above-normal rainfall; greater than normal spring runoff; thoroughly saturated soils; and an aging system of nearly a thousand levees where nobody knows how many were damaged last year and in previous floods or how many were repaired.

    The 855 levee systems throughout the Missouri River basin protect at least half a million people and more than $92 billion in property. Yet a USA TODAY Network analysis of Army Corps of Engineers’ records found at least 144 levee systems haven’t been fully repaired and that only 231 show an inspection date.

    Of those, nearly half were rated “unacceptable,” which means something could prevent the levee from performing as intended or a serious deficiency was not corrected. Only 3.5% were deemed acceptable; the rest were found to be “minimally acceptable.”

    U.S. levee systems map via the U.S. Army Corps of Engineers. Click on the map to go to the interactive website.

    Only 231 of the levee systems show any inspection date. For 38, the most recent inspection date was more than five years ago.

    In the Army Corps’ Kansas City district, for example, about 70 projects, spanning 119 levees that requested repair assistance, are eligible for funding, but that doesn’t mean they’ll be ready if the waters rise like they did last year.

    “Some of them have been repaired, but from a total system perspective, I don’t think any of them are whole,” said Jud Kneuvean, the district’s chief of emergency management, who expects full levee rehabilitation and repair to take at least another year.

    In the meantime, the extent and impacts of flooding will depend on when and where the rain falls…

    The 2,300-mile Missouri River begins in southwestern Montana, where the Gallatin, Madison and Jefferson rivers converge near the community of Three Forks, before gathering water from 10 states and parts of two Canadian provinces to become the “Big Muddy,” North America’s longest river.

    In recent years, more rainfall has been pouring into the Missouri River basin, raising questions about whether climate change is bringing worsening floods more often. Data from the National Oceanic and Atmospheric Administration dating back to 1895 shows record-setting rainfalls in the area occurring more often. Last year, for example, was the wettest on record in North Dakota, South Dakota and Minnesota.

    All that water adds to the challenge faced by Corps policymakers, who juggle sometimes conflicting priorities that include maintaining navigation; managing the reservoir system to prevent flooding; providing farmers with irrigation and hydropower; protecting endangered species; and preserving recreational opportunities.

    While the priority is protecting human life and safety, the Corps’ decision-making sometimes puts special interest groups at odds, and the agency remains embroiled in controversy over whether the engineering of the river exacerbates flooding.

    Things came to a head last year when a bomb cyclone in March melted all the snow in Nebraska and Iowa at once and dumped tremendous rain, swelling not just the Missouri, but the Elkhorn, Platte, James and Big Sioux rivers.

    The Niobrara River in Nebraska breached the Spencer Dam on March 14, sending a wall of water downstream and into the Gavins Point reservoir near Yankton, South Dakota. At the peak, water flowed into the reservoir at 180,000 cubic feet per second — nine times more than the normal average for March. Meanwhile water was coursing into the rivers downstream of the dam and the effects of all that water were felt in nearly every community downstream.

    Two other big rain events occurred in May and September. When the Corps’ Kansas City district deactivated its emergency operations center in December, it had been open for 279 days, the longest period on record…

    Construction of the higher levee is in the administrative and planning stages, with actual construction activity set for fall.

    Most of the Missouri’s levees fall into one of two categories: either federally built and locally operated or locally built and operated. The Corps inspects — and helps pay to repair — only the levees maintained to federal standards that participate in the federal flood program.

    That exception means no one has a full list of damaged levees still in need of repair.

    The number of levees that aren’t regularly inspected doesn’t surprise Neal Grigg, an engineering professor at Colorado State University who chaired a Corps-appointed review panel after 2011 flooding.

    In an ideal management system, every levee “would be under the responsibility of some authority that was responsible and had enough money and good management capability to do that,” Grigg said.

    But that’s not realistic, he added, noting that the Corps has tried through a task force to get some organization to the levee systems along the river, but it’s problematic, in part, because there are so many conflicting interests.

    A host of agencies are cooperating to repair levees, but the progress is slow, said Missouri farmer Morris Heitman, who serves on the Missouri River Flood Task Force Levee Repair Working Group.

    In addition to the Corps, the Federal Emergency Management Agency, the state of Missouri, the USDA Natural Resources Conservation Service and a large number of local levee districts all work to repair levees.

    “We’re trying to dance with different agencies,” Heitman told the University of Missouri Extension. “All these agencies have their own requirements and parameters, and we’re trying to coordinate those to build a secure system against the river.”

    Fixes to the 144 levee systems listed in disrepair in the Corps’ Omaha and Kansas City districts are in various stages of completion, and some aren’t expected to be done for more than a year.

    In the Omaha district that includes Nebraska and Iowa, “pretty much all of the levees were damaged in one way or another,” said the corps’ Matt Krajewski.

    While almost all of the district’s levees that qualify for federal aid have been restored to pre-2019 flood heights, Krajewski said they don’t offer the same level of “risk reduction” because they need final touches such as sod cover and drainage structures to protect against erosion. The Corps hopes to complete those repairs this summer.

    In the meantime, the Corps is working to prepare its flood storage capacity by releasing more water than normal from its dams.

    “We’re being really aggressive with our releases and trying to maintain our full flood storage,” said Eileen Williamson, a Corps spokeswoman for the Northwestern region.

    But the projections for spring runoff don’t look good and may limit how much the Corps can do.

    In February, the runoff was twice the normal average, said Kevin Grode, with the Corps’ Missouri River Basin Water Management district.

    The James River, a tributary that flows out of South Dakota, has experienced flooding since March 13 last year and that flooding is forecast to continue. Moderate flooding is expected along the Big and Little Sioux Rivers in South Dakota and Iowa, and possibly in Montana’s Milk River basin. A risk of minor to moderate flooding is forecast from Nebraska City to the river’s confluence with the Mississippi in St. Louis.

    But it’s not just the spring runoff that’s a problem, Grode said. The forecast also calls for “above average runoff for every month in 2020.”

    John Remus, chief of the Corps’ Missouri River Water Management Division, said during a March briefing that if those projections are realized, “the 2020 runoff will be the ninth highest runoff in 122 years of record keeping.”

    In March, a three-man team with Montana’s Helena-Lewis and Clark National Forest set off on horseback for a 35-mile, five-day journey into the wild North Fork of the Sun River, a tributary of the Missouri River.

    They rode horses for the first 12 miles. When they reached a foot of snow, they switched to skis and took turns breaking trail.

    Greeted by a half inch of new snow each morning, higher and higher they skied, encountering snow depths of 19 inches, then 2 feet, 9 inches and finally, 3 feet, 3 inches.

    Karl Wetlaufer (NRCS), explaining the use of a Federal Snow Sampler, SnowEx, February 17, 2017.

    At each elevation, aluminum tubes with non-stick coating were stuck into the snow to collect core samples used to measure the depth and water content of the snowpack.

    “The numbers are used for everything from dam control along the Missouri River to regulating the locks on the barges of the Mississippi,” said Ian Bardwell, the forest’s wilderness and trails manager, who led the snow survey expedition. “It just depends on what level you are looking at it from.”

    As of Wednesday, mountain snowpack in the Missouri River basin in Montana was 112% of normal, said Lucas Zukiewicz, a water supply specialist with the Department of Agriculture’s Natural Resources Conservation Service in Montana.

    In 2018, Montana’s April snowpack was 150% of normal, then 7 to 9 inches of rain over six days drenched the Rocky Mountain Front, inundating communities in its shadow. The Corps was forced to release water from the Fort Peck Dam spillway, a rarity, as a result of surging flows. Had that same thing happened last year, flooding in states downstream would have been even worse.

    “With the way things are changing with our climate,” said Arin Peters, a senior hydrologist for the National Weather Service in Great Falls, Montana, “it’s probably a matter of time before something combines to create a big catastrophe downstream.”

    Yet for this year, there may be some good news downstream from the Montana snowpack, at the Gavins Point Dam in Yankton.

    Gavins Point is what’s known as a reregulation dam, its purpose to even the Missouri’s flow from the reservoirs upstream. Because Gavins Point wasn’t designed to hold floodwater, its gates had to be opened last year, sending a surge downstream after Nebraska and parts of South Dakota were hit with rain and the bomb cyclone.

    In November and December, Gavins Point was still releasing water at a rate of 80,000 cubic feet per second — more than five times the average flow, and something that had never happened before, said Tom Curran, the dam’s project manager.

    The good news? Releasing all that water through the winter left the mainstem dam system drained to its multipurpose zone, where it has capacity to absorb runoff while also fulfilling its other functions, including recreation and downstream barge traffic.

    Created by Imgur user Fejetlenfej , a geographer and GIS analyst with a ‘lifelong passion for beautiful maps,’ it highlights the massive expanse of river basins across the country – in particular, those which feed the Mississippi River, in pink.

    @NASA, @U_Nebraska Release New Global Groundwater Maps and U.S. Drought Forecasts

    Weekly maps of dry conditions in red and wet conditions in blue relative to the historic record are now available for the globe at three depths: surface soil moisture, root zone soil moisture, and groundwater, the latter shown in this global view. Credit: NASA / Scientific Visualization Studio

    Here’s the release from NASA:

    NASA researchers have developed new satellite-based, weekly global maps of soil moisture and groundwater wetness conditions and one to three-month U.S. forecasts of each product. While maps of current dry/wet conditions for the United States have been available since 2012, this is the first time they have been available globally.

    “The global products are important because there are so few worldwide drought maps out there,” said hydrologist and project lead Matt Rodell of NASA’s Goddard Space Flight Center in Greenbelt, Maryland. “Droughts are usually well known when they happen in developed nations. But when there’s a drought in central Africa, for example, it may not be noticed until it causes a humanitarian crisis. So it’s valuable to have a product like this where people can say, wow, it’s really dry there and no one’s reporting it.”

    These maps are distributed online by the National Drought Mitigation Center at the University of Nebraska-Lincoln (UNL) to support U.S. and global drought monitoring.

    “Being able to see a weekly snapshot of both soil moisture and groundwater is important to get a complete picture of drought,” said professor Brian Wardlow, director for the Center for Advanced Land Management Information Technologies at UNL, who works closely with Rodell on developing remote sensing tools for operational drought monitoring.

    Monitoring the wetness of the soil is essential for managing agricultural crops and predicting their yields, because soil moisture is the water available to plant roots. Groundwater is often the source of water for crop irrigation. It also sustains streams during dry periods and is a useful indicator of extended drought. But ground-based observations are too sparse to capture the full picture of wetness and dryness across the landscape like the combination of satellites and models can.

    [Using measurements from two satellite missions assimilated into a computer model, researchers have created global maps of terrestrial water around the planet. In addition, they can forecast water availability in the United States up to three months out. Credits: NASA’s Goddard Space Flight Center/Scientific Visualization Studio]

    A Global Eye on Water
    Both the global maps and the U.S. forecasts use data from NASA and German Research Center for Geosciences’s Gravity Recovery and Climate Experiment Follow On (GRACE-FO) satellites, a pair of spacecraft that detect the movement of water on Earth based on variations of Earth’s gravity field. GRACE-FO succeeds the highly successful GRACE satellites, which ended their mission in 2017 after 15 years of operation. With the global expansion of the product, and the addition of U.S. forecasts, the GRACE-FO data are filling in key gaps for understanding the full picture of wet and dry conditions that can lead to drought.

    The satellite-based observations of changes in water distribution are integrated with other data within a computer model that simulates the water and energy cycles. The model then produces, among other outputs, time-varying maps of the distribution of water at three depths: surface soil moisture, root zone soil moisture (roughly the top three feet of soil), and shallow groundwater. The maps have a resolution of 1/8th degree of latitude, or about 8.5 miles, providing continuous data on moisture and groundwater conditions across the landscape.

    The GRACE and GRACE-FO satellite-based maps are among the essential data sets used by the authors of the U.S. Drought Monitor, the premier weekly map of drought conditions for the United States that is used by the U.S. Department of Agriculture and the Federal Emergency Management Agency, among others, to evaluate which areas may need financial assistance due to losses from drought.

    “GRACE [provided and GRACE-FO now provides] a national scope of groundwater,” said climatologist and Drought Monitor author Brian Fuchs, at the drought center. He and the other authors use multiple data sets to see where the evidence shows conditions have gotten drier or wetter. For groundwater, that used to mean going to individual states’ groundwater well data to update the weekly map. “It’s saved a lot of time having that groundwater layer along with the soil moisture layers, all in one spot,” Fuchs said. “The high-resolution data that we’re able to bring in allows us to draw those contours of dryness or wetness right to the data itself.”

    One of the goals of the new global maps is to make the same consistent product available in all parts of the world—especially in countries that do not have any groundwater-monitoring infrastructure.

    “Drought is really a key [topic]… with a lot of the projections of climate and climate change,” Wardlow said. “The emphasis is on getting more relevant, more accurate and more timely drought information, whether it be soil moisture, crop health, groundwater, streamflow—[the GRACE missions are] central to this,” he said. “These types of tools are absolutely critical to helping us address and offset some of the impacts anticipated, whether it be from population growth, climate change or just increased water consumption in general.”

    Both the Center for Advanced Land Management and the National Drought Mitigation Center are based in UNL’s School of Natural Resources, and they are working with international partners, including the U.S. Agency for International Development and the World Bank, to develop and support drought monitoring using the GRACE-FO global maps and other tools in the Middle East, North Africa, South Africa, South East Asia, and India.

    U.S. Forecasts Maps for the Lower 48

    30, 60, and 90-day forecasts of dry and wet conditions relative to the historic record for the Lower 48 United States use groundwater data from the NASA/GFZ GRACE-FO satellites for the initial conditions. This comparison shows the groundwater forecast made for August 2019 compared to the output based on the satellite observations for the same month.
    Credits: NASA / Scientific Visualization Studio

    Droughts can be complex, both in timing and extent. At the surface, soil moisture changes rapidly with weather conditions. The moisture in the root zone changes a little slower but is still very responsive to weather. Lagging behind both is groundwater, since it is insulated from changes in the weather. But for longer-term outlooks on drought severity—or, conversely, flood risk in low-lying areas—groundwater is the metric to watch, said Rodell.

    “The groundwater maps are like a slowed down, smoothed version of what you see at the surface,” Rodell said. “They represent the accumulation of months or years of weather events.” That smoothing provides a more complete picture of the overall drying or wetting trend going on in an area. Having an accurate accounting of groundwater levels is essential for accurately forecasting near-future conditions.

    The new forecast product that projects dry and wet conditions 30, 60, and 90 days out for the lower 48 United States uses GRACE-FO data to help set the current conditions. Then the model runs forward in time using the Goddard Earth Observing System, Version 5 seasonal weather forecast model as input. The researchers found that including the GRACE-FO data made the resulting soil moisture and groundwater forecasts more accurate.

    Since the product has just been rolled out, the user community is only just beginning to work with the forecasts, but Wardlow sees a huge potential.

    “I think you’ll see the GRACE-FO monitoring products used in combination with the forecasts,” Wardlow said. “For example, the current U.S. product may show moderate drought conditions, and if you look at the forecast and the forecast shows next month that there’s a continued drying trend, then that may change the decision versus if it was a wet trend.”

    The U.S. forecast and global maps are freely available to users through the drought center’s data portal.

    To download the maps, visit: https://nasagrace.unl.edu/

    To learn more about GRACE and GRACE-FO, visit: https://gracefo.jpl.nasa.gov/

    GRACE-FO is a partnership between NASA and the German Research Centre for Geosciences (GeoForschungsZentrum [GFZ]). Both spacecraft are being operated from the German Space Operations Center in Oberpfaffenhofen, Germany, under a GFZ contract with the German Aerospace Center (Deutsches Zentrum für Luft- und Raumfahrt). The Jet Propulsion Laboratory manages the mission for NASA’s Science Mission Directorate at NASA Headquarters in Washington. Caltech in Pasadena, California, manages JPL for NASA. The GRACE-FO mission was launched in early 2018.

    GRACE was implemented as a joint mission of NASA and the German Aerospace Center. NASA’s Jet Propulsion Laboratory managed the mission’s implementation and operations. The GRACE mission was decommissioned in late 2017.

    Development of the drought/wetness products was funded by NASA’s Applied Sciences–Water Resources, Terrestrial Hydrology, and GRACE-FO Science Team programs.

    Cover image: Weekly maps of dry conditions in red and wet conditions in blue relative to the historic record are now available for the globe at three depths: surface soil moisture, root zone soil moisture, and groundwater, the latter shown in this global view. Credit: NASA / Scientific Visualization Studio

    There’s too much nitrogen and phosphorus in U.S. waterways — Florida International University

    Algae. Photo credit: Florida International University

    Here’s the release from Florida International University (Chrystian Tejedor):

    Even minor amounts of human activity can increase nutrient concentrations in fresh waters that can damage the environment, according to a new study.

    These findings suggest most U.S. streams and rivers have higher levels of nitrogen and phosphorus than is recommended. Although nutrients are a natural part of aquatic ecosystems like streams and rivers, too much of either nutrient can have lasting impacts on the environment and public health.

    In Florida, toxic blue-green algal blooms have been triggered by releases of phosphorus-laden waters from Lake Okeechobee. Algal blooms produce a foul odor along waterways, decrease dissolved oxygen, threaten insect and fish communities and can even produce toxins that are harmful to mammals and humans.

    “Ecosystems are being loaded with legacy and current nitrogen and phosphorus, and their capacity to hold these nutrients in many cases is decreasing,” said FIU associate professor John Kominoski, an ecologist and co-author of the study. “Not only are they being overwhelmed by nutrients, but they also have and continue to undergo hydrological and land use alterations.”

    As human populations and demands increasingly grow, more land – including wetlands – is converted to agricultural and urban uses. This can introduce more nitrogen and phosphorus onto the land, which eventually makes its way into bodies of water. To make matters worse, soil erosion and climate change are also impacting nutrient pollution, leading to nutrient export to coastal waters, Kominoski said.

    Nitrogen is most likely to come from transportation, industry, agriculture and fertilizer application, while increased phosphorus is more commonly the result of sewage waste, amplified soil erosion and runoff from urban watersheds.

    “High concentrations of nitrogen and phosphorus in our waterways are concerning because they threaten both human and ecosystem health,” said David Manning, an assistant professor of biology at the University of Nebraska at Omaha and lead author on the paper. “Nutrients are essential for all life, but when they get too high in our waterways, they can fundamentally change the way a stream looks and operates.”

    In addition to causing algal blooms, these elevated nutrient concentrations can lead to a lack of species diversity and oxygen depletion. High nutrient concentrations can also affect the purity of the water we drink.

    Nutrient pollution is a complex problem. While there’s still a lot of work to be done to develop management tools and set thresholds for nutrient concentrations in streams and rivers, better understanding of how nutrients are transported through the interconnected network of waterways can help lead to solutions. Kominoski emphasized the importance of management solutions at local-to-global scales required to effectively manage various sources of nitrogen and phosphorus.

    “Water is a shared resource that connects communities, landscapes, and continents across the globe,” Kominoski said. “We must increase the protection and rehabilitation of ecosystems and water resources throughout the world, especially as human populations increase and climate changes.”

    The study was published in Ecological Applications.

    #ColoradoSprings watering rules

    Orr Manufacturing Vertical Impact Sprinkler circa 1928 via the Irrigation Museum

    From The Colorado Springs Gazette (Fredricka Bogardus):

    Adoption of permanent water conservation principles prior to a drought crisis makes sense. We live in a semiarid climate and will have periodic droughts. Long-term planning is always less costly and painful than crisis response.

    The new ordinance addresses the frequency and time of watering for those using automatic sprinkler systems.

    1. You may operate sprinklers up to three times per week, your choice of days. This is adequate frequency for turf and almost all plants that will do well in our climate.

    For more information on turf irrigation frequency check out Colorado State University fact sheet 7.199 Watering Established Lawns (https://extension.colostate.edu/topic-areas/yard-garden/watering-established-lawns-7-199/).

    2. Between May 1 and Oct. 15, sprinkler operation is prohibited from 10 a.m. to 6 p.m. During the warm hours of the day, most water applied will be lost to evaporation. While it might seem to be a good idea to run the sprinklers mid-day when it is very warm, it will actually be less beneficial to the turf than watering at a cooler time of the day.

    3. Drip irrigation, watering cans and hose watering with a shut-off nozzle are allowed at any time.

    4. If you are establishing a new landscape or have other special circumstances, you can apply to Colorado Springs Utilities for a permit or allocation plan.

    5. Broken or leaking sprinkler systems are required to be repaired within 10 days.

    6. Water runoff across nonirrigated ground, street or sidewalks is prohibited.

    Environmentalists Object to Broad @EPA Waivers for Polluters During #Coronavirus Crisis — @WildEarthGuard #COVID19

    The air pollution that industrial plants will not have to monitor damages the respiratory system, which is especially dangerous for already at-risk populations who may also become infected with COVID-19, which attacks the lungs. Photo credit: Ryan Adams via The High Country News

    Here’s the release from Wild Earth Guardians (Rebecca Sobel):

    Response to Trump Administration’s Plan to Relax Public Health Protections for Oil Refineries and Other Industries

    WildEarth Guardians joined a coalition of environmentalists objecting to the Environmental Protection Agency (EPA) new Trump administration policy that relaxes environmental compliance rules for petrochemical plants and other big polluters during the coronavirus crisis.

    “Relaxing pollution controls in the midst of a deadly health crisis is an obscene new low for the Trump administration,” said Rebecca Sobel, Senior Climate and Energy Campaigner for WildEarth Guardians. “While the pandemic worsens, the administration is propping up polluters in poisoning clean air, instead of focusing on the health and safety of Americans.”

    The environmental organizations voiced their concerns in response to an announcement yesterday that the Trump administration EPA will “provide enforcement discretion under the current, extraordinary conditions.”

    “It is not clear why refineries, chemical plants, and other facilities that continue to operate and keep their employees on the production line will no longer have the staff or time they need to comply with environmental laws,” said the statement, which was written by Eric Schaeffer of the Environmental Integrity Project, former Director of Civil Enforcement at EPA.

    The Environmental Integrity Project released a report last year documenting the sharp drop in environmental enforcement during the Trump administration.

    In February, WildEarth Guardians joined the Environmental Integrity Project in publishing a report documenting EPA air monitoring data at the fencelines of oil refineries which demonstrated excessive release of cancer-causing benzene into nearby communities at concentrations far above federal action levels. The second worst refinery in the U.S. was the Holly Frontier Navajo Artesia refinery in Artesia, New Mexico, where monitors at the plant’s fenceline detected benzene in amounts four times the EPA action level.

    “Instead of reining in illegal polluters, this administration is propping them up, further endangering the health of New Mexicans and all Americans in the process,” continued Sobel. “We are all in this together, and now is the time to protect people, not polluters.”

    The U.S. was beset by denial and dysfunction as the #coronavirus raged — The Washington Post #COVID19

    Click on the image to go to the John Hopkins website for the latest data.

    From The Washington Post (Yasmeen Abutaleb, Josh Dawsey, Ellen Nakashima and Greg Miller). Click through and read the whole article. Here’s an excerpt:

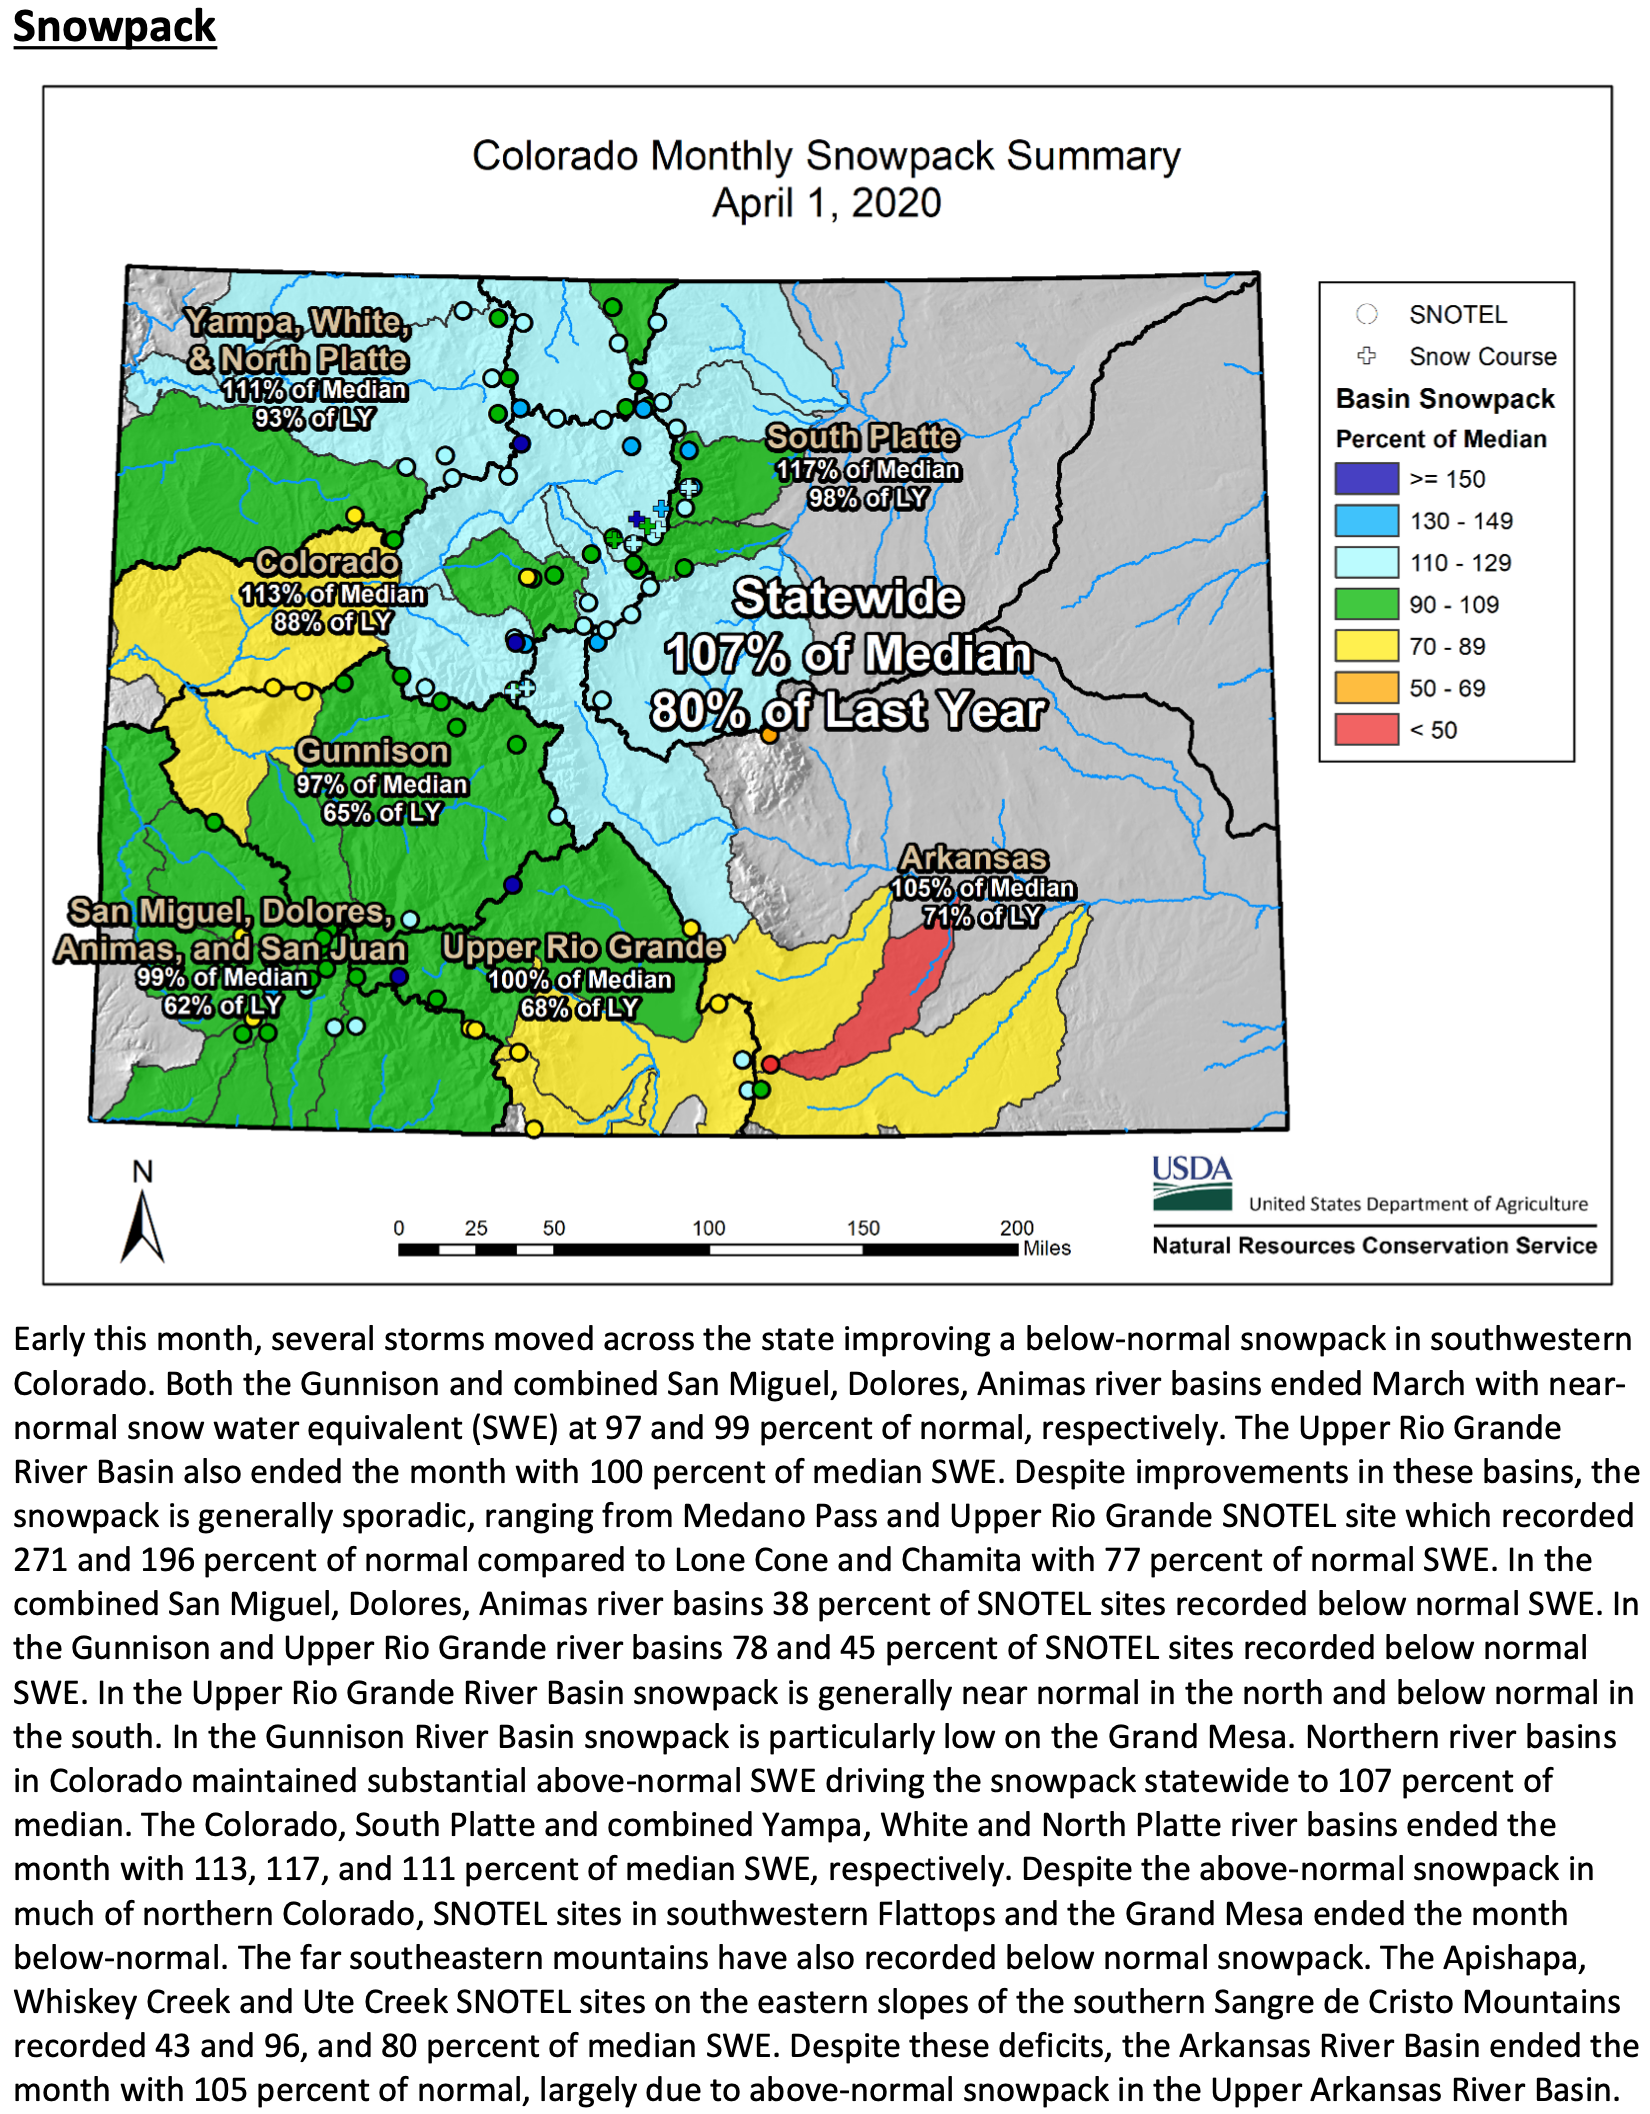
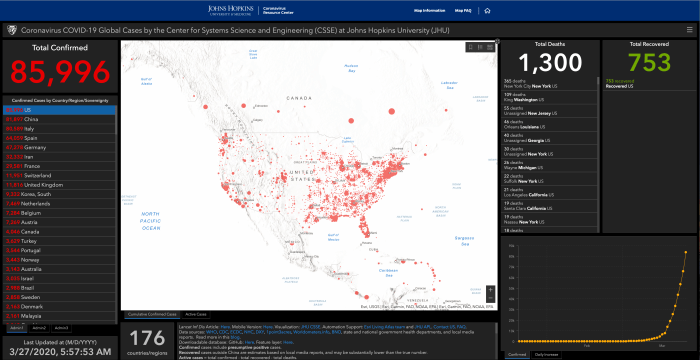
    By the time Donald Trump proclaimed himself a wartime president — and the coronavirus the enemy — the United States was already on course to see more of its people die than in the wars of Korea, Vietnam, Afghanistan and Iraq combined.

    The country has adopted an array of wartime measures never employed collectively in U.S. history — banning incoming travelers from two continents, bringing commerce to a near-halt, enlisting industry to make emergency medical gear, and confining 230 million Americans to their homes in a desperate bid to survive an attack by an unseen adversary.

    Despite these and other extreme steps, the United States will likely go down as the country that was supposedly best prepared to fight a pandemic but ended up catastrophically overmatched by the novel coronavirus, sustaining heavier casualties than any other nation.

    It did not have to happen this way. Though not perfectly prepared, the United States had more expertise, resources, plans and epidemiological experience than dozens of countries that ultimately fared far better in fending off the virus.

    The failure has echoes of the period leading up to 9/11: Warnings were sounded, including at the highest levels of government, but the president was deaf to them until the enemy had already struck.

    The Trump administration received its first formal notification of the outbreak of the coronavirus in China on Jan. 3. Within days, U.S. spy agencies were signaling the seriousness of the threat to Trump by including a warning about the coronavirus — the first of many — in the President’s Daily Brief.The Trump administration received its first formal notification of the outbreak of the coronavirus in China on Jan. 3. Within days, U.S. spy agencies were signaling the seriousness of the threat to Trump by including a warning about the coronavirus — the first of many — in the President’s Daily Brief.

    And yet, it took 70 days from that initial notification for Trump to treat the coronavirus not as a distant threat or harmless flu strain well under control, but as a lethal force that had outflanked America’s defenses and was poised to kill tens of thousands of citizens. That more-than-two-month stretch now stands as critical time that was squandered.

    Trump’s baseless assertions in those weeks, including his claim that it would all just “miraculously” go away, sowed significant public confusion and contradicted the urgent messages of public health experts.

    “While the media would rather speculate about outrageous claims of palace intrigue, President Trump and this Administration remain completely focused on the health and safety of the American people with around the clock work to slow the spread of the virus, expand testing, and expedite vaccine development,” said Judd Deere, a spokesman for the president. “Because of the President’s leadership we will emerge from this challenge healthy, stronger, and with a prosperous and growing economy.”

    But the president’s behavior and combative statements were merely a visible layer on top of deeper levels of dysfunction.

    The most consequential failure involved a breakdown in efforts to develop a diagnostic test that could be mass produced and distributed across the United States, enabling agencies to map early outbreaks of the disease, and impose quarantine measure to contain them. At one point, a Food and Drug Administration official tore into lab officials at the Centers for Disease Control and Prevention, telling them their lapses in protocol, including concerns that the lab did not meet the criteria for sterile conditions, were so serious that the FDA would “shut you down” if the CDC were a commercial, rather than government, entity.

    Other failures cascaded through the system. The administration often seemed weeks behind the curve in reacting to the viral spread, closing doors that were already contaminated. Protracted arguments between the White House and public health agencies over funding, combined with a meager existing stockpile of emergency supplies, left vast stretches of the country’s health-care system without protective gear until the outbreak had become a pandemic. Infighting, turf wars and abrupt leadership changes hobbled the work of the coronavirus task force…

    Even the president’s base has begun to confront this reality. In mid-March, as Trump was rebranding himself a wartime president, and belatedly urging the public to help slow the spread of the virus, Republican leaders were poring over grim polling data that suggested Trump was lulling his followers into a false sense of security in the face of a lethal threat.

    The poll showed that far more Republicans than Democrats were being influenced by Trump’s dismissive depictions of the virus and the comparably scornful coverage on Fox News and other conservative networks. As a result, Republicans were in distressingly large numbers refusing to change travel plans, follow “social distancing” guidelines, stock up on supplies or otherwise take the coronavirus threat seriously…

    On Jan. 6, Redfield sent a letter to the Chinese offering to send help, including a team of CDC scientists. China rebuffed the offer for weeks, turning away assistance and depriving U.S. authorities of an early chance to get a sample of the virus, critical for developing diagnostic tests and any potential vaccine.

    China impeded the U.S. response in other ways, including by withholding accurate information about the outbreak. Beijing had a long track record of downplaying illnesses that emerged within its borders, an impulse that U.S. officials attribute to a desire by the country’s leaders to avoid embarrassment and accountability with China’s 1.3 billion people and other countries that find themselves in the pathogen’s path.

    China stuck to this costly script in the case of the coronavirus, reporting Jan. 14 that it had seen “no clear evidence of human-to-human transmission.” U.S. officials treated the claim with skepticism that intensified when the first case surfaced outside China with a reported infection in Thailand…

    A week earlier, senior officials at HHS had begun convening an intra-agency task force including Redfield, Azar and Anthony S. Fauci, director of the National Institute of Allergy and Infectious Diseases. The following week, there were also scattered meetings at the White House with officials from the National Security Council and State Department, focused mainly on when and whether to bring back government employees in China.

    U.S. officials began taking preliminary steps to counter a potential outbreak. By mid-January, Robert Kadlec, an Air Force officer and physician who serves as assistant secretary for preparedness and response at HHS, had instructed subordinates to draw up contingency plans for enforcing the Defense Production Act, a measure that enables the government to compel private companies to produce equipment or devices critical to the country’s security. Aides were bitterly divided over whether to implement the act, and nothing happened for many weeks…

    Despite the flurry of activity at lower levels of his administration, Trump was not substantially briefed by health officials about the coronavirus until Jan.18, when, while spending the weekend at Mar-a-Lago, he took a call from Azar.

    Even before the heath secretary could get a word in about the virus, Trump cut him off and began criticizing Azar for his handling of an aborted federal ban on vaping products, a matter that vexed the president…

    But the secretary, who had a strained relationship with Trump and many others in the administration, assured the president that those responsible were working on and monitoring the issue. Azar told several associates that the president believed he was “alarmist” and Azar struggled to get Trump’s attention to focus on the issue, even asking one confidant for advice.

    Within days, there were new causes for alarm…

    On Jan. 21, a Seattle man who had recently traveled to Wuhan tested positive for the coronavirus, becoming the first known infection on U.S. soil. Then, two days later, Chinese authorities took the drastic step of shutting down Wuhan, turning the teeming metropolis into a ghost city of empty highways and shuttered skyscrapers, with millions of people marooned in their homes.

    “That was like, whoa!,” said a senior U.S. official involved in White House meetings on the crisis. “That was when the Richter scale hit 8.”

    It was also when U.S. officials began to confront the failings of their own efforts to respond.

    Azar, who had served in senior positions at HHS through crises including the 9/11 terrorist attacks and the outbreak of Bird Flu in 2005, was intimately familiar with the playbook for crisis management.

    He instructed subordinates to move rapidly to establish a nationwide surveillance system to track the spread of the coronavirus — a stepped-up version of what the CDC does every year to monitor new strains of the ordinary flu.

    But doing so would require assets that would elude U.S. officials for months — a diagnostic test that could accurately identify those infected with the new virus and be produced on a mass scale for rapid deployment across the United States, and money to implement the system.

    Azar’s team also hit another obstacle. The Chinese were still refusing to share the viral samples they had collected and were using to develop their own tests. In frustration, U.S. officials looked for other possible routes…

    But in other ways, the situation was already spinning out of control, with multiplying cases in Seattle, intransigence by the Chinese, mounting questions from the public, and nothing in place to stop infected travelers from arriving from abroad.

    Trump was out of the country for this critical stretch, taking part in the annual global economic forum in Davos, Switzerland. He was accompanied by a contingent of top officials including national security adviser Robert O’Brien, who took an anxious trans-Atlantic call from Azar.

    Azar told O’Brien that it was “mayhem” at the White House, with HHS officials being pressed to provide nearly identical briefings to three audiences on the same day.

    Azar urged O’Brien to have the NSC assert control over a matter with potential implications for air travel, immigration authorities, the State Department and the Pentagon. O’Brien seemed to grasp the urgency, and put his deputy, Matthew Pottinger, who had worked in China as a journalist for the Wall Street Journal, in charge of coordinating the still-nascent U.S. response.

    But the rising anxiety within the administration appeared not to register with the president. On Jan. 22, Trump received his first question about the coronavirus in an interview on CNBC while in Davos. Asked whether he was worried about a potential pandemic, Trump said, “No. Not at all. And we have it totally under control. It’s one person coming in from China. . . . It’s going to be just fine.”

    […]

    Trump has, with some justification, pointed to the China-related restriction as evidence that he had responded aggressively and early to the outbreak. It was among the few intervention options throughout the crisis that played to the instincts of the president, who often seems fixated on erecting borders and keeping foreigners out of the country.

    But by that point, 300,000 people had come into the United States from China over the previous month. There were only 7,818 confirmed cases around the world at the end of January, according to figures released by the World Health Organization — but it is now clear that the virus was spreading uncontrollably.

    Pottinger was by then pushing for another travel ban, this time restricting the flow of travelers from Italy and other nations in the European Union that were rapidly emerging as major new nodes of the outbreak. Pottinger’s proposal was endorsed by key health-care officials, including Fauci, who argued that it was critical to close off any path the virus might take into the country.

    This time, the plan met with resistance from Treasury Secretary Steven Mnuchin and others who worried about the impact on the U.S. economy. It was an early sign of tension in an area that would split the administration, pitting those who prioritized public health against those determined to avoid any disruption in an election year to the run of expansion and employment growth.

    Those backing the economy prevailed with the president. And it was more than a month before the administration issued a belated and confusing ban on flights into the United States from Europe. Hundreds of thousands of people crossed the Atlantic during that interval…

    A national stockpile of N95 protective masks, gowns, gloves and other supplies was already woefully inadequate after years of underfunding. The prospects for replenishing that store were suddenly threatened by the unfolding crisis in China, which disrupted offshore supply chains.

    Much of the manufacturing of such equipment had long since migrated to China, where factories were now shuttered because workers were on order to stay in their households. At the same time, China was buying up masks and other gear to gird for its own coronavirus outbreak, driving up costs and monopolizing supplies.

    In late January and early February, leaders at HHS sent two letters to the White House Office of Management and Budget asking to use its transfer authority to shift $136 million of department funds into pools that could be tapped for combating the coronavirus. Azar and his aides also began raising the need for a multibillion-dollar supplemental budget request to send to Congress.

    Yet White House budget hawks argued that appropriating too much money at once when there were only a few U.S. cases would be viewed as alarmist.

    Joe Grogan, head of the Domestic Policy Council, clashed with health officials over preparedness. He mistrusted how the money would be used and questioned how health officials had used previous preparedness funds…

    But again, delays proved costly. The disputes meant that the United States missed a narrow window to stockpile ventilators, masks and other protective gear before the administration was bidding against many other desperate nations, and state officials fed up with federal failures began scouring for supplies themselves.

    In late March, the administration ordered 10,000 ventilators — far short of what public health officials and governors said was needed. And many will not arrive until the summer or fall, when models expect the pandemic to be receding…

    Although viruses travel unseen, public health officials have developed elaborate ways of mapping and tracking their movements. Stemming an outbreak or slowing a pandemic in many ways comes down to the ability to quickly divide the population into those who are infected and those who are not.

    Doing so, however, hinges on having an accurate test to diagnose patients and deploy it rapidly to labs across the country. The time it took to accomplish that in the United States may have been more costly to American efforts than any other failing.

    “If you had the testing, you could say, ‘Oh my god, there’s circulating virus in Seattle, let’s jump on it. There’s circulating virus in Chicago, let’s jump on it,’ ” said a senior administration official involved in battling the outbreak. “We didn’t have that visibility.”

    The first setback came when China refused to share samples of the virus, depriving U.S. researchers of supplies to bombard with drugs and therapies in a search for ways to defeat it. But even when samples had been procured, the U.S. effort was hampered by systemic problems and institutional hubris.

    Among the costliest errors was a misplaced assessment by top health officials that the outbreak would probably be limited in scale inside the United States — as had been the case with every other infection for decades — and that the CDC could be trusted on its own to develop a coronavirus diagnostic test.

    The CDC, launched in the 1940s to contain an outbreak of malaria in the southern United States, had taken the lead on the development of diagnostic tests in major outbreaks including Ebola, Zika and H1N1. But the CDC was not built to mass-produce tests.

    The CDC’s success had fostered an institutional arrogance, a sense that even in the face of a potential crisis there was no pressing need to involve private labs, academic institutions, hospitals and global health organizations also capable of developing tests.

    Yet some were concerned that the CDC test would not be enough. Stephen Hahn, the FDA commissioner, sought authority in early February to begin calling private diagnostic and pharmaceutical companies to enlist their help.

    But when senior FDA officials consulted leaders at HHS, Hahn, who had led the agency for about two months, was told to stand down. There were concerns about him personally contacting companies regulated by his agency.

    At that point, Azar, the HHS secretary, seemed committed to a plan he was pursuing that would keep his agency at the center of the response effort: securing a test from the CDC and then building a national coronavirus surveillance system by relying on an existing network of labs used to track the ordinary flu.

    In task force meetings, Azar and Redfield pushed for $100 million to fund the plan, but were shot down because of the cost, according to a document outlining the testing strategy obtained by The Washington Post…

    On Feb. 6, when the World Health Organization reported that it was shipping 250,000 test kits to labs around the world, the CDC began distributing 90 kits to a smattering of state-run health labs.

    Almost immediately, the state facilities encountered problems. The results were inconclusive in trial runs at more than half the labs, meaning they couldn’t be relied upon to diagnose actual patients. The CDC issued a stopgap measure, instructing labs to send tests to its headquarters in Atlanta, a practice that would delay results for days.

    The scarcity of effective tests led officials to impose constraints on when and how to use them, and delayed surveillance testing. Initial guidelines were so restrictive that states were discouraged from testing patients exhibiting symptoms unless they had traveled to China and come into contact with a confirmed case, when the pathogen had by that point almost certainly spread more broadly into the general population.

    The limits left top officials largely blind to the true dimensions of the outbreak.

    In a meeting in the Situation Room in mid-February, Fauci and Redfield told White House officials that there was no evidence yet of worrisome person-to-person transmission in the United States. In hindsight, it appears almost certain that the virus was taking hold in communities at that point. But even the country’s top experts had little meaningful data about the domestic dimensions of the threat. Fauci later conceded that as they learned more their views changed.

    At the same time the president’s subordinates were growing increasingly alarmed, Trump continued to exhibit little concern. On Feb. 10, he held a political rally in New Hampshire attended by thousands where he declared that “by April, you know, in theory, when it gets a little warmer, it miraculously goes away.”

    The New Hampshire rally was one of eight that Trump held after he had been told by Azar about the coronavirus, a period when he also went to his golf courses six times

    On Feb. 29, a Washington state man became the first American to die of a coronavirus infection. That same day, the FDA released guidance, signaling that private labs were free to proceed in developing their own diagnostics.

    Another four-week stretch had been squandered…

    One week later, on March 6, Trump toured the facilities at the CDC wearing a red “Keep America Great” hat. He boasted that the CDC tests were nearly perfect and that “anybody who wants a test will get a test,” a promise that nearly a month later remains unmet.

    He also professed to have a keen medical mind. “I like this stuff. I really get it,” he said. “People here are surprised that I understand it. Every one of these doctors said, ‘How do you know so much about this?’ ”

    In reality, many of the failures to stem the coronavirus outbreak in the United States were either a result of, or exacerbated by, his leadership.

    For weeks, he had barely uttered a word about the crisis that didn’t downplay its severity or propagate demonstrably false information. He dismissed the warnings of intelligence officials and top public health officials in his administration.

    At times, he voiced far more authentic concern about the trajectory of the stock market than the spread of the virus in the United States, railing at the chairman of the Federal Reserve and others with an intensity that he never seemed to exhibit about the possible human toll of the outbreak.

    In March, as state after state imposed sweeping new restrictions on their citizens’ daily lives to protect them — triggering severe shudders in the economy — Trump second-guessed the lockdowns…

    Two days later, Trump finally ordered the halt to incoming travel from Europe that his deputy national security adviser had been advocating for weeks. But Trump botched the Oval Office announcement so badly that White House officials spent days trying to correct erroneous statements that triggered a stampede by U.S. citizens overseas to get home…

    Trump spent many weeks shuffling responsibility for leading his administration’s response to the crisis, putting Azar in charge of the task force at first, relying on Pottinger, the deputy national security adviser, for brief periods, before finally putting Vice President Pence in the role toward the end of February.

    Other officials have emerged during the crisis to help right the United States’ course, and at times the statements of the president. But even as Fauci, Azar and others sought to assert themselves, Trump was behind the scenes turning to others with no credentials, experience or discernible insight in navigating a pandemic.

    Foremost among them was his adviser and son-in-law, Jared Kushner. A team reporting to Kushner commandeered space on the seventh floor of the HHS building to pursue a series of inchoate initiatives.

    One plan involved having Google create a website to direct those with symptoms to testing facilities that were supposed to spring up in Walmart parking lots across the country, but which never materialized. Another centered an idea advanced by Oracle Chairman Larry Ellison to use software to monitor the unproven use of anti-malaria drugs against the coronavirus pathogen.

    So far, the plans have failed to come close to delivering on the promises made when they were touted in White House news conferences. The Kushner initiatives have, however, often interrupted the work of those under immense pressure to manage the U.S. response.

    Current and former officials said that Kadlec, Fauci, Redfield and others have repeatedly had to divert their attentions from core operations to contend with ill-conceived requests from the White House they don’t believe they can ignore. And Azar, who once ran the response, has since been sidelined, with his agency disempowered in decision-making and his performance pilloried by a range of White House officials, including Kushner.If the coronavirus has exposed the country’s misplaced confidence in its ability to handle a crisis, it also has cast harsh light on the limits of Trump’s approach to the presidency — his disdain for facts, science and experience.

    He has survived other challenges to his presidency — including the Russia investigation and impeachment — by fiercely contesting the facts arrayed against him and trying to control the public’s understanding of events with streams of falsehoods.

    The coronavirus may be the first crisis Trump has faced in office where the facts — the thousands of mounting deaths and infections — are so devastatingly evident that they defy these tactics.

    After months of dismissing the severity of the coronavirus, resisting calls for austere measures to contain it, and recasting himself as a wartime president, Trump seemed finally to succumb to the coronavirus reality. In a meeting with a Republican ally in the Oval Office last month, the president said his campaign no longer mattered because his reelection would hinge on his coronavirus response.

    R.I.P. Bill Withers: “Ain’t no Sunshine”

    Bill Withers 1976. By Columbia Records – eBay itemphoto frontphoto back, Public Domain, https://commons.wikimedia.org/w/index.php?curid=22536445

    From The New York Times (Neil Genzlinger):

    Bill Withers, a onetime Navy aircraft mechanic who after teaching himself to play the guitar wrote some of the most memorable and often-covered songs of the 1970s, including “Lean on Me,” “Use Me” and “Ain’t No Sunshine,” died on Monday in Los Angeles. He was 81.

    His death was announced in a statement from his family, which said he died of “heart complications.”

    Mr. Withers, who had an evocative, gritty R&B voice that could embody loss or hope, was in his 30s when he released his first album, “Just as I Am,” in 1971. It included “Ain’t No Sunshine,” a mournful lament (“Ain’t no sunshine when she’s gone/And she’s always gone too long/Anytime she goes away”) that cracked the Billboard Top 10. Other hits followed, perhaps none better known than “Lean on Me,” an anthem of friendship and support that hit No. 1 in 1972 and has been repurposed countless times by a wide variety of artists.

    There were also “Use Me” (1972), “Lovely Day” (1977) and “Just the Two of Us” (1981), among other hits. But after the 1985 album “Watching You Watching Me,” frustrated with the music business, Mr. Withers stopped recording and performing.

    “I wouldn’t know a pop chart from a Pop-Tart,” he told Rolling Stone in 2015, when he was inducted into the Rock & Roll Hall of Fame.

    William Harrison Withers Jr. was born on July 4, 1938, in Slab Fork, W.Va. His father worked in the coal mines.

    At 17, eager to avoid a coal-mine career himself, Mr. Withers joined the Navy.

    How #coronavirus threatens the seasonal farmworkers at the heart of the American food supply — The Conversation #COVID19


    A farmworker picks lemons at an orchard in Mesa, California.
    Brent Stirton/Getty Images

    Michael Haedicke, Drake University

    Many Americans may find bare grocery store shelves the most worrying sign of the impact of the COVID-19 pandemic on their food system.

    But, for the most part, shortages of shelf-stable items like pasta, canned beans and peanut butter are temporary because the U.S. continues to produce enough food to meet demand – even if it sometimes takes a day or two to catch up.

    To keep up that pace, the food system depends on several million seasonal agricultural workers, many of whom are undocumented immigrants from Mexico and other countries. These laborers pick grapes in California, tend dairy cows in Wisconsin and rake blueberries in Maine.

    As a sociologist who studies agricultural issues, including farm labor, I believe that these workers face particular risks during the current pandemic that, if unaddressed, threaten keeping those grocery store shelves well stocked.

    Essential labor

    It is difficult to accurately count the number of hired agricultural laborers in the United States, but official sources place the number at
    1 million to 2.7 million people, depending on the time of year.

    Most of these workers are employed seasonally to perform the hard manual labor of cultivating and harvesting crops. One-half to three-quarters of them were born outside of the United States, with the majority holding Mexican citizenship.

    The H-2A visa program authorizes noncitizen agricultural laborers to work in the United States. This program allows farmers to recruit workers for seasonal agricultural jobs, provided the workers return home within 10 months.

    But the H-2A program doesn’t cover enough workers to meet the needs of the food system. In 2018, only 243,000 visas were issued under the program – far less than the total number of workers needed to power the farm economy.

    Government research suggests that approximately half of the remaining workers on U.S. farms are in the United States without legal authorization. These workers often live in the U.S. year-round, choosing to be in legal limbo rather than risk crossing an increasingly policed border. Some travel from state to state, following the harvest cycle of crops.

    These farmworkers play an essential role in U.S. agriculture. They pick fresh fruits and vegetables, which are often difficult or impossible to harvest mechanically. They milk cows on dairy farms. In my home state of Iowa, they detassel the hybrid corn varieties – a form of pollination control – that farmers rely on.

    Remove these workers, in other words, and large sectors of the American food system would grind to a halt.

    Dangerous conditions

    Yet there are several factors that put them at higher risk during the pandemic.

    For example, social isolation is almost impossible for farmworkers, who often live and work in close proximity to one another.

    Those in the H-2A program typically live in on-site, dormitory-style housing, with up to 10 people sharing sleeping quarters and restroom facilities.

    The mostly undocumented workers not covered by H-2A visas frequently work for labor contractors, who arrange for their transportation to work sites in shared vans or trucks.

    And once on the job, workers interact closely to harvest crops at a rapid pace.

    This near-constant physical proximity to one another can facilitate the rapid transmission of the coronavirus.

    Seriously susceptible

    The nature of their work also makes farmworkers especially susceptible to serious coronavirus infections.

    Although COVID-19 tends to be most severe in the elderly and people with underlying health conditions, farm laborers face working conditions that may elevate the risk for severe disease.

    Exposure to dangerous pesticides is not unusual, and agricultural workers must also contend with lung irritants from dust, pollen and crops. This can trigger asthma attacks in farmworkers and their children and contribute to other respiratory disorders. Heath officials have found that these conditions contribute to serious coronavirus infections.

    Moreover, farmworkers face a number of barriers to accessing medical care, ranging from linguistic and cultural differences to lack of reliable transportation to the limited number of medical facilities in many rural communities.

    These barriers are especially high for the many undocumented farmworkers, who are not eligible for insurance coverage through the Affordable Care Act, which does cover workers on H-2A visas.

    They may also be reluctant to seek medical care, not wanting to draw attention to themselves in a political climate in which immigration laws are strictly enforced. And farmworkers aren’t typically granted sick leave.

    Finally, the labor contractors who employ undocumented workers generally pay only for work that is completed. This means that a day at the doctor’s office is a day without pay – no small sacrifice for a worker making less than $18,000 a year.

    Impact on the food supply

    But what would an outbreak of COVID-19 among farmworkers mean for the food system?

    Fortunately, the risk of direct transmission of the coronavirus passing from farmworkers to consumers through food products is low.

    However, widespread infections among farmworkers could make it difficult for farmers to harvest crops. Even before the pandemic, farmers in many agricultural areas were already struggling with labor shortages.

    The coronavirus could make this problem worse, potentially causing the loss of crops that cannot be harvested in time. Demand for farmworkers peaks in the summer, so this problem is only a few months away.

    Another concern is that fewer workers, fearful of the coronavirus, will apply for H-2A visas to work on U.S. farms, instead seeking work in their home countries. Farmers in hard-hit Italy are already grappling with a similar issue. And on the other side of this issue, the suspension of visa services at U.S. embassies and consulates may restrict the number of H-2A visas given out.

    Eventually, consumers could begin to see the impact of any labor shortages in the form of higher prices or shortages of products ranging from strawberries and lettuce to meat and dairy.

    There’s no easy solution, but a good start would be ensuring farmworkers are able to follow effective social distancing guidelines, are wearing protective gloves and masks, and are able to get the medical care they need without fear of lost wages or deportation.

    Americans depend on these laborers to continue putting food on their tables during this crisis. A little support would go a long way.

    [Get facts about coronavirus and the latest research. Sign up for The Conversation’s newsletter.]The Conversation

    Michael Haedicke, Associate Professor of Sociology, Drake University

    This article is republished from The Conversation under a Creative Commons license. Read the original article.

    Trump’s @EPA halts environmental law enforcement during #coronavirus pandemic — @HighCountryNews #COVID19

    The air pollution that industrial plants will not have to monitor damages the respiratory system, which is especially dangerous for already at-risk populations who may also become infected with COVID-19, which attacks the lungs. Photo credit: Ryan Adams via The High Country News

    From The High Country News [March 31, 2020] (Oliver Milman and Emily Holden):

    The decision has caused an uproar among former agency officials.

    This story was originally published by the the Guardian and is reproduced here as part of the Climate Desk collaboration.

    The United States Environmental Protection Agency (EPA) has suspended its enforcement of environmental laws during the ongoing coronavirus outbreak, signaling to companies they will not face any sanction for polluting the air or water of Americans.

    In an extraordinary move that has stunned former EPA officials, the Trump administration said it will not expect compliance with the routine monitoring and reporting of pollution and won’t pursue penalties for breaking these rules.

    Polluters will be able to ignore environmental laws as long as they can claim in some way these violations were caused by the Covid-19 pandemic. In the event of an imminent threat to public health, the EPA will defer to the states and “consider the circumstances” over whether it should intervene.

    There is no end date set for this dropping of enforcement.

    Andrew Wheeler, administrator of the EPA, said that coronavirus had made it difficult for businesses to protect workers and the public while adhering to clean air and water rules.

    “This temporary policy is designed to provide enforcement discretion under the current, extraordinary conditions, while ensuring facility operations continue to protect human health and the environment,” Wheeler said.

    The new stance has caused uproar among former EPA officials and environmental groups who warn that the sweeping will pose a further risk to public health amid the pandemic.

    “EPA should never relinquish its right and its obligation to act immediately and decisively when there is threat to public health, no matter what the reason is,” said Cynthia Giles, who was head of EPA enforcement during the Obama administration.

    “I am not aware of any instance when EPA ever relinquished this fundamental authority as it does in this memo. This memo amounts to a nationwide moratorium on enforcing the nation’s environmental laws and is an abdication of EPA’s responsibility to protect the public.”

    A letter sent to the EPA by Giles and a number of other environmental advocates states that while it may be “reasonable in limited circumstances” to relax certain enforcement during the crisis, the blanket waiver of environmental requirements poses a danger to the American public.

    There is particular concern over air pollution emitted by industrial facilities, which are predominantly located in communities with large numbers of low-income people and people of color. Covid-19 attacks the respiratory system, with its spread causing states to scramble for more ventilators to prevent thousands of infected people from dying.

    The air pollution that industrial plants will not have to monitor damages the respiratory system, which is especially dangerous for already at-risk populations who may also become infected with Covid-19, which attacks the lungs.

    “Excusing the potential release of excess toxic air pollutants and other pollution that exacerbates asthma, breathing difficulty and cardiovascular problems in the midst of a pandemic that can cause respiratory failure is irresponsible from a public health perspective,” the letter states.

    “This is not about reporting and paperwork,” said Eric Schaeffer, executive director of the Environmental Integrity Project.

    “If you’re flying blind because you’re not monitoring for pollution and the public’s flying blind because you’re not reporting it, a lot of problems that come to light when you do those things are going to stay hidden,” Schaeffer said.

    In one example, oil refineries will not be compelled to report on and reduce their carcinogenic benzene emissions. Ten refineries, most of them in Texas, have already been exceeding limits.

    The relaxation of environmental laws follows lobbying from the American Petroleum Institute, an oil and gas industry group, which sent the EPA a letter this week calling for the suspension of rules requiring repair of leaky equipment as well as monitoring of pollution.

    The EPA’s move goes even further than this request, although the regulator said it expects businesses will comply with laws “where reasonably practicable” and that it will not tolerate flagrant, intentional breaches of the law.

    However, Michael Brune, executive director of Sierra Club, indicated that the move may be challenged in the courts. “While there may be no limit to the lengths Trump and Wheeler are willing to go for corporate polluters, there is a limit to what the public will allow,” Brune said. “This illegal and reckless action will not go unchecked.”

    Oliver Milman and Emily Holden are environment reporters for Guardian US. Email High Country News at editor@hcn.org.

    #Snowpack news: @Northern_Water directors give preliminary recommendation for a 70% quota

    Click on a thumbnail graphic to view a gallery of snowpack data from the NRCS.

    From The Fort Collins Coloradoan (Miles Blumhardt):

    Colorado’s above-average snowpack for the second consecutive year has created similar reservoir storage excess, which is good news for farmers, city municipalities and residents.

    On Thursday, Northern Water board of directors gave a preliminary recommendation of a 70% water quota, the same as last year when Colorado had robust snowpack.

    The board sets a quota of 50% in November then increases or decreases the water quota as the water season plays out.

    …Tuesday. Snowpack, reservoir storage, stream flows and a projected April precipitation forecast are all indicating ample water, which prompted the board to make its initial recommendation. A final decision will be made at next week’s board meeting.

    “We anticipate this summer that farmers will have the water supply they need for the summer growing season,” said Jeff Stahla, Northern Water spokesperson. “And the same will be true for businesses and residents throughout the year.”

    That’s not only good news for farmers but recreationists as well. Horsetooth Reservoir is already more than 90% full, and Stahla said he expects an ample water supply at the popular reservoir throughout the boating season…

    How snowpack is faring in each of Colorado’s basins

    As of Tuesday, average snowpack over the eight basins statewide was at 108%, marking the second consecutive year of above-average snowpack. It’s the third time in four years the state’s basins have hit that mark.

    The South Platte River Basin, which includes Fort Collins and Denver, led the state at 118% of average, which is just shy of where the basin was during last year’s big snow year.

    Russ Schumacher, director of the Colorado Climate Center, said the key snowpack station for the Poudre River is at Joe Wright Reservoir. It was at 111% of the median.

    The North Platte River Basin and Yampa/White River Basin each were at 113%; Upper Colorado River Basin was at 111%; Arkansas River Basin and Upper Rio Grande River Basin were at 101%; San Miguel, Dolores, Animas and San Juan River Basin was at 100% and the Gunnison River Basin was at 98%…

    What to expect in April

    April is the city’s third wettest month with normal precipitation of 2.06 inches, trailing May and June. Average snowfall is 6.2 inches, but Schumacher said April, like March, has shown it can bring snowstorms producing 12 inches or more of snow.

    Four of the city’s top 10 snowstorms have occurred in April, with all dumping more than 20 inches on the city.

    Westwide SNOTEL April 3, 2020 via the NRCS.

    @ColoradoStateU researchers predicting active 2020 Atlantic #hurricane season

    Hurricane Harvey near the coast of Texas at peak intensity late on August 25, 2017. By ABI image captured by NOAA’s GOES-16 satellite – RAMMB/CIRA SLIDER, Public Domain, https://commons.wikimedia.org/w/index.php?curid=61938876

    Here’s the From Colorado State University (Anne Manning):

    Colorado State University hurricane researchers are predicting an above-average Atlantic hurricane season in 2020, citing the likely absence of El Niño as a primary factor. Tropical and subtropical Atlantic sea surface temperatures are currently warmer than their long-term average values and are consequently also considered a factor favoring an active 2020 Atlantic hurricane season.

    The tropical Pacific currently has warm neutral ENSO (El Niño-Southern Oscillation) conditions; that is, the waters are slightly warmer than normal in the eastern and central tropical Pacific. CSU currently anticipates that these waters are likely to cool relative to their long-term averages over the next several months. Consequently, they do not anticipate El Niño for the peak of the Atlantic hurricane season. El Niño tends to increase upper-level westerly winds across the Caribbean into the tropical Atlantic, tearing apart hurricanes as they try to form.

    The tropical Atlantic is somewhat warmer than normal right now. Warmer-than-normal sea surface temperatures in the tropical Atlantic provide more fuel for tropical cyclone formation and intensification. They are also associated with a more unstable atmosphere as well as moister air, both of which favor organized thunderstorm activity that is necessary for hurricane development.

    16 named storms

    The CSU Tropical Meteorology Project team is predicting 16 named storms during the Atlantic hurricane season, which runs from June 1 to November 30. Of those, researchers expect eight to become hurricanes and four to reach major hurricane strength (Saffir/Simpson category 3-4-5) with sustained winds of 111 miles per hour or greater.

    The team bases its forecasts on a statistical model, as well as two new models that use a combination of statistical information and forecasts from dynamical models from the UK Met Office and the European Centre for Medium-Range Weather Forecasts. These models are built on 25-40 years of historical hurricane seasons and evaluate conditions including: Atlantic sea surface temperatures, sea level pressures, vertical wind shear levels (the change in wind direction and speed with height in the atmosphere), El Niño (warming of waters in the central and eastern tropical Pacific), and other factors.

    So far, the 2020 hurricane season is exhibiting characteristics similar to 1960, 1966, 1980, 1996, and 2008. “1966, 1980, 1996 and 2008 had above-average Atlantic hurricane activity, while 1960 was a near-average hurricane season,” said Phil Klotzbach, research scientist in the Department of Atmospheric Science and lead author of the report.

    The team predicts that 2020 hurricane activity will be about 140 percent of the average season. By comparison, 2019’s hurricane activity was about 120 percent of the average season. The 2019 season was most notable for Hurricane Dorian which devastated the northwestern Bahamas and for Tropical Storm Imelda which caused tremendous flooding in portions of southeast Texas.

    The CSU team will issue forecast updates on June 4, July 7 and August 6.

    This is the 37th year that the CSU hurricane research team has issued an Atlantic basin seasonal hurricane forecast. Recently, the Tropical Meteorology Project team has expanded to include Michael Bell, associate professor in the CSU Department of Atmospheric Science, and Jhordanne Jones, graduate research assistant in the same department. Bill Gray, who originated the seasonal forecasts, launched the report in 1984 and continued to author them until his death in 2016.

    The CSU forecast is intended to provide a best estimate of activity in the Atlantic during the upcoming season – not an exact measure.

    As always, the researchers caution coastal residents to take proper precautions.

    “It takes only one storm near you to make this an active season,” Bell said.

    Landfalling probability included in report

    The report also includes the probability of major hurricanes making landfall:

  • 69 percent for the entire U.S. coastline (average for the last century is 52 percent)
  • 45 percent for the U.S. East Coast including the Florida peninsula (average for the last century is 31 percent)
  • 44 percent for the Gulf Coast from the Florida panhandle westward to Brownsville (average for the last century is 30 percent)
  • 58 percent for the Caribbean (average for the last century is 42 percent)
  • The forecast team also tracks the likelihood of tropical storm-force, hurricane-force and major hurricane-force winds occurring at specific locations along the coastal United States, the Caribbean and Central America through its Landfall Probability website.

    The site provides information for all coastal states as well as 11 regions and 205 individual counties along the U.S. coastline from Brownsville, Texas, to Eastport, Maine. Landfall probabilities for regions and counties are adjusted based on the current climate and its projected effects on the upcoming hurricane season.

    The CSU team updates the site regularly with assistance from the GeoGraphics Laboratory at Bridgewater State University in Massachusetts.

    Funding for this year’s report has been provided by Interstate Restoration, Ironshore Insurance, the Insurance Information Institute and a grant from the G. Unger Vetlesen Foundation.

    Extended range Atlantic Basin hurricane forecast for 2020

    Released April 2, 2020

    Tropical Cyclone Parameters Extended Range
    (1981-2010 Climatological Average Forecast for 2020
    in parentheses)
    Named Storms (12.1)* 16
    Named Storm Days (59.4) 80
    Hurricanes (6.4) 8
    Hurricane Days (24.2) 35
    Major Hurricanes (2.7) 4
    Major Hurricane Days (6.2) 9
    Accumulated Cyclone Energy (106) 150
    Net Tropical Cyclone Activity (116%) 160
    * Numbers in ( ) represent averages based on 1981-2010 data.

    State hurricane probabilities forecast April 2, 2020 via Colorado State University. Click on the image to go to the landfall probabilities website.

    #Groundwater True/False Quiz: @USGS Water #Science School

    Fen soils are made of a rich, organic peat material that take thousands of years to form and require a constant groundwater source to survive. At the Rocky Mountain Fen Research Project, scientists transplanted fen soils from another site to the “receiver” site south of Leadville where they restored a groundwater spring to sustain the transplanted soils. Photo credit: Sarah Tory/Aspen Journalism

    Click here to take the quiz.

    Coronavirus cases are growing exponentially – here’s what that means — The Conversation


    U.S. Army soldiers work to set up a field hospital inside CenturyLink Field Event Center in Seattle.
    AP Photo/Elaine Thompson

    Andrew D. Hwang, College of the Holy Cross

    In the U.S., scientists stress that the number of coronavirus cases has been growing exponentially. In ordinary speech, the term “exponential” usually means “really fast.”

    To mathematicians like myself, and to scientists and public health officials, the term has a precise and subtly different meaning: A quantity is “exponential” if its rate of change at each point is proportional to the current size.

    Let’s explore why the difference matters, and how exponential processes can mislead our perception of risk.

    When an exponential quantity is small, its change is slight; when the quantity is large, the change is rapid. Thanks to exponential growth, epidemics start slowly, then balloon with surprising speed.

    This pattern presents a distinctive challenge. People intuitively underestimate exponential growth. By the time individuals sense their peril and act, the damage has been multiplied many-fold.

    In an epidemic, numerical data and mathematical models are like night-vision goggles, illuminating what cannot be directly perceived.

    Origins of exponential growth

    To a good approximation, viruses spread exponentially in unexposed populations. Each infected individual meets others at random. At each meeting, there is some chance of the virus being transmitted.

    The number of new cases in a one-day period – the rate of increase of infection, in individuals per day – is proportional to the number currently infected.

    Exponential quantities have a characteristic interval over which the quantity doubles. For illustration, consider an epidemic that doubles daily. If one person is infected today, two are infected tomorrow, four the day after tomorrow, eight the day after that, then 16, 32, 64. After one week, 128. Three days after that, 1,024 are infected.

    Let’s flag two items about this example.

    First, the number of new cases tomorrow equals the total number of cases today.

    Second, 10 doublings, here 10 days, gives a thousand-fold increase in cases.

    How many doublings give a million-fold increase? A million is a thousand thousand. It takes 10 doublings for 1,000 to become 1,000,000, 20 days total.

    This percentage growth is constant, one doubling per day. In absolute numbers, however, an initial trickle grows rapidly into an uncontrollable flood.

    Stopping an outbreak early

    In an epidemic, early action saves lives. Conversely, delay in public health response inflates case numbers exponentially.

    The Centers for Disease Control and Prevention and World Health Organization had flagged the coronavirus as a U.S. public health concern by Jan. 21. At that time, there were only a few confirmed U.S. cases. Isolation of the infected and monitoring of their social contacts was technically feasible. Aggressive testing could have better revealed the true number and locations of cases.

    Though testing in the first half of March was mostly confined to individuals needing hospitalization, even those numbers show the coronavirus doubling time in the U.S. was at most two and a half days.

    Under these conditions, each eight-day delay in public health response translates into roughly 10 times as many cases and deaths as immediate action.

    Flattening the curve is another way of saying buying more time.

    Flattening the curve

    An exponential quantity is characterized by its starting value and its doubling time. By waiting until mid-March to act as a nation, the U.S. lost control over the starting value.

    At any stage, however, people can collectively help lengthen the doubling time. Personal hygiene and social distancing effectively reduce viral transmission. Slowing the epidemic “flattens the curve.” The goal is to reduce the maximum number who are hospitalized at any given time and avoid overwhelming the medical system.

    There are at least two civic lessons.

    We citizens must recognize and respect the creeping-to-explosive nature of exponential growth. Epidemics start small and slowly. The CDC is equipped to detect potential outbreaks in early stages, but it needs the backing of government and the public to fulfill its mission.

    Second, we must understand that the public health system undercuts its own public reputation by succeeding. When an epidemic is halted in its early stages, the public seldom knows. The enormous invisible benefits of public health take the form of averted disaster.

    [Get facts about coronavirus and the latest research. Sign up for our newsletter.]The Conversation

    Andrew D. Hwang, Associate Professor of Mathematics, College of the Holy Cross

    This article is republished from The Conversation under a Creative Commons license. Read the original article.

    #Drought news: Below normal precipitation in SE #Colorado over the past week

    Click on a thumbnail graphic to view a gallery of drought data from the US Drought Monitor.

    Click here to go to the US Drought Monitor website. Here’s an excerpt:

    This Week’s Drought Summary

    This U.S. Drought Monitor week saw an active weather pattern impact various parts of the conterminous U.S.—including the western U.S. which continued to experience below-normal temperatures and snow showers in the mountain ranges of the Pacific Northwest (Olympics, Cascades), California (Northern Coast Ranges, Sierra Nevada), and parts of the Intermountain West (Wasatch, central and northern Rockies). In other parts of the Pacific Northwest, including central Oregon and Washington, drought intensified while improvement in drought-related conditions occurred in the Four Corners of northeastern Arizona. Elsewhere, an outbreak of severe weather, including showers and thunderstorms as well as tornadoes, affected parts of the Midwest and South. Along the Gulf Coast, temperatures were well-above normal with numerous single-day high temperature records broken. In Florida, drought conditions expanded across much of the state after another week of unseasonably warm temperatures and continued dryness with numerous cities across the state experiencing record dryness for the month…

    High Plains

    On this week’s map, only minor changes were made in Wyoming where an area of Abnormally Dry (D0) was introduced in response to below-normal snowpack conditions at several NRCS SNOTEL sites in the Wind River Range. Elsewhere, no changes were made on the map. Overall, precipitation for the week was light (generally <1.5” liquid accumulations) with areas of northwestern Kansas, eastern Nebraska, and southeastern South Dakota receiving the greatest accumulations. Average temperatures for the week were mostly above normal (2-to-8 degrees) with greatest positive anomalies observed in northern North Dakota and eastern Kansas while the plains of eastern Colorado and Wyoming were slightly cooler. For the past 30-day period, precipitation was below normal across the Dakotas, eastern Wyoming, southeastern Colorado, and portions of western Kansas, while above-normal precipitation was observed across much of Nebraska, eastern Kansas, and portions of northeastern Colorado…

    West

    On this week’s map, areas of drought expanded in north-central Oregon, south-central Washington, central Nevada, and in the central Sierra Nevada of California. Elsewhere in the region, one-category improvements in areas of Abnormally Dry (D0), Moderate Drought (D1), and Severe Drought (D2) were made in northern Arizona where precipitation has been above normal during the past 30-day period. In California, the California Snow Surveys is reporting a statewide SWE percentage of normal of 54% with a regional breakdown as follows: North 57%, Central 58%, and South 45%. Elsewhere in the West, region-level (2-digit HUC) SWE at the end of the month was as follows: Great Basin 91%, Pacific Northwest 107%, Upper Colorado 108%, Lower Colorado 110%, Missouri 113%, Rio Grande 92%, and Arkansas-White-Red 105%. At a basin level (6-digit HUC), below-normal SWE was observed across several basins in Arizona and New Mexico (Salt 29%, Little Colorado 81%, Upper Gila 29%, Rio Grande-Elephant Butte 75%, Upper Pecos 82%) as well as in central Nevada (Central Nevada Desert Basins 78%, Walker 54%, Carson 76%, Truckee 71%) and Oregon (Southern Oregon Coastal 84%, Deschutes 84%)…

    South

    On this week’s map, drought-affected areas of southern Texas and the Gulf Coast region of Louisiana and Mississippi saw continued deterioration resulting from the lack of rainfall and abnormally high temperatures. During the past week, a number of daily high-temperature records were either tied or broken across the region — including at the New Orleans International Airport that soared to 89 F on March 25. Along the Gulf Coast region of Louisiana and Mississippi, precipitation deficits (ranging from 3-to-6 inches) for the past 30-day period led to expansion of areas of Moderate Drought (D1). In the South Texas Plains and Gulf Coast Region, hot and dry weather this week led to continued expansion of areas of Moderate Drought (D1), Severe Drought (D2), and Extreme Drought (D3). In far southern portions of the state, temperatures reached the high 90s last week. According to the latest USDA Texas Crop Progress and Condition Report, some failed fields (small grains) in South Texas are being reported because of dry conditions while livestock across the state was rated in fair-to-good condition. In Oklahoma, above-normal precipitation during the past 30-day period led to removal of areas of Abnormally Dry (D0 and Moderate Drought (D1) in southwestern Oklahoma…

    Looking Ahead

    The NWS WPC 7-Day Quantitative Precipitation Forecast (QPF) calls for moderate-to-heavy accumulations ranging from 1-to-5 inches across central and eastern portions of Texas and slightly lesser accumulations in southeastern Oklahoma, Arkansas, and northern Mississippi. Across much of the Southeast, the dry pattern is forecasted to continue with the exception of northern portions, which are forecasted for light accumulations (1-to-2 inches). In portions of the northern Plains and western portions of the Midwest, generally light accumulations (<1 inch liquid) are expected. Out West, moderate-to-heavy accumulations (ranging from 1-to-4 inches liquid) are forecasted for northern California while western portions of Oregon and Washington are forecasted to receive less accumulation. Across the Intermountain West, liquid accumulations of generally less than one inch are expected for parts of the central and northern Rockies, Uinta, and Wasatch ranges of Utah while the Southwest is expected to be dry. The CPC 6-10-day Outlook calls for a moderate-to-high probability of above-normal temperatures east of the Rockies while areas west of the Rockies are expected to be below normal. In terms of precipitation, there is a moderate-to-high probability of above-normal levels across California and Nevada while there is a low-to-moderate probability of above-normal precipitation across the remainder of the West with the exception of the areas of Colorado and New Mexico where below normal precipitation is expected. Elsewhere, above-normal precipitation is expected (33% to 50% probabilities) across the eastern half of the conterminous U.S. with the exception of Florida where dry conditions are expected to prevail. In Alaska, the northern two-thirds of the state have a high probability of above-average precipitation while the Aleutians, Southcentral, and Southeast should be below normal.

    US Drought Monitor one week change map ending March 31, 2020.

    And just for grins here’s an early April look at past US Drought Monitor maps.

    This slideshow requires JavaScript.

    With Shoshone hydroelectric plant down 2016 agreement kicks in

    From The Grand Junction Daily Sentinel (Dennis Webb):

    A 2016 agreement is helping protect Colorado River flows downstream of Glenwood Canyon despite ice jams from the Colorado River shutting down the Shoshone Hydropower Plant in the canyon.

    Jim Pokrandt, spokesman for the Colorado River District, a tax-funded agency serving counties within the river basin in western Colorado, said the problem at the plant occurred around March 1. Xcel Energy, the plant’s owner, says it won’t be using Colorado River water at the plant until it is repaired.

    The plant’s operations are watched closely by the water community because it has one of the oldest water rights on the river in western Colorado — a 1902 right to 1,250 cubic feet of water per second.

    That right has limited the ability of Front Range water users with more junior rights to divert Colorado River water. It helps keep water flowing down-river not just to the plant, but further downstream because the plant’s water use is nonconsumptive, benefiting municipal and agricultural water users, recreational river users and the environment.

    However, the river district and regional water users have worried about the potential impacts on the river and water users whenever the aging plant is out of service and not calling for water under its senior right, such as when it requires maintenance.

    To address that concern, reservoir operators including the river district, Denver Water and the U.S. Bureau of Reclamation agreed in 2016 to cooperate to maintain river flows at levels mimicking Shoshone’s normal operation, with certain exceptions.

    Modified reservoir operations to mimic those flows are now in effect, and will remain so until snowmelt runoff causes the river flow to exceed the current outage protocol target of 1,250 cubic feet per second.

    Pokrandt said that among the benefits of protecting flows, more water in the river means lower concentrations of total dissolved solids in the river due to dilution, reducing the need for water treatment by municipal water providers that rely on the river.

    Kirsten Kurath, an attorney who represents the Grand Valley Water Users Association, a party to the 2016 agreement, said a big benefit of the Shoshone flows is maintaining flows in what’s known as the 15-mile reach of the Colorado River in Mesa County. Efforts to protect endangered fish in the river focus in part on maintaining adequate flows in that stretch of the river, upstream of the Gunnison River confluence…

    While Grand Valley irrigators also have senior water rights on the river, Kurath said the Shoshone water smoothes out the river’s flows, making it easier for irrigators to plan and making water diversions more efficient than when flows are lower. “Everybody downstream always benefits as you keep water in the river,” she said.

    The Orchard Mesa Irrigation District and Grand Valley Irrigation Co. are among other parties to the 2016 deal. As of late Monday afternoon, Xcel hasn’t yet said how long the power plant may be out of commission. According to the river district, Xcel has said that the COVID-19 outbreak is complicating repair plans…

    The current outage agreement is in effect for 40 years. The river district says it and its West Slope partners are exploring ways to permanently protect the river flows.

    Colorado AG says state will challenge @EPA’s fuel efficiency rule change — The Grand Junction Daily Sentinel #ActOnClimate #KeepItInTheGround

    Leaf Byers Canyon August 21, 2017.

    From The Grand Junction Daily Sentinel:

    The EPA finalized a new standard requiring vehicle fuel economy to increase by 1.5 percent each year, a lower amount than the 5 percent increase put into place during the Obama administration. The rule change creates a uniform federal standard flouting more strict standards like those implemented by California.

    [Phil]Weiser said in a statement the regulatory rollback “rejects science” and “will harm public health and air quality.”

    “The EPA’s misguided rollback is at odds with the agency’s own science and data, which show that the weaker fuel economy standards will increase air pollution, cost consumers more at the pump, and fail to make the nation’s roads safer,” Weiser said.

    Last year, Colorado followed California’s lead in adopting a strict zero emission vehicle (ZEV) standard, which requires at least 5 percent of all vehicles sold in Colorado to be ZEVs by 2023.

    Weiser said the EPA’s rule change “threatens to thwart Colorado’s ZEV program, which was implemented to improve air quality, reduce harmful ozone pollution, decrease fuel costs, and increase choices that Colorado customers have when purchasing an electric vehicle.”