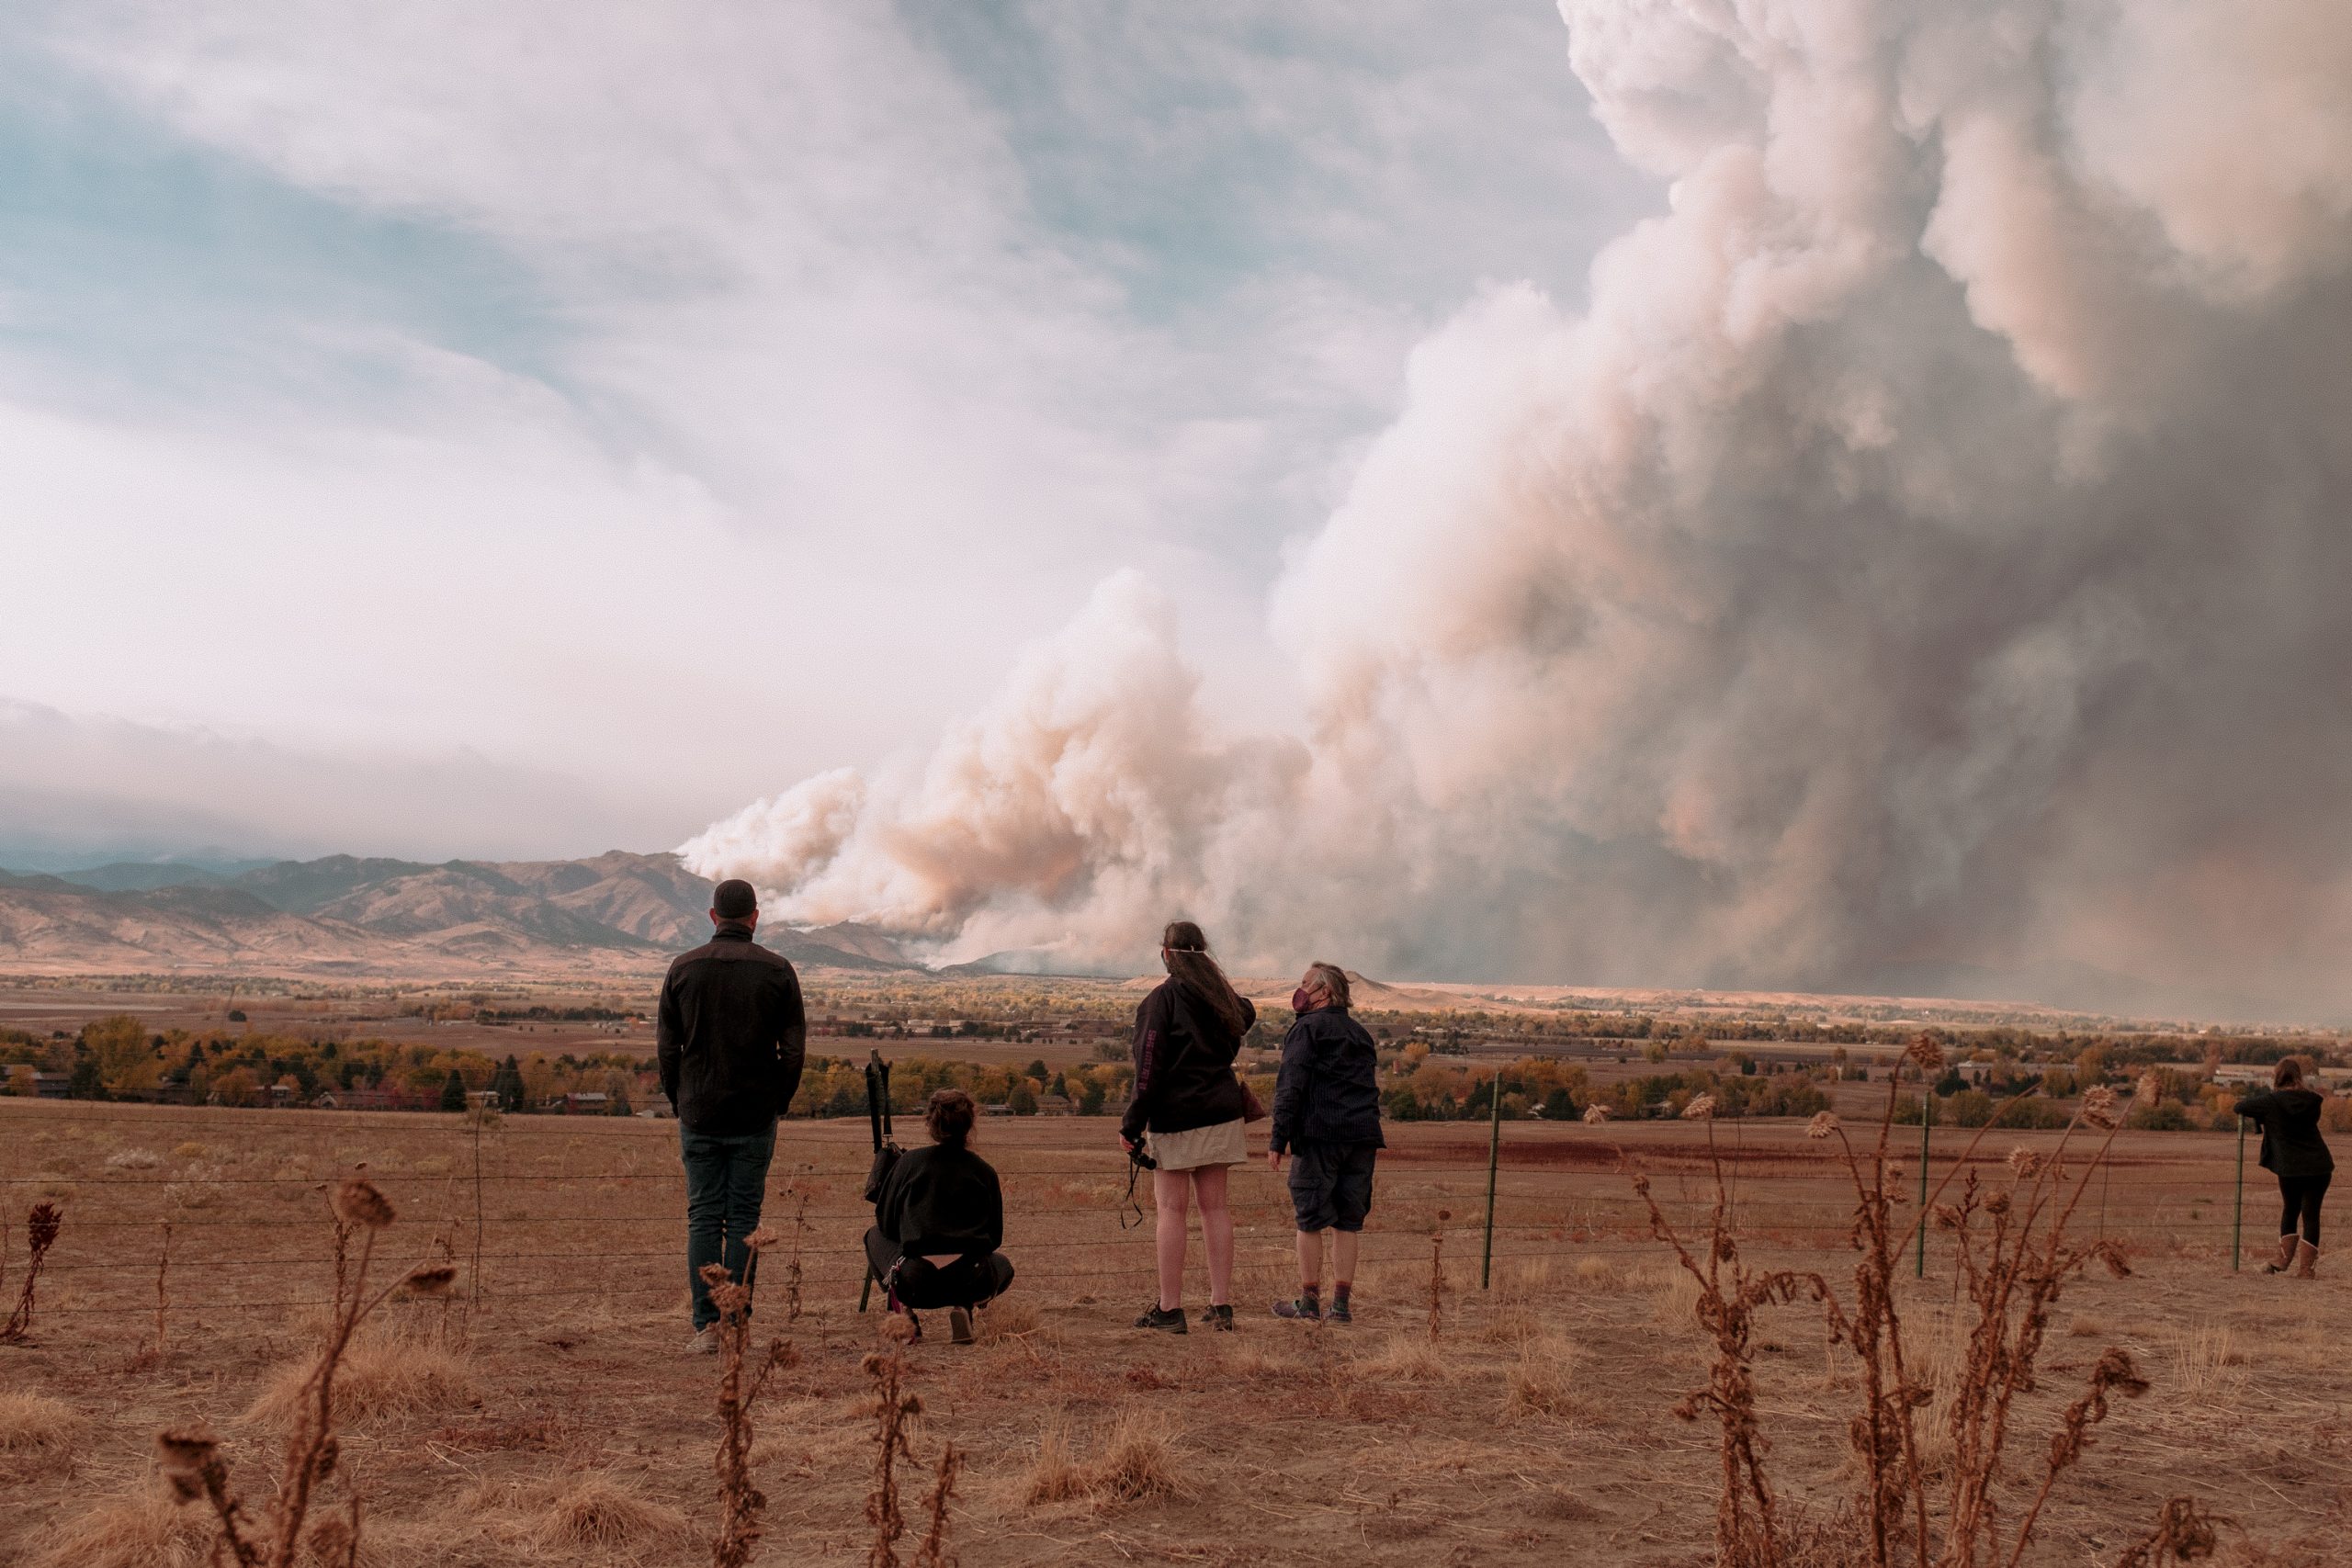
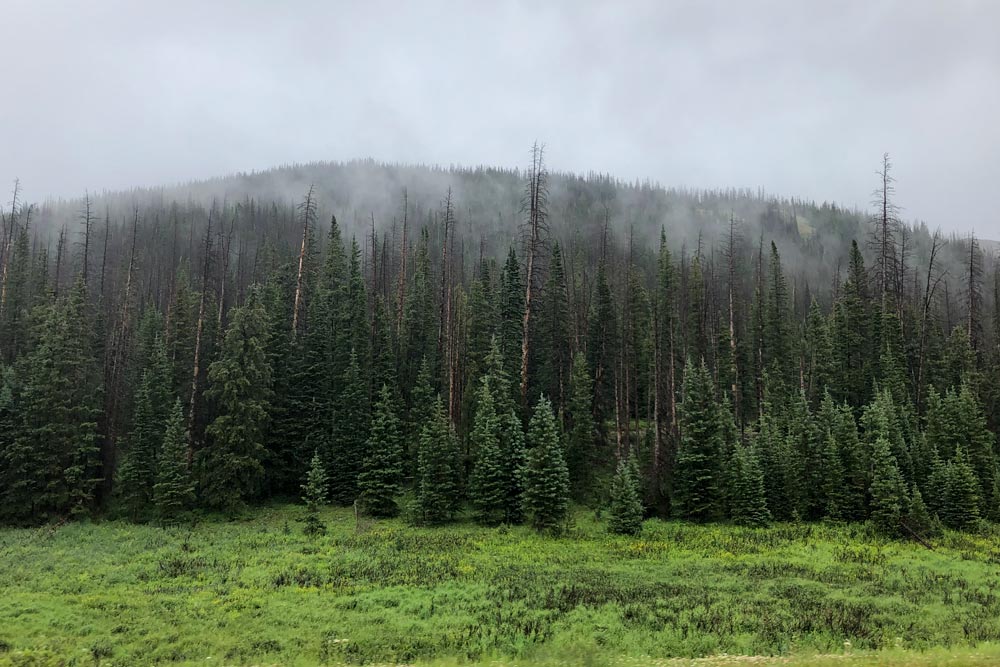
The Cameron Peak fire, a few miles west of Fort Collins, Colorado, has engulfed over 200,000 acres and it’s still growing. It has now become the biggest wildlife in Colorado history.
What’s more astounding is that the Cameron Peak fire is the second fire in 2020 to hold the title of largest wildfire in Colorado history. The Pine Gulch fire near Grand Junction briefly held that title, but for only 7 weeks, having burned 139,000 acres in late summer.
Looking at this in a vacuum, you might think of it as mere coincidence. But zooming out, you need only look two states away in California to find evidence of more unprecedented fires. Six of the 7 largest wildfires in California history have all burned in 2020, and the largest, the August Complex fire, became the state’s first ever gigafire — meaning it burned over 1 million acres, scorching more acreage than the state of Rhode Island.
The Cameron Peak fire soon after it started on Aug. 13, 2020. By Sept. 11, the fire had grown to more than 102,000 acres (now >200,000 acres) and was not expected to be considered out until Oct. 31. Photo credit: InciWeb via The Colorado Sun
This year Mother Nature has supplied us with smoking-gun evidence to prove what climate scientists have been warning about for decades. The scorched-earth impacts of climate change have arrived…
“Our 2020 wildfire season is showing us that climate change is here and now in Colorado. Warming is setting the stage for a lot of burning across an extended fire season,” says Dr. Jennifer Balch, professor of fire ecology and director of Earth Lab at the University of Colorado Boulder.
According to Balch, Colorado in the 2010s saw a tripling of average burned area in the month of October, compared to the prior three decades of the 1980s, 1990s and 2000s. “We do see fall fire events in Colorado, related to fast, downslope winds. But to see multiple events start this late, in the middle of October, is very, very rare.”
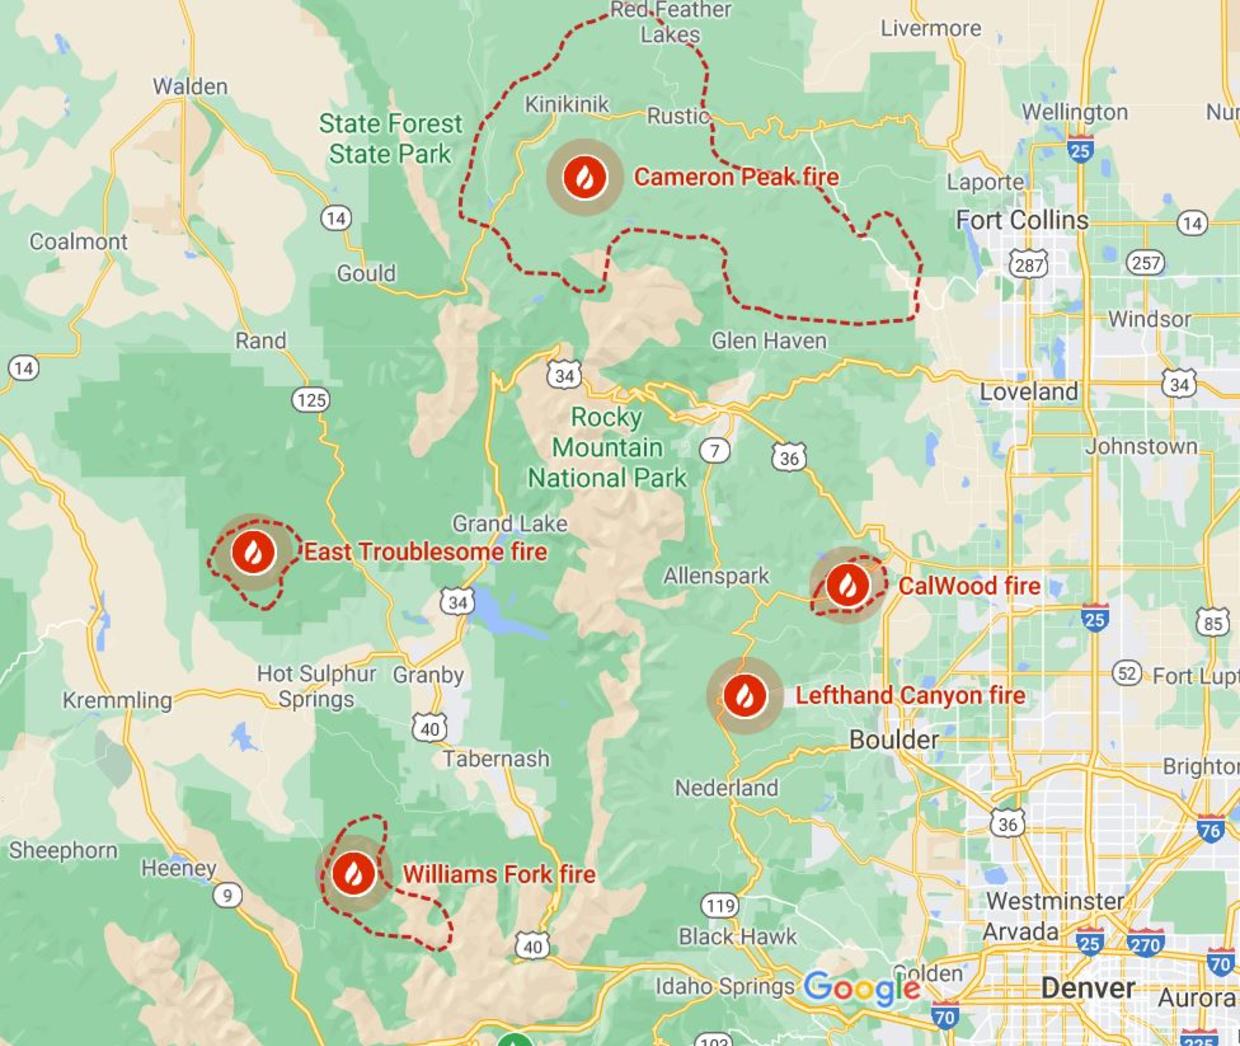
Perhaps it’s rare, but as of Monday 10 notable fires are burning across the state. The Cameron Peak fire’s eastern extent is just 5 miles from Fort Collins and Loveland.
Locations of Colorado wildfires as seen October 19, 2020. Credit: GOOGLE MAPS
Two of the most concerning new fires are burning in Boulder County and forcing evacuations. The CalWood fire — the largest fire ever in Boulder County — and the Lefthand fire have both exhibited extreme fire behavior, shocking even seasoned climate scientists.
“Even as a scientist studying extreme weather & wildfire in a warming climate, I was shocked by how fast #CalwoodFire roared down the Colorado Front Range foothills,” Daniel Swain, a climate scientist at UCLA, wrote on Twitter, posting video of a swirling vortex of smoke.
Even as a scientist studying extreme weather & wildfire in a warming climate, I was shocked by how fast #CalwoodFire roared down the Colorado Front Range foothills this afternoon. This is footage of one of several large fire vortices I observed while leaving area. #COwx@nplareaupic.twitter.com/9yJRdNo14X
While you can’t completely separate short-term variability from longer-term climate trends, as they are intertwined, a region’s most recent weather conditions are a big factor in how extreme a fire season is.
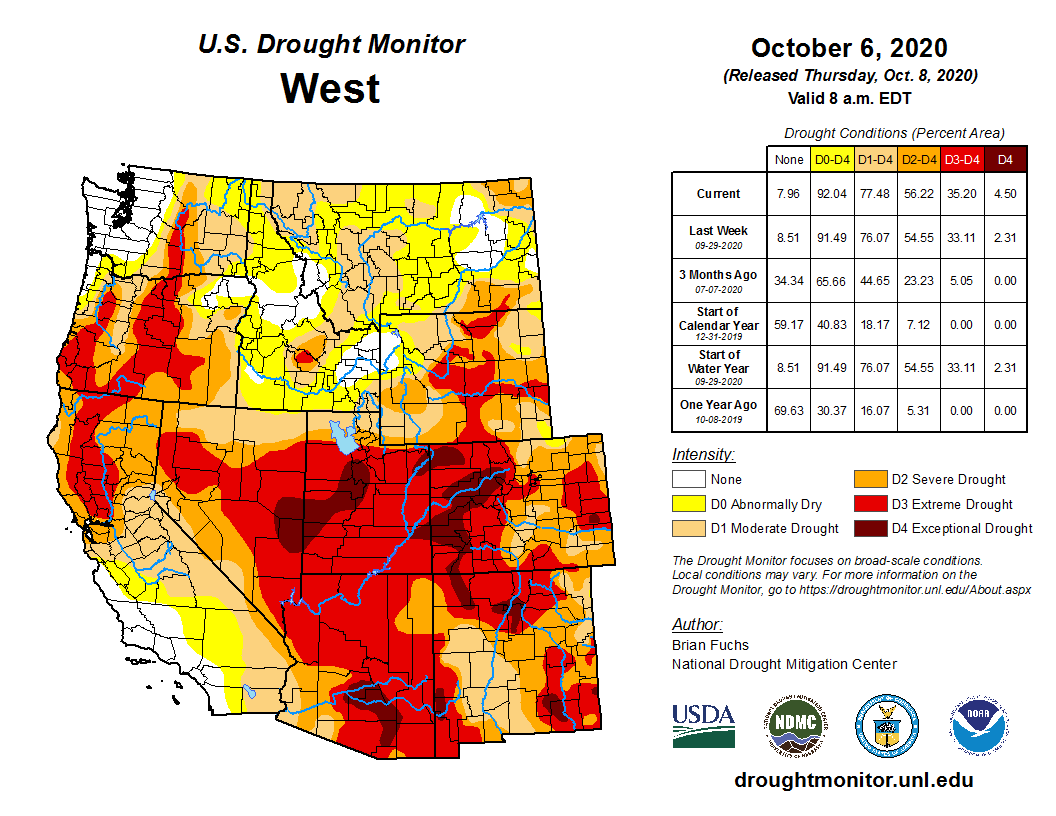
According to the Colorado Climate Center at Colorado State University, for the first time since 2013 all of Colorado is experiencing drought. This is no run-of-the-mill dry spell — 97% of the state is in the “exceptional,” “extreme,” or “severe” drought categories. And it’s not just Colorado; much of the Southwest is bone dry.
West Drought Monitor October 13, 2020.
Brad Udall, the senior water and climate research scientist at the Colorado Water Institute at Colorado State University, said 2020 started out promising.
“This year was shocking because we had a decent winter and on April 1 we had 100% of snowpack,” he said. But things quickly turned disappointing. “With 100% of snowpack, you’d expect a decent runoff year. Instead, we ended up with 52% of what is normal.”
[…]
Udall says much of the poor runoff is a result of increased evaporation due to a very warm and dry spring and summer. Over the past few months there have been a number of significant heat waves in the West, two of which were of historic proportions. The extra added heat energy vaporizes spring snow cover, and the lack of new moisture provides nothing to buffer the loss.
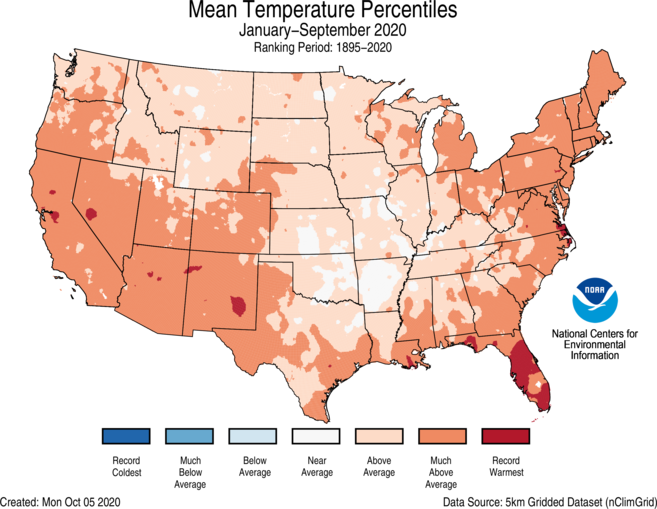
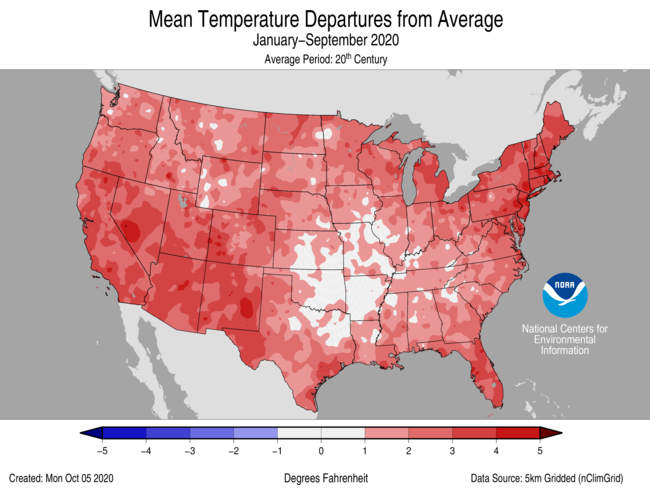
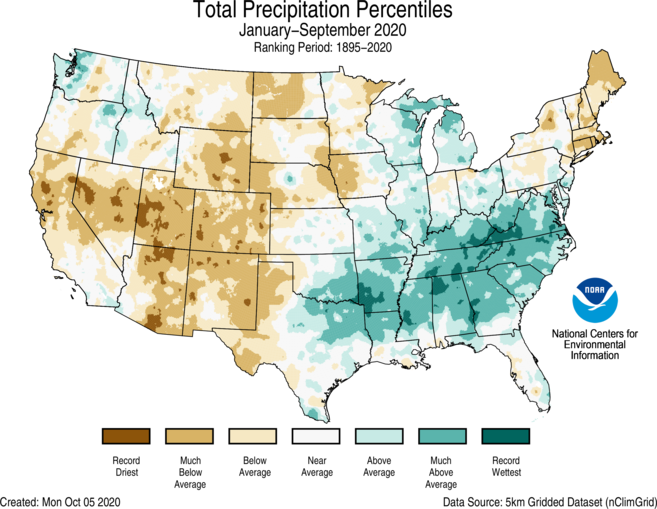
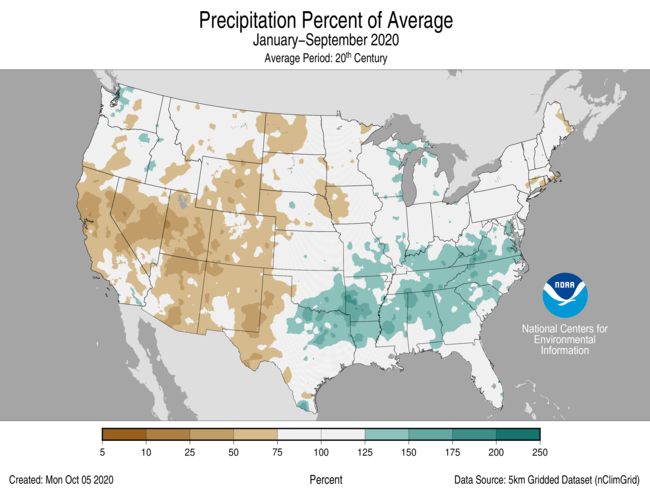
In the Southwestern states, June through August rainfall was the lowest since 1895 and temperatures were the highest since 1895, according to NOAA. In Colorado so far, this year is the eighth warmest and second driest on record. Denver has experienced more 90-degree days than any year in its history.
“We’ve had next to no moisture over the last 3 months which is highly unusual. The Arizona monsoon often carries moisture to Colorado but this year it was a complete bust,” said Udall…
Udall says that while most of the droughts of the 20th century were caused by lack of rainfall, today’s droughts are mainly caused by increased evaporation due to warmer weather. But drought is usually referred to as a short-term issue, and what’s happening in Colorado is not temporary. He prefers the term aridification, because climate change, due to the burning of fossil fuels and the buildup of a heat-trapping carbon pollution blanket overhead, is systematically drying out the landscape.
To be sure, climate is not the only factor driving the explosion in burned area. Excess fuel buildup due to increased fire suppression in recent decades as well as increasing ignitions due to more human activity in forested areas do play a role. But experts say the marked increase can not be explained without longer-term warming and drying.
Climate change and “the recipe for large forest fires”
If you look back over the past century, parts of Colorado have been warming faster than anywhere else in the nation. According to data from NOAA and an analysis by the Washington Post, western and northern Colorado are warming at twice the average rate of the globe, having warmed about 3 to 5 degrees Fahrenheit since 1895.
A study published in September found that the frequency of combined heat waves and droughts — which are more impactful when they occur in unison — has increased significantly, especially in the western U.S. For example, the type of hot-dry event that would have been expected once every 25 years in 1950, now occurs five to 10 times every 25 years…
Colorado’s state climatologist Russ Schumacher agrees, telling Colorado Public Radio this is pretty well in line with climate predictions, “What we’re seeing here is indicative of the fact that when the hot, dry years come around, they’re hotter. … I think the frequency of these kinds of summers where we get in these hot, dry conditions is probably going to increase.”
Udall agrees, and warns we should get used to what he calls “the new abnormal.” “The climate system has a really good memory and the cycle of heat and dryness is hard to break,” he said…
The effects on the Colorado environment are apparent. Since the 1930s the water available from Colorado snowpack has decreased by 30%. As a result streamflow in the Colorado River has decreased markedly. In a 2018 study, Udall and co-authors found that 50% of the river runoff decline was due to higher temperatures.
And this more arid climate has huge impacts, with larger wildfires and a longer fire season. In fact, wildfire season in the West is now two to three months longer than it was in the 1970s. And since 1984, human-caused climate change has led to a doubling of the area burned in the Western states, with about 50%of the increase being attributed to increases in the dryness of fuel…
The unprecedented wildfires of the past few years have certainly illuminated just how vulnerable we are to a climate which no longer plays by the rules our parents and grandparents took for granted. And considering the warming and drying projected in the coming decades, scientists say the rules will just keep on changing, making it “unlikely that the records from 2020 will stand for long.”
These wetlands in the Homestake Creek valley are near the site of the proposed Whitney Reservoir. The Forest Service is considering whether to issue a permit for drilling and a geotechnical study to test whether the site would support a dam. Photo credit: Heather Sackett/Aspen Journalism
RealVail.com also checked in with Hickenlooper — a Democrat who’s leading incumbent Republican U.S. Sen. Cory Gardner in most polls in the Nov. 3 election – on the topic of transmountain diversions of water from the Western Slope drainages of the dwindling Colorado River Basin to the Front Range cities where most of the state’s people live.
The former Denver mayor, brew pub owner and oil and gas geologist said that, as much as possible, Western Slope water should stay on the Western Slope.
“When we created the Colorado Water Plan, one of the real focuses there was to make sure that we don’t divert water from one basin to another unless it’s absolutely necessary,” Hickenlooper said. “One of the things we set up in the water plan is the process by which we debate that and when people get crosswise over water, you don’t just go to a fight.”
The context of the question was a proposal by Homestake Partners, comprised of the Front Range cities of Aurora and Colorado Springs, to conduct test drilling in the Homestake Creek drainage near Red Cliff to determine the best site for a new dam for the proposed Whitney Reservoir, which would provide the cities up to 20,000 acre-feet in average annual yield.
Local towns, politicians and statewide conservation groups oppose even the test drilling, which was delayed in the U.S. Forest Service permitting process by the record wildfire season…
Climate Change Amplifies Colorado’s Water Diversion Debate
Nearly 5 million people live on the eastern side of the Rocky Mountains, along what’s known as Colorado’s “Front Range,” where communities established on semi-arid prairie land need more water to keep expanding.
Now a water battle is brewing over whether the booming population centers of Aurora and Colorado Springs, with nearly 900,000 residents combined, can claim water from a remote valley on the other side of the Rockies, collect it in a new reservoir and pump it across the Continental Divide.
For many residents of bucolic Eagle County on the “Western Slope,” where Homestake Creek meanders through mountain meadows, lush wetlands and ancient fens on its way to the endangered Colorado River, it’s time to end transmountain diversions once and for all as the climate warms and drought intensifies.
But officials in Aurora, a Denver suburb, and Colorado Springs, argue they can collect the water in a new reservoir and make use of it without drastically disturbing the surrounding wilderness. More to the point: they’ve owned the rights to 20,000 acre-feet of average annual yield since 1952 and say it’s time to start exploring if they can use it—for drinking water and on suburban lawns.
“Because water is the lifeblood and it’s so important, we have been doing a relatively good job of having collaborative conversations that are getting us to a point, but the issue is growth and climate change are both happening now so fast and historically these collaborative conversations take a really long time,” said Eagle County Commissioner Matt Scherr.
“Are we going to be able to address that at the scale and speed that the problem is moving?” Scherr added. “So, you hate to see this end up being essentially a war for water, but if we don’t figure out how to do it in a holistic way, that could be our future.”
Trees just can’t climb uphill to outpace fast-moving forest fires. Instead, they ‘just burn down.’
Where I live there’s a spectacular gradient of climate and vegetation extending from the semi-arid grassland around cities (5,000 ft / 1.5 km) where five-million people live to the tundra and snowfields along the Continental Divide (13,000 ft / 4 km) above sea level.
In the past decade, wildfire has burned up the whole damned thing!
In the sweltering summer of 2012, we were besieged by the High Park fire. My mother died of chronic obstructive pulmonary disorder that summer, her lungs ruined by a lifetime of cigarettes and weeks of wildfire smoke.
Now, in the upper reaches of the currently raging Cameron Peak fire scar, the stinging spindrift of the coming winter has begun swirling among the lichen-covered boulders. Tundra and krumholtz have frozen, and the landscape is shutting down for imminent burial in wind-driven snow. In the foothills outside the city, firefighters sweat through soot to clear brush, protect subdivisions, and hose down the dry summer grass.
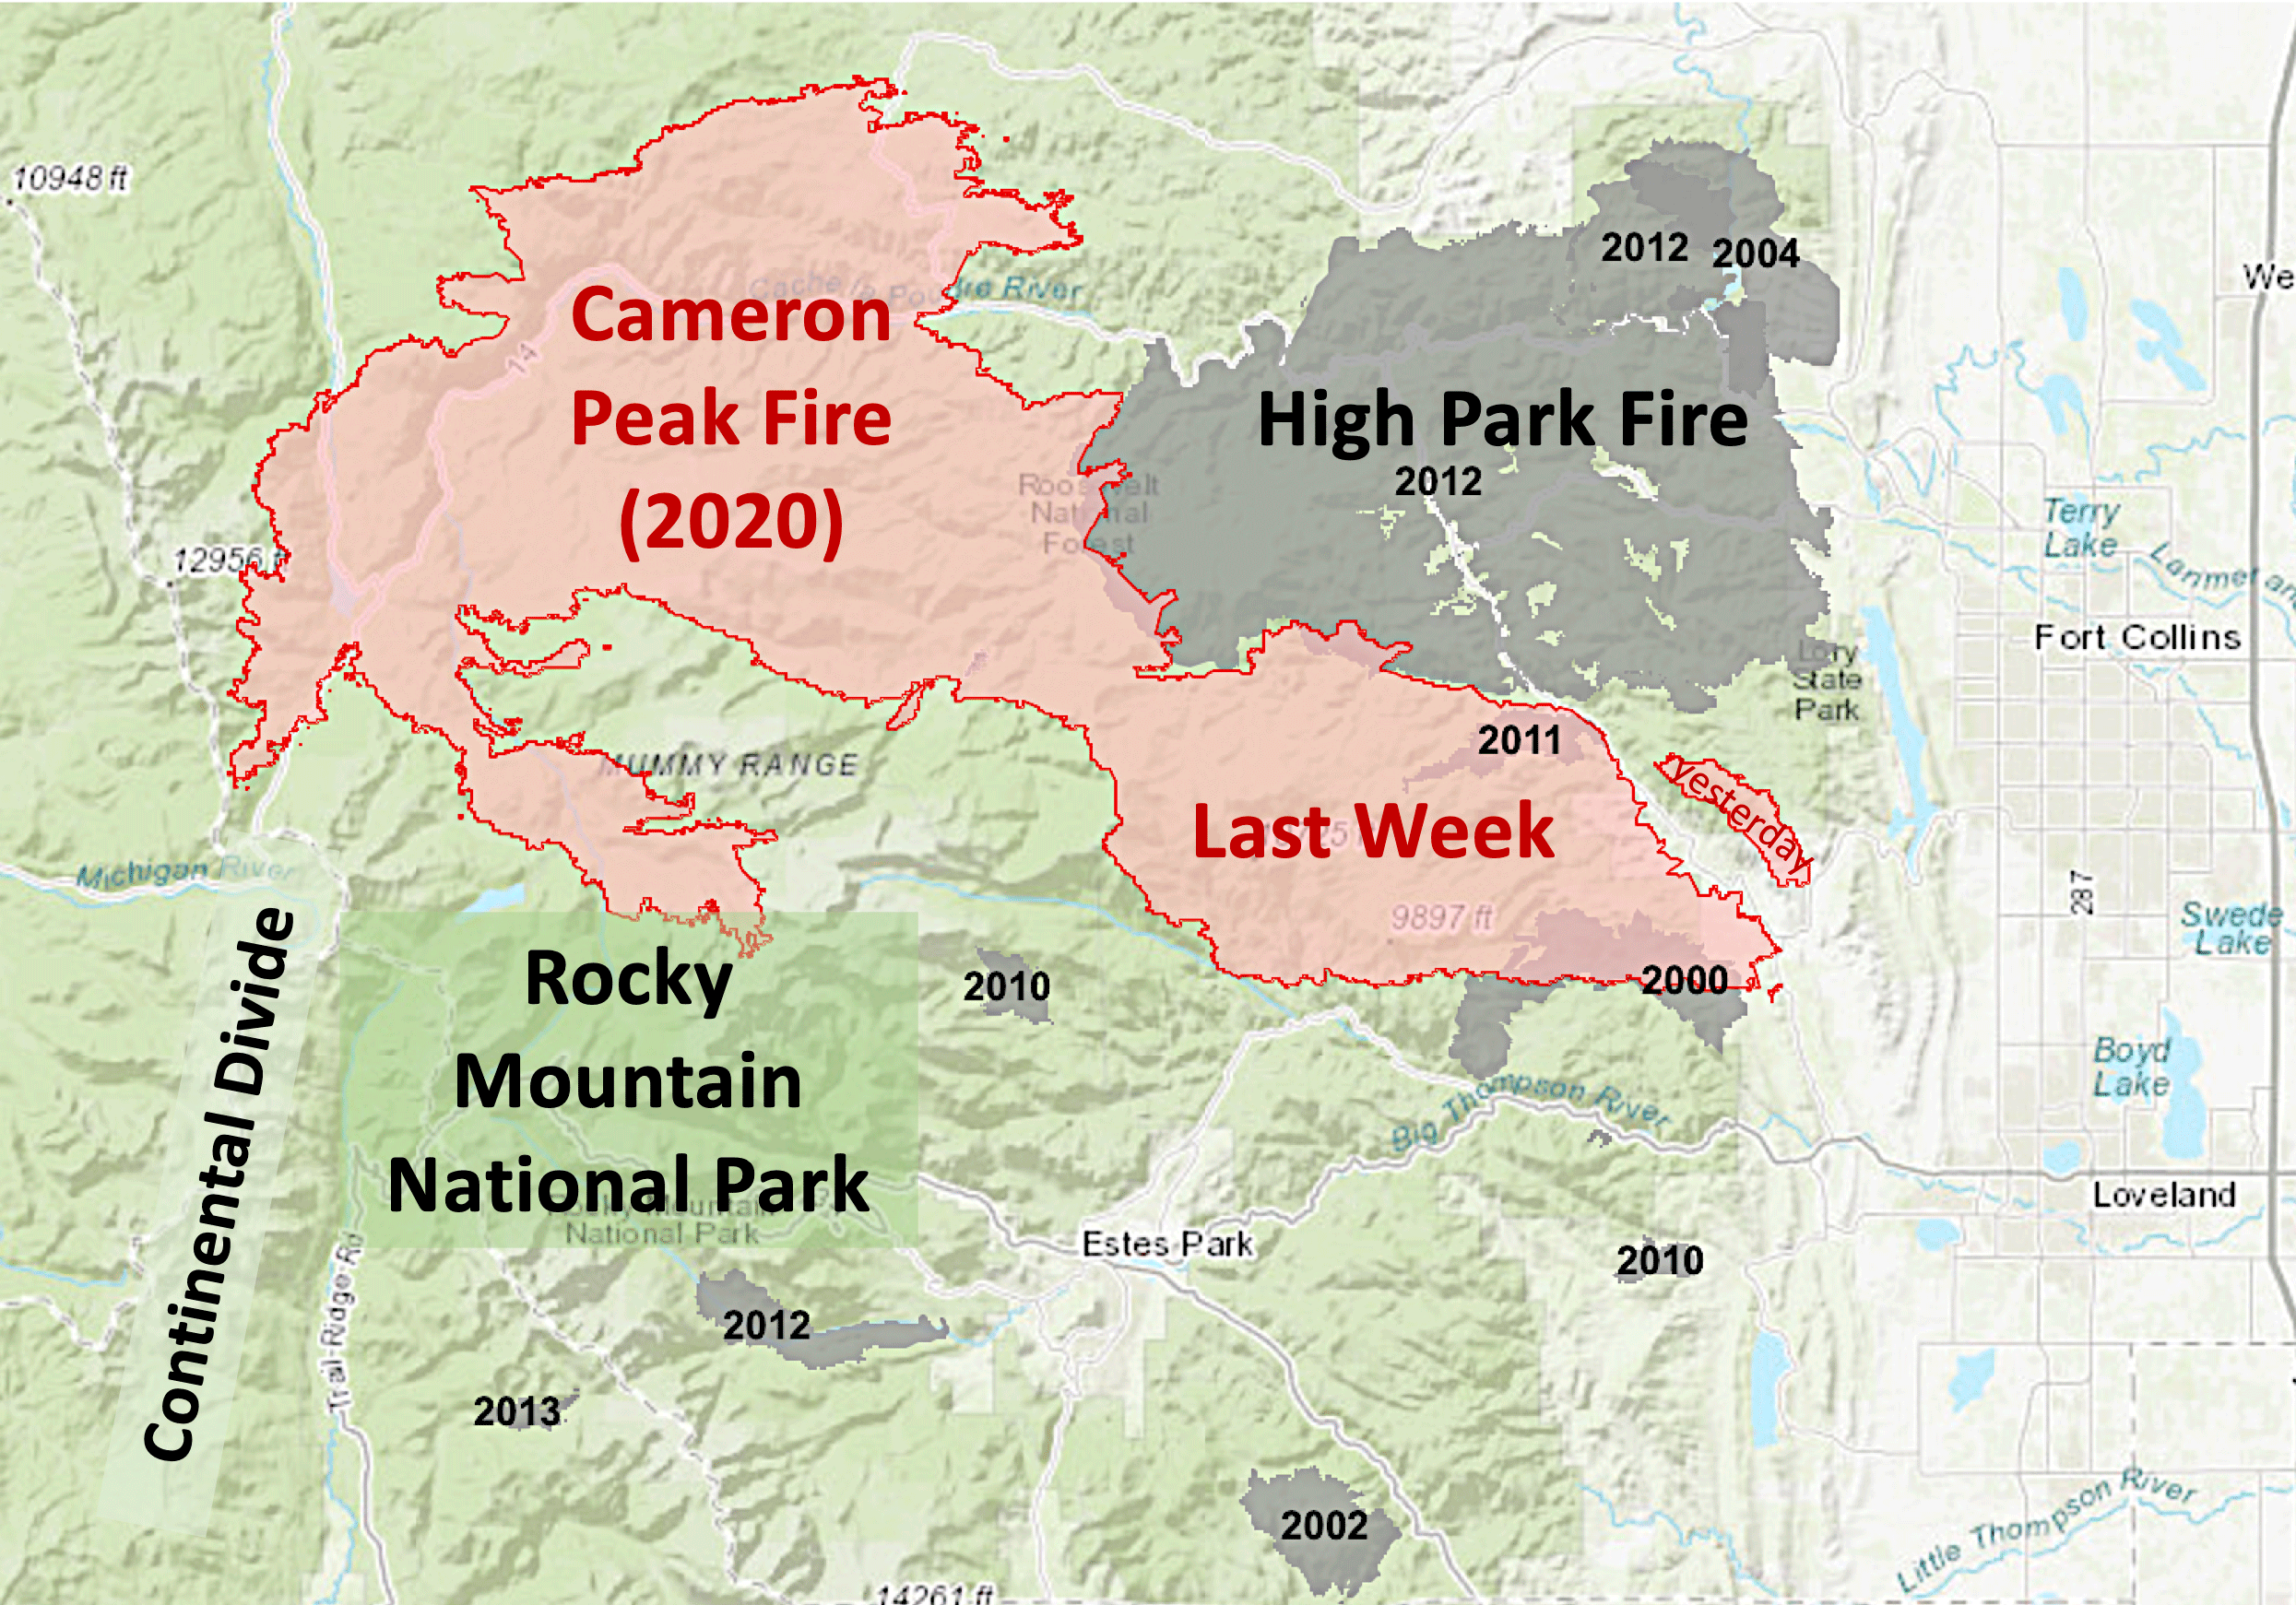
Never before in my lifetime has the entire tundra-to-prairie burned like this. Compare the sizes of the recent fire scars to the ones on this map from earlier years.
Cameron Peak and High Park fire scars October 2020. Credit: National Interagency Fire Center
There are three necessary conditions for wildfire: fuel, ignition, and dry soil. Over the past 50-plus years in this region, fuel and sources of ignition – for instance lightning and campfires – have not been lacking. What’s changed is the weather.
Nearly all the soil moisture in our mountain forests comes from the melting of the winter snowpack, especially above about 8,500 feet. Rain provides precious little of the water.
Every single day from “mud season” until the snows start piling up again in October, the forest extracts water from what was stored during spring snowmelt. On hot days it extracts more, and on cold days less. The forest thrives only on the acres where tree roots stay damp until the weather turns cold.
The hotter the days, and the longer the warm season between snows, the more days there are at the end of the season when all that abundant fuel is susceptible to a lightning strike or a campfire gone wrong.
At the end of the last Ice Age, 18,000 years ago, the world warmed about 5 degrees Celsius (10 F) over 10,000 years. That’s a rate of 0.1 degree per century.
That 10 F of warming over 100 centuries caused the plant zones in our mountains to slowly creep about 5,000 feet uphill. The spruces and firs displaced the tundra. The Lodgepole displaced the spruces and firs. The Ponderosa displaced the Lodgepole and the grasses, and yucca displaced the Ponderosa.
Unlike the Ents in Lord of the Rings, our trees didn’t just get up and walk up the mountains. Rather, the poorly adapted ones slowly died out and were replaced by the seedlings of their better-adapted neighbors as the warming slowly crept up the slopes over many millennia. The cone doesn’t fall far from the tree.
By the time today’s toddlers in their 70s, our climate could very easily heat up just as much as it did in 100 centuries during the last great warming. That’s 100 times faster than the last warming. It’s less than the lifetime of a single tree, and way too fast for seedlings to displace their ancestors.
When the climate moves out from under the forest so quickly, the trees don’t just get up and walk uphill.
Instead they just burn down.
AUTHOR Scott Denning for more than two decades taught as part of the atmospheric sciences faculty at Colorado State University. A frequent speaker and popular informal science educator, Denning says he “takes special delight in engaging hostile audiences” on climate change.
FromThe Washington Post (Matthew Cappucci, Andrew Freedman, and Jason Samenow):
The drought is exacerbating wildfires and taxing water resources
West Drought Monitor October 13, 2020.
The drought has already been a major contributor to record wildfire activity in California and Colorado. Its continuation could also deplete rivers, stifle crops and eventually drain water supplies in some Western states.
Nationwide, drought has expanded to its greatest areal coverage since 2013; 72.5 million people are in areas affected by drought. More than one-third of the West is in “extreme” or “exceptional” drought, the two most severe categories, according to the federal government’s U.S. Drought Monitor.
In its winter outlook issued last week, the National Oceanic and Atmospheric Administration (NOAA) cautioned drought conditions are expected to persist or worsen over large parts of the West during the December through February period, and expand farther east into the central United States.
Scenes of the CalWood Oct. 17, 2020 (Jivan West/CU Independent)
In recent months, drought has surged to extreme levels along parts of the West Coast, including Northern California, much of Oregon and the Cascades in Washington…
In Colorado, wildfires continue to rage along the Front Range, with evacuations west of Fort Collins and northwest of Boulder. The Cameron Peak Fire, which has torched more than 200,000 acres, is now the largest wildfire in Colorado history, and the CalWood Fire became Boulder County’s largest fire on record when it exploded in size over the weekend. That fire has burned at least 26 homes, though the toll is expected to increase.
This is a very serious situation at the #CalwoodFire burning northwest of #BoulderCO. This area is populated with mountain homes. It’s also very dense with camping and hiking trails…. Taking into account how fast this fire has spread so far, I hope everyone makes it out ok. pic.twitter.com/KSBkhbpjZk
There is no precedent for wildfires this severe igniting so late in the season in the Centennial State. It’s no coincidence that the entirety of Colorado is experiencing a drought for the first time since 2013. Fifty-nine percent of the state is enduring an extreme drought or worse.
2020 has been a particularly bad year for wildfires, obliterating records in California with more than 4.1 million acres scorched. This is more than twice the acreage burned during the previous record wildfire season.
An environment already parched from a lackluster monsoon
The Four Corners region is perhaps the one hit hardest, where prolonged, intense dryness has led to “exceptional drought.”
In New Mexico, an area one and a half times the size of the state of Connecticut is listed by the U.S. Drought Monitor as being in extreme drought. This includes Los Alamos and Santa Fe. Officials have noticed a dramatic decline in river flow rate feeding many aquifers, though there are no immediate drinking water supply concerns. The Drought Monitor includes the observation that “vegetation and native trees are dying” in parts of the state.
An exceptionally weak monsoon has been a major contributor to the ongoing drought in the Southwest…
In August, for example, Santa Fe picked up just one one-hundredth of an inch of rain. It averages 2.6 inches for the month. Since the start of the year, the city has had 5.44 inches of precipitation, less than half the 11.5 inches it would typically have by now.
It’s the second dud monsoon season in a row…
A large percentage of New Mexico’s rainfall — in some places more than half — comes from the monsoon…
Fontenon said that the rangeland in eastern New Mexico is suffering heavily, bringing shades of a drought early in the decade that plagued area farmers between 2011 and 2013.
Nearby in Arizona, Tucson hasn’t seen a drop of rain since August. Since the start of May, less than two inches has fallen. The year as a whole is 60 percent below average on rainfall.
Even farther north, the deficit has hit the Rockies and Intermountain West particularly hard. Grand Junction, Colo., has only seen 4.09 inches of rain this year; by now it should be in the double digits. Salt Lake City is at 7.86 inches. That’s five inches below average…
Extreme drought has also snaked its way into Wyoming, while moderate drought blankets most of Idaho and Montana…
The drought will only worsen
Forecasters at NOAA say that with a developing La Niña event in the Pacific Ocean, drought is likely to prevail and potentially worsen through the winter over large areas of the West…
Little relief in sight for most
But looking ahead, little to no wet weather whatsoever is expected in the Southwest, southern California, or the Four Corners region. And the drought will probably continue, if not intensify…
Climate change’s role
Human-caused climate change is increasing the likelihood of precipitation extremes on both ends of the scale, including droughts as well as heavy rainfall events and resulting floods. Studies consistently show that as the Southwest warms, the odds of drought are increasing.
According to the Federal National Climate Assessment in 2018, climate change intensified the severe drought in California and is worsening drought in the Colorado River Basin. Part of the reasons for this is that climate change makes such droughts hotter than they might’ve been just a few decades ago, which draws more moisture out of soils and vegetation, thereby worsening the drought in a positive feedback loop…
A recent study published in the journal Science found that the Southwest may already be in the midst of the first human-caused megadrought in at least 1,200 years, which began in the year 2000.
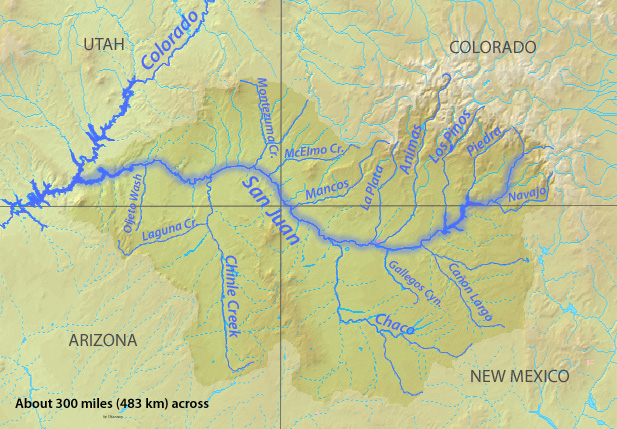
In response to increasing tributary flows, the Bureau of Reclamation has scheduled a decrease in the release from Navajo Dam from 700 cubic feet per second (cfs) to 650 cfs on Tuesday, October 20th, starting at 4:00 AM. Releases are made for the authorized purposes of the Navajo Unit, and to attempt to maintain a target base flow through the endangered fish critical habitat reach of the San Juan River (Farmington to Lake Powell).
The San Juan River Basin Recovery Implementation Program recommends a target base flow of between 500 cfs and 1,000 cfs through the critical habitat area. The target base flow is calculated as the weekly average of gaged flows throughout the critical habitat area from Farmington to Lake Powell.
This scheduled release change is subject to changes in river flows and weather conditions. If you have any questions, please contact Susan Behery (sbehery@usbr.gov or 970-385-6560), or visit Reclamation’s Navajo Dam website at https://www.usbr.gov/uc/water/crsp/cs/nvd.html.
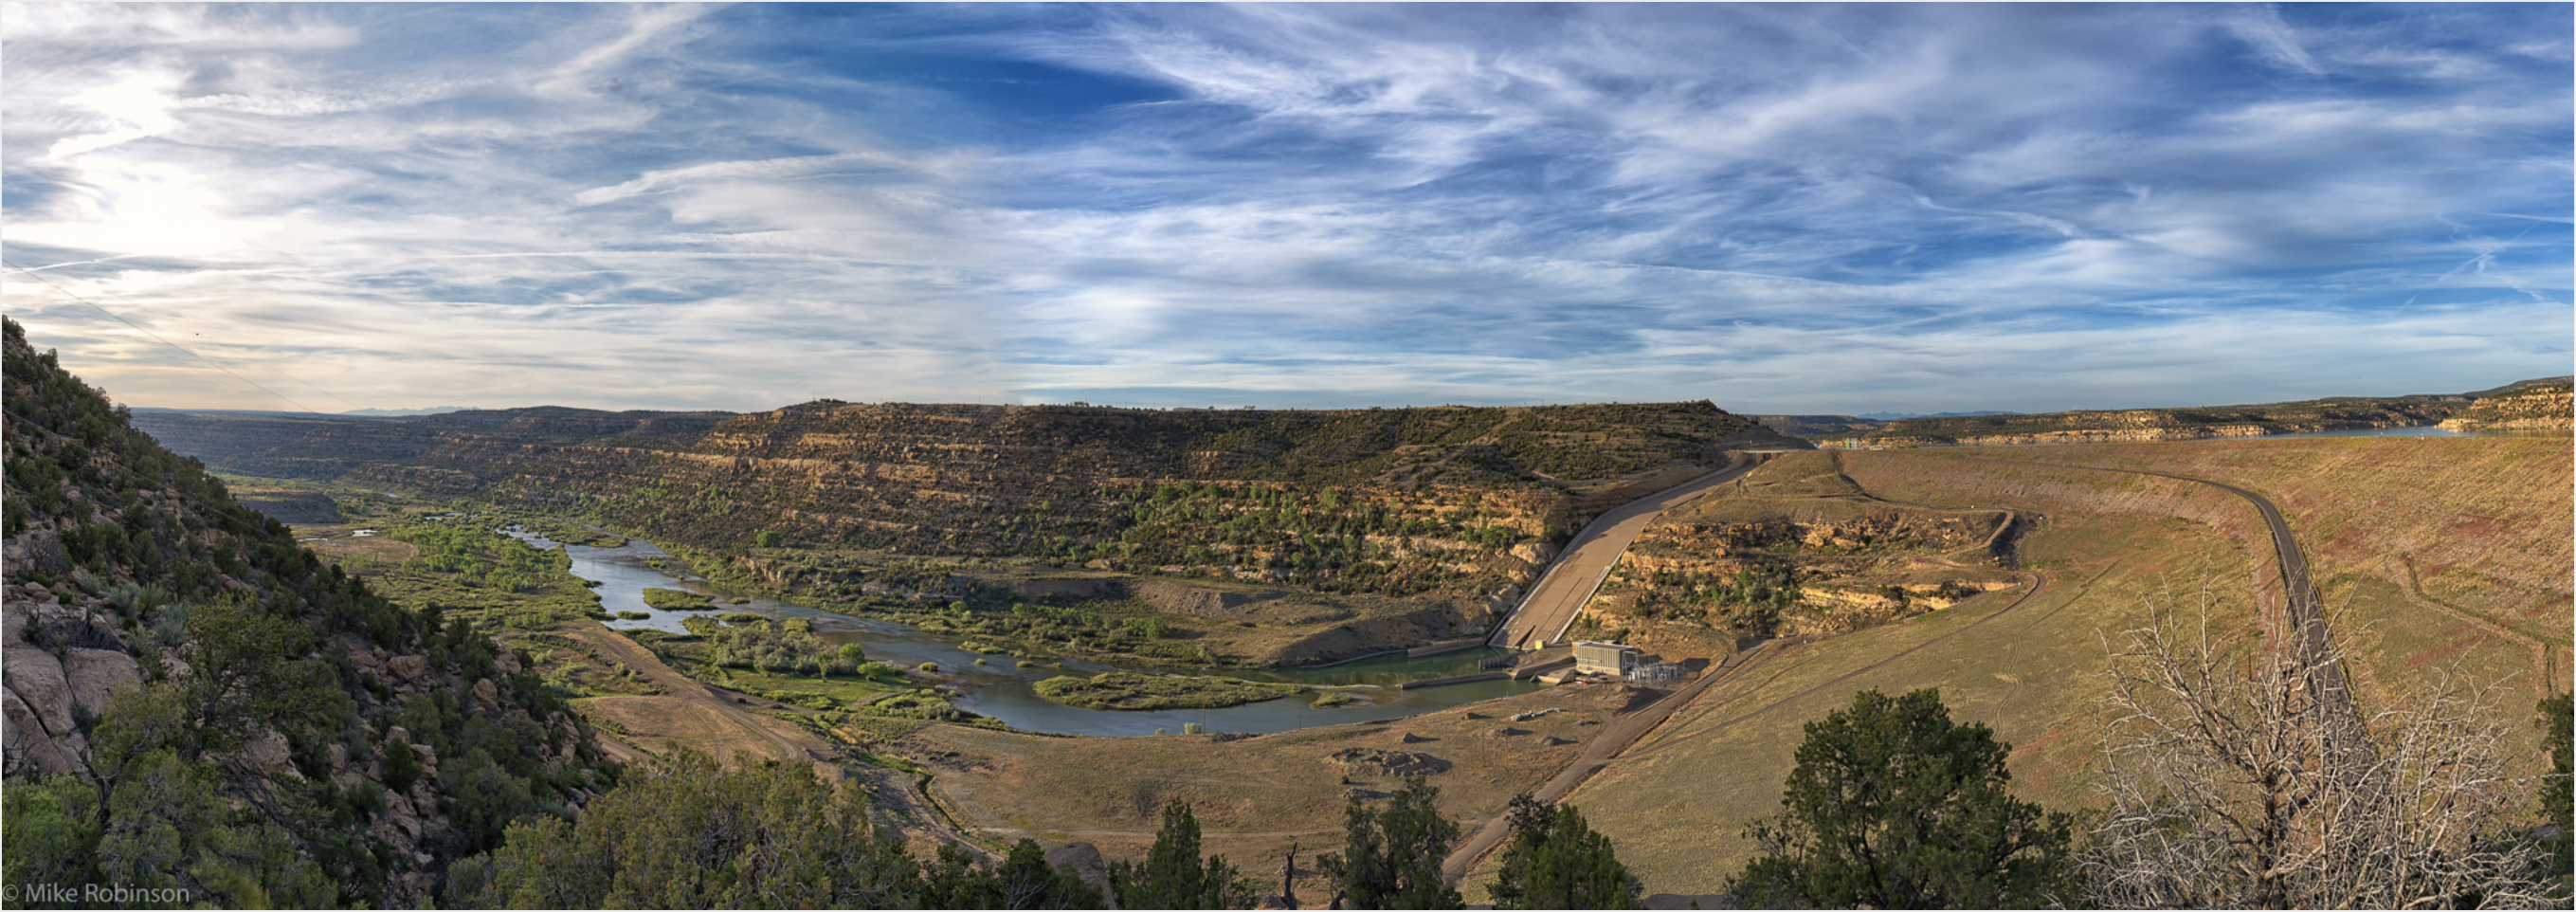
The Navajo Dam on the San Juan River.Photo credit Mike Robinson via the University of Washington.
From email from the Colorado Water Conservation Board (Rob Viehl):
The Colorado Water Conservation Board (CWCB) has drafted proposed revisions to the Rules Concerning Colorado’s Instream Flow and Natural Lake Level Program (ISF Rules). The revisions to the ISF Rules will: (1) address the rulemaking requirements of HB20-1157; (2) update a reference to the CWCB’s website; and (3) update references to Colorado Parks and Wildlife. Staff held two informal stakeholder meetings on August 3 and August 18, 2020 to discuss the draft ISF Rules revisions. Staff also has drafted a Statement of Basis and Purpose for the revised ISF Rules.
On September 16, 2020, the CWCB authorized staff to initiate the formal rulemaking process. On October 14, CWCB staff filed a Notice of Public Rulemaking Hearing and proposed revisions to the ISF Rules the Colorado Secretary of State, which will be published in the Colorado Register on October 25, 2020. The rulemaking hearing will be held on January 26, 2021. Applications for party status should be submitted to the CWCB’s Hearing Officer, Amy Beatie, by email to amy.beatie@coag.gov and will be accepted through November 13, 2020. For more details on applying for party status, see the Notice of Public Rulemaking Hearing. For more information on this rulemaking process, contact Linda Bassi at linda.bassi@state.co.us or (303) 866-3441, ext. 3204.
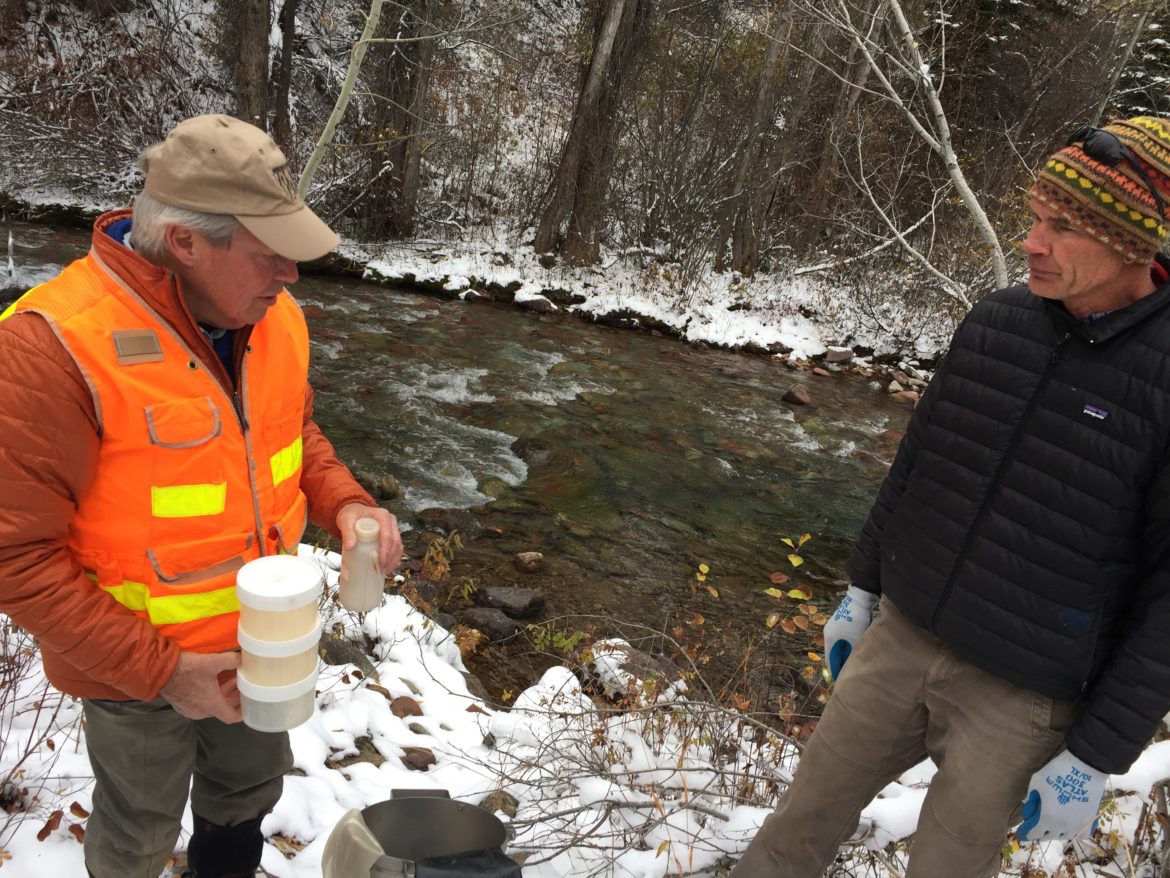
Aquatic ecologist Bill Miller, left, shows chair of Pitkin County Healthy Streams Board Andre Wille the three samples of macro-invertebrates he collected from Castle Creek. Some say the instream flow water rights held by the Colorado Water Conservation Board don’t necessarily go far enough to protect stream health. Photo credit: Heather Sackett/Aspen Journalism
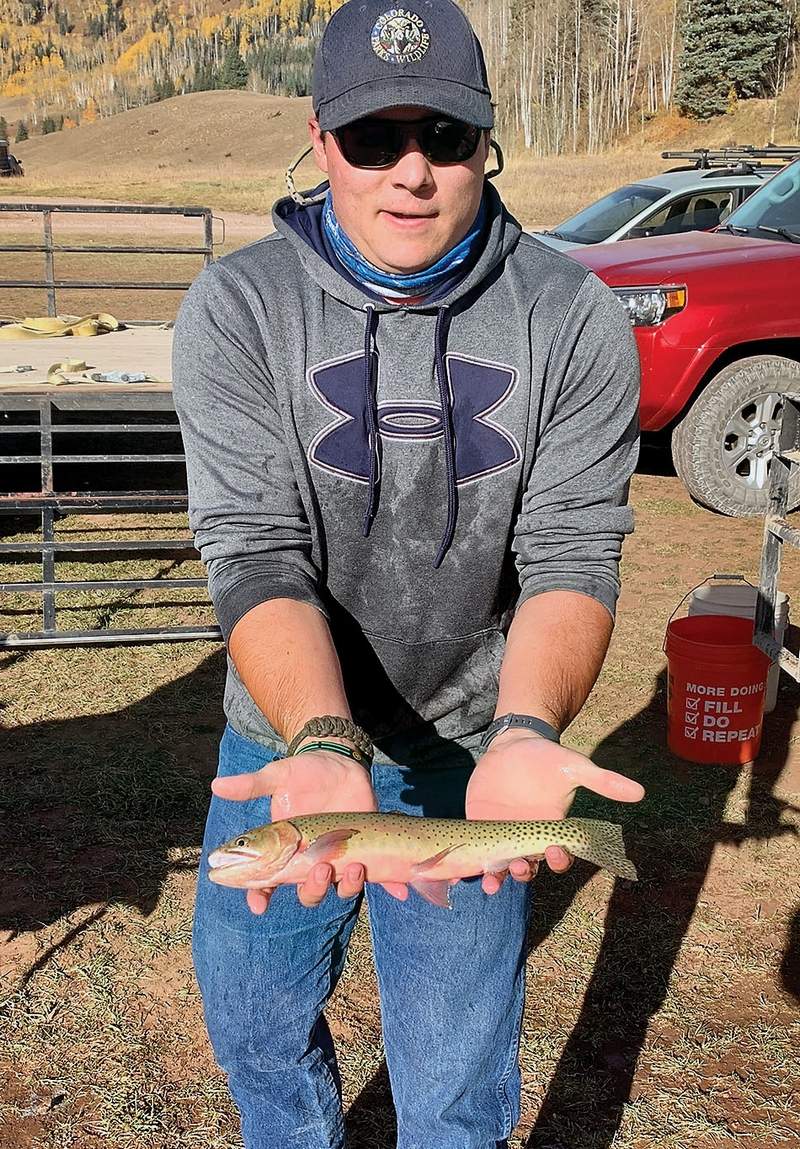
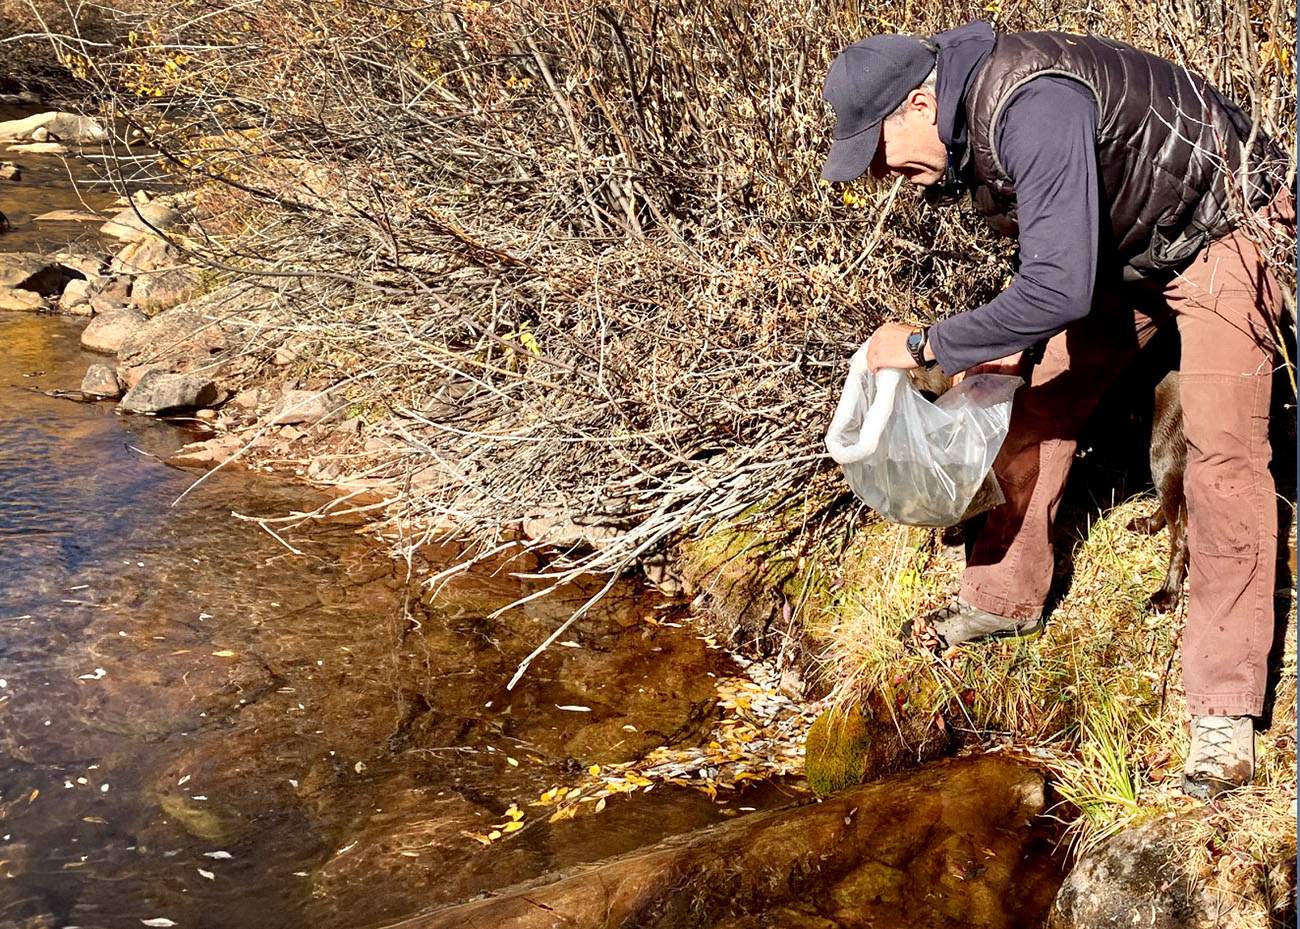
Connor Bevel, an Aquatic technician with Colorado Parks and Wildlife, holds one the 450 adult Colorado River Cutthroat trout released into the Hermosa Creek drainage October 9, 2020. Photo credit: Joe Lewandowski/Colorado Parks & Wildlife via The Durango Herald
A decades-long effort to restore the Colorado River cutthroat trout to the upper reaches of Hermosa Creek has been completed, resulting in the largest continuous stretch of waterway for the native fish species in the state…
Jim White, aquatic biologist for Colorado Parks and Wildlife in Durango, releases Colorado River cutthroat trout fingerlings into the East Fork of Hermosa Creek on Oct. 9. CPW released 4,000 fingerlings. Courtesy of Joe Lewandowski/Colorado Parks and Wildlife via The Durango Herald
The upper reaches of Hermosa Creek were instantly recognized as an ideal place for a restoration project, both for its outstanding water quality as well as easy access through a Forest Service road that runs behind Purgatory Resort.
Over the years, barriers have been installed to isolate certain stretches of water and an organic poison known as rotenone has been used to clear out invasive species, like brown, brookie and rainbow trout.
All this to clear the path for cutthroat reintroduction.
Last weekend, CPW stocked an estimated 4,000 cutthroat fingerlings and an additional 475 mature cutthroats in the final stretch of the Hermosa Creek project, giving the waterway back to the native fish for the first time in 100 years.
And now, the project to restore 23 miles of cutthroat habitat is finally complete…
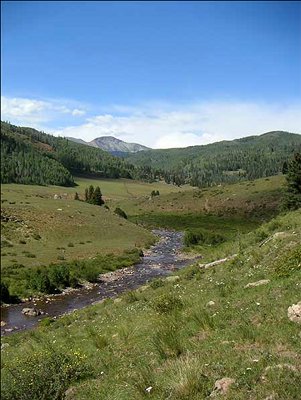
Hermosa Park
For the stretches of upper Hermosa Creek that have been restocked with cutthroats, populations are showing encouraging signs. White said there’s about 400 to 600 fish per mile, which he called a “nice, healthy population.”
Because the area is a popular draw for anglers, there is a strict catch-and-release policy. Local fish-guiding companies have said in the past that anglers come from all over the country to fish native cutthroats.
The Hermosa Creek project was a collaboration between CPW, the U.S. Forest Service and Trout Unlimited.
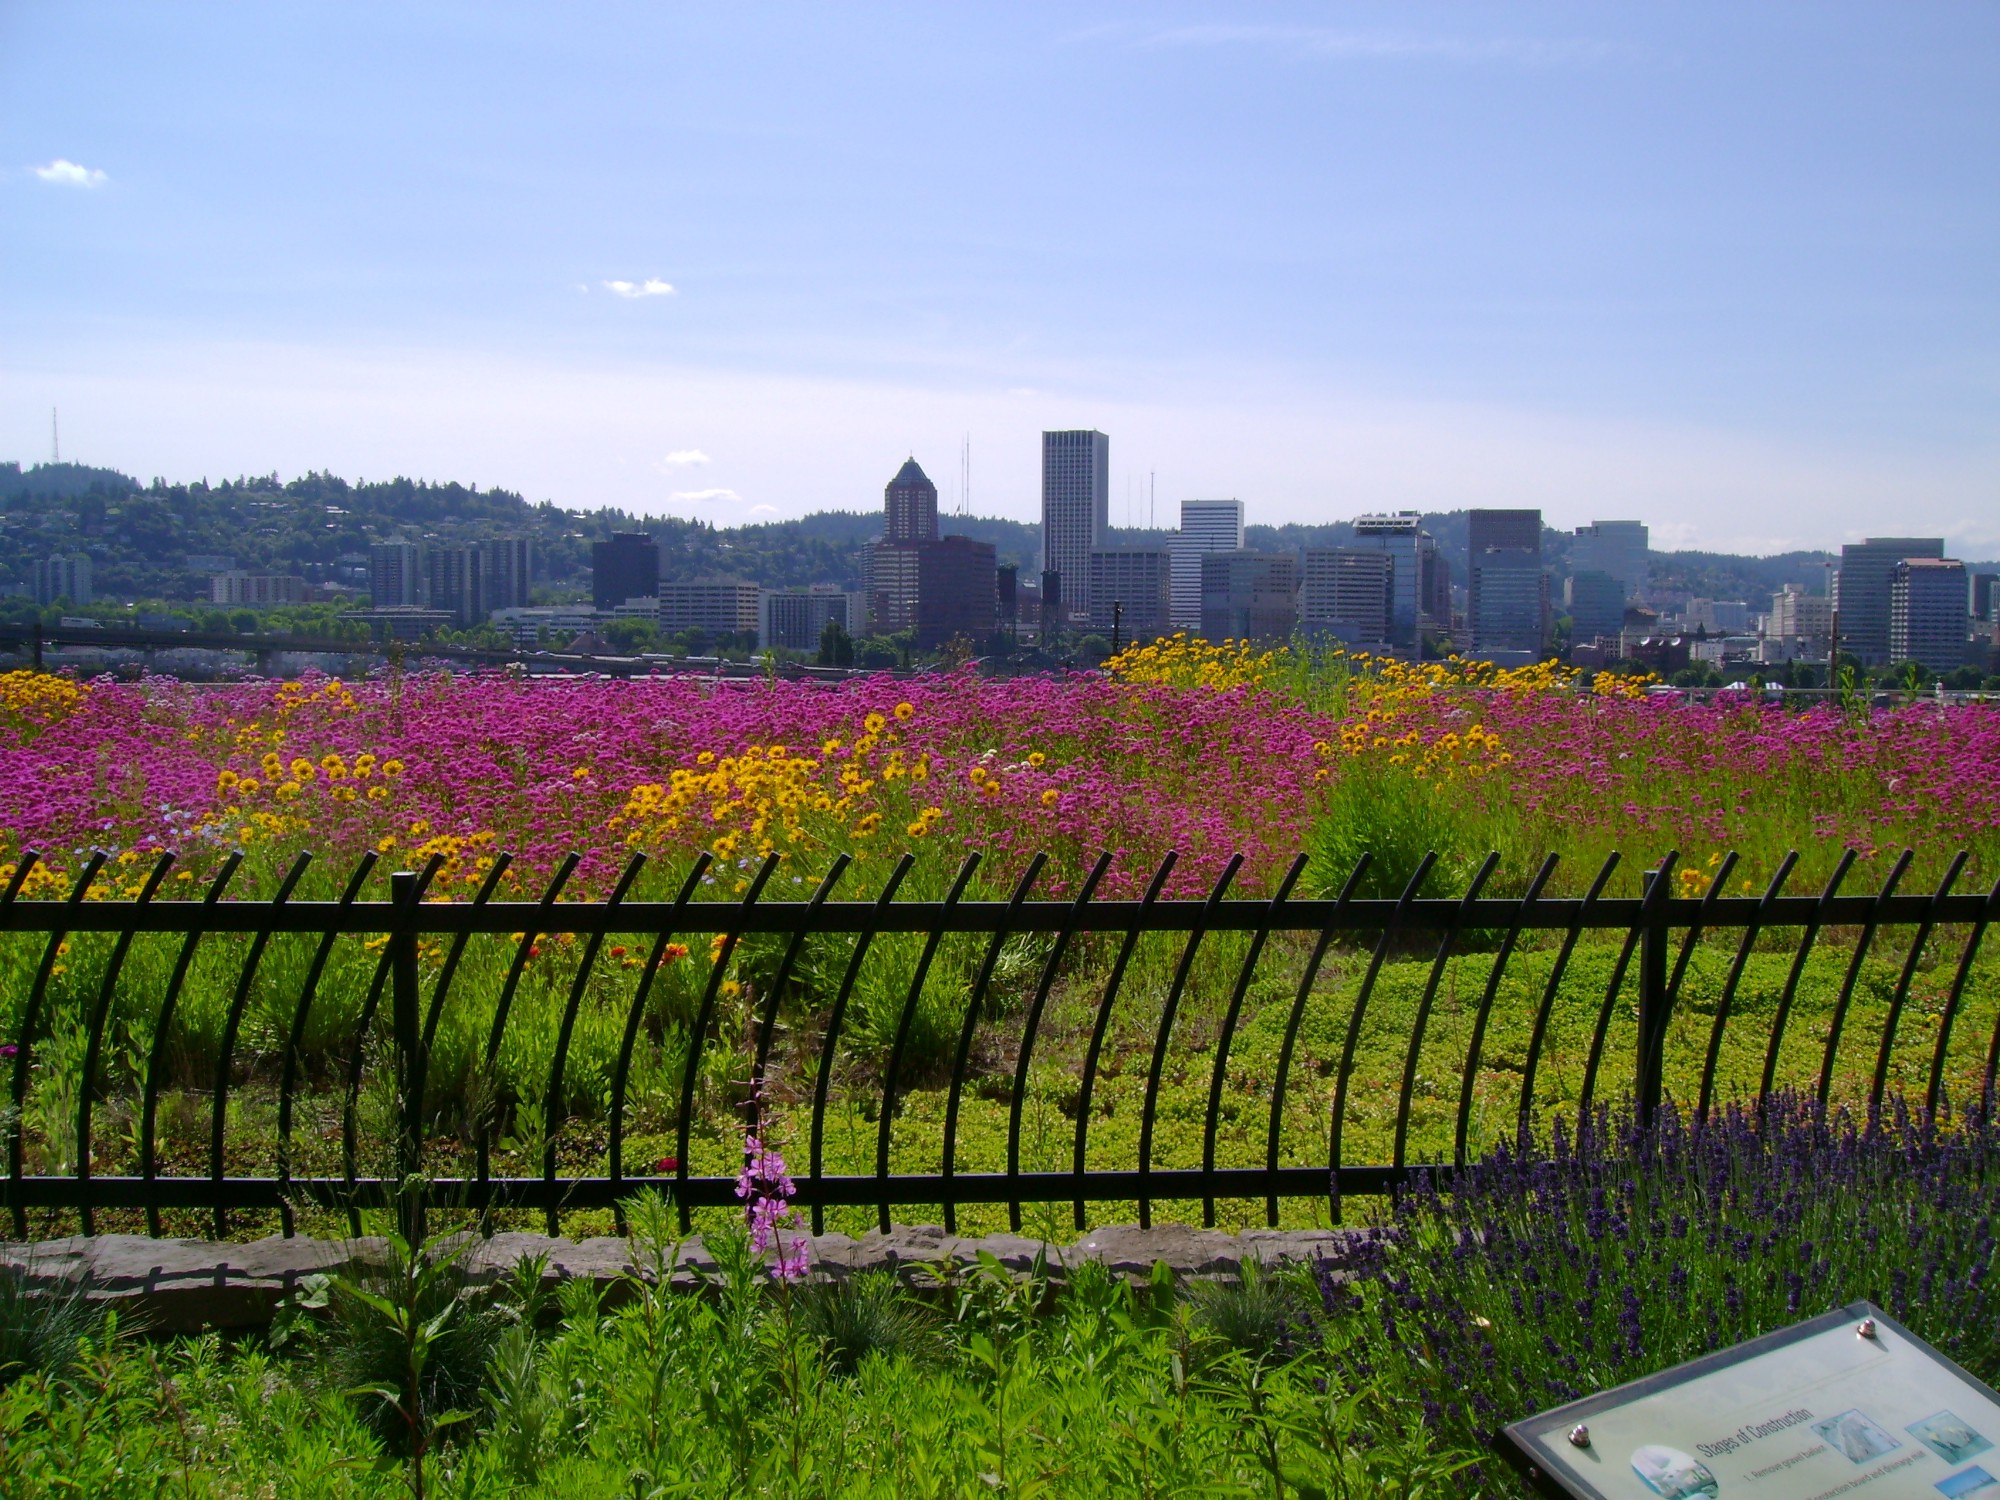
The Amy Joslin Memorial Eco-Roof on the Multnomah Building in Portland, Oregon is a 12,000 square foot green roof designed to control runoff, reduce pollutant loads, and add green space to the local community | Emily Hauth, Portland Bureau of Environmental Services
Click here to read the report. Here’s the executive summary:
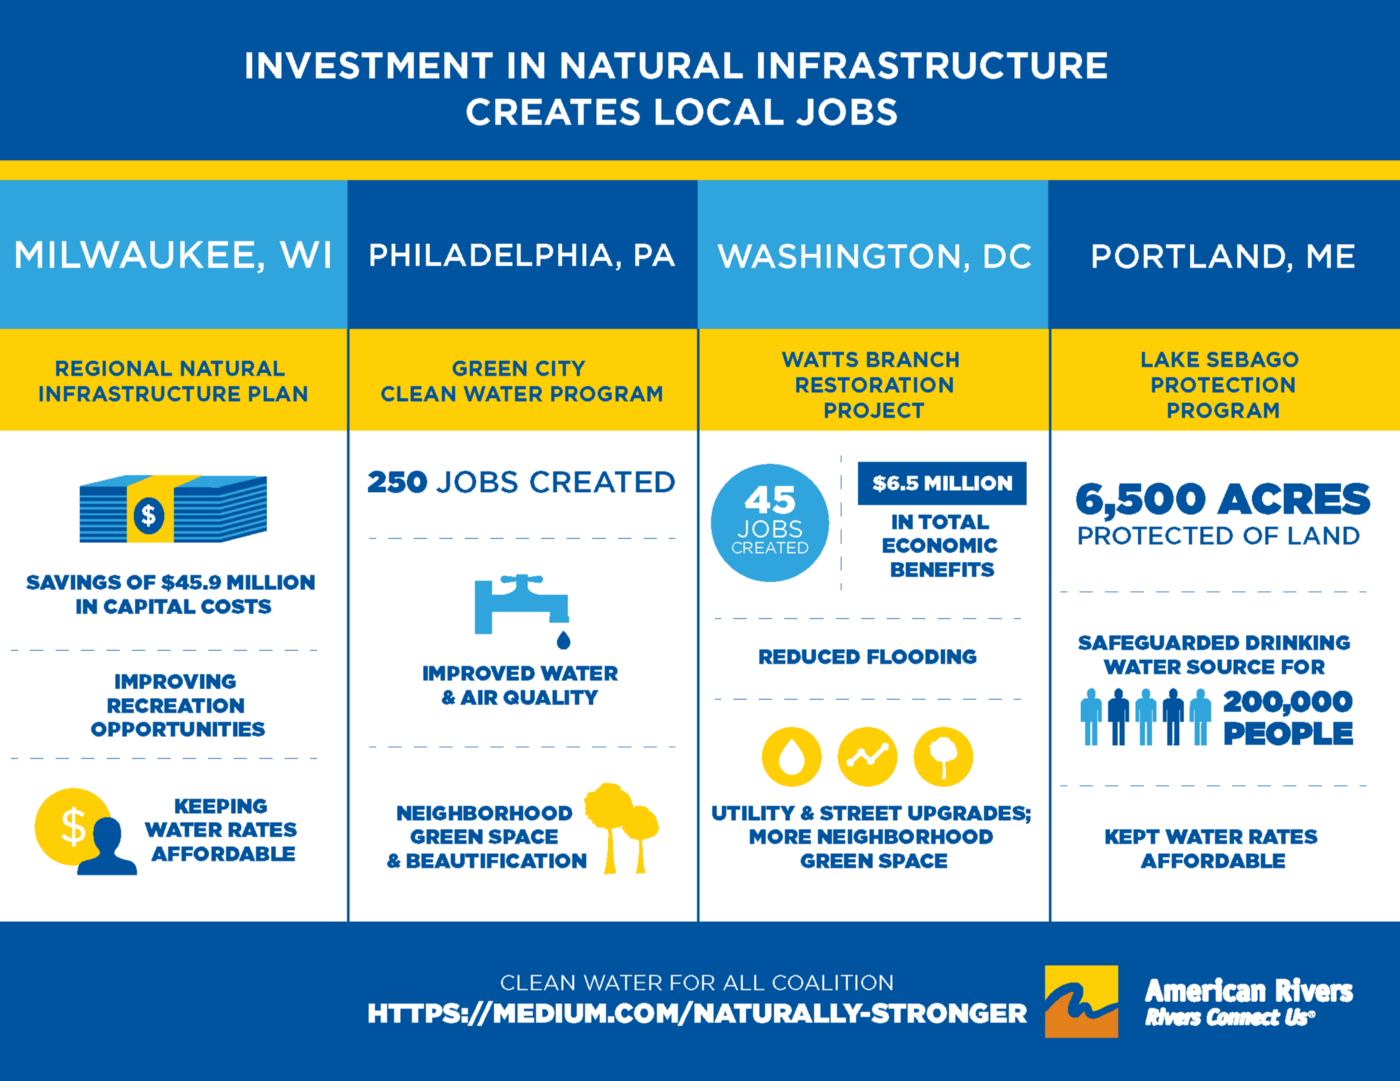
Communities in the United States are being threatened by sewage overflows, flooding, polluted stormwater, leaky pipes, and at-risk water supplies. These threats are a result of our nation’s outdated water infrastructure and water management strategies, and their impacts fall disproportionately on low-wealth neighborhoods and communities of color that are already suffering from a lack of investment and opportunity. To solve this problem, we do not just need more investment in water infrastructure. We need a new kind of water infrastructure and management, and we need it in the right places. The solution is the equitable investment in and implementation of natural infrastructure. Naturally Stronger makes the case that if natural infrastructure is used in a more integrated water system, we can transform and restore our environment, invigorate the economy, and confront some of our country’s most persistent inequities.
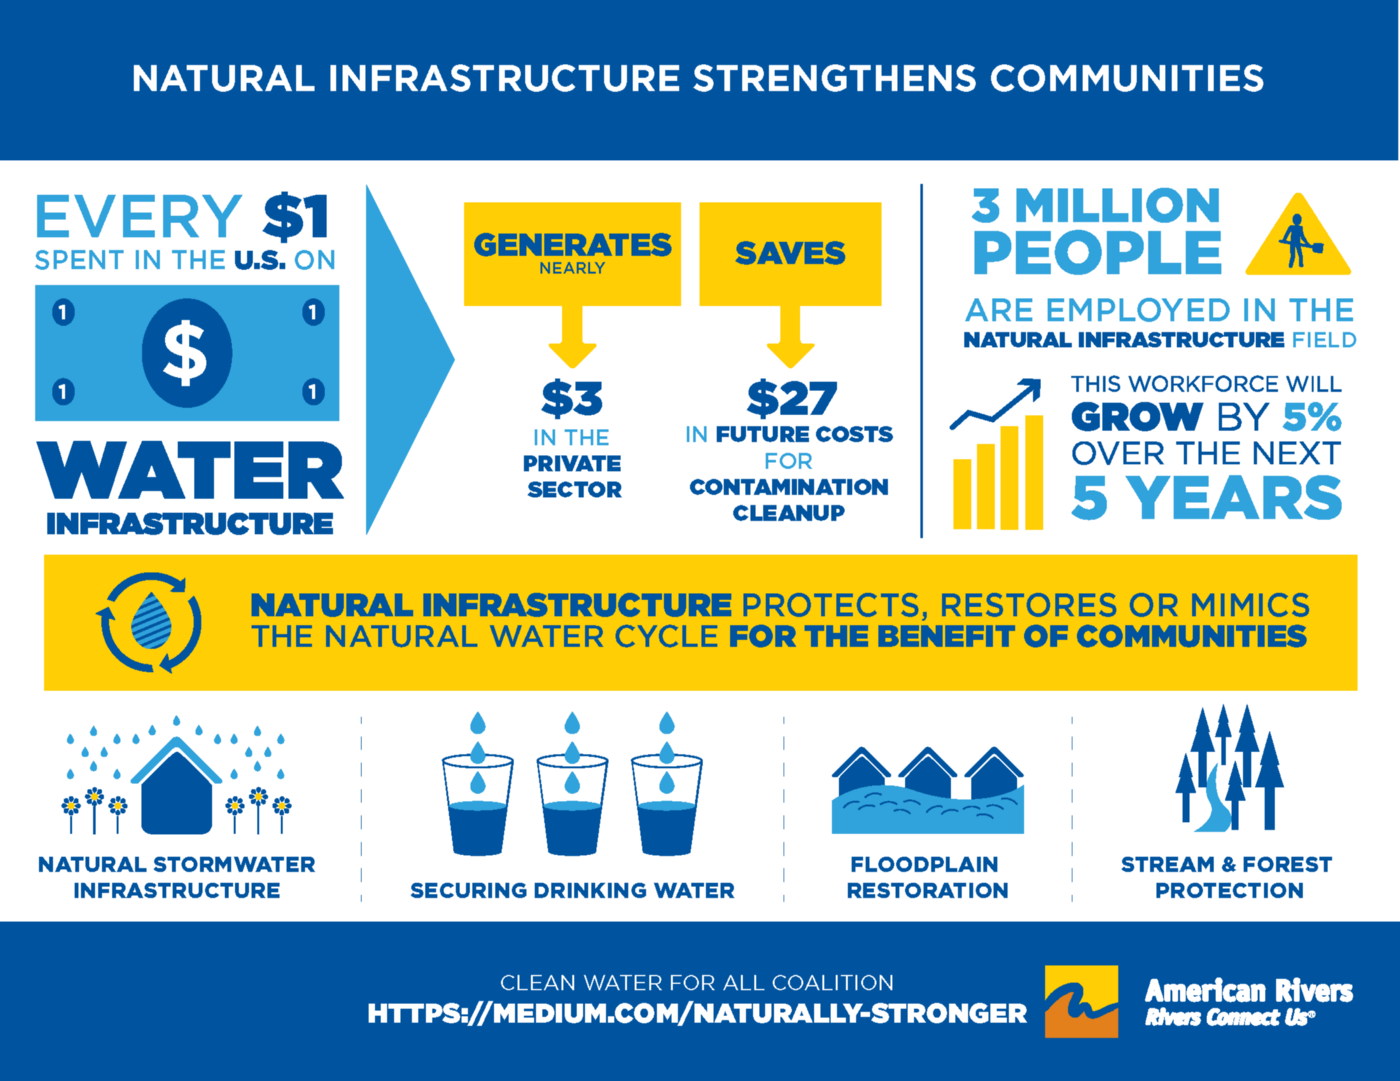
Natural water infrastructure protects, restores, or mimics natural water systems, working with traditional infrastructure, like pipes and treatment plants, and reducing the strain on those systems. Examples include protecting source water streams that provide drinking water to our communities, reducing water treatment costs; protecting natural floodplain areas to reduce flood damage; and restoring or increasing urban trees and green space to soak up and clean polluted stormwater, which reduces the surges in stormwater pipes and prevents flooding. These natural solutions add flexibility and resiliency to our water infrastructure due to their ability to complement and supplement existing infrastructure efficiently and the ease with which they can be adapted to changing community needs.
It is easy to overlook the extent to which we depend on natural infrastructure until catastrophe strikes. We take for granted that water will continue to flow from the tap, reliable and safe, that our homes are protected, and that our local waterways are healthy. We have been steadily losing the natural systems that provide communities with these benefits, and as we have lost this natural infrastructure, we have failed to adequately replace the lost services they provide. The result is decaying or outdated infrastructure that cannot keep pace with changing demand for water and wastewater treatment, growing populations, and increasingly severe storms. While these challenges affect all communities, the most severe impacts often fall on low-wealth communities and communities of color due to historic underinvestment and disinvestment in these communities.
Equitable investment in water infrastructure explicitly engages community voice, policy, planning, investment, hiring, contracting, and operations to ensure that historically underserved communities receive the water infrastructure investment they need, in a manner that improves public health, improves livability, and supports community cohesion. Since, historically, infrastructure investments have closely followed the geography of opportunity — higher income areas have high-quality infrastructure investments, and low income areas have suffered decades of underinvestment and disinvestment, and crumbling systems of transportation, schools, and, in particular, drinking water and waste water. These disadvantaged communities often lack adequate infrastructure, lack affordable water rates, and lack access to clean, safe water.
Disadvantaged communities are often located in floodplains, in drained wetlands, or adjacent to sewage outfalls, as a result of historic discrimination. Besides suffering damage to health and livelihood, their problems then flow downstream, affecting other communities and ecosystems. By addressing the infrastructure needs of vulnerable communities, we are addressing the water quality needs of everyone. New equitable water infrastructure investments can play a fundamental role in local and regional economies, and ensure that historically underinvested communities — where the greatest water vulnerabilities manifest — can both address water security and advance greater economic inclusion. To ensure equitable water infrastructure investments, vulnerable communities must have a voice in where and how investments in water infrastructure are made.
Water infrastructure and equity challenges can be effectively overcome together through a more holistic approach, particularly when natural infrastructure, with its flexibility, is included as part of the solution. This “integrated” or One Water approach to water management centers on breaking down ‘silos’ to create holistic, coordinated water systems that maximize economic, social, and environmental benefits in an equitable and sustainable manner. This integrated approach is achieved by bringing together city agencies, nonprofits, and other diverse stakeholders for collective problem-solving and decision-making that benefits all members of the community.
Natural infrastructure provides substantial economic and social benefits to the nation and to neighborhoods. The U.S. Water Alliance states in their Value of Water report that the U.S. needs to invest an additional $82 billion per year in water infrastructure — both natural and traditional — to meet projected needs. The same report states that by closing this gap over $220 billion in total annual economic activity would be added to the economy every year and would sustain approximately 1.3 million jobs over the next 10 years. In addition, investment in natural infrastructure creates local jobs.
According to a report by the Environmental Finance Center at the University of Maryland, natural infrastructure often increases local jobs, since these practices rely more heavily on local workers for installation and continued maintenance, in contrast to traditional infrastructure, which often relies on larger firms that outsource the work. As the number and scope of natural infrastructure initiatives increase, opportunities for developing more jobs will increase as well. According to the Brookings Institute, green job growth outpaced traditional job growth at a rate of nearly 2-to-1 in the nation’s 100 largest metropolitan centers from 2008 to 2010, providing diverse, career-starting opportunities in growth industries for communities that need them most.
Communities that have invested in natural infrastructure have not only reaped the economic benefits, but also have experienced other social benefits as well. Studies demonstrate that people with access to parks and green space live healthier, lower-stress lives. They have an easier time living active outdoor lifestyles, reducing medical expenses. And, of course, clean local waterways, improved by reductions in polluted runoff, mean higher-quality drinking water and safer places to recreate.
To address the significant water infrastructure needs of the nation, greater investments in both natural and traditional water infrastructure are needed. From major metropolitan areas to unincorporated rural communities — particularly those home to low-wealth communities and communities of color –investments are needed to address the consequences of long deferred maintenance, underinvestment, and disinvestment. And while infrastructure investments face budget restrictions at all levels of government, integrated water management approaches can often deliver overall cost savings by simultaneously addressing multiple issues and providing multiple benefits. Going forward, we will need to use existing water infrastructure funding mechanisms in order to implement natural infrastructure at the scale and scope needed to address our nation’s water infrastructure inequities. Funding mechanisms for natural infrastructure are diverse and include traditional mechanisms such as bonds, general funds, and state revolving funds as well as innovative approaches like public/private partnerships or incorporating water management in all types of infrastructure projects.
Naturally Stronger provides an overview and introduction to the water challenges we face and lays out the need for investment in water infrastructure and why natural water infrastructure is a necessary component of that investment. This investment comes with both economic and social benefits that can be optimized by planning, designing, investing, and implementing new water infrastructure in an intentional, equitable, and integrated fashion. But we cannot achieve these results by using the same water management strategies we have used in the past. To achieve more effective and equitable water infrastructure we must engage with multiple, cross-cutting stakeholders. Where our planning and decision-making tables are too small or exclusive, we must make them bigger and add more chairs, integrating communities and partners that have not always had a seat at the table. The water management sector must break out of the silos that constrain diverse and innovative solutions. The challenge before us is clear. The solutions are tangible. The moment to create a better future for clean water and communities is now.
After levee breaches during a large flood the United States Army Corps of Engineers (USACE) completed two levee setback projects that reconnected over 1700 acres rather than rebuild the levees | United States Army Corps of Engineers
American Rivers would like to thank Brendan McLaughlin; Tania Briceno, Corrine Armistead, and Rowan Schmidt with Earth Economics; Kalima Rosa and Chione Flegal with PolicyLink; and Scott Miller with Resource Media for their involvement in the development and writing of Naturally Stronger. We would also appreciate the help of members of the Clean Water for All Campaign for their guidance.
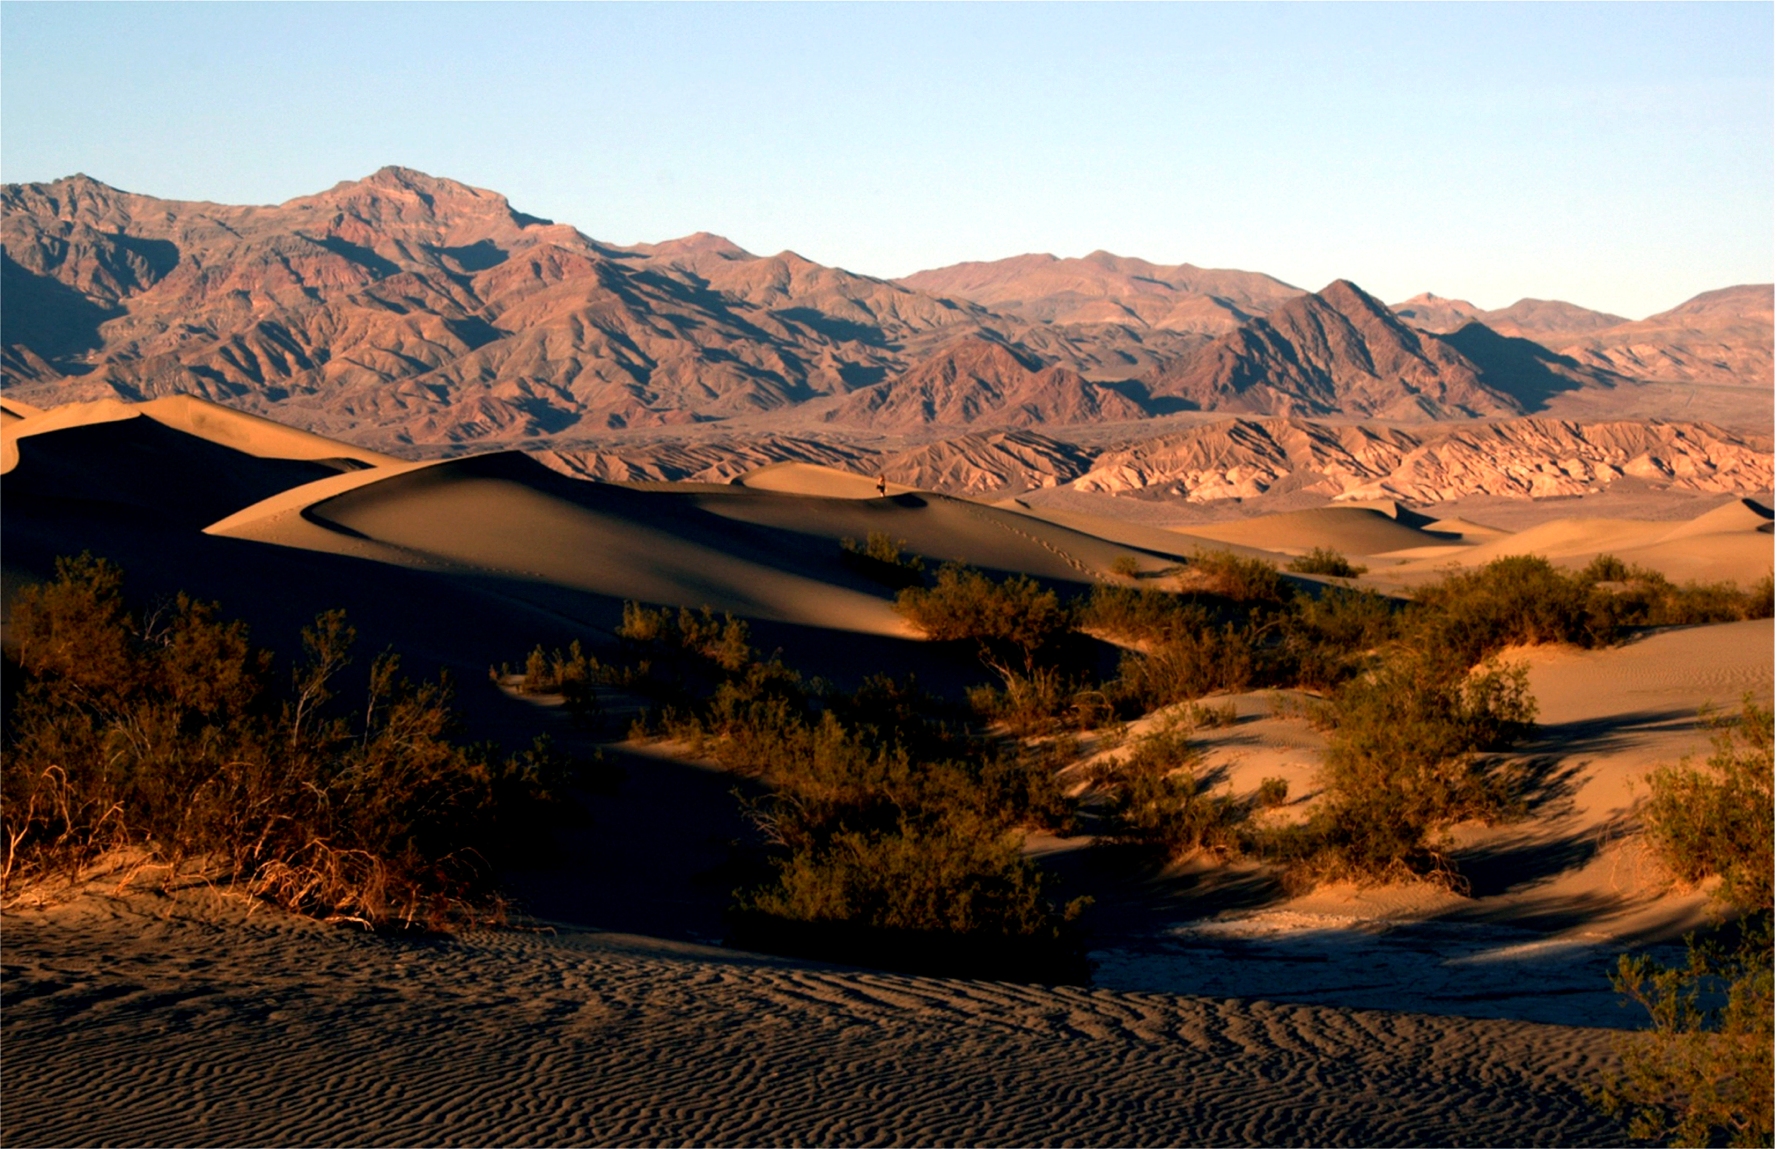
Sand dunes in Death Valley National Park. Death Valley, Calif., where temperatures exceeded 54°C this year, and much of the western United States will continue to see severe drought this winter. By Brocken Inaglory – Own work, CC BY-SA 4.0, https://commons.wikimedia.org/w/index.php?curid=3115716
This year is still on track to be one of the hottest years on record around the globe.
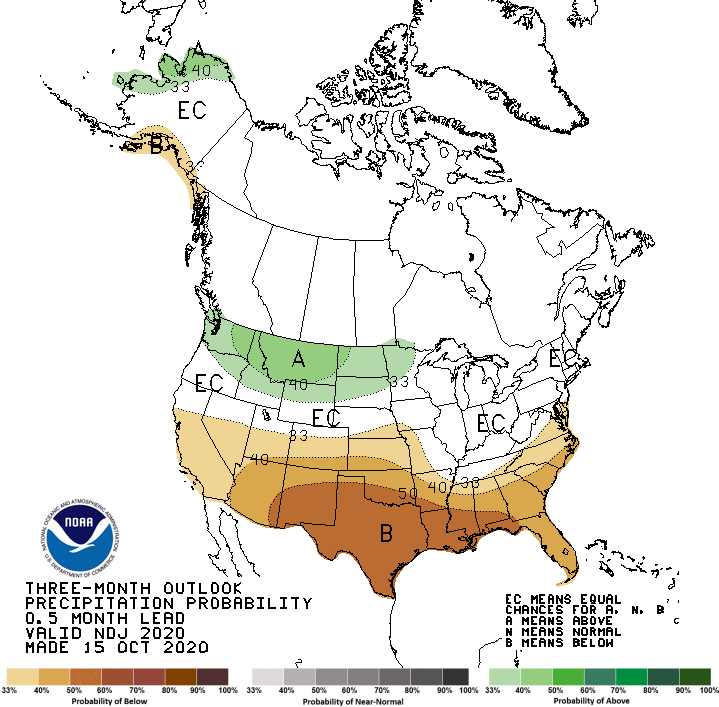
This winter is likely to be warmer and drier than average for most of the continental United States, in line with the conditions of a typical La Niña year. This information is according to the most recent NOAA seasonal forecast released on 15 October.
Like the past 2 years, more than two thirds of the continental United States, northern and western Alaska, and Hawaii will likely experience hotter than average temperatures through January 2021. Southern Alaska and states along the northern U.S. border may see colder than average temperatures, and no confident temperature forecast can be made for the remaining regions…
Widespread Drought Persists
La Niña years don’t tend to summon historic winter snowstorms like El Niño years do, but they can instead worsen drought conditions. NOAA confidently predicts that the southern half of the country will receive less precipitation than average this winter in addition to experiencing hotter-than-average temperatures. Warmer and drier conditions are expected to persist in those areas through May 2021.
“This is the most widespread drought that we have seen in the continental U.S. since September 2013,” Mike Halpert, deputy director of NOAA’s Climate Prediction Center, said during the 15 October event. “And the winter forecast doesn’t bode well for many of the areas around the nation currently experiencing drought with the exception of the Pacific Northwest, the Northeast, and Hawaii and Alaska.”
Thanks to a weak monsoon season and record-high temperatures, drought will likely persist in much of the western half of the United States and develop in Southern California, central and southern plains states, and northern Florida and southern Georgia. People living in the western United States have dealt with persistent drought for the past few years, which has contributed to severe wildfire seasons and heat-related health issues.
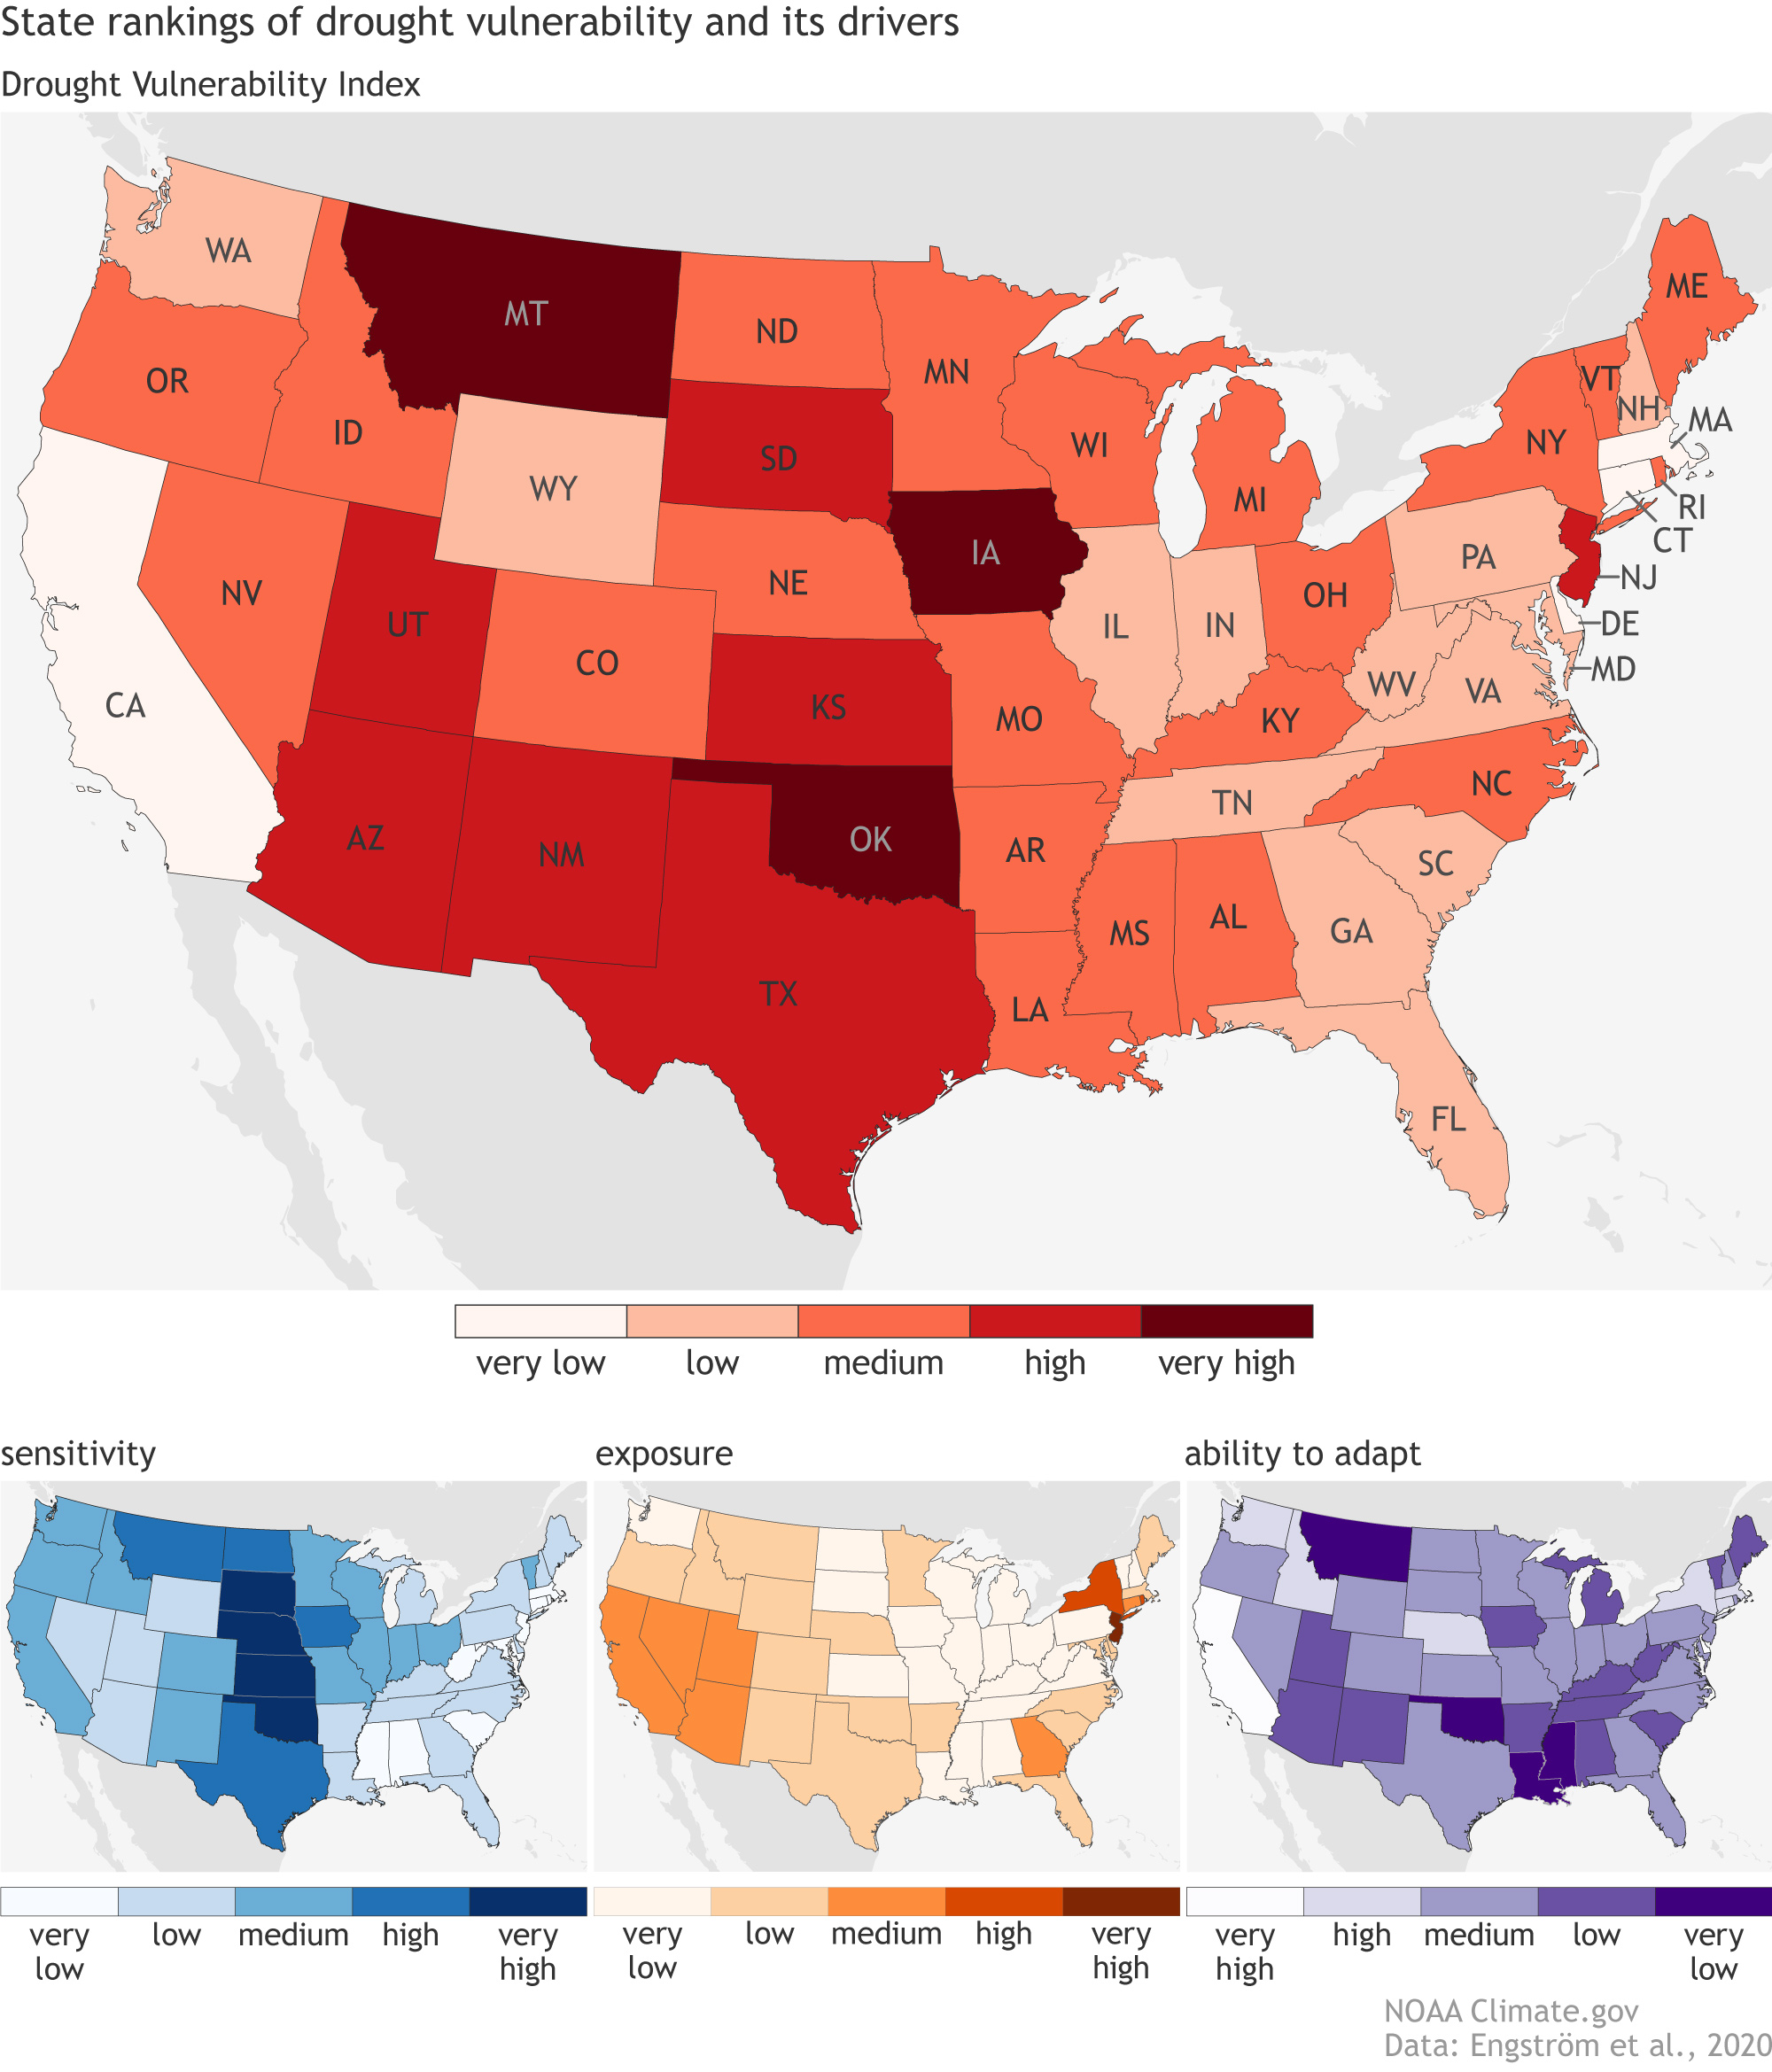
If asked where in the United States is most vulnerable to drought, you might point to those states in the West currently suffering under hot and dry conditions and raging wildfires. However, according to a new NOAA-funded assessment, what makes a state vulnerable is driven by more than just a lack of rain: it’s a combination of how susceptible a state is to drought and whether it’s prepared for impacts. And the most and least vulnerable states could surprise you.
These maps show each state’s overall drought vulnerability (red) and how it ranks in the three individual categories that make up the score: sensitivity (blue), exposure (yellow-orange), and ability to adapt (purple). Darker colors show higher overall drought vulnerability and a greater degree of factors that increase the state’s vulnerability.
Sensitivity is the likelihood of negative economic impacts, which is based on the percentage of agricultural land, number of cattle, how much the state relies on hydropower, and recreational lakes. The exposure score reflects how often a state experiences drought and what assets, like the number of people and freshwater ecosystems, are at risk when it occurs. The ability to adapt score ranks how well the state can cope with and recover from drought, which depends on whether the state has a drought plan, how equipped it is to irrigate its land, and whether it is financially strong overall.
By this scoring system, the most vulnerable states are Oklahoma, Montana, and Iowa, while Delaware, Massachusetts, Connecticut, and California are least vulnerable to drought. Oklahoma gets its high vulnerability score from having an outdated drought plan and limited irrigation (low ability to adapt), as well as extensive agricultural activities and cattle ranching (high sensitivity). Despite facing recurring multi-year droughts (relatively high exposure), California ranks very low in drought vulnerability. Thanks to a strong economy and well-developed adaptation measures, it’s better prepared for an extreme drought when it occurs than most other states.
On the East Coast, the region is generally less vulnerable than other areas, given its wetter climate and lack of farming—except for New Jersey. As the most densely populated state in the country (very high exposure), it gets the region’s highest vulnerability score.
By breaking down drought vulnerability into three components, this assessment can help decision makers identify what makes their state vulnerable for better planning. And, as the study shows, even states that receive lots of rain can still be vulnerable.
Though drought is one of the costliest natural hazards in the United States, there are actions states can take to become more resilient.
This research was led by Johanna Engström, Keighobad Jafarzadegan, and Hamid Moradkhani from the University of Alabama and funded in part by NOAA’s Climate Program Office through its Modeling, Analysis, Predictions, and Projection (MAPP) program. The MAPP Program enhances our capability to understand, predict, and project variability and long-term changes in Earth’s climate system.
A high-elevation spruce beetle-affected forest. Photo credit: Seth Davis via Colorado State University
Here’s the release from Colorado State University (Karina Puikkonen):
When southern Rocky Mountain forests are viewed from a distance these days, it may not look like much is left. Large swaths of dead, standing Engelmann spruce trees tell the tale of a severe regional spruce beetle epidemic in its waning stages. But among those dead trees, researchers have found good news. Zoom-in to the ground cover of these forests and there is life, even more abundant because of this disturbance.
New research led by Colorado State University and published online in Scientific Reports suggests that spruce beetle outbreaks may help create habitat for pollinator communities in wilderness settings. The research team found significant increases in floral abundance and wild bee diversity in outbreak-affected forests, compared to similar, undisturbed forest. Lead author Seth Davis said it may seem counterintuitive that landscape-level damage by one type of insect could still benefit another.
“Disturbances from bark beetles are typically regarded as undesirable for ecosystem function and human use,” said Davis, an assistant professor in the Forest and Rangeland Stewardship department. “But there is conservation value in post-outbreak forests; they appear to be the areas supporting more robust bee populations.”
This is good news for wild bee communities, which have been declining in recent years. The different bee species identified in this high-elevation study are made for harsh, cold environments. The fact that a natural disturbance can boost their presence is a boon to these rare, endemic creatures not found in warmer habitats. It’s also a benefit for these forests, because wild bees perform essential pollination services in ecosystems with very short growing seasons.
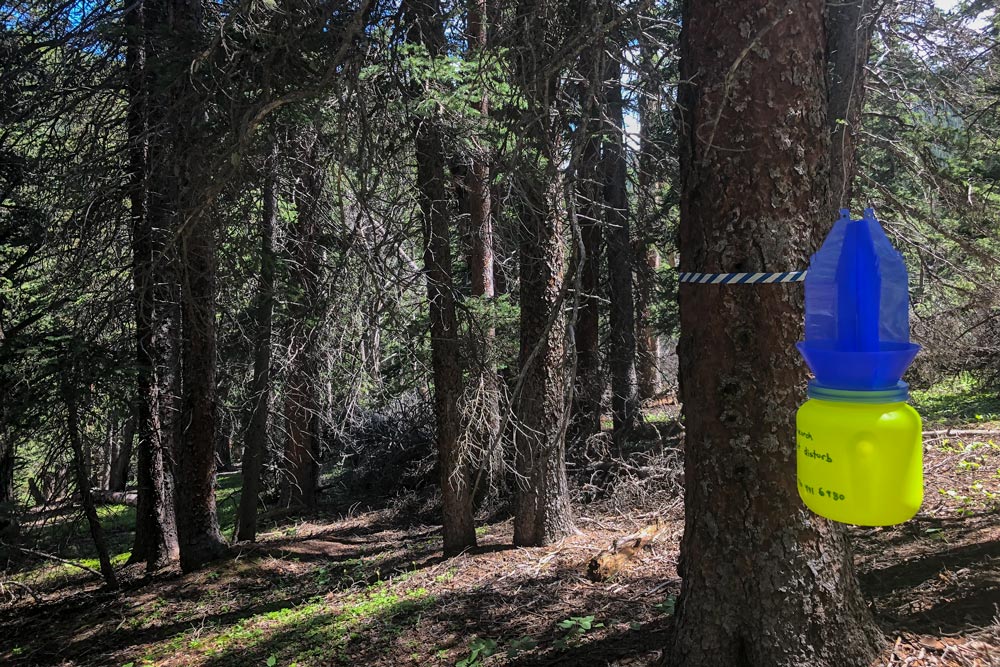
A blue vein trap at one of the study sites. Photo credit: Seth Davis via Colorado State University
A serendipitous observation
Davis regularly works in high-elevation forests. A few years ago, during another research project with department colleagues, he noticed a correlation between the number and diversity of bees observed, and the structure of the forest. He has since opened up this new thread of bee diversity research by combining it with his training in bark beetles.
“Disturbance studies on bees have primarily focused on fire,” said Davis. “There hasn’t been a lot of research looking at bee responses to beetle outbreaks.”
For this new study, his team developed a natural experiment, collecting parallel data in 28 beetle-affected and undisturbed alpine sites in north-central Colorado. They collected bees for two years at three different times across each growing season, and also recorded standard tree measurements and understory, or ground cover, plant data at the collection sites.
A specimen captured in June. Photo credit: Seth Davis via Colorado State University
Davis holds a large Bombus (genus) queen and worker bee among his collection. Photo via Colorado State University
The team found that average floral abundance in spruce beetle-affected stands was 67 percent higher than in non-affected stands. The average number of bee species was also 37 percent greater in beetle-affected stands, with more species present in June than later in the growing season. Davis said the relationship between these insects and their surrounding vegetation may be more complex.
“It appears there are different controls over bee abundance and diversity,” Davis said. “Bee abundance was correlated to the floral species, while the diversity is more related to the forest structure, both of which are affected by bark beetles.”
In other words, bark beetles directly changed the forest structure which indirectly improved wild bee populations by providing a more robust food source for the buzzing insects on the ground.
Spruce beetle-affected forests offer a few advantages for understory plants and wild bees. Tree mortality typically opens up the forest canopy, allowing more light to reach plants and flowers on the forest floor. Dead trees also remain standing for up to 25 years after this disturbance. This offers more cavities for wild bees that nest in trees and dead wood.
Davis said he is interested in exploring this topic further to better understand these relationships over a longer time period and at a larger scale. As forests recover from outbreaks, he would like to see how long this benefit lasts. There is also the size disparity between small bee populations in one locale and the regional magnitude of these disturbances. It will be important to understand how well one small spot predicts these results at the landscape level.
While bees were captured for the purposes of this study, previous research has shown that the bee capture methods employed do not affect the overall bee community.
NOAA’s winter forecast for the U.S. favors warmer, drier conditions across the southern tier of the U.S., and cooler, wetter conditions in the North, thanks in part to an ongoing La Nina. Forecasters at NOAA’s Climate Prediction Center — a division of the National Weather Service — are also closely monitoring persistent drought during the winter months ahead, with more than 45% of the continental U.S. now experiencing drought.
“NOAA’s timely and accurate seasonal outlooks and short-term forecasts are the result of improved satellite observations, more detailed computer forecast modeling, and expanding supercomputing capacity,” said Neil Jacobs, Ph.D., acting NOAA administrator. “From expansive and multi-hazard winter storms to narrow but intense lake effect snow, NOAA will provide the necessary information to keep communities safe.”
Currently, large areas of drought extend over the western half of the U.S., with parts of the Northeast also experiencing drought and near-record low stream flows. With a La Nina climate pattern in place, southern parts of the U.S. may experience expanded and intensifying drought during the winter months ahead.
“With La Nina well established and expected to persist through the upcoming 2020 winter season, we anticipate the typical, cooler, wetter North, and warmer, drier South, as the most likely outcome of winter weather that the U.S. will experience this year,” said Mike Halpert, deputy director of NOAA’s Climate Prediction Center.
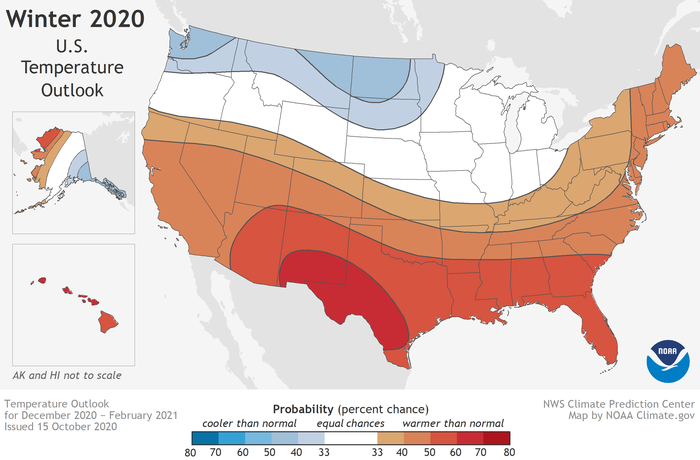
This U.S. Winter Outlook 2020-2021 map for temperature shows above-average temperatures are likely in the South and below-average temperatures likely in parts of the North. (NOAA Climate.gov, using NWS CPC data)
Temperature
The greatest chances for warmer-than-normal conditions extend across the Southern tier of the U.S. from the Southwest, across the Gulf states and into the Southeast. More modest probabilities for warmer temperatures are forecast in the southern parts of the west coast, and from the Mid-Atlantic into the Northeast. Above-average temperatures are also favored for Hawaii and western and northern Alaska.
Below-normal temperatures are favored in southern Alaska and from the northern Pacific Northwest into the Northern Plains, with equal chances for below-, near- or above-average temperatures in the remaining regions.
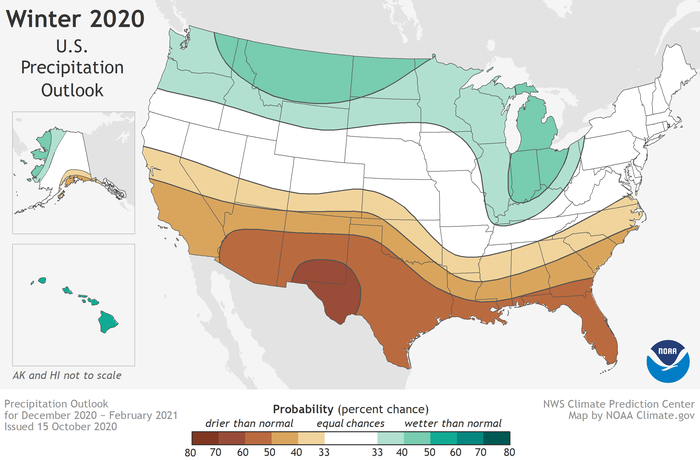
This 2020-2021 U.S. Winter Outlook map for precipitation shows wetter-than-average weather is most likely across the Northern Tier of the U.S. and drier-than-average weather is favored across the South. (NOAA Climate.gov, using NWS CPC data)
Precipitation
Wetter-than-average conditions are most likely across the northern tier of the U.S., extending from the Pacific Northwest, across the Northern Plains, Great Lakes and into the Ohio Valley, as well as Hawaii and northern Alaska. The greatest chances for drier-than-average conditions are predicted in the Southwest, across Texas along the Gulf Coast, and in Florida. More modest chances for drier conditions are forecast in southern Alaska, and from California across the Rockies, Central Plains and into the Southeast. The remainder of the U.S., including the Mid-Atlantic and Northeast, falls into the category of equal chances for below-, near-, or above-average precipitation.
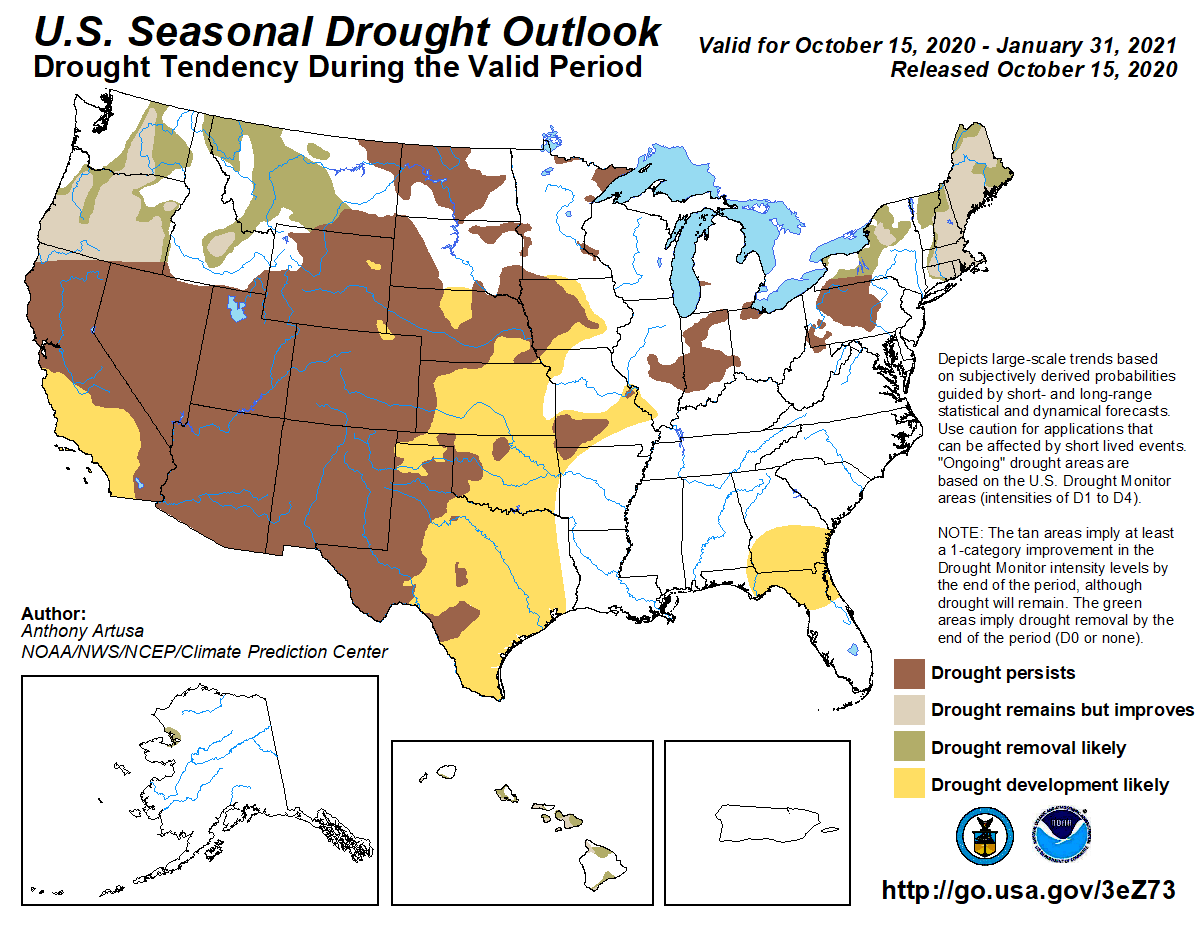
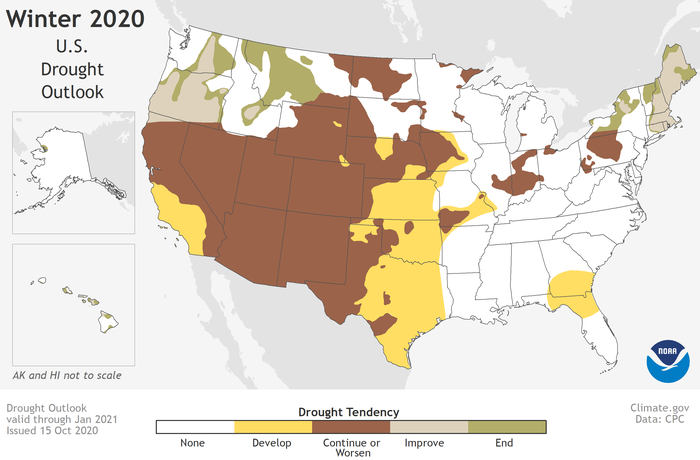
This seasonal U.S. Drought Outlook map for November 2020 through January 2021 predicts persistent drought across much of the Western U.S. in the months ahead. (NOAA Climate.gov based on NWS CPC data)
Drought
Widespread, ongoing drought is currently in place across the western half of the continental U.S. as a result of the weak Southwest summer monsoon season and near-record-high temperatures. Drought is also present in parts of the Northeast, Ohio Valley, Hawaii and Alaska. The ongoing La Nina is expected to expand and intensify drought across the southern and central Plains, eastern Gulf Coast, and in California during the months ahead. Drought conditions are expected to improve in the northern Rockies, Northwest, New England, Alaska and Hawaii over the coming months.
The most widespread drought in the continental United States since 2013 covers more than 45 percent of the Lower 48 states, federal scientists said.
Nearly half of the continental United States is gripped by drought, government forecasters said Thursday, and conditions are expected to worsen this winter across much of the Southwest and South.
Mike Halpert, deputy director of the Climate Prediction Center, a part of the National Oceanic and Atmospheric Administration, said a lack of late-summer rain in the Southwest had expanded “extreme and exceptional” dry conditions from West Texas into Colorado and Utah, “with significant drought also prevailing westward through Nevada, Northern California and the Pacific Northwest.”
Much of the Western half of the country is now experiencing drought conditions and parts of the Ohio Valley and the Northeast are as well, Mr. Halpert said during a teleconference announcing NOAA’s weather outlook for this winter.
This is the most widespread drought in the continental United States since 2013, he said, covering more than 45 percent of the Lower 48 states.
“The winter forecast doesn’t bode well,” Mr. Halpert added. Warmer and drier conditions are expected across the South and Southwest and drought is likely to develop in parts of Georgia and Florida and in Central and Southern California, where the dry conditions could add to the risk of wildfire in what has already been a catastrophic year for fires in California.
But northern parts of the country may see some relief, with wetter conditions predicted across most of the north, said David Miskus, a NOAA drought specialist…
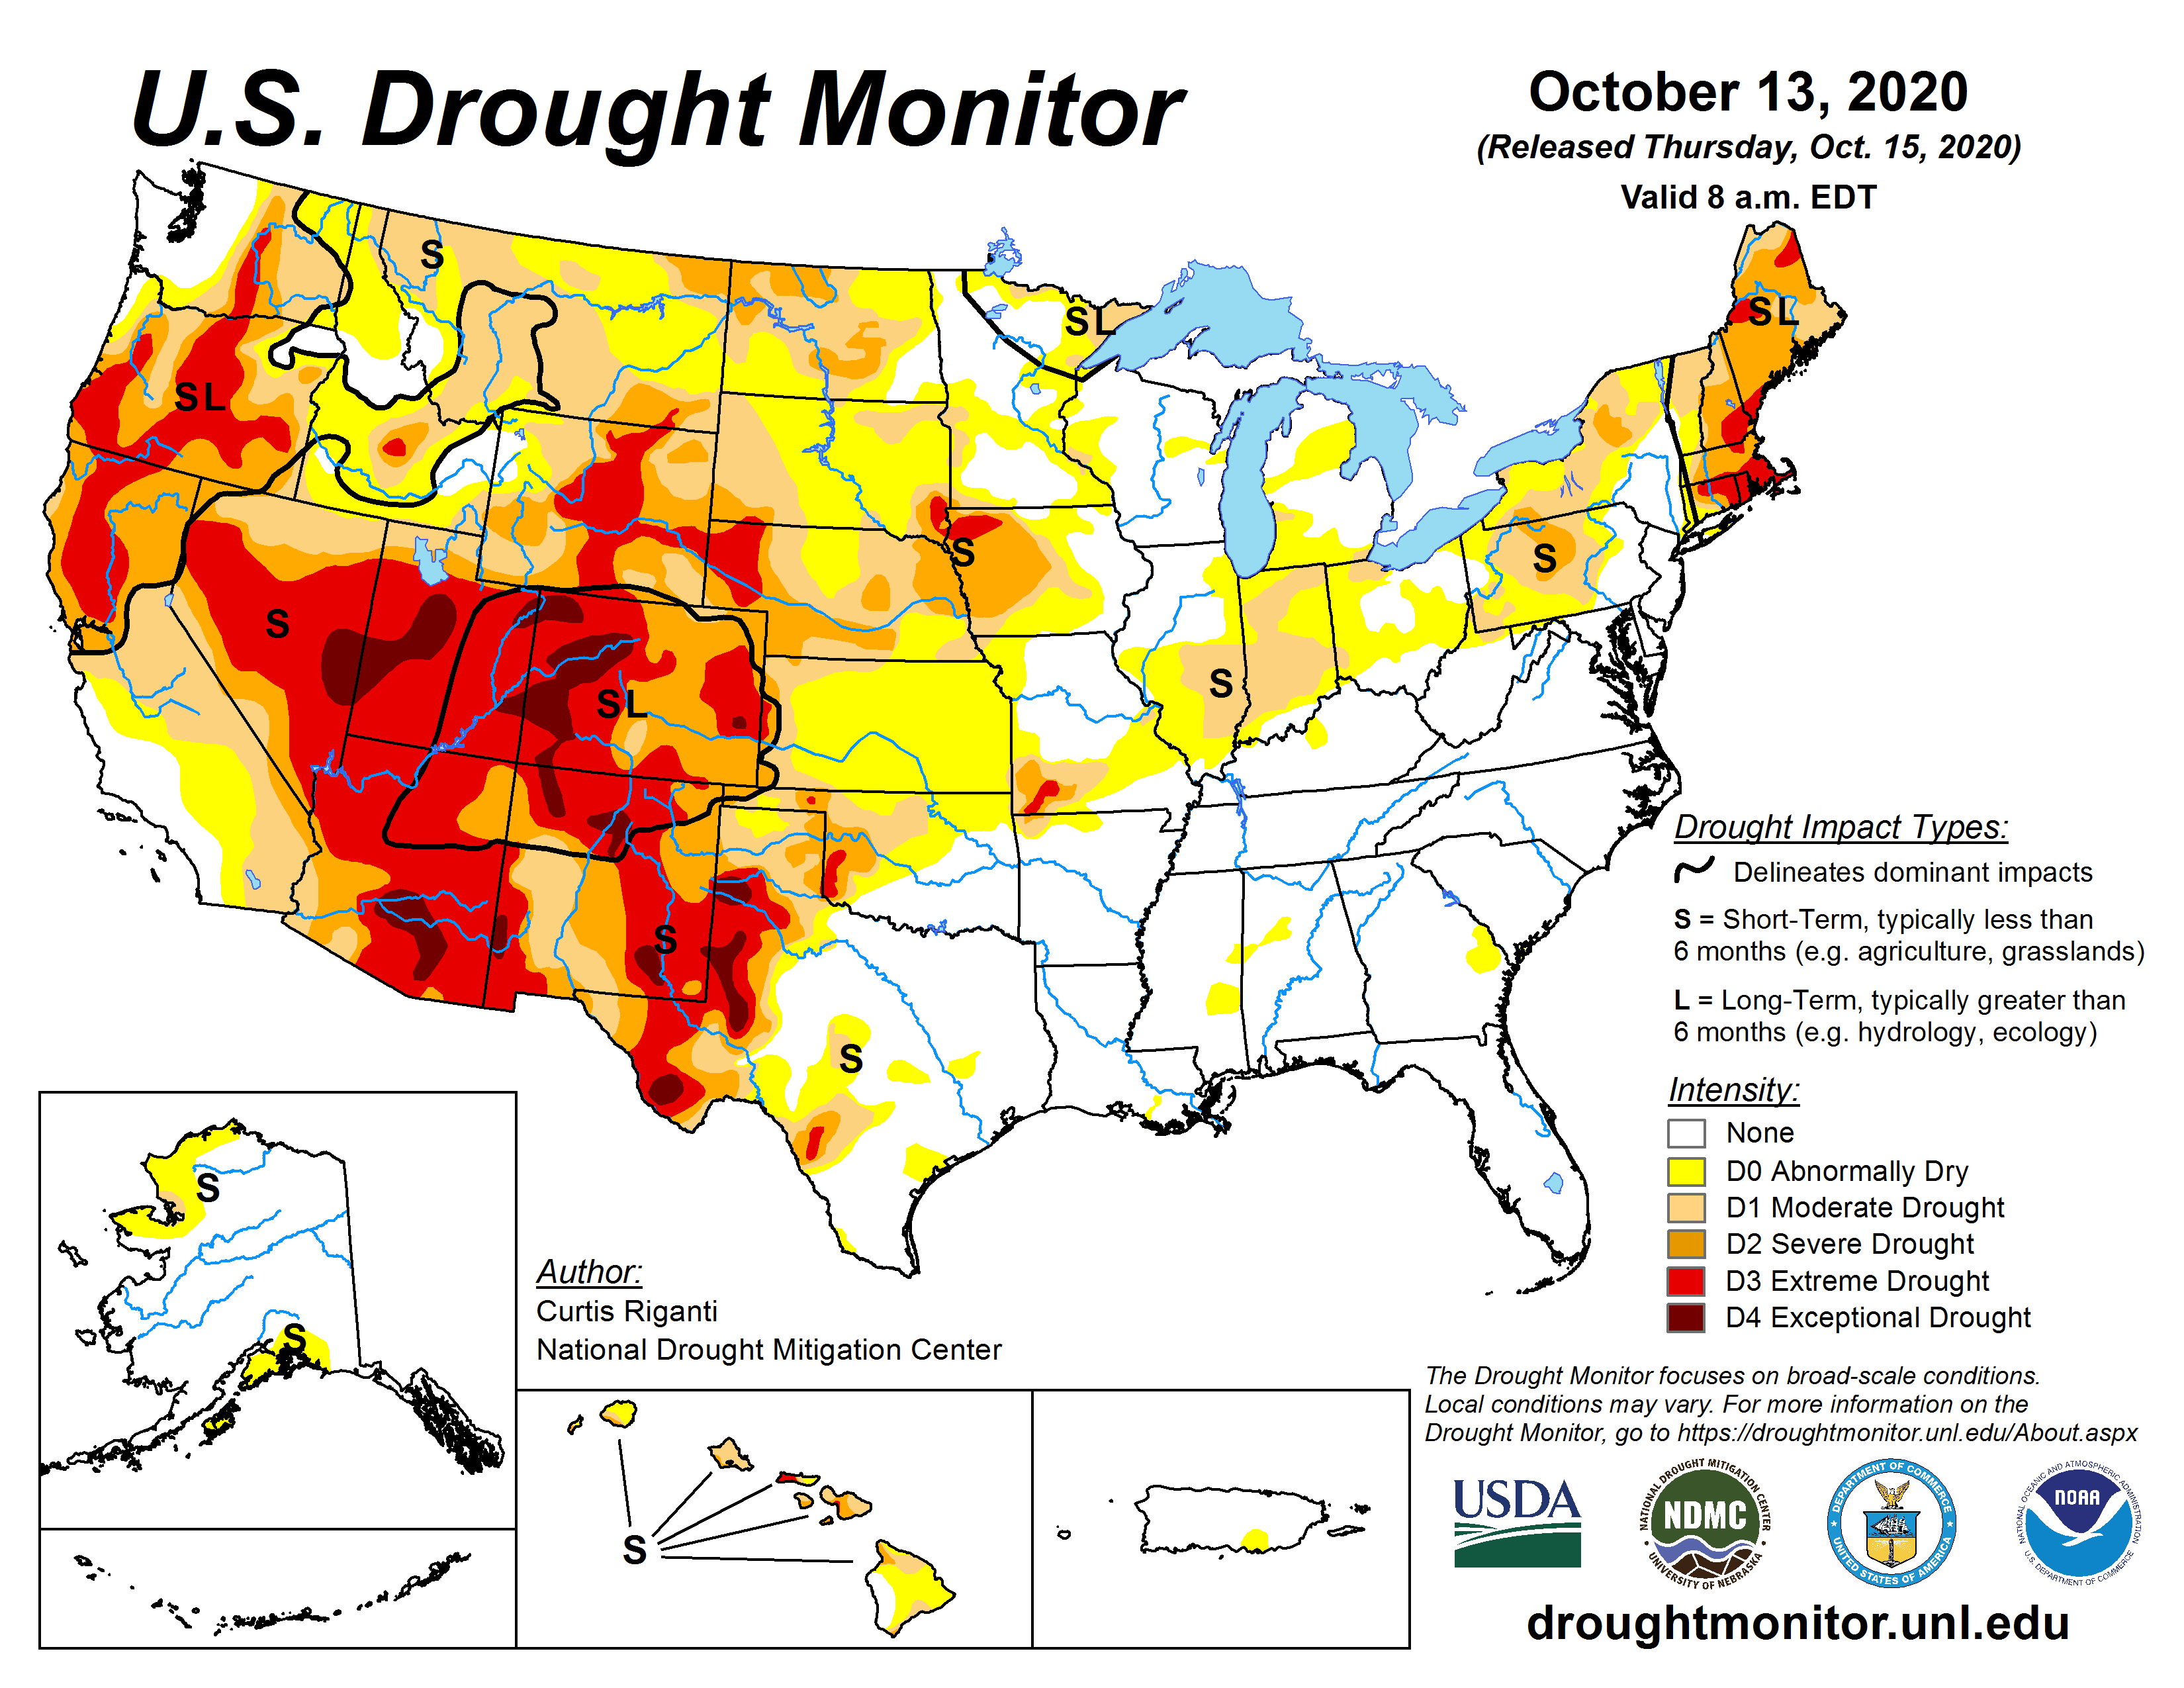
US Drought Monitor October 13, 2020.
The American Southwest has been mired in drought for most of the past two decades. Studies suggest that the region is experiencing an emerging megadrought, similar to some periods in the past 1,200 years, when droughts persisted for 40 years or longer.
Global warming has made drought worse, in the Southwest and elsewhere, scientists say, exemplifying a trend toward more extreme weather as the climate changes.
Mr. Halpert said the likelihood of worsening drought this winter can be linked to La Niña, which developed in August and is expected to persist at least through the winter.
Standley Lake in Westminster. May 14, 2019. As Colorado emerged from drought in 2018, its reservoirs were struggling to refill. The ongoing drought, which shows no signs of easing this fall, has left Colorado’s reservoirs at just 84 percent of average capacity statewide, down from 112 percent of average last year at this time. Credit: Jerd Smith, Fresh Water News
Colorado’s reservoirs are 25 percent lower than they were last year at this time, as a hot, dry summer continues into the fall.
Statewide reservoir levels are at 84 percent of average, according to the USDA’s Natural Resources Conservation Service Sept. 30 report, well below last year’s mark, when they stood at 112 percent of average.
The 2020 water year, which began Oct. 1, 2019, and ended Sept. 31, is now Colorado’s third driest on record, trailing behind only 2018 and 2002 for lack of precipitation, according to Peter Goble, service climatologist and drought specialist at Colorado State University’s Colorado Climate Center.
“The water year was certainly drier than average. We finished it out with some pretty startling hot, dry conditions,” Goble said.
Colorado averaged 13.09 inches of precipitation in water year 2020, which was 72 percent of the 18.01-inch historical average, Goble said.
It was also the 12th warmest year on record, with much of that warmth concentrated in the summer and early fall during a poor monsoon season, Goble said.
August, in particular, was extremely hot — it was the hottest August on record in Colorado since 1895, when record-keeping began.
Denver Water’s storage system has held up reasonably well this year, thanks to standard watering restrictions and a strong snowpack in 2019.
Denver’s reservoirs are 82 percent full, not far below the 87 percent average for this time of year, according to Nathan Elder, Denver Water’s water supply manager.
Since 2002, Denver Water has implemented drought rules that prohibit outdoor watering between 10 a.m. and 6 p.m. and encourage residents to water no more than three days a week from May 1 to Oct. 1. The water utility also has tiered rates to encourage conservation.
“We’ve had one of the hottest, driest summers and, despite that, our customers have still been really careful with their water use. We didn’t see extreme demand this year, despite the extreme weather,” said Elder, who added that a strong 2019 water year carried over into 2020 storage.
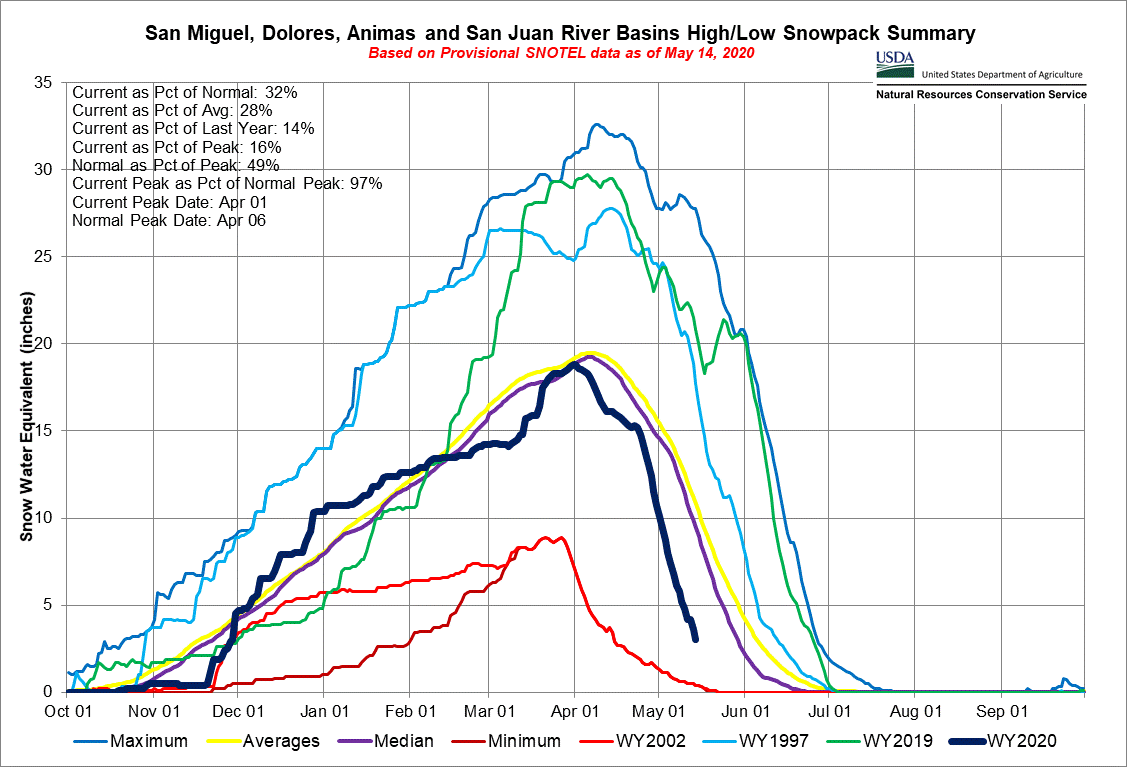
In the southwestern part of the state, however, reservoir storage levels are much lower. In the San Miguel, Dolores, Animas and San Juan river basins, reservoir storage levels finished September at 59 percent of average; in the nearby Upper Rio Grande Basin, levels were 67 percent of average.
Much of the state continues to experience severe, extreme and exceptional drought conditions, according to the U.S. Drought Monitor.
The lack of precipitation, hot temperatures and high levels of evaporation have left Colorado’s soils very dry, which has made winter wheat farming and ranching a challenge, Goble said.
“A number of ranchers across the state have had to sell cattle, and winter wheat for the coming season has had to be drilled in in many locations because the soil moisture is too lacking to plant conventionally,” Goble said.
It has also been a bad year for wildfires, with two of the largest fires on state record — the Pine Gulch and Cameron Peak fires — occurring this year.
The record-breaking snowstorm much of Colorado saw on Sept. 8-9 was helpful, but didn’t ultimately make a big difference for drought conditions, even in places like the San Luis Valley, which logged up to 14 inches in some places.
“It was one of the biggest snowstorms on record in the Alamosa area, regardless of time of year, so it did improve drought conditions in the San Luis Valley, but in an ecosystem that’s so streamflow fed and reliant on seasonal snowpack, it didn’t provide the level of relief that a good seasonal snowpack would,” Goble said.
Looking ahead, climate scientists are forecasting weak La Nina conditions and warmer-than-average temperatures continuing into the fall and winter.
A weak La Niña likely means more snow for Colorado’s northern mountains and less snow for the southern mountains, Eastern Plains and Front Range, although the exact conditions are hard to predict, Goble said.
“Even a strong La Niña doesn’t guarantee us a good winter in the Northern Rockies,” he said. “We could still see anything from quite dry to quite wet. It tilts the scale a little bit on the wet side for places like up near Steamboat and even Summit County, but it’s not as strong a predictor in Colorado as it is in some other places, like the Pacific Northwest.”
Spring 2021 is likely to be a repeat of last year, with parched soils soaking up more runoff, according to Karl Wetlaufer, a hydrologist with the National Resources Conservation Service.
“It’s very, very dry and we do expect that to carry into the spring and how that affects our streamflow runoff next spring,” he said. “A lot of that snowmelt will be absorbed into the soil structure and may not make it to the streams. If we have a near-normal snowpack again, we would expect less-than-normal runoff with the severe drought that we’re going into winter with.”
Sarah Kuta is a freelance writer based in Longmont, Colorado. She can be reached at sarahkuta@gmail.com.
EL NIÑO/SOUTHERN OSCILLATION (ENSO) DIAGNOSTIC DISCUSSION
issued by
CLIMATE PREDICTION CENTER/NCEP/NWS and the International Research Institute for Climate and Society 8 October 2020
ENSO Alert System Status: La Niña Advisory
Synopsis: La Niña is likely to continue through the Northern Hemisphere winter 2020-21 (~85%chance) and into spring 2021 (~60% chance during February-April).
La Niña continued during September, as evidenced by below-average sea surface temperatures (SSTs) extending from the Date Line to the eastern Pacific Ocean. The SST indices in the two westernmost Niño regions, Niño-4 and Niño-3.4, cooled throughout the month, and the Niño-3.4 index was -1.1C in the past week. The equatorial subsurface temperature anomalies (averaged from 180°-100°W) remained substantially unchanged, and continued to reflect below-average temperatures from the surface to 200m depth in the eastern Pacific Ocean. The atmospheric circulation anomalies over the tropical Pacific Ocean remained consistent with La Niña. Low-level wind anomalies were easterly across most of the tropical Pacific, and upper-level wind anomalies were westerly over the east-central Pacific. Tropical convection continued to be suppressed from the western Pacific to the Date Line, and a slight enhancement of convection emerged over Indonesia. Also, both the Southern Oscillation and Equatorial Southern Oscillation indices remained positive. Overall, the coupled ocean-atmosphere system indicates the continuation of La Niña.
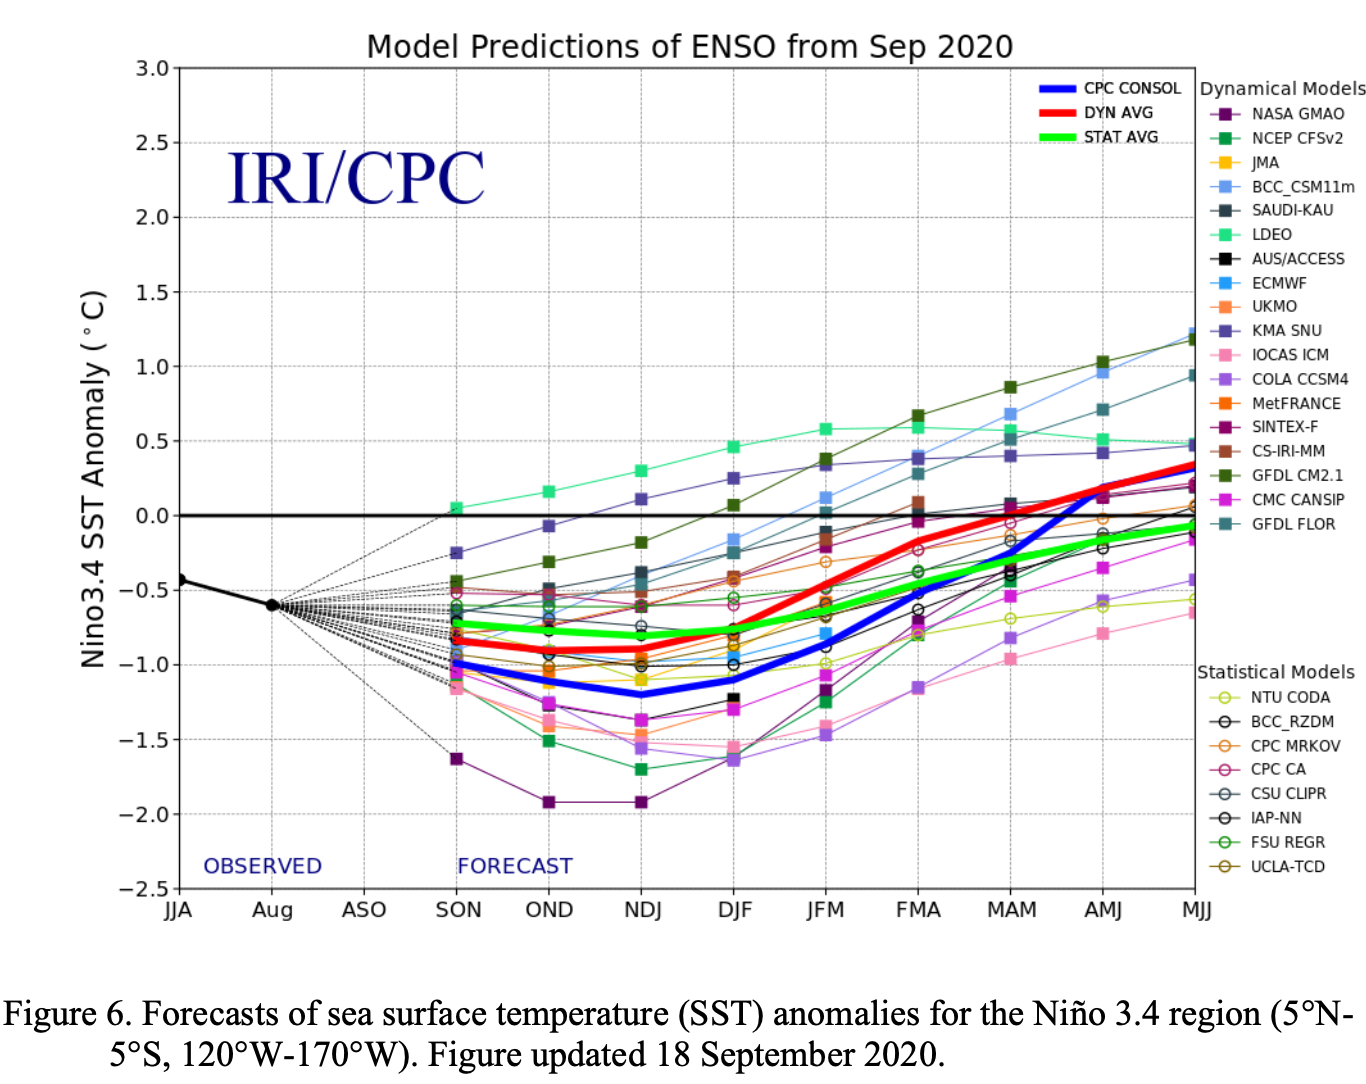
A majority of the models in the IRI/CPC plume predict La Niña (Niño-3.4 index less than -0.5°C) to persist through the Northern Hemisphere winter 2020-21 and to weaken during the spring. The latest forecasts from several models, including the NCEP CFSv2, suggest the likelihood of a moderate or even strong La Niña (Niño-3.4 index values < -1.0C) during the peak November-January season. The forecaster consensus supports that view in light of significant atmosphere-ocean coupling already in place. In summary, La Niña is likely to continue through the Northern Hemisphere winter 2020-21 (~85% chance) and into spring 2021 (~60% chance during February-April; click CPC/IRI consensus forecast for the chances in each 3-month period).
La Niña is anticipated to affect temperature and precipitation across the United States during the upcoming months (the 3-month seasonal temperature and precipitation outlooks will be updated on Thurs. October 15th).
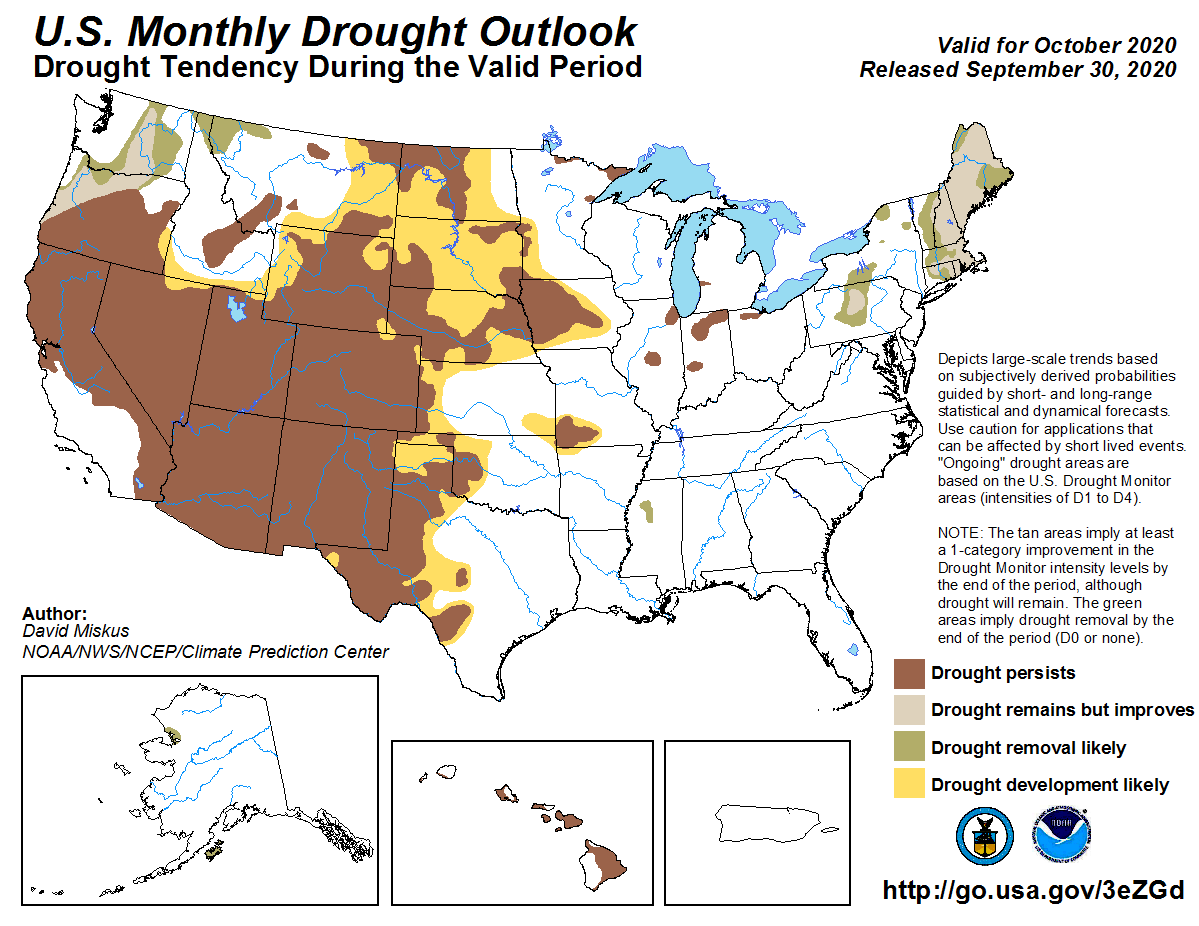
Click on a thumbnail graphic to view a gallery of drought data from the US Drought Monitor.
US Drought Monitor October 13, 2020.
West Drought Monitor October 13, 2020.
Colorado Drought Monitor October 13, 2020.
Click here to go to the US Drought Monitor website. Here’s an excerpt:
This Week’s Drought Summary
A dry pattern continued this past week over large portions of the continental United States, with a few exceptions being areas impacted by Hurricane Delta or its remnants, parts of the Upper Midwest and middle Missouri River Valley, and parts of the Northeast. In areas of the Northeast that received an inch or two of rain, some improvements were made in the ongoing drought areas there. As a storm system and associated cold front brought showers and thunderstorms to parts of the Middle and Upper Missouri River Valley and to the Upper Midwest, some improvements were made to ongoing drought there. Abnormal dryness abated in a few areas of Louisiana and Mississippi, which received copious rainfall from Hurricane Delta. Degradations or persistence of ongoing drought was common in parts of the Midwest, Great Plains, and West that received little or no precipitation this week. Temperatures this week were warmer than normal across most of the Lower 48. The central Great Plains and middle Missouri River Valley were the warmest compared to normal, with temperatures from 9 to 12 degrees above normal common. New England experienced milder conditions this week, with a few below-normal readings taking place in northern Vermont, New Hampshire, and Maine…
The West generally experienced warmer than normal temperatures again this week, with most areas coming in between 3 and 9 degrees above normal for the week. Generally, the southern half of the region stayed dry, while some precipitation occurred over the north, particularly in far northwest California, western Washington and Oregon, western Wyoming, and western portions of Montana and Idaho. Due to recent precipitation, extreme drought in western Oregon reduced in coverage. In southwest Oregon, where short- and long-term precipitation deficits were worsening, severe and extreme drought increased in coverage. Extreme drought also increased its foothold in west-central Nevada, where soil moisture profiles continued to worsen along with short- and long-term precipitation deficits…
Drier than normal conditions continued across much of the High Plains region, where temperatures were also generally 6 to 12 degrees warmer than normal. Consequently, as short- and long-term precipitation deficits grew amid warmer than normal weather, and near surface moisture and agricultural impacts worsened, widespread degradation in drought conditions occurred. Moderate, severe, and extreme drought coverage increased across most of the region, with the exception of northeast Nebraska and adjacent portions of Iowa and South Dakota, where a storm system brought locally high amounts of rain. In the areas with highest rainfall, short-term precipitation deficits improved enough such that extreme and severe drought decreased in coverage…
Category two Hurricane Delta and its remnants delivered above-normal rainfall from far east Texas through most of Mississippi, southeast Arkansas, and southern Tennessee, leading to the reduction of abnormally dry areas in Louisiana and Mississippi. Elsewhere, dry conditions occurred, and existing areas of drought expanded. Short-term drought continued to plague the southern high plains regions of Oklahoma and Texas, where moderate, severe, and extreme drought continued to spread amid worsening short-term precipitation deficits, decreasing soil moisture, and drying vegetation. Temperatures in the region were also mostly warmer than normal, with the warmest areas (compared to normal) being found in the Oklahoma and Texas panhandles, where temperatures were 9 to 12 degrees warmer than normal…
Looking Ahead
A series of cold fronts over the next week are forecast to bring a higher chance of cooler than normal temperatures to the north-central continental United States. With the exception of the northern tier of states, much of the West is forecast to be dry through the evening of October 19. Farther east, higher rainfall amounts of a half an inch or more are possible from the Mid-Atlantic coast north, while lighter precipitation is forecast in the Midwest. Glancing ahead to the October 20-24 period, cooler than normal conditions are more likely to be widespread from the Pacific Northwest to the western Great Lakes, while in the eastern United States, warmer than normal temperatures are favored in this period. Widespread increased chances for above-normal precipitation are forecast in the northern Rockies and much of the Great Plains, Midwest, and East, while below-normal or near-normal precipitation is favored elsewhere in the Lower 48.
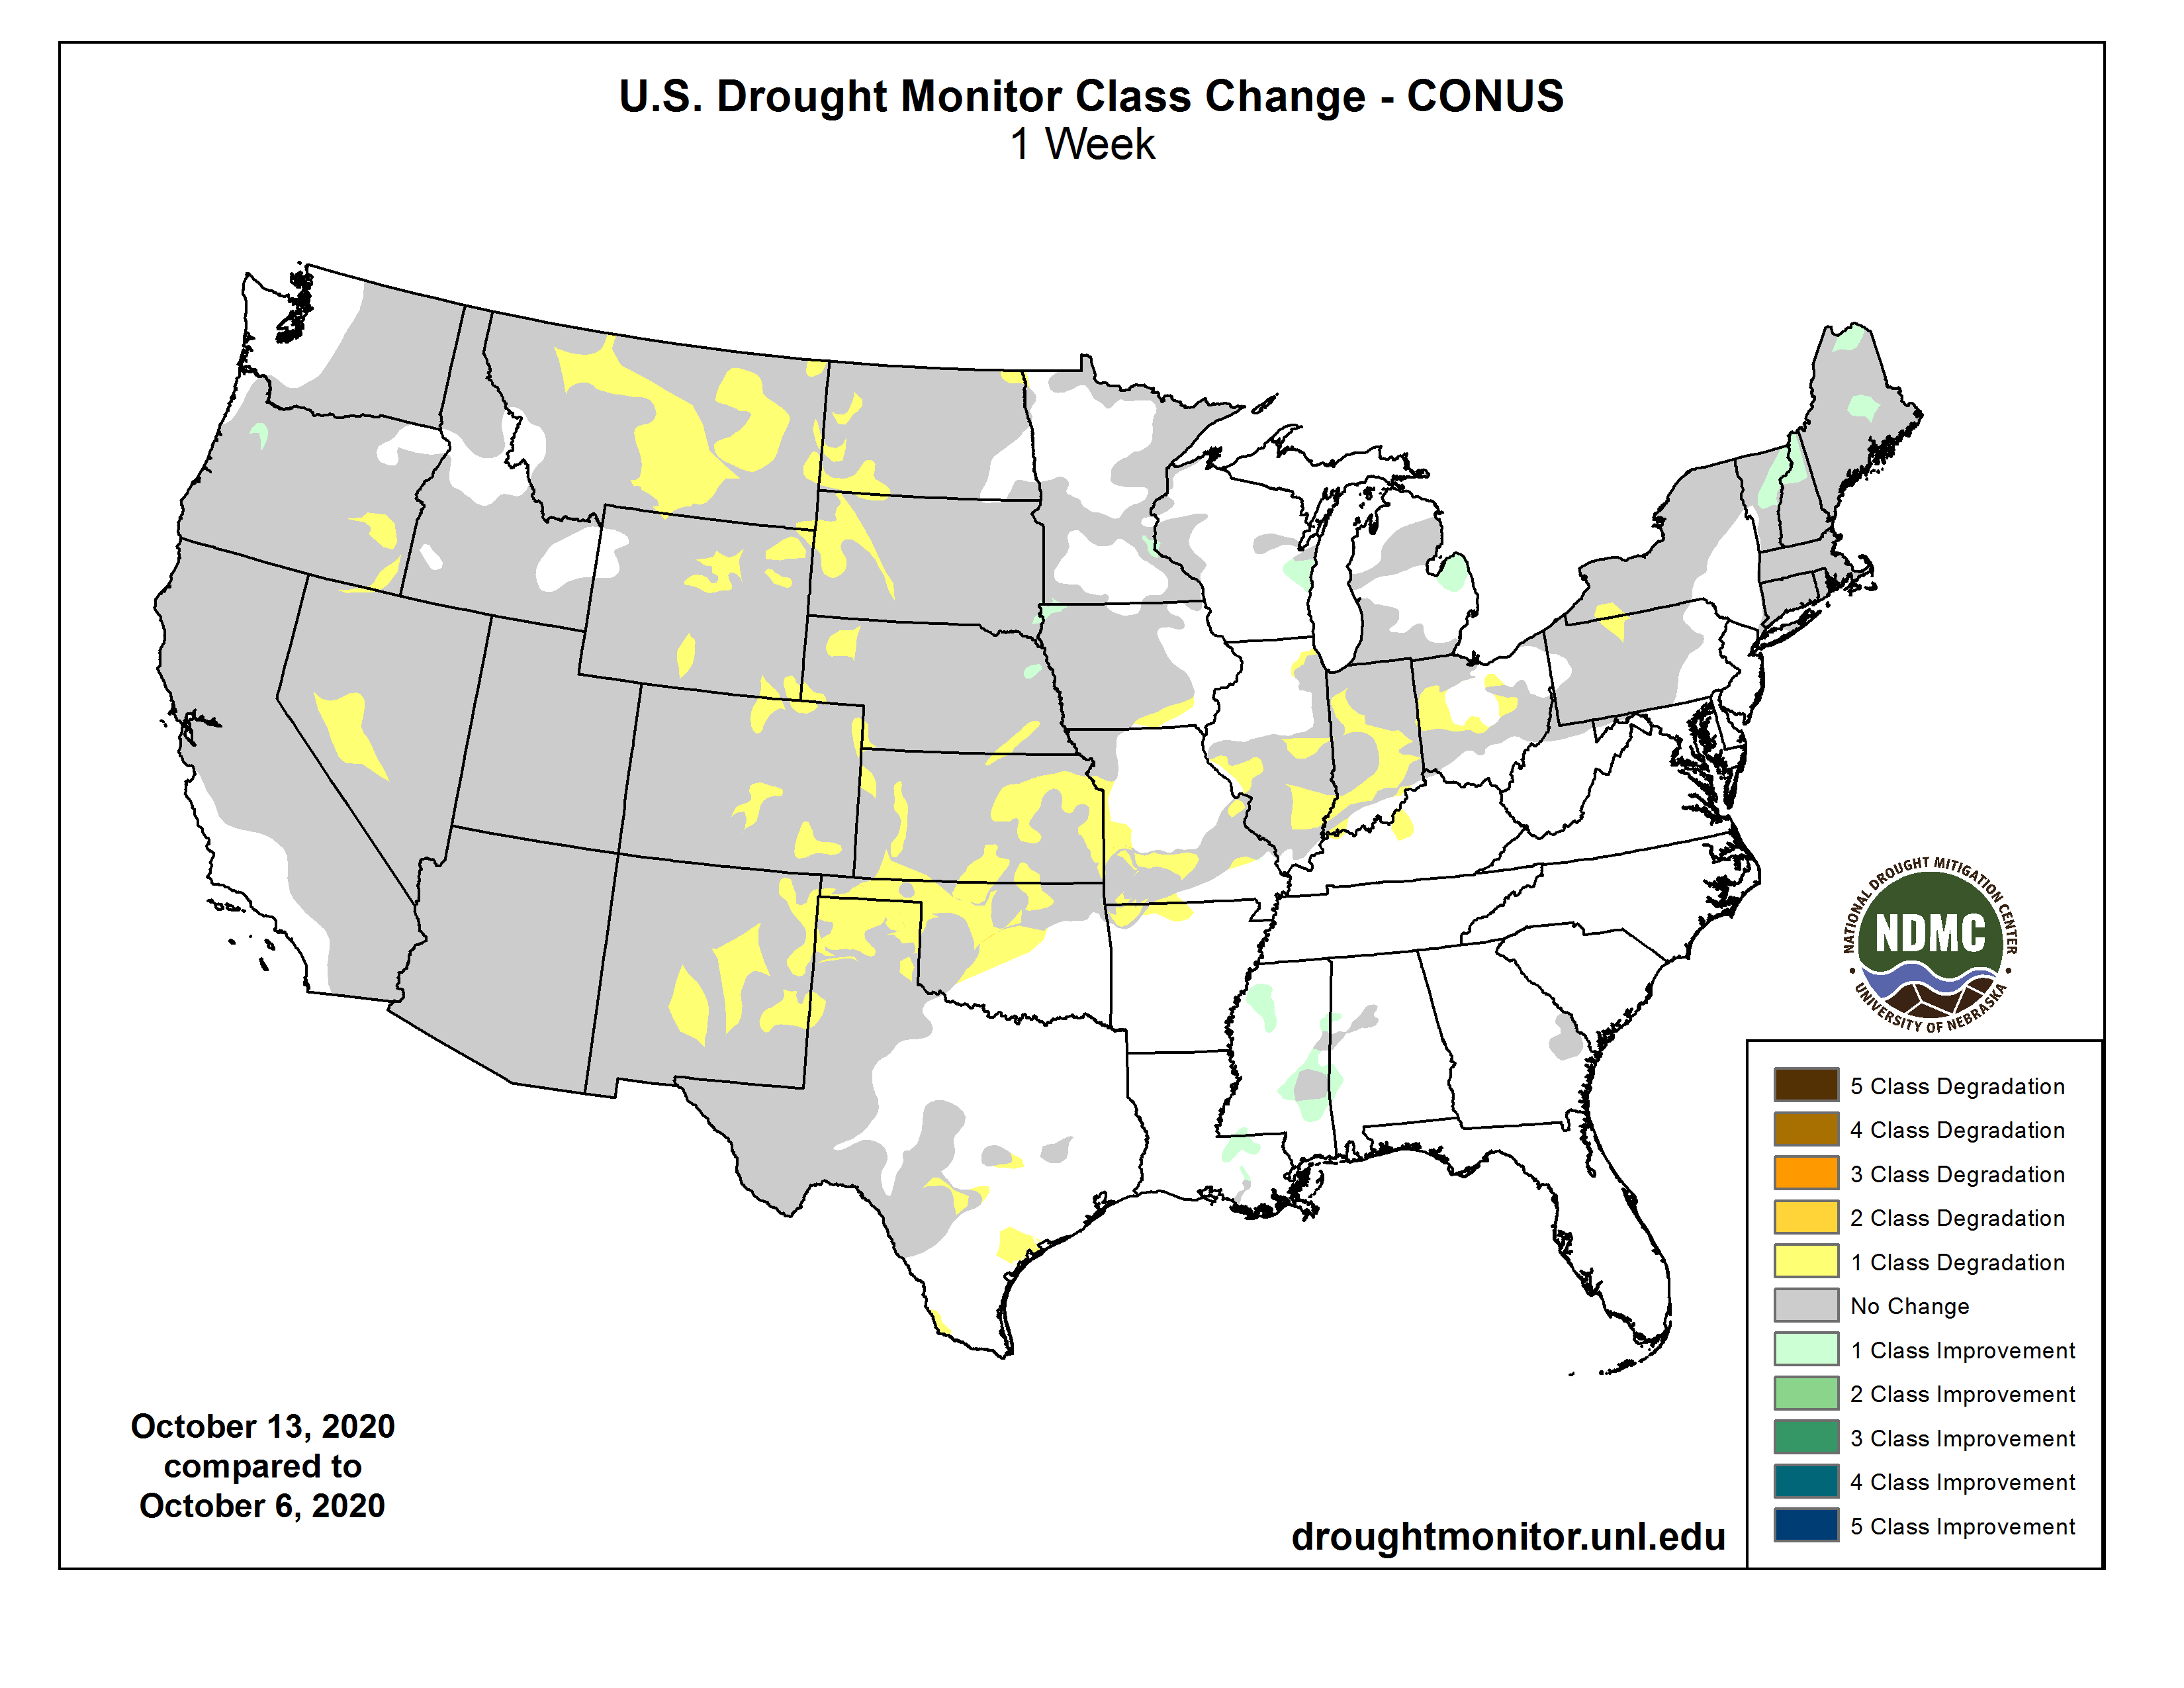
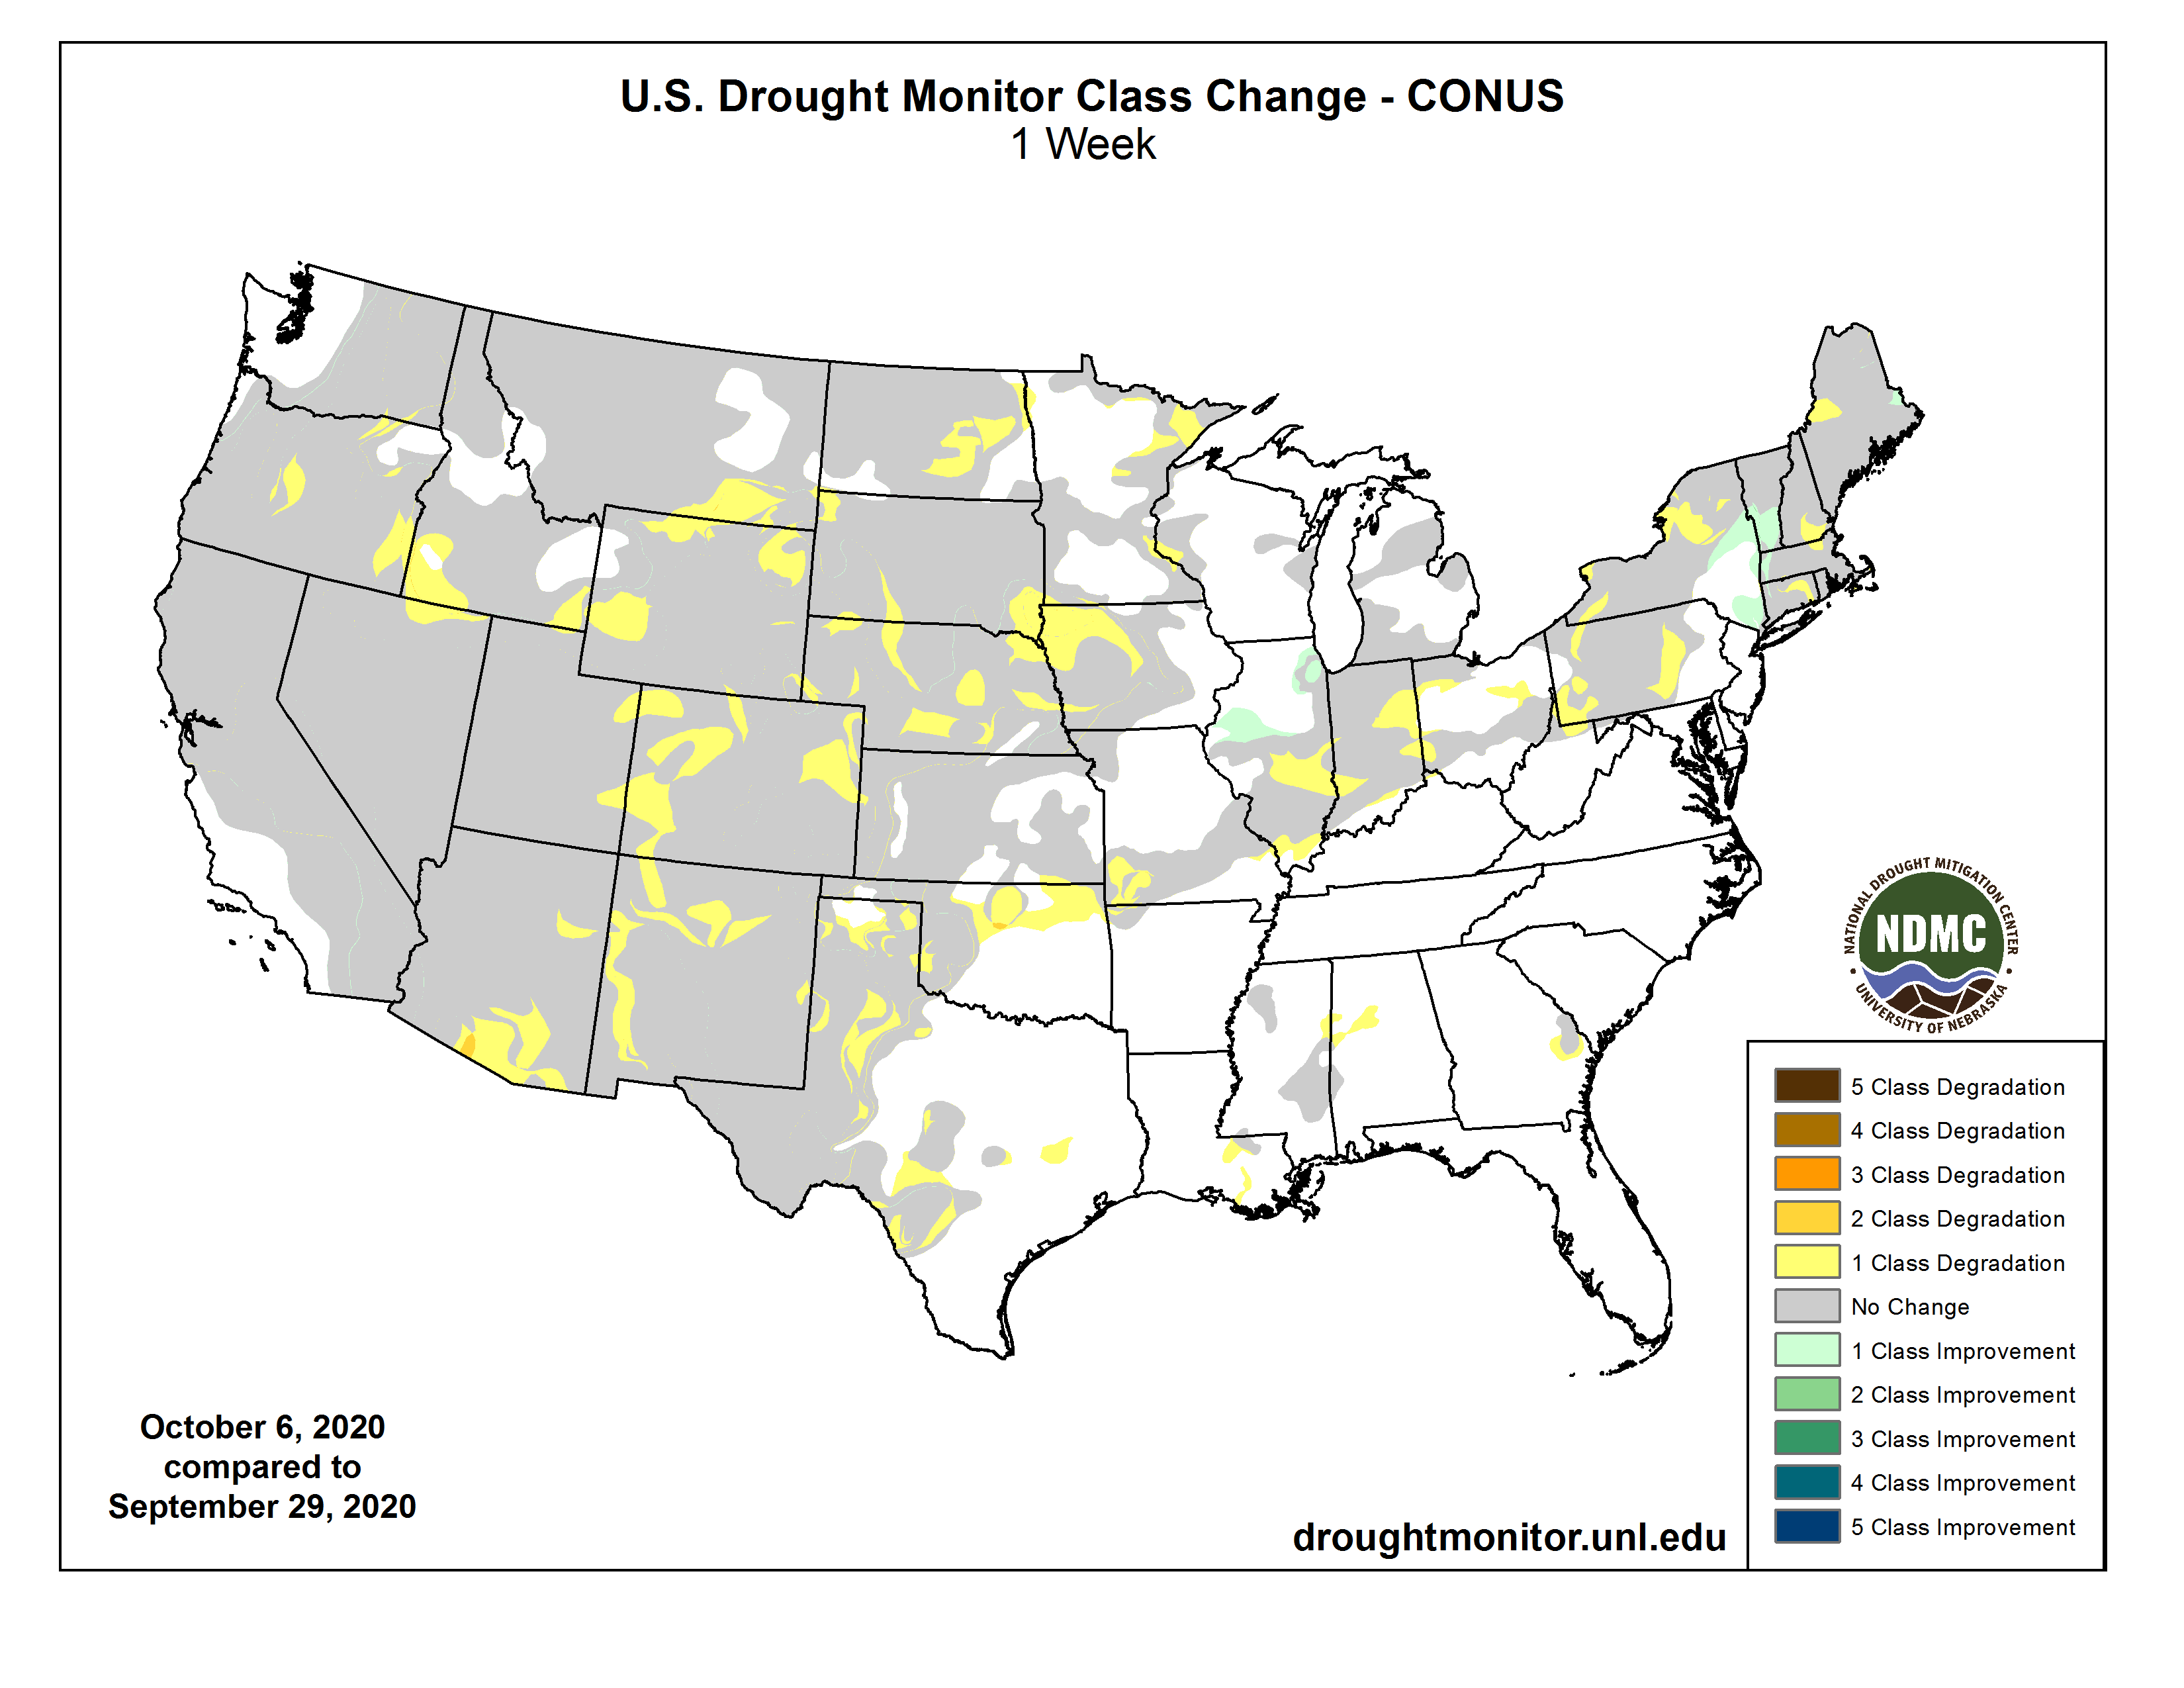
US Drought Monitor one week change map ending October 13, 2020.
With 3 months left, 2020 could rank among three-warmest years on record for globe
Unprecedented heat around the world vaulted September 2020 to the hottest September since 1880, according to scientists at NOAA’s National Centers for Environmental Information.
The month’s warmth also contributed to 2020’s trend as a remarkably hot year, with the year-to-date global temperatures running second highest in the 141-year climate record.
Below are more facts and stats from NOAA’s latest monthly global climate report:
Climate by the numbers
September 2020
The average global temperature in September was 1.75 degrees F — 0.97 of a degree C — above the 20th-century average of 59.0 degrees F (15.0 degrees C).
This surpasses the average global temperatures for both September 2015 and 2016 by 0.04 of a degree F (0.02 of a degree C), which previously tied for the hottest Septembers on record.
The 10-warmest Septembers have all occurred since 2005, with the seven-warmest Septembers occurring in the last seven years.
The year to date | January through September 2020
The year-to-date (YTD) average global temperature was the second hottest on record at 1.84 degrees F (1.02 degrees C) above the 20th-century average. This is only 0.07 of a degree F (0.04 of a degree C) shy of the record set for the same YTD in 2016.
The Northern Hemisphere’s YTD temperature tied with 2016 as the hottest on record, while the Southern Hemisphere saw its fourth hottest YTD.
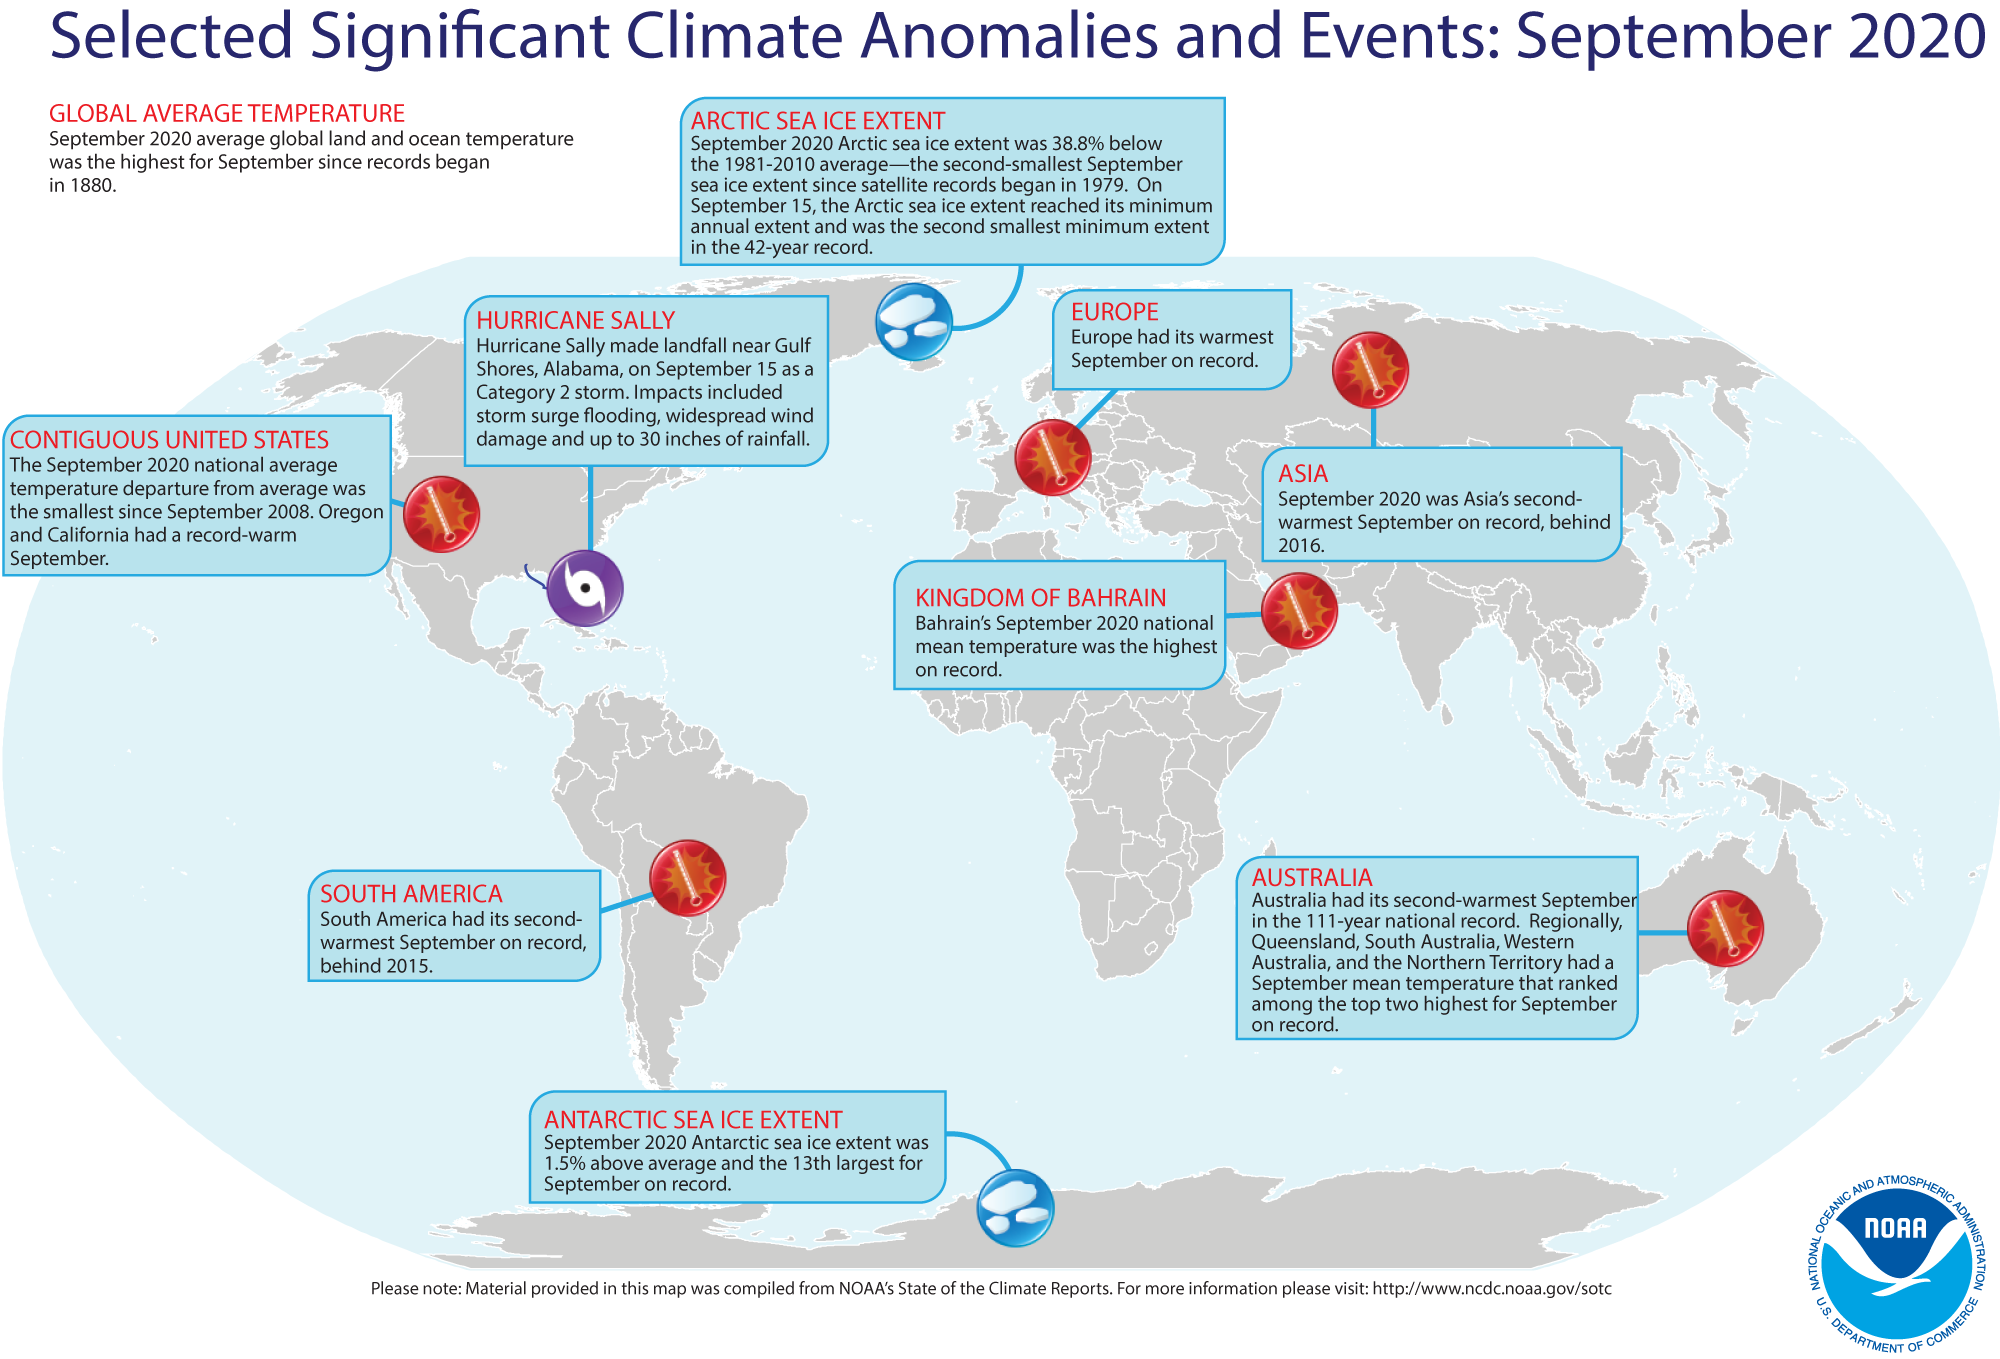
A map of the world plotted with some of the most significant weather and climate events that occurred during September 2020. For more details, see the bullets below in this story and more from the NCEI report at http://bit.ly/Global092020.
More notable climate facts and stats
Arctic sea ice was at near-record lows: Average Arctic sea ice coverage (extent) for September ranked second smallest on record. On September 15, sea ice covered just 1.44 million square miles of the Arctic, the second-smallest minimum extent on record behind September 17, 2012. The 14 smallest minimum annual extents have occurred in the last 14 years.
A record-hot YTD so far for some: Europe, Asia and the Gulf of Mexico had their warmest January-through-September period on record; South America and the Caribbean region had their second highest. No land or ocean areas had record-cold YTD temperatures.
Photo credit: Colorado Department of Natural Resources
Here’s the release from the Colorado Department of Natural Resources (Chris Arend):
The Colorado Department of Natural Resources (DNR) announced today a new initiative to increase public safety around low head dams which have caused a number of accidents and fatalities on Colorado rivers in recent years. The effort includes new and planned signage around targeted low head dam sites, emergency responder education, public outreach and partnerships with private and non-profit organizations, local municipalities, and landowners and the launch of a new interactive map and webpage on DNR’s website: https://dnr.colorado.gov/colorado-low-head-dams
“DNR’s low head dam initiative is a positive step to increase public safety and awareness around low head dams across Colorado,” said Dan Gibbs, Executive Director, Colorado Department of Natural Resources. “Colorado has seen an increase in outdoor recreation in recent years, particularly on our rivers and streams, but this has also led to tragic fatalities on some of our low head dam structures. These fatal accidents are avoidable and are a strong motivation for our Department to increase our public outreach and education initiatives. While some of our efforts are already underway, we know we need to do more to educate Coloradans to reduce these unfortunate accidents and ensure all Coloradans can safely recreate in our great outdoors.”
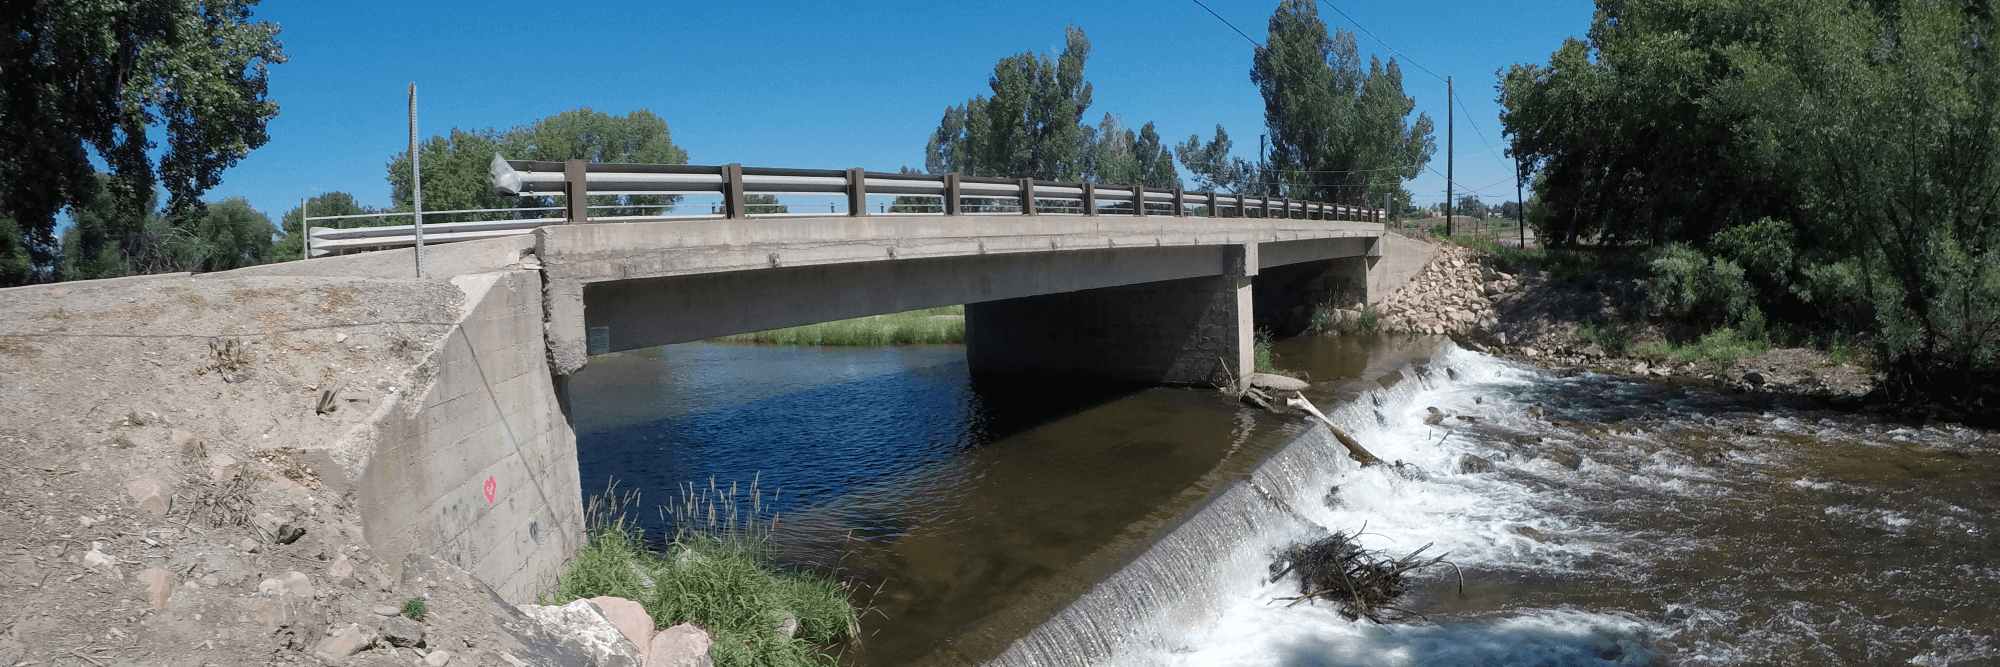
Low head dams are engineered structures built into and across Colorado’s stream and river channels for a variety of purposes, including to divert water from streams for agricultural purposes, protect stream channels from degradation and provide recreational amenities.
Low head dams, sometimes referred to as the quintessential “drowning machines,” can be dangerous because water flowing over dams produces recirculating currents that can trap recreators. Rafters, kayakers and those floating our rivers for recreation are often unaware of these structures and the dangers resulting from them.
Low head dams can be difficult to detect by river users approaching from upstream due to their height, and the fact that the relatively tranquil pool they create provides no indication of the dangers just beyond the visual horizon created by the dam and ponded water. This can limit reaction time and boaters’ ability to exit the river upstream of the dam.
General currents upstream and downstream from a low-head dam. Graphic via Bruce a. Tschantz
“I appreciate the work being done by the Department of Natural Resources to address public safety at low head dams. Colorado rivers and streams are an enormous amenity for both water enthusiasts and fishermen,” said Ruth Wright, former Colorado legislator, public safety advocate and founder of Wright Family Foundation. “The low head dam initiative will provide valuable information to the public to help to prevent tragic and needless harm from the dangerous hydraulics of low head dams.”
Several high profile incidents in Colorado in recent years, including 4 fatalities, and 13 since 1986 point to the need for increased education and outreach efforts as well as closer coordination with local emergency responders. The average ages of those involved with low head dam-related incidents are between 13 and 30 years of age. DNR and a private ditch company recently installed warning signs at a low head diversion dam on the South Platte River adjacent to the Jean K. Tool State Wildlife Area. This diversion dam between Ft Morgan and Brush is the site of unfortunate drowning fatalities in 2016 and 2019.
“The Ditch and Reservoir Company Alliance (DARCA) is proud to work alongside the Department of Natural Resources and the water community at large through this initiative,” remarked Amber Weber, DARCA Executive Director. “Some of DARCA’s members have been touched by the loss of life due to a low head dam structure, and irrigators know the dangers a low head dam has. DARCA is glad to take part in this effort as agriculturalists join with recreationalists to make our waters safe to traverse.”
In response to these incidents, the DNR formed the Colorado Low Head Dam Safety Steering Committee to address safety issues around low head dams. The team of experts included; Colorado Water Conservation Board, Division of Water Resources – Dam Safety Branch, and Colorado Parks and Wildlife, Colorado Division of Homeland Security and Emergency Management (DHSEM), Colorado Office of Outdoor Recreation, the Mile High Flood District, and Wright Water Engineers. The Steering Committee oversaw the inventory study of Colorado low head dam sites, which identified and digitized the locations of diversion, grade control, and recreational structures across Colorado.
The Low Head Dam webpage on DNR’s website includes an interactive map produced from the inventory study enabling Coloradans to research and locate potential low head dam structures before embarking on trips down their favorite river or stream. The webpage includes additional resources on low head dams, links to partner organizations, and a feedback form for Coloradans to help identify missed features on Colorado Rivers which could be included on the interactive low head dam map.
“American Whitewater has been pleased to partner with DNR on this low head dam inventory project. Safe enjoyment of our nation’s rivers is central to our mission,” said Hattie Johnson, Southern Rockies Stewardship Director, American Whitewater. “We hope to integrate the data into our web based national whitewater inventory to help river users plan for and avoid these hazards. We are hoping to help crowdsource information to prioritize low head structures and to find solutions to improve their safety.”
DNR’s low head dam outreach initiative is funded in part from a $31,250 Colorado Water Conservation Board, Colorado Water Plan grant, matched with $20,000 from FEMA’s National Dam Safety Program state assistance grant and $15,000 of in-kind services from Wright Water Engineers, and a generous $20,000 donation from the Wright Family Foundation for additional signage. These donations will help future efforts including ongoing public education, increased outreach during spring months, when the Colorado recreation water season is in full swing, installation of warning signage both above and below highly visited low head dam structures, and additional outreach and education for emergency responders.
La Niña’s reign continues in the tropical Pacific, with an approximately 85% chance of lasting through the winter. Forecasters currently think this La Niña will be on the stronger side.
Let’s check in with the tropical Pacific
The temperature of the ocean surface in the Niño3.4 region was about 0.8°C cooler than the 1986–2015 average, according to the ERSSTv5 dataset. We monitor the Niño3.4 index with a few different temperature datasets—more on that here—but they are all comfortably below the La Niña threshold of -0.5°C. The three-month-average Niño3.4 index, called the Oceanic Niño Index (remember this for later!) was -0.6°C. The Oceanic Niño Index is our primary metric for the El Niño/Southern Oscillation, aka ENSO, the whole El Niño/La Niña ocean/atmosphere system.
September 2020 sea surface temperature departure from the 1981-2010 average. Lots of cool water at the equator in the Pacific. Image from Data Snapshots on Climate.gov.
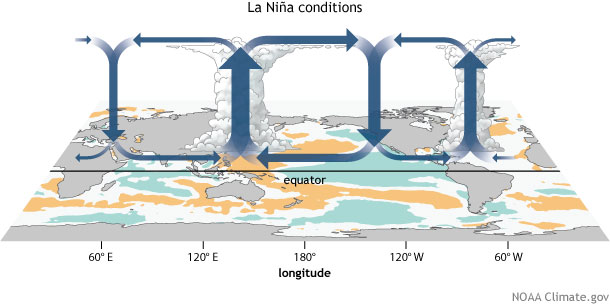
The atmosphere is responding to La Niña’s cooler-than-average ocean surface. A strengthened Walker circulation is what we expect with La Niña conditions, and it’s what we have: air rising vigorously over the very warm western Pacific, traveling eastward high up in the atmosphere, sinking over the cooler central-eastern Pacific, and traveling back westward near the surface.
Generalized Walker Circulation (December-February) anomaly during La Niña events, overlaid on map of average sea surface temperature anomalies. Anomalous ocean cooling (blue-green) in the central and eastern Pacific Ocean and warming over the western Pacific Ocean enhance the rising branch of the Walker circulation over the Maritime Continent and the sinking branch over the eastern Pacific Ocean. Enhanced rising motion is also observed over northern South America, while anomalous sinking motion is found over eastern Africa. NOAA Climate.gov drawing by Fiona Martin.
Near-surface winds along the tropical Pacific (the trade winds) were stronger than average through the month of September and into early October, as were upper-level winds over the east-central Pacific. The two indexes we use to measure the change in sea-level pressure between the western and eastern Pacific, the Southern Oscillation Index and the Equatorial Southern Oscillation Index were positive, indicating the presence of more rising air (lower surface pressure) over the west and more sinking air (higher surface pressure) over the east—more evidence of an enhanced Walker circulation.
What’s on deck
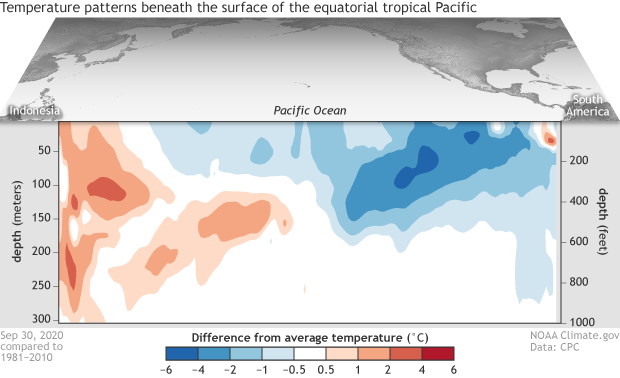
Most of the dynamical computer model forecasts predict that La Niña will last through the winter and diminish in the spring. Also, there remains a substantial amount of cooler-than-average water under the surface of the central-eastern Pacific. This will provide a source of cooler water for the surface, giving confidence to the forecast that La Niña will continue.
Difference from average (1981-2010) temperatures in the upper 300 meters (980 feet) of the tropical Pacific Ocean for the 5-day period centered on September 30, 2020. The vertical axis is depth below the surface (meters) and the horizontal axis is longitude, from the western to eastern tropical Pacific. This cross-section is right along the equator. Climate.gov figure from CPC data.
Several computer models are predicting the Oceanic Niño Index will be, at its peak in November–January, more than 1.0°C cooler than the long-term average. We don’t have specific strength definitions for ENSO, but generally, a deviation of more than 1.0°C (1.8°F) from the long-term mean is considered a moderate-to-strong event. Stronger ENSO events don’t necessarily increase the strength of global weather and climate impacts, but they do increase the likelihood that those impacts will occur.
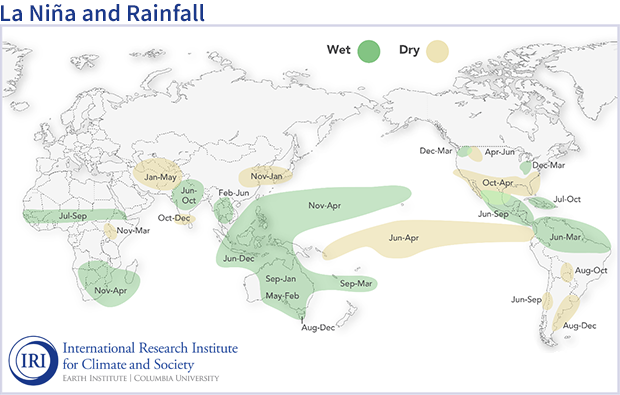
Speaking of impacts…
The altered atmospheric circulation of ENSO affects global weather (here’s how that works in general and La Niña in specific). Since ENSO can be predicted months ahead of time, a lot of research has gone into understanding the patterns of ENSO’s global weather impacts. The idea is that if we can predict ENSO, we can get an early picture of what global weather could look like months into the future.
A recent study by some of our colleagues at the International Research Institute for Climate and Society (IRI), led by Nathan Lenssen, carefully re-assessed global precipitation (rain, snow, etc.) patterns during ENSO events. They looked at La Niña and El Niño impacts separately, because the impacts are not always opposite. Meaning, although El Niño may be related to a wet winter in one location, La Niña doesn’t necessarily mean a dry winter in that location.
Their study included every ENSO event from 1951–2016 where the peak strength, represented by the Oceanic Niño Index, was at least 1.0°C (for El Niño) or -1.0°C (for La Niña). This excludes weak or borderline ENSO events, when the atmospheric changes are not as consistent.
La Niña conditions in the tropical Pacific are known to shift rainfall patterns in many different parts of the world. The regions and seasons shown on this map indicate typical but not guaranteed impacts of La Niña. For further information, consult the probabilistic information that the map is based on. Image from the International Research Institute for Climate and Society (IRI).
Nathan’s team assembled this map, which may look familiar to ENSO Blog readers. While maps like these are very important for an overview of La Niña’s impacts, some people may need more information about how often the impacts occurred during past La Niña events. Fortunately, the IRI team has made this information available. You can select the three-month period, El Niño or La Niña, and above/below average precipitation, and the map will show you how often this impact has occurred. For example, 70% of past La Niña winters in Florida were drier than average. Warning—that maproom can be quite a time sink!
Turning impacts maps—either the one shown above, or probabilistic ones like on the IRI site—into an actual forecast can be a complicated process. (The second half of the IRI study assessed the accuracy of a few different forecasts based on ENSO impacts maps.) Official climate outlooks, like those from the Climate Prediction Center, take into consideration ENSO impacts, computer model forecasts, and knowledge of other climate patterns.
One thing you can be sure about is that we’ll be right here, keeping you posted on La Niña 2020/21 as it evolves! Well, I might be in the IRI maproom.
Click here to read the newsletter. Here’s an excerpt:
The Colorado River District works across • The Lower Gunnison Project near Montrose,
the West Slope to improve infrastructure and restore rivers as part of its work to protect water supplies for all stakeholders.
During the District’s Annual Water Seminar: Zooming in on West Slope Water on Sept. 22, speakers highlighted three projects that with the help of many partners, advance the District’s mission to protect Western Colorado’s water security.
• The Elkhead Reservoir expansion near Hayden and Craig, completed in 2006, provides water for irrigators and the power industry while ensuring water is available to maintain river flow for endangered fish in the lower Yampa River.
• The Lower Gunnison Project near Montrose Delta and Hotchkiss, is a multi-benefit project spearheaded by the District to modernize irrigation delivery systems.
• The Windy Gap Bypass Channel Project in Grand County, still on the drawing board, will modify Windy Gap Reservoir to re- create a Colorado River channel and nearby flood plain.
Click here to go to the Intermountain West Climate Dashboard (scroll down for the latest briefing):
Water Year 2020 Summary (UT, WY, CO)
The 2020 water year was characterized by drier conditions and lower runoff than the drought-busting, high snowfall year that preceded. High 2019 seasonal runoff volumes left regional reservoir storage above average; reservoir storage at the beginning of the 2020 water year was 109% of average in Colorado, 127% of average in Utah and above average in Wyoming. Despite high snowfall and above average precipitation in the 2019 water year, June – September precipitation was much below average for most of the region. This left regional soil moisture values much below normal at the beginning of the 2020 water year Western US Seasonal Precipitation. In northern Utah and the Upper Green River basin in Wyoming, soils were wetter than other locations, but still below average. Soil moisture values in southern Utah and western Colorado were much below average (<25th percentile).
Total precipitation for the 2020 water year was below normal with much of the region seeing less than 70% of normal precipitation Western US Seasonal Precipitation. Western Wyoming was the one location in the region that received near-normal precipitation. Water year average temperatures were a mix of slightly-above and slightly-below normal Western US Seasonal Precipitation. In Wyoming, temperatures were 1-3°F below normal, while temperatures in much of Colorado were with 1°F of normal. Along the Wasatch Front and in central Utah, temperatures were 1-2°F above normal. Significant snowfall began during October in portions of the Colorado Rockies; accumulating snows for the remainder of the region began in November when much of the region, especially southern Utah, received much-above average snowfall. By April 1st, 2020, snow water equivalent (SWE) was near normal for most SNOTEL sites in the region Western US Seasonal Precipitation. Central and northern Colorado saw the greatest regional snowfall where many sites had 125 – 150% of average SWE on April 1st.
On April 1st, the Colorado Basin River Forecast Center forecasted near normal seasonal runoff volumes for the Upper Colorado, Upper Green, Bear, Yampa and White Rivers Western US Seasonal Precipitation. Other locations in the Great and Upper Colorado River basins were forecasted to see below normal runoff (60-90% average). As of April 1st, seasonal runoff forecasts were lower relative to average compared to SWE values. For example, SNOTEL sites along the Upper Colorado River were 125-150% of average on April 1st, but the seasonal runoff volume was forecasted at 90-110% of normal. This is referred to as an inefficient runoff, where above normal SWE does not translate into above normal runoff. The forecast of a relatively inefficient runoff in 2020 was in part caused by very low soil moisture values before snow began to accumulate in October – November 2019. Seasonal runoff volumes in 2020 turned out to be much lower than originally forecasted in April. The June 2020 water supply outlook, which is very close to the actual seasonal runoff volume, forecasted below to much-below normal runoff for the Great and Upper Colorado River basins Western US Seasonal Precipitation. Except for the Mainstem Colorado, Upper Green and Yampa River basins, seasonal runoff volumes in the Upper Colorado River and Great Basins were less than 60% of normal.
The dramatic change in seasonal runoff forecasts from April to June 2020 was caused by extremely warm and dry conditions in April – June 2020. Snow typically continues to accumulate at the higher elevations in April and May, but in 2020, warm and dry conditions melted existing snowpack at a faster rate and little additional snow accumulated in the region after April 1st. Dry conditions continued through the remainder of the water year. Much of Utah and portions of western Colorado and central Wyoming saw the driest April – September period on record Western US Seasonal Precipitation. April – September 2020 precipitation was in the bottom 10% of years for nearly all of Colorado and Utah and over half of Wyoming. Although temperatures averaged over the entire 2020 water year were generally near average, April – September 2020 temperatures were much above normal (hottest 10% of years since 1895) for most of Utah and the western two-thirds of Colorado.
The combination of low water-year precipitation and much above average temperatures since April caused a significant expansion and intensification of drought in the second half of the water year. On October 1st 2019, drought conditions covered only a portion of southern Utah and southwestern Colorado, with D0 conditions covering additional area in eastern Utah, southwestern Wyoming and Colorado. By the end of the 2020 water year, the entire region was under drought conditions (>D1) except for a small portion of northern Wyoming Western US Seasonal Precipitation. As of October 6th, 2020, D3 drought covers 46% of the three state region and D4 drought covers 10% of the region. Over the last 20 years of US Drought Monitor data, the current drought is one of the worst on record, in terms of regional coverage and severity. Current drought conditions are slightly more severe than in October of 2012 and 2018, but not as severe as the 2002 drought. In October 2002, D3 drought covered 63% of the region and D4 drought covered 19% of the region.
Latest Briefing – October 13, 2020 (UT, WY, CO)
Continued below average precipitation during September caused further worsening of drought conditions; extreme (D3) drought covers 46% and exceptional drought covers 10% (D4) of the region. Entering the 2021 water year, the current regional drought ranks among the worst in the last 20 years (2002, 2012, 2018). La Niña conditions currently exist and there is a 70-80% probability of La Niña conditions persisting through early winter. Drought conditions are expected to persist and potentially worsen as there is an elevated probability for below normal precipitation and above normal temperatures for the next three months.
Most of Colorado, Utah and Wyoming experienced below average precipitation during September Western US Seasonal Precipitation. The driest conditions occurred in Utah, where nearly the entire state received less than 25% of normal precipitation. September precipitation in Wyoming was below average with the driest conditions found in southern and western Wyoming. In Colorado, September precipitation ranged from near-average to much-below average. Isolated storms brought average to slightly-above average precipitation to several locations in central Wyoming and southern and eastern Colorado. Precipitation during July – September was very low;. July – September 2020 was the driest on record for areas of eastern Utah, northwestern Colorado and central Wyoming Western US Seasonal Precipitation. Precipitation was much below normal (driest 10% of years since 1895) for nearly the entire region.
Temperatures cooled relative to normal in September compared to previous months Western US Seasonal Precipitation. Except for a few isolated locations, September temperatures were within two degrees of normal in Colorado and Wyoming, and in eastern Utah and parts of central Utah. Along the Wasatch Front and in southwestern Utah, September temperatures were 2-4 degrees above normal. Temperatures during July – September were generally much above average, with most of Utah, Colorado and western Wyoming seeing temperatures that were in the top 10% of hottest July – September periods since 1895. Several locations in all three states, especially in southern Utah, saw the hottest July – Septembers on record Western US Seasonal Precipitation.
Streamflow in most regional river basins was below normal during September. Utah and western Colorado saw the lowest regional streamflow with most sites reporting below average (10 – 25th percentile) or much-below average (< 10th percentile) conditions. Some locations in northern Utah and along the mainstem of the Colorado and Arkansas Rivers saw near-normal (25th - 75th percentile) streamflow. Streamflow in Wyoming was a mix of below and near normal conditions during September. Regional reservoir storage remains relatively high as of October 1st, despite drought conditions across the entire region and low water year precipitation. On a statewide basis, reservoirs are at 82% of normal capacity in Colorado, 107% of normal capacity in Utah and generally above average capacity in Wyoming. Storage on large reservoirs in the Upper Colorado River Basin remains variable with Flaming Gorge Reservoir relatively full (85% capacity, 99% of average), Blue Mesa Reservoir below normal (53% capacity, 76% of average) and Lake Powell half-empty (47% capacity, 62% of average).
Drought conditions worsened in parts of Colorado and Utah during September. Some improvement to drought conditions occurred in western Wyoming and eastern Colorado Western US Seasonal Precipitation. Colorado saw the greatest regional degradation in drought conditions during September; D4 drought emerged in western Colorado and D3 drought expanded slightly. Nearly all of Colorado is in D1 drought, 43% of the state is in D3, or extreme drought, and 17% of the state is in D4, or exceptional drought. A one category improvement in drought conditions occurred in some areas of eastern Colorado. In Utah, D4 drought expanded significantly in central Utah and two areas of D4 drought emerged in eastern Utah. D4 drought now covers 16% of Utah. D3 drought expanded northward slightly and a one category improvement in drought conditions occurred in northern Utah. Drought conditions in much of Wyoming remain unchanged, but a one category improvement in drought occurred in western Wyoming. Northwestern Wyoming remains the only portion of the region unaffected by drought.
A major wildfire started in the Medicine Bow Mountains of southwestern Wyoming on September 17th. As of October 8th, the Mullen Fire burned 170, 996 acres in Wyoming and Colorado and was 14% contained. In August, the Pine Gulch Fire near Grand Junction, CO burned 151,000 acres, making it the largest fire in Colorado’s history.
During September, sea surface temperatures were below average in the eastern Pacific Ocean, indicating La Niña conditions. Most models for Pacific Ocean temperatures forecast below normal ocean temperatures during fall and early winter Western US Seasonal Precipitation. Early October ENSO forecasts predict a 90% probability of La Niña conditions through early winter and above a 60% probability of La Niña conditions through late winter to early spring Western US Seasonal Precipitation. On the one-month timescale, there is an increased probability for below normal precipitation for the entire region, with a greater chance of reduced precipitation in the eastern portion of the region Western US Seasonal Precipitation. On the three-month timescale, there is a slight increase in the probability of below normal precipitation for the southern half of Utah and most of Colorado, largely due to the influence of La Niña conditions Western US Seasonal Precipitation. On one-month and three-month timescales, there is an increased probability of above average temperatures for the entire region.
Significant September weather event. On September 8th, a strong upper-level low pressure system brought a sharp cold front to the region, which caused extremely cold temperatures, snow and high winds from the Front Range of Colorado to the Wasatch Front and further west into Oregon and Washington. Prior to the storm, much of the region experienced record to near-record temperatures in the 90s and low 100s. On September 8th, Denver, CO reported 1” of snow, the second earliest snowfall and a record low temperature of 31°F. Up to 9” of snow fell in the foothills of the Front Range and 5.6” of snow was measured in Boulder. In Wyoming, as much as 12” of snow fell in Centennial and a record 1.1” of snow fell in Cheyenne which tied the earliest snowfall for Cheyenne. Along the Wasatch Front, the storm caused a significant downslope wind event, in which winds blow from the east and accelerate as they travel down the western slope of the Wasatch Mountains. Wind gusts reached 89 mph at the University of Utah and 77 mph at the airport in Salt Lake City. The highest recorded wind speed was 99 mph in Farmington. This wind event differed from many Wasatch Front downslope wind events because the high winds extended much further west from the mountains than is typical. The storm downed thousands of mature trees, damaged powerlines and structures, closed roads and caused power outages for 180,000 customers. Strong easterly winds also occurred on the west slope of the Cascade Mountains in Oregon and Washington and led to the explosive growth of several large wildfires.
The Ute Water Conservancy District Treatment Plant team was recently recognized with the 2020 Outstanding Water Treatment Plant Award from the Rocky Mountain Section of the American Water Works Association. Photo credit: Courtesy of Ute Water via The Grand Junction Daily Sentinel
The Rocky Mountain Section of the American Water Works Association recently recognized the Ute Water Conservancy District Treatment Plant with an award for its work.
The award was the 2020 Outstanding Water Treatment Plant Award for utilities serving over 50,000 customers and is based on a number of factors including water quality, maintenance, professionalism and safety.
Ute Water Process Control Technician Tony Ibarra nominated the plant for the award and said he was glad to see the work of the staff recognized. He said they have worked to continuously improve plant operations through facility upgrades, as well as staff training and certification…
The Ute Water Treatment Plant has undergone facility improvements in recent years including pump station rehabilitations, pre-treatment facility upgrades, filter improvements and a motor control center replacement, among others, according to a news release.
Treatment Plant Superintendent Ben Hoffman said he was happy to receive the recognition and noted that previous winners included larger Front Range districts. He said, typically, water districts make the news for negative reasons, but that he was happy to have something positive to share.
FromThe Fort Lewis College Independent (Jackson Zinsmeyer):
On July 31, 18 miles north of Grand Junction, Colorado, lightning struck starting what would become Colorado’s largest wildfire at 139,000 acres burnt.
According to the Incident Information System, Inciweb, the fire is 95% contained as of Sept. 11.
Despite being nearly four hours away from Durango, this fire, as well as the many other fires in Colorado such as the Cameron Peak and Glenwood Springs fires, will impact Durango’s community and environment as the fires continue to burn.
Much like the 416 fire Durango experienced just over two years ago, the Glenwood Springs fire is burning into the watersheds suffocating fish and river-life, Dr. Gigi Richard, director of the Four Corners Water Center and instructor of geosciences at Fort Lewis College said.
“Sixty percent of fish in the Animas river were killed from sediment caused by short, high intensity fires,” Richard said.
Forest fires have the ability to decimate crucial parts of an ecosystem by destroying animal habitats, driving animals into nearby cities and towns and destroying natural sources of food for these animals making it harder for them to return to nature, Dr. Jared Beeton, assistant professor of environmental studies at Fort Lewis College, said.
The fires taking place in Colorado are likely to displace animals throughout the state, Beeton said.
These displaced animals will come into cities looking for shelter, food and water, and as long as these animals are left alone, no issues should be caused by them, he said.
Richard notes that in 2002, during the Hayman Fire, former Gov. Bill Owens said, “It looks as if all of Colorado is burning today.” Many tourists were afraid to travel into Colorado because of this statement, Richard said.
Richard said the Durango train and the San Juan National Forest were closed because of fire hazards during the 416 fire.
The closure of the forest and train were seen by tourists as a reason not to travel into Durango and Colorado as a whole, making it difficult for many small businesses that rely on tourism, Richard said.
The fires that are burning around the state of Colorado will continue to impact the communities, wildlife, and business’ for years to come as the state and cities recover from the price of fighting fires, Richard said.
Our descendants own the future, but the decisions and actions we make now will tremendously impact generations to come, says philosopher Roman Krznaric. From a global campaign to grant legal personhood to nature to a groundbreaking lawsuit by a coalition of young activists, Krznaric shares examples of ways we can become good ancestors — or, as he calls them, “Time Rebels” — and join a movement redefining lifespans, pursuing intergenerational justice and practicing deep love for the planet.
Denver Water’s primary concern has been the safety of its employees who work at its Grand County facilities at Williams Fork Reservoir, Winter Park and at the remote Jones Pass headquarters.
For September, the average contiguous U.S. temperature was 66.0°F, 1.1°F above the 20th-century average, ranking in the warmest one-third of the 126-year period of record. For the year-to-date, the contiguous U.S. temperature was 57.3°F, 2.3°F above the 20th-century average, ranking sixth warmest in the January-September record.
The September precipitation total for the contiguous U.S. was 2.38 inches, 0.11 inch below average, ranking in the middle one-third of the 126-year period of record. For the year-to-date, the national precipitation total was 24.08 inches, 0.88 inch above average, also ranking in the middle one-third of the January-September record.
NCEI updated the 2020 billion-dollar weather and climate disaster list to include six additional events — Western Wildfires, Western/Central Drought and Heatwave, Hurricane Sally, Hurricane Laura, Central Severe Weather Derecho and Hurricane Isaias. This brings the year-to-date total to 16 weather and climate disaster events with losses exceeding $1 billion each across the U.S. and ties with 2011 and 2017 for the largest number of disasters in a calendar year. This is also the sixth consecutive year (2015-2020) in which 10 or more billion-dollar disasters have impacted the U.S. — the only such occurrence on record.
This monthly summary from NOAA National Centers for Environmental Information is part of the suite of climate services NOAA provides to government, business, academia, and the public to support informed decision-making.
September Temperature
The cooler temperatures observed across the Plains and Upper Mississippi Valley mid-month were associated with a strong trough of low pressure.
Above- to much-above-average September temperatures were observed across much of the West, parts of the Northeast and Gulf Coast. California and Oregon ranked warmest on record for the month with Nevada and Arizona ranking second warmest.
Phoenix, Arizona, broke the record for the number of days with temperatures at or above 110°F in a calendar year during August and added three more days to the record in September. The 2020 record of 53 days shatters the previous record of 33, set in 2011.
Below-average temperatures were present across portions of the Plains and Deep South and in pockets scattered across the Great Lakes, Southeast and mid-Atlantic.
Alaska had a statewide average temperature of 42.0°F, 1.4°F above the long-term average and ranking in the warmest one-third of the 96-year record. Above-average temperatures were observed across the eastern half of Alaska including most of the Northeast and Southeast Interior regions, Cook Inlet, Northeast Gulf and the Panhandle regions.
September Precipitation
The West remained hot and dry under a relatively persistent ridge of high pressure throughout much of September, exacerbating wildfire conditions. The above-average rainfall observed across the South and Southeast were in large part due to Tropical Storm Beta and Hurricane Sally.
Above-average precipitation was observed from parts of the Deep South to the mid-Atlantic and in portions of the Northwest and Midwest. Georgia had its ninth-wettest September on record.
Below-average precipitation was observed from the West Coast to the northern Great Lakes and across the Northeast, and in portions of the central Gulf Coast as well as parts of the western Ohio Valley. Maine had its record-driest September, while Arizona ranked fifth driest and California sixth driest on record. In total, seven states in the Northeast, Southwest and northern Plains had their tenth driest, or drier, September.
Alaska’s average of 3.93 inches of precipitation in September was 0.64 inch below average and ranked in the driest one-third of the 96-year record. The Northeast Interior, the eastern half of the North Slope as well as much of the Central Interior received above-average precipitation during September, while below-average precipitation was present across the western North Slope, Bristol Bay, the Northeast Gulf and the Panhandle regions.
No snow was reported at Fairbanks during September. This is the third consecutive year with no September snowfall — a first in the Weather Bureau/NWS era (since 1930).
According to the September 29 U.S. Drought Monitor report, 42.6 percent of the contiguous U.S. was in drought, up about 3 percentage points from the beginning of September. This is the largest drought footprint across the CONUS since September 2013. Drought conditions expanded or intensified across much of the Northeast and the western half of the contiguous U.S. Drought coverage lessened or was eliminated across parts of the mid-Mississippi Valley and Deep South. Drought was eliminated across Kodiak Island in Alaska, contracted across Hawaii’s Big Island and intensified on the other Hawaiian islands.
Wildfires
The western U.S. is in the midst of its most active fire year on record in 2020.
By the end of September, more than five million acres were consumed across California, Oregon and Washington State. This is more than three times the annual 10-year (2010-2019) average of nearly 1.6 million acres.
California has already had the highest number of acres burned in a single year across the state with many active fires still ablaze.
Five of the six largest fires in California history occurred during 2020 — August Complex, SCU Lightning Complex, LNU Lightning Complex, North Complex and the Creek Fire.
As of October 1, the Cameron Peak Fire in Colorado is the third-largest fire in the state’s history. Three of the four largest fires in Colorado history occurred during 2020.
Thick smoke and ash from the wildfires reduced air quality in the West and southwest Canada to dangerous levels, forcing people to stay indoors during much of September.
Tropical Cyclones and Hurricanes
The Atlantic Basin hurricane season continues at a record pace for named-storm formation during 2020. In September alone, 10 named storms formed — Nana, Omar, Paulette, Rene, Sally, Teddy, Vicky, Wilfred, Alpha and Beta.
On September 15, Hurricane Sally made landfall near Gulf Shores, Alabama, as a Category 2 storm. Impacts included storm surge flooding, widespread wind damage and up to 30 inches of rainfall.
Tropical Storm Beta made landfall on the Matagorda Peninsula in Texas on September 22 and brought extensive flooding to the Houston area.
For the first time since 1971, five named storms churned in the Atlantic Basin at one time. Paulette, Rene, Sally, Teddy and Vicky were each visible in the Atlantic Ocean on September 14.
Through October 1, nine named storms made landfall along the CONUS coastline, tying a record (1916) for most landfalls in a season.
Year-to-date (January-September) Temperature
Above- to much-above-average year-to-date temperatures were observed across most of the contiguous U.S. Florida had its warmest January-September on record while Arizona, New Jersey, Rhode Island and Massachusetts ranked third warmest. Near-average temperatures were observed across portions of the central U.S.
Denver, Colorado, reported 75 days with high temperatures at or above 90°F in 2020. This eclipses the previous record of 73 days set in 2012.
Despite the overall warmth across the contiguous U.S. in 2020, the northern Plains experienced an early freeze September 8-9, which caused an abrupt end to the growing season, leading to agricultural losses across the region.
Year-to-date temperatures averaged across Alaska were near average with above-average temperatures observed along portions of the West Coast and the Aleutians. Below-average temperatures for this year-to-date period were observed across parts of the eastern interior regions.
Year-to-date (January-September) Precipitation
Above- to much-above-average January-September precipitation stretched from parts of the southern Plains to Gulf Coast and Great Lakes to the mid-Atlantic Coast as well as across portions of the Northwest. Mississippi, Tennessee, North Carolina and Virginia ranked third-wettest year-to-date on record. Below-average precipitation fell from the West Coast to the northern Plains and across the Northeast. Utah had its driest year-to-date on record, while Colorado was second driest.
For Alaska, January-September precipitation was near average. Below-average precipitation was observed across portions of the northwest coast, the Aleutians and the central Gulf Coast. Above-average precipitation was observed across much of the eastern Interior regions and the Panhandle regions.
Billion-dollar weather and climate disasters
Through the end of September, 16 weather and climate disaster events have been identified with losses exceeding $1 billion each across the U.S. during 2020. Eleven of the events were due to severe storms which occurred across more than 30 states from the Great Lakes to the Gulf and East coasts. The remaining events were identified as one wildfire, one drought and three tropical cyclone events.
This is a record sixth consecutive year with at least 10 separate billion-dollar disasters and is tied with 2011 and 2017 for the annual record number of events.
Since records began in 1980, the U.S. has sustained 279 separate weather and climate disasters where overall damages/costs reached or exceeded $1 billion (based on the CPI adjustment to 2020) per event. The total cost of these 279 events exceeds $1.825 trillion.
Disaster costs over the last five years (2016-2020) exceed a record $550 billion. These costs do not yet include the 2020 Western Wildfires, Drought/Heatwave or Hurricane Sally.
The U.S. has been impacted by slow moving tropical cyclones that produced extreme rainfall and damaging floods for four consecutive years (2017-2020). These storms include: Harvey, Florence, Imelda and Sally.
FromThe Grand Junction Daily Sentinel (Dennis Webb):
RiversEdge West, a nonprofit based in Grand Junction, has been awarded $164,566 from the Colorado Water Conservation Board, a state agency, to support the creation of what the group is calling a Western Colorado Sustainable Stewardship model to protect and sustain restoration work. A $40,000 grant from the Bacon Family Foundation also will help with that initiative and let RiversEdge West continue to provide leadership and support for the Desert Rivers Collaborative in Mesa and Delta counties. This includes planning and mapping work, and technical, coordination and fundraising assistance.
RiversEdge West formed the Desert Rivers Collaborative in 2012. The collaborative has completed more than 1,565 acres of riparian restoration on the Colorado and Gunnison rivers. Among the partners are private landowners, other nonprofits, state and federal agencies including Colorado Parks and Wildlife and the Bureau of Land Management, volunteers, Mesa County, and municipalities including Palisade, Grand Junction and Fruita.
In addition, RiversEdge West co-leads, along with the Southwest Conservation Corps, the Dolores River Restoration Partnership. That collaborative effort has treated nearly 6,000 acres along 200 miles of the Dolores River in six counties and two states.
The partnerships have focused particularly on two invasive species — tamarisk and Russian olive. Shannon Wadas, associate director of RiversEdge West, said those species outcompete native plants, are less conducive to providing wildlife habitat, pose a higher wildfire risk, affect instream habitat relied upon by native fish, and can interfere with river and bank access for recreation…
That’s where the sustainability component of restoration work comes in. RiversEdge West is working to incorporate long-term monitoring of restored areas and training of partners in that monitoring. Wadas said monitoring protocols are in place already on the Dolores River and RiversEdge West plans to implement those on the Colorado/Gunnison restored areas as well.
It also plans to create, and provide partners with, a framework and guide to help with decisions regarding when and where restoration work should be completed. The CWCB money also will fund two-person “strike teams” with the Southwest Conservation Corps and Western Colorado Conservation Corps to do ongoing maintenance work such as treating tamarisk and Russian olive resprouts and secondary weeds, and doing revegetation.
Wadas said the sustainability efforts are intended to protect the investments already made in riverside restoration, and the hope is that the new sustainability model will be used not just by watershed groups across western Colorado.
The penstocks and main building at the Shoshone hydropower plant, which uses water diverted from the Colorado River to produce electricity. The Shoshone Outage Protocol keeps water flowing down the Colorado River when the hydro plant is inoperable. Photo credit: Brent Gardner-Smith/Aspen Journalism
Here’s the joint statement from the Stanford Woods Institute for the Environment:
Executive Summary
U.S. Hydropower: Climate Solution and Conservation Challenge
Stanford University Uncommon Dialogue
October 13, 2020
The “Joint Statement of Collaboration on U.S. Hydropower: Climate Solution and Conservation Challenge” (Joint Statement), represents an important step to help address climate change by both advancing the renewable energy and storage benefits of hydropower and the environmental and economic benefits of healthy rivers.
The Joint Statement is the result of a two-and-a-half-year dialogue, co-convened by Stanford University’s Woods Institute for the Environment, through its Uncommon Dialogue process, Stanford’s Steyer-Taylor Center for Energy Policy and Finance, and the Energy Futures Initiative, to bring together the U.S. hydropower industry and the environmental and river conservation communities. The parties, listed on page three of this executive summary, are motivated by two urgent challenges. To rapidly and substantially decarbonize the nation’s electricity system, the parties recognize the role that U.S. hydropower plays as an important renewable energy resource and for integrating variable solar and wind power into the U.S. electric grid. At the same time, our nation’s waterways, and the biodiversity and ecosystem services they sustain, are vulnerable to the compounding factors of a changing climate, habitat loss, and alteration of river processes. Our shared task is to chart hydropower’s role in a clean energy future in a way that also supports healthy rivers.
There are more than 90,000 existing dams throughout the country, of which about 2,500 have hydropower facilities for electricity generation. In the next decade, close to 30 percent of U.S. hydropower projects will come up for relicensing. As such, the parties focused on three potential opportunities:
Rehabilitating both powered and non-powered dams to improve safety, increase climate resilience, and mitigate environmental impacts;
Retrofitting powered dams and adding generation at non-powered dams to increase renewable generation; developing pumped storage capacity at existing dams; and enhancing dam and reservoir operations for water supply, fish passage, flood mitigation, and grid integration of solar and wind; and
Removing dams that no longer provide benefits to society, have safety issues that cannot be cost-effectively mitigated, or have adverse environmental impacts that cannot be effectively addressed.
The potential development of new “closed loop” pumped storage to increase capacity to store renewable energy, including variable solar and wind, was also a focus of the dialogue. Closed loop pumped storage systems do not involve construction of a new dam on a river, but they may have other impacts that need to be avoided, minimized or mitigated, including to surface and ground water.
The parties found inspiration in the precedent-setting 2004 agreement involving Maine’s Penobscot River where the Penobscot Nation, the hydropower industry, environmentalists, and state and federal agencies agreed on a “basin-scale” project to remove multiple dams, while retrofitting and rehabilitating other dams to increase their hydropower capacity, improve fish passage and advance dam safety. After project completion in 2016, total hydropower generation increased, more than 2,000 miles of river habitat had improved access for the endangered Atlantic salmon and other species of sea-run fish, and the Penobscot River again helps support the realization of treaty rights and other aspects of tribal culture for the Penobscot Nation.
Driven by the urgent need to address the twin challenges of climate change and river conservation, the parties have identified seven areas for joint collaboration, detailed in the Joint Statement:
1. Accelerate Development of Hydropower Technologies and Practices to Improve Generation Efficiency, Environmental Performance, and Solar and Wind Integration
2. Advocate for Improved U.S. Dam Safety
3. Increase Basin-Scale Decision-Making and Access to River-Related Data
4. Improve the Measurement, Valuation of and Compensation for Hydropower Flexibility and Reliability Services and Support for Enhanced Environmental Performance
5. Advance Effective River Restoration through Improved Off-Site Mitigation Strategies
6. Improve Federal Hydropower Licensing, Relicensing, and License Surrender Processes
7. Advocate for Increased Funding for U.S. Dam Rehabilitation, Retrofits and Removals
Over the next 60 days, the parties have agreed to invite other key stakeholders, including tribal governments and state officials, to join the collaboration, and to address implementation priorities, decision-making, timetables, and resources.
In sum, the parties agree that maximizing hydropower’s climate and other benefits, while also mitigating the environmental impact of dams and supporting environmental restoration, will be advanced through a collaborative effort focused on the specific actions developed in this dialogue. The parties commit themselves to seizing these critical and timely opportunities.
If you ask most women about how their male relatives, partners and friends respond to being sick, they’ll often tell you with an accompanying eye roll, “He’s such a baby.” “He’s extra whiny.” Or “he exaggerates so much.” But there may be a biological explanation for this behavior.
Dubbed the “man flu,” this phenomenon has been validated in a review of previously published, large epidemiological studies, as well as in studies of influenza in animals. In these studies, males were sick longer, with more severe symptoms and had a weaker response to vaccination. Laboratory tests with animals infected with the influenza virus also underscore that there are sex-based differences in immune response that influence outcomes observed in humans. But are these more severe symptoms and outcomes unique to cold and flu?
As a respiratory toxicologist and researcher investigating sex differences in the respiratory system, I was intrigued to read a recent study on sex-specific responses to COVID-19 that suggest that men are, actually, more vulnerable and suffer more from this disease.
Based on data from the Centers for Disease Control and Prevention as of Oct. 5, 2020, the risk of death from COVID-19 in men 30-49 years old was also found to be more than twice that of females.
In other age groups, the risk of COVID-19-related death in males was also higher than the same female age cohort. But it was not as high as in the 30- to 49-year-old age group.
This contrasts with almost equal rates of SARS-CoV-2 infection in those same age groups, leading scientists to wonder why might males be more susceptible.
Study identifies why men may be more susceptible to COVID-19
The risk of death from COVID-19 in men of some age groups may be twice that of their female peers. xavierarnau
This study examined samples including nasal swabs, saliva, and blood, which were either collected from healthy individuals or COVID-19 patients. These samples were used to better understand what the immune response to the infection looks like and how it differs in people with more severe disease.
Similar to CDC data on infection rates, no sex difference in the concentration of virus or the amount of virus present was observed in either the nasal swab or the saliva. There were also no differences in antibody levels – a signal the body had identified the virus – detected in infected men and women.
Males with SARS-CoV-2 show greater inflammation
However, the authors identified major sex differences during the early immune response that occurs soon after someone is infected with the SARS-CoV-2 virus.
The blood samples were analyzed for a variety of cytokines – some of the first signaling molecules that help immune cells respond to pathogens. The levels of these signals rise and fall to provide an adequate response to fight an invading pathogen. But large quantities of these molecules can severely damage the body. This is the case in a cytokine storm.
The authors of the Nature report observed sex differences in the strength of the cytokine response. Men showed higher levels of cytokines that trigger inflammation, like IL-8 and IL-18, than women. Higher quantities of these cytokines are linked to more severe disease. In severe cases of COVID-19, fluid builds up in the lungs, reducing the oxygen available in the body for normal functions. This can lead to tissue damage, shock and potentially the failure of multiple organs.
Females with SARS-CoV-2 are better prepared to eliminate the virus
In addition to sex differences in cytokine levels, the authors also found sex differences in the function of immune cells.
Compared to men, women had a higher number of T cells – essential for eliminating the virus – that were activated, primed and ready to respond to the SARS-CoV-2 infection. Men with lower levels of these activated T-cells were more likely to have severe disease.
Thus, there are several aspects of the human immune response to SARS-CoV-2 that differ between men and women. Understanding these differences can inform how doctors treat patients and can help researchers develop sex-specific therapies.
Increased COVID-19 susceptibility in men is likely biological
These results contradict speculation that male susceptibility to SARS-CoV-2 infection is due to more risky behaviors. Those include downplaying the seriousness of the virus, joining large gatherings and ignoring social distancing guidelines, as well as lower rates of hand-washing and wearing masks. Instead, rates of infection are actually similar between males and females, while males are more at risk of serious COVI9-19 disease, suggesting biological differences in response to infection.
This paper is one of the first of its kind to delve into mechanisms of susceptibility sex differences. With greater innate biological risk for severe disease and death in men, this suggests that males might need to be hypervigilant about social distancing, hand-washing and mask-wearing.
Greater adherence to infection prevention protections, especially in men, would not only reduce their risk of infection, but also combat their increased risk of severe disease and death from COVID-19.
Eric Kuhn is the the latest addition to the speaker lineup for “Water Connections: SW’s Virtual Water Cooler,” an online event jointly hosted by the Southwestern Water Conservation District and Four Corners Water Center at Fort Lewis College on Wednesday, October 14th from 4:00-5:30 p.m.
Author and former general manager of the Colorado River District, Eric Kuhn will address this question: “What can the last 20 years tell us about the future of Colorado River hydrology?” For a preview, check out this white paper he recently co-authored on the topic.
Register now to reserve your spot (it’s free). You’ll hear short state and local water updates. It’s like visiting the water cooler to get the latest local scoop and connect–only virtual.
Kate Greenberg (Colorado Department of Agriculture) and Celene Hawkins (Colorado Water Conservation Board) will speak to the status of Colorado’s agriculture and state water funding in the midst of a pandemic.
Rob Genualdi (Division 7 Engineer), Bob Hurford (Division 4 Engineer), and Susan Behery (US Bureau of Reclamation) will provide a summary of the dismal 2020 water year in southwest Colorado. Ken Curtis (Dolores Water Conservancy District), Gretchen Rank (Mancos Conservation District), and Simon Martinez (Ute Farm and Ranch) will add observations from the season and provide a look ahead to what it might mean for water year 2021.
Finally, we’ll hear the latest from various local water agencies and organizations in short “pop-up” updates from across southwest Colorado.
This event is about making connections, so be ready to engage via the chat, poll questions, and interesting content. See you next week!
The City of Pueblo was nationally recognized for implementing the first full hydrocyclone/ammonia controlled nutrient removal process in the United States and for improvements to the James DiIorio Water Reclamation.
The city received the prestigious Water Environment Federation 2020 Project Excellence Award for its pioneering improvements that additionally saved over $20 million for taxpayers and increased capacities.
“From the continental divide to the Mississippi, our waterways are connected. What happens in Colorado will impact the Gulf’s algae problems and I am happy to announce Pueblo is leading Colorado to reduce algal bloom,” said Mayor Nick Gradisar. “In addition, our wastewater team saved taxpayers over $20 million, which shows our team is doing everything it can to be environmental leaders while being great financial stewards.”
The City of Pueblo partnered with Brown and Caldwell, an engineering and construction firm, to develop an advanced system of nutrient removal through aeration control and hydrocylone-base wasting process.
“We want to meet the Water Quality Control Division Discharge Permit requirements without adding additional costs for the citizens,” said Nancy Keller, Wastewater Director for the City of Pueblo. “We have a system now that protects aquatic life and improves the quality of our down stream communities.”
In 2012, the State of Colorado introduced new standards to reduce the algal growth and aquatic life impairments. The first phase of reductions had to be met by April 2021 and the next phase of reductions will go into effect in 2027.
“Our success in this project allows the facility to earn credits with the Water Quality Control Division that will delay implementation of the 2027 standards in our discharge permit, allowing technology improvements to occur, hopefully decreasing that large capital expense also,” said Keller.
With the new system the City of Pueblo’s Wastewater Department was also able to increase the capacity of this process by 50% while reducing electrical and chemical costs.
Algae blooms deprives waterways of much needed oxygen leading to Hypoxic (dead) zones.
Hypoxia, or dead zone, occurs when a body of water or waterway has increased levels of nutrient pollution which is primarily caused by human involvement. These increased nutrients cause an overgrowth of algae which when it decomposes, reduces the supply of oxygen.
The Nutrient Removal Project was expected to cost an estimated $20-25m. The City of Pueblo, with partners Brown and Caldwell, implemented Ntensity enhanced nutrient-removal system in for a total cost under $2 million.
The DiIorio Facility treats more than 10 million gallons of wastewater per day.
Residents and visitors spend time in Aspen’s Wagner Park on Sept. 28, 2020. Visitation and lodging unit occupancy rates are two variables that influence Aspen’s demand for treated water, 60% of which is used to water outdoor spaces such as parks and gardens, according to city officials. Photo credit: Natalie Keltner-McNeil/Aspen Journalism
An analysis of five weeks of Aspen water-treatment plant data show that local water users cut consumption by an average of 20% in the four weeks after Stage 2 water restrictions took effect, compared with the week before the stricter regulations were in place.
However, year-over-year data shows that water use in 2020, over the course of the past five weeks, was down by smaller amounts compared with the non-drought year of 2019.
Stage 2 water restrictions began Sept. 1, with the goal of reducing water use by 15% to 20% compared with “current use,” according to a news release announcing the restrictions.
That appears to have been achieved, as average daily water use was 5.86 million gallons from Aug. 24 to Aug. 30, according to water-treatment plant data provided by city of Aspen staff and analyzed by Aspen Journalism. Average use dropped to 5.08 million gallons per day the following week and to 4.7 million gallons per day over the four weeks from Aug. 31 through Sept. 27.
Comparing average daily water use with a non-drought year provides further context when examining the degree to which restrictions have influenced water use in recent weeks. Aspen Journalism’s analysis of the city’s daily treated volumes included totaling water use on a per-week basis and finding the average consumption per day for a given week. Those numbers were compared to average daily totals from corresponding seven-day periods in 2019, a non-drought year in which water restrictions were not in place for the utility’s approximately 4,000 customers in the city of Aspen and surrounding neighborhoods.
That analysis showed an average decline of 10% when comparing five weeks in 2019 versus 2020. However, the differences between weekly totals from year to year varied considerably. In addition, a large decline in weekly water use in 2020 compared with 2019 often corresponded with a burst of rain or snowfall, levels that were sourced from National Oceanic and Atmospheric Administration data. For instance, over the week of Sept. 7 to 13, weekly water use declined by 36% from 2019 to 2020. This steep decline is probably related to the three-day snowstorm that occurred that week in 2020, which dropped on the city a cumulative 8.5 inches of snow Sept. 8 to 10, according to NOAA data.
In contrast, the week of Sept. 21 in both 2019 and 2020 saw neither rain nor snow, according to NOAA data. That week in 2020, the city used 6.2% less water than in the same week in 2019, according to Aspen Journalism’s analysis. Precipitation levels were similar for the five weeks spanning late summer and early fall, with 2020 having two more days and 0.7 more inches of rain compared with 2019, according to NOAA data.
Declines in water use may relate to rainfall and snowfall since weather events prompt the city’s parks and open space department and residents to stop or reduce watering to parks, gardens and open space, said Steve Barr, the city of Aspen’s parks operations manager. Because approximately 60% of total municipal water is diverted to parks, landscapes and gardens, rain and snowfall prompt reduced water use and probably correspond to declined treatment-plant figures.
“A period of rain (in late August) allowed us to shut down irrigation for three or four days. Truly, this saves the largest amount of water,” Barr said. Yet, more data would need to be analyzed in order to draw statistically sound conclusions about the relationship between weather and water use for the entire city water system, said Steve Hunter, utilities operations manager for the water department.
Due to the many factors that influence treatment-plant numbers, it is difficult to discern from the data how resident behavior changed after the Sept. 1 water restrictions and how behavioral changes influence city water use, Hunter said.
City population, visitation, humidity, weather and special events also influence the daily volume of treated water, according to Hunter.
“Just like our weather, no two days are exactly the same,” he said.
The reduction targets identified with Stage 2 restrictions are meant to give water users a goal to hit compared to their normal usage, according to water plant officials.
Aspen’s Glory Hole Park in late September. City parks department officials report irrigating less frequently and using less water on native plants and grasses in response to Stage 2 two water restrictions that took effect Sept. 1 due to extreme drought conditions. The parks department overall cut water use 43% from August to September, according to city officials. Photo credit: Natalie Keltner-McNeil/Aspen Journalism
Community adaptation efforts
Aspen City Council enacted Stage 2 water restrictions after the U.S. Drought Monitor on Aug. 18 classified all of Pitkin County to be in extreme drought. The goal of the restrictions is to protect the streamflow of Castle Creek, which provides the majority of Aspen’s water, with flows throughout the Roaring Fork River basin running 40% to 70% below median, according to a memo from the utilities department concerning the water restrictions.
In 1997, the city agreed with the Colorado Water Conservation Board to maintain 12 cubic feet per second on Castle Creek, except in extreme drought conditions, according to the state resolution. Dropping below this rate threatens the aquatic ecosystem, as warmer waters stress native fish populations and alter the aquatic environment through increased algal blooms, according to Brad Udall, a water and climate research scientist at Colorado State University.
Many local businesses report following Stage 2 guidelines, which may be associated with the 20% decline in water in the four weeks after the week of Aug. 24. The restrictions put residents and businesses on a staggered watering schedule and prohibit the construction of new landscapes and water systems, as well as prompt other regulations. (Residents and businesses, for example, cannot wash sidewalks with treated city water.) Managers and directors at Aspen Alps, The Gant, Limelight Hotel, Aspen Mountain Lodge and Aspen Meadows Resort said they follow the new protocol.
“Everyone cares about water use and is very compliant with water restrictions,” said Aspen Mountain Lodge general manager Allison Campbell. “We see it when we’re touring around our state, how dry we are.”
Many businesses are implementing additional measures to reduce water. Staffers at Aspen Mountain Lodge winnowed their watering window to 15 minutes every three days, compared with every other day required by Stage 2, according to Campbell. At Bumps restaurant, which sits at the base of Buttermilk Mountain, staffers are testing new technology that reduces the quantity of water needed to thaw food, according to Ryland French, energy manager at Aspen Skiing Co. Businesses could not provide data for these reductions, as many do not collect daily water data but make changes based on the monthly water bill from the Aspen utilities department, according to Campbell, French and Aspen Meadows Resort general manager Jud Hawk.
Other major water users, such as the city golf club and the parks and open space department, have enacted new water practices following the Stage 2 announcement. Golf club staffers cut irrigation to native plants on the course and reduced water to the driving range by 75%, from 62,667 gallons dispensed on the driving range each night to 15,667, according to golf director Steve Aitken.
After Sept. 1, the parks department shortened watering times and limited those periods to every other day. Staffers continued low water-use practices established during the 2018 drought, such as limiting water to native-plant zones, Barr said. From this past August to September, the department reduced irrigation to parks and gardens by an average of 43%, according to data provided by the parks and open space department. The department used less water in 83% of Aspen parks and gardens in September compared with August, according to parks department data.
More changes needed to maintain streamflows
This summer is not the first time that the city of Aspen has tried to meet water-use reduction targets. In 2013, the water department enacted water restrictions with a 20% reduction goal. The city did not meet this target, according to a 2016 water-availability study by the Wilson Water Group. In 2015, the water department lowered the Stage 2 reduction goal to 15%, according to the 2016 study.
The water department also enacted Stage 2 restrictions on Aug. 13, 2018. No analysis was conducted on whether the city met the 15% reduction target, according to Tyler Christoff, director of utilities for the water department.
Despite current drought conditions, Castle Creek’s streamflow remains above the state-mandated minimum level. The creek averaged 35.6 cfs in the five weeks from Aug. 24 to Sept. 27, with a minimum cfs of 32 the week of Sept. 21, according to water department data.
The days of Aug. 24 to Sept. 27 fall within the city’s peak water-use period, which runs from June to September, according to the 2016 water availability study. Higher temperatures and evaporation rates mean that Aspen’s parks and landscapes demand more irrigation, Barr said. Last week, the parks department began blowing out and shutting off its irrigation system for the winter, according to Barr. This may cause a decline in demand for city water.
While current drought conditions did not endanger running below the minimum instream flow, studies show that climate change will demand revisions to city water sourcing and use in order to keep Castle Creek above 12 cfs.
Temperature is predicted to rise throughout Colorado by 2.5 to 6 degrees Fahrenheit by 2065, according to a report by the research institute Western Water Assessment. Rising temperatures increase evaporation in all forms, transferring water from streams to the atmosphere, Udall said.
“Under a warming climate, the atmosphere has a greater thirst for water. It wants to hold more water as it warms,” he said.
Rising temperatures and the resulting increased evaporation can be expected to reduce Castle Creek’s streamflow by 35% by 2065, according to a 2017 study done by Headwaters Corporation for the city of Aspen. This reduced streamflow, in conjunction with population growth, will lower Castle Creek’s streamflow below 12 cfs, according to a 2016 water availability study by Wilson Water Group. Yet, 12 cfs can be maintained if the water department draws more municipal water from local wells and implements a water-reuse program, where the city golf course is irrigated by upcycled wastewater treatment plant water instead of water from Castle Creek, according to the 2016 study. While the 2016 study concludes that Castle Creek’s minimum streamflow can be maintained with these mitigatory actions, Aspen officials in 2018 asked the state for rights to 8,500 acre-feet of water storage to prepare for the effects of climate change.
“In extreme or prolonged drought, reservoir storage would help create a more resilient water supply for the Aspen community,” Hunter said.
The Wilson study’s authors also suggest implementing Stage 2 or Stage 3 water restrictions to maintain Castle Creek’s instream flow. Stage 3 water restrictions aim to reduce water use by 20%. But the authors add that if city water users fall short of the target reductions, well water can fill the deficit to ensure the required 12 cfs.
Stage 2 conditions will last as long as Pitkin County remains in extreme drought, which will probably be into 2021, Hunter said. In April, the water department will assess winter snowpack — which is predictive of spring and summer streamflow — and will decide to continue State 2 or lift it, Hunter said.
Hunter believes the ordinance unites the city in environmental goals.
“We believe the community’s knowledge and participation in conservation practices creates a more resilient future,” he said.
As drought conditions in western Colorado continue to degrade, 60 percent of the state is now in extreme or exceptional drought – the two worst categories – according to the latest report from the National Drought Mitigation Center. Much of the state experienced above average temperatures and little to no precipitation during the week.
Colorado Drought Monitor October 6, 2020.
The United States Monthly Drought Outlook for October shows drought persisting through the month. Temperatures during the month and through the end of the year are likely to remain above normal, while precipitation is expected to remain below normal.
October 2020 monthly drought outlook via the Climate Prediction Center.
Persistent drought over the summer continues to impact agriculture producers. The United States Department of Agriculture reported that Colorado livestock producers in east central counties are continuing to provide supplemental feed to livestock, and that fields normally cut for grass hay were too short and dry to produce hay this year.
Overall, 17 percent of Colorado is in exceptional drought, up from three percent during the previous week. Extreme drought fell from 50 percent to 43 as conditions degraded. Severe drought also fell from 36 to 31 percent as areas moved into worse conditions. Moderate drought dropped from 10 to 9 percent, while abnormally dry conditions were steady at one percent.
American biochemist Jennifer A. Doudna, left, and French microbiologist Emmanuelle Charpentier were awarded this year’s Nobel Prize for chemistry. Alexander Heinl/picture alliance via Getty Images
Researchers have been able to manipulate large chunks of genetic code for almost 50 years. But it is only within the past decade that they have been able to do it with exquisite precision – adding, deleting and substituting single units of the genetic code just as an editor can manipulate a single letter in a document. This newfound ability is called gene editing, the tool is called CRISPR, and it’s being used worldwide to engineer plants and livestock and treat disease in people.
For these reasons the 2020 Nobel Prize in chemistry has been awarded to Emmanuelle Charpentier, director of the Max Planck Unit for the Science of Pathogens in Germany, and Jennifer Doudna, professor at the University of California, Berkeley, for discovering and transforming CRISPR into a gene-editing technology. It’s the first time two women have shared a Nobel prize.
I’m a CRISPR engineer, interested in developing novel CRISPR-based gene-editing tools and delivery methods to improve their precision and function.
In the past, my colleagues and I have created a version of CRISPR that can be controlled using light, which allows precise control of where and when gene editing is performed in cells, and can be potentially used in animals and humans. We’ve also created a targeted system that can package and deliver the editing components to desirable cell types – it’s like GPS for cells. Most recently, we engineered a tool that improved the speed and precision of CRISPR so it could be used in rapid diagnostic kits for COVID-19, HIV, HCV and prostate cancer.
While CRISPR scientists like me have been speculating about a Nobel Prize for CRISPR, it was exciting to see Charpentier and Doudna win. This will encourage young, talented engineers and researchers to enter the field of gene editing, which can be leveraged for designing new diagnostics, treatments and cures for a range of diseases.
Many variants of CRISPR/Cas systems have been discovered, engineered and applied to edit genes. There are already over 20,000 scientific publications on the topic.
CRISPR dates back to 1987, when a Japanese molecular biologist, Yoshizumi Ishino, and colleagues discovered a CRISPR DNA sequence in E. coli. The CRISPR sequence was later characterized by a Spanish scientist, Francisco Mojica, and colleagues, who named it CRISPR, which stands for Clustered Regularly Interspaced Short Palindromic Repeats.
While people and animals have evolved complex immune systems to fight viral attacks, single-cell microorganisms rely on CRISPR to find and destroy a virus’s genetic material to stop it from multiplying.
Charpentier and Doudna figured out how to borrow this innate biological capability from microbes and apply it to genetic engineering of bacteria.
In a landmark paper, published online on June 28, 2012, Charpentier and Doudna showed that the CRISPR gene-editing machinery includes two components: a guide molecule that serves as sort of a GPS to find and bind the target gene site on the DNA of an invading virus, which then teams up with a CRISPR-associated protein (Cas) that serves as a molecular scissor that snips the DNA.
Jennifer Doudna explains what CRISPR is and how it is used.
Around the same time, Virginijus Siksnys, a Lithuanian biochemist at the University of Vilnius, made a similar discovery and submitted results for publication that appeared a few months later, in September 2012. Feng Zhang, a biologist at the Broad Institute in Cambridge, Massachusetts, and colleagues showed that CRISPR can be improved and used for editing mammalian cells. He currently owns one of the first patents on using CRISPR for gene editing, which is being contested by Doudna’s institution, UC Berkeley.
Once the DNA has been cut in the right spot, the cell will try to repair the cut. But the repair mechanism is error prone, and oftentimes the cells fail to fix the cuts perfectly, ultimately disabling the gene. Disrupting a gene is particularly useful for studying its function and find out what happens if you stop a gene from working. This technique is also useful for treating cancer and infections, where turning off a gene can potentially stop cancer cells and pathogens from dividing or kill them outright.
During this cutting-repair process, one can fool the cells by providing a new piece of DNA. The cells will then incorporate this piece of DNA with desirable edits into the genetic code. This enables researchers to correct a genetic mutation that causes a genetic disease, or replace a defective gene with a healthy one.
[The Conversation’s science, health and technology editors pick their favorite stories.Weekly on Wednesdays.]
Why CRISPR deserved a Nobel Prize
While there is still plenty of room for improvement of these technologies, scientists have already begun testing CRISPR in a number of clinical trials for treating cancer and genetic disorders. CRISPR-based diagnostics have been also been approved by the U.S. Food and Drug Administration under emergency use authorization for COVID-19 testing.
CRISPR does come with a lot of ethical concerns that warrant caution. For example, in 2018, a Chinese scientist prematurely and unethically used CRISPR for editing human embryos and created CRISPR-edited babies that could pass these genetic alterations to their offspring for generations to come. Some have used the technology for other CRISPR-related DIY biohacks that raise more concerns over regulating the gene-editing technology.
Despite these concerns, CRISPR has huge potential to transform how scientists can detect, treat and even eradicate diseases as well as improve agricultural products. Society is already seeing the benefits of this Nobel-winning technology.
Piyush K. Jain, Assistant Professor of Chemical Engineering, Herbert Wertheim College of Engineering, UF Health Cancer Center, University of Florida
Editors note: This is the second of a three-part series examining the proposal to renew the county 1041 permit for Nestlé Waters North America.
With public hearings upcoming on whether Chaffee County should grant a 10-year extension with Nestle Waters North America (NWNA) of its 1041 permit to pump water from a local aquifer to truck to Denver for bottling as Arrowhead Spring Water, a review of the agreement’s history is informative.
The initial 1041 permit approved in 2009 was new legal ground for the county at the time.
Nestlé purchased more than 100 acres of land from the late Frank McMurray, the Big Horn Springs, in 2007; reportedly for more than $850,000. Nestlé had planned to pull water from that spring, but NWNA Natural Resources Manager Larry Lawrence said the company decided against using that spring over environmental concerns. A promised conservation easement on that property at the time has yet to be completed.
Nestlé also purchased the onetime fish hatchery property from Harold and Mary Hagen on the site of the Ruby Mountain Spring. This is the spring that Nestlé now taps for the water it takes from Chaffee County. The 11 acres reportedly sold for more than $2,800,000.
Nestlé established a pumping station at Johnson Village after buying about 1.4 acres of land and the liquor store owned by Steve Hansen for $1,125,000. The store was torn down at the site and the pumping station with large storage tanks built on the site, connected by miles of pipeline from the Ruby Mountain Springs pump house.
State water law requires use permits to include replacement (augmentation) of the water they extract, under complex rules mindful of numerous water rights, especially of those with senior water rights downstream on the Arkansas River.
Terry Scanga, head of the Upper Arkansas Water Conservancy District, explained that while the district didn’t agree then to lease the company water for its replacement, it was able to strike an agreement for the water with the City of Aurora. That agreement ended at some point; the district now does leave the replacement water to Nestlé, contingent on it being placed into the river upstream of its spring site.
The district received more than $152,000 last year from Nestlé for that replacement water.
The original 1041 pact would allow Nestlé to pump as much as 65 million gallons annually from the spring. But local officials say that currently, the amounts pumped never approaches that limit.
At the pumping station, 25 large tanker trucks per day fill up with the water collected in a 30,000-gallon storage tank on-site, and then drive up U.S. Hwy 285 about 130 miles to the Denver bottling plant, where it is treated and packaged in plastic bottles for sale in hundreds of stores around the state.
Lawrence said each of those trucks weighs about 87,000 pounds fully loaded, so drivers take their time getting to their destination. The firm doing the hauling, D.G. Coleman, has a good safety record.
Scanga, who has dealt with water law and water issues for decades, said from his perspective Nestlé has met the requirements of their 1041 permit regarding the water regulations.
Opposition groups, including Unbottle and Protect Chaffee County Water and the long-established environmental group 350 Central Colorado disagree and point to other permit conditions such as hiring local truck drivers, they say have not been met.
They are also critical of what they term is a lack of real oversight of the operation by the county.
Nestlé, portraying itself as a ‘good neighbor,’ has financially supported community causes and provided funds for educational programs.
These include paying a half-million dollars into two education endowments for Salida and Buena Vista schools. It has made $20,000 in one-time donations; including $10,000 to the Chaffee County Community Foundation, as well as contributions to the Boys and Girls Club; local Trout Unlimited chapter, and others.
Thousands of cases of Nestlé Water were also donated to Food Bank of the Rockies and other entities.
Critics often say while commendable, those community benefits are relatively minor in comparison to the profits the company garners from its bottled water sales and the loss of county water as a resource.
We’ll explore more specifics of the pros and cons of this contentious issue in our next report.
Public hearings on the proposed permit renewal are scheduled for 5:00 p.m. Oct. 20 and 9:00 a.m. Oct. 22 at the Chaffee County Fairgrounds. Attendance has to be limited due to COVID-19 concerns, but the hearings will also be available for viewing online.
Research technician and Grand County rancher Wendy Thompson collects hay samples as part of a far-reaching experiment to see if ranchers can fallow hay meadows and conserve more water for the Colorado River. Credit: Dave Timko, This American Land. Aug. 12, 2020 via Water Education Colorado
Grand County rancher Paul Bruchez stands in a hay field near Kremmling, holding a small tuft of hay between his fingertips, twirling it back and forth, seeing how quickly it disintegrates after a summer without water.
The plant, known as timothy, is native to Colorado and feeds thousands of cattle here in the Upper Colorado River Basin.
This hay species and others are being closely watched this year as part of a far-reaching $1 million science experiment, one designed to see if ranchers can take water off of hay fields and successfully measure how much was removed, how much evaporated, and how much was used by plants. They also need to know how reducing their irrigation in this fashion affects the nutritional value of the hay.
If certain hay species retain more nutrients than others when they’re on low-water diets, then ranchers know their cattle will continue to eat well as they evaluate whether they can operate their ranches on less H20—not all the time, but perhaps every other year or every two to three years.
“We’ve spent centuries learning how to irrigate these lands,” Bruchez said. “Now we’re learning what it’s like not to irrigate them.”
Any water saved could be left in the Colorado River, allowing it to become more sustainable, even as the West’s population grows and drought cycles become more intense.
Scaling up
While similar small-scale experiments on five or 10 acres have been done before, this one by comparison is vast in scale, involving 1,200 acres of high-altitude hay meadows, nine ranch families, a team of researchers spread across Colorado, Utah and Nevada, and the backing of powerful water groups, farm interests, and environmentalists.
“We’ve never had a project this large in the state of Colorado,” said Perry Cabot, a Colorado State University researcher who is the lead scientist on the project.
The undertaking is sponsored by the Colorado River Basin Roundtable, whose members include Bruchez.
“We set out on a mission to ensure we have as much science and data as possible,” Bruchez said.
The data being collected serves several needs. It should help ranch families see if they can afford to participate in these modern-era conservation efforts.
It will allow researchers to better understand what works on the ground and what to do, for instance, when rambunctious bulls destroy research equipment enclosures 25 miles from the nearest town.
And it will give policy makers insight into the political problems that will have to be solved, as well as how much money could need to be raised, to make large-scale conservation on the Colorado River feasible.
The $1 million, three-year project is being funded by the state and several environmental groups, with the money being used to pay researchers, buy equipment, and compensate ranch families who temporarily fallow their fields.
Rancher and fly fishing guide Paul Bruchez’s daughter and nephew sit in a hay field at the family ranch near Kremmling. Bruchez is helping spearhead a study among local ranchers, which could inform a potential statewide demand management program. Photo credit: Paul Bruchez via Aspen Journalism
Water for Powell?
Agriculture uses some 80 percent of the water in the seven-state Colorado River Basin, and hay meadows that grow feed for cattle are among the basin’s largest water users.
Last year, under an historic drought agreement on the Colorado River, a new specially protected drought pool in Lake Powell was authorized.
Now Colorado, Utah, Wyoming and New Mexico, the four states that comprise the Colorado River’s Upper Basin, above Lake Powell, are studying whether they can or should help save enough water to fill that drought pool. The pool, authorized at 500,000 acre-feet, is intended as further insurance that the Upper Basin won’t be forced to involuntarily reduce water use from the river under the terms of the Colorado River Compact.
Colorado expects it would need to provide roughly half the water for the drought pool, and, led by the Colorado Water Conservation Board, is working out difficult questions about how that water would be saved and ushered downstream to Lake Powell under a possible voluntary program known as demand management. The research being done near Kremmling will help answer several critical questions.
Wendy Thompson is a rancher who also serves as the research technician for the pilot program, cutting hay samples and gathering soil moisture and precipitation data, among dozens of other tasks. She has driven hundreds of miles across Grand County this summer, checking each of the program’s 24 research sites every week or so, lugging an aging laptop from one meadow to the next.
She knows better than most that ranch families will need real information, such as how fallowing affects crop yields and soil health and production costs, in order to make decisions about whether to join in a voluntary multi-state conservation effort or to back away.
Intuition vs. facts
“The experiment is important to us,” Thompson said. “We want to make decisions based on the science and the data, not a gut feeling.”
Much of the work is grueling, like cutting hay samples week after week, and low tech, like measuring water levels in rain gauges.
But dramatic advances in satellite imagery and global evapotranspiration databases are helping people like Perry Cabot create science-based templates that eventually will be useful not just in Colorado, but Wyoming, Utah, New Mexico and perhaps even farther downstream, on cotton fields in Arizona and avocado groves in California’s Central Valley.
“We now have the ability to measure the whole field,” Cabot said. “It’s becoming more accurate and it’s tremendously convenient if you’re trying to get a good understanding of patterns. We don’t have to rely on one data point anymore.” [Editor’s note: Cabot sits on the board of Water Education Colorado, which is a sponsor of Fresh Water News.]
A view of the popular Pumphouse campground, boat put-in and the upper Colorado River. Photo credit: Brent Gardner-Smith/Aspen Journalism
That this particular team has agronomists, economists and environmentalists pitching in with their expertise is also helping move the science forward.
Brass tacks
“What makes this different is the scale and the depth of the questions we’re asking,” said Aaron Derwingson, an agricultural water specialist with The Nature Conservancy’s Colorado River Program, which is helping to fund the project.
“When we’re done it will be relevant to more people than just the ranchers. We will be able to extrapolate these field conditions and what it means for water savings and the recovery of different species,” he said.
“It’s tough to figure all that out on paper. Here we’re getting down to brass tacks,” Derwingson said.
With irrigation season over, Cabot and his team have serious number crunching to do before they begin monitoring next year, measuring how the hay fields survived their fallowed season, how quickly they return to health, and precisely how much water was conserved.
Early estimates indicate that the ranchers may have saved 1,500 acre-feet to as many as 2,500 acre-feet of water this year. If this process can be replicated, scientists and ranchers could begin to see how long it might take to fill the 500,000 acre-foot drought pool at Lake Powell.
No collateral damage
But even more important to Bruchez and state policy makers is the impact the pilot is having on a highly skeptical ranching community, some of whom are deeply worried that they will lose control of their water.
“We wanted a project that would be as smooth as possible,” Bruchez said. “We wanted to simplify it and ensure there weren’t unintended damages to neighbors who weren’t participating.
“Some people were comfortable about what we were doing and others had great fears,” he said. “We just had to keep telling them, ‘We are not delivering water to Lake Powell. We are trying to fill data gaps.’”
Jerd Smith is editor of Fresh Water News. She can be reached at 720-398-6474, via email at jerd@wateredco.org or @jerd_smith.
Speakers say regional transmission organization crucial to economic decarbonization of electrical supplies
If you’re interested in how Colorado will achieve its climate change goals, prepare to wrap your mind around the concept of an RTO, or regional transmission organization.
Colorado in 2019 set economy-wide carbon reduction goals of 50% by 2030 and 90% by 2050. Getting there will require electrifying many uses that now depend upon fossil fuels. Think cars and then trucks, but eventually houses, too, and more.
This only works if emissions are largely removed from the production of electricity. Colorado legislators in 2019 understood that. They set a target of 80% fewer emissions by 2030 among electrical utilities. They did not tell utilities how to get there.
On a September morning in which smoke was wafting eastward across the Great Plains from the wildfires in the Rocky Mountains and the West Coast, I sat in a cabin near Nebraska’s Lake McConaughy to hear representatives of Colorado’s two largest electrical utilities and one state legislator explain how they thought Colorado might get an RTO or its close relative, an ISO.
The former once again stands for regional transmission organization, and the latter an independent system operator. The function in both cases is much the same. These organizations pool electrical generation resources and also consolidate transmission.
Colorado currently has neither an RTO nor an ISO, although it has been talking about it for several years. Instead, the state remains composed of fiefdoms. These utilities do share electricity to a point, but the system is archaic, little more advanced than one utility calling a neighboring utility and asking if they have a little extra sugar to share.
Now think more broadly of Western states and provinces. There are wide open spaces, the stuff of calendars and posters. That’s the image of the West. The reality in which 80% or more of Westerners live lies in the dispersed archipelagoes of urban development: Colorado’s Front Range, Utah’s Wasatch Front, and Arizona’s Phoenix-Tucson, the mass of Southern California, and so on.
These islands define and determine the West’s electrical infrastructure. You can see them in the nighttime photographs taken from outer space, including this 2012 image from the NASA Earth Observatory/NOSAA NGDC. These 38 islands represent more-or-less autonomous grids, only loosely connected to the other islands and archipelagoes.
RTOs pool commitments and dispatch of generation, creating cost savings for participating utilities. An RTO also consolidates transmission tariff functions under one operator, resulting in more efficient use of high-voltage transmission.
In the 20th century, this pattern of loosely linked islands worked well enough. Each island had its big power plants, most of them coal-fired generation. The intermittency of renewables was not an issue, because there were few renewables. And, of course, there was less need for transmission. In keeping with the fiefdom theme, transmission providers levied charges for electricity that moves through those wires.
Much has changed. Renewables have become the lowest-cost generation. Prices of wind and solar, plus batteries, too, dropped 90% in the last 10 to 15 years. Utilities have figured out how to integrate wind and solar into their resource mix. Xcel Energy, in its Colorado operations, has used more than 70% of wind at certain times, for example.
Coal earlier this year remained the source of 40% of electrical generation in Colorado, but will decline rapidly in the next five years. Two coal-fired units at Pueblo, two in or near Colorado Springs, and one at Craig will cease production by 2025.
Beyond 2025, more closings yet will occur. Tri-State Generation & Transmission, Colorado’s second largest electrical supplier, will close the two remaining plants it operates in Craig by 2030. Xcel Energy, Colorado’s largest utility, will almost certainly have closed additional units, either Hayden or Pawnee, conceivably both, by 2030. Platte River Power Authority also plans to shutter its Rawhide plant north of Fort Collins.
To take advantage of low-cost renewables but also ensure reliable delivery of electricity, utilities will have to do more sharing. That was the common theme of the webinar sponsored by the Colorado Rural Electric Association on Sept. 14.
A must for decarbonization
The subject of RTOs was “a very important topic, and one that the average voter knows absolutely nothing about, in my experience,” said State Sen. Chris Hansen, an engineer who has a Ph.D. in economic geography from Oxford University. He has been involved with most of Colorado’s most important energy legislation of recent years.
Chris Hansen via The Mountain Town News
Hansen pointed out that 80% of energy use in the West is aligned with decarbonization goals. He foresees a $700 billion investment in the next 20 years needed to reinvent electrical generation, transmission, and distribution across the Western grid, including British Columbia and Alberta.
“If we stay with 38 unintegrated grids, I just don’t think we can physically get there (to achieve climate targets) without a hugely expensive overbuild of wind and solar, and nobody wants that,” said Hansen on the webinar.
While decarbonizing the grid, an RTO will deliver strong economic benefits. “Just leave climate change aside for the minute—which is hard to do as fires rage across the West—we are looking at a minimum $4 billion in savings in the West if we have an integrated grid,” he said.
What’s the snag? As Hansen has pointed out, the smart phone took only two years from introduction into the market to broad adoption.
The short answer is that creating markets in the West is relatively new and this stuff gets very, very complicated, as was pointed out by Carrie Simpson, who looks after markets for Xcel’s Colorado operations.
She cited the devilish details involving charges on electricity transmission, how utilities make money, who makes the money and who doesn’t, and then a massive rejiggering of the electrical grid through invention of sophisticated software intended to deliver lowest-cost electricity while keeping the lights on.
Hansen was asked by webinar host Thomas Dougherty, an attorney for Tri-State Generation and Transmission, whether Colorado’s utilities might expect legislative direction in the coming session.
He prefaced his answer by pointing to the ability of an RTO or ISO to reduce needed reserves to ensure reliability. Currently, utilities need backup generation of 16% or 17%. With an RTO, said Hansen, that could be lowered to 10% or 11%. It’s like needing 9 pickups in your fleet instead of 10.
“You could easily take 5% out of reserve margins in Colorado,” he said. “That is worth more than $100 million dollars per year.”
“I think you will see the Legislature really try to push this, because there is so much at stake for the ratepayers,” Hansen replied.
Later, in an email interview, Hansen confirmed his plans to introduce legislation next winter that “will address both the near-term and longer-term issues in CO around transmission. I believe we need a clear policy direction for Colorado to join a well-structured RTO or ISO and transmission owners. To accomplish that goal, we may need incentives and disincentives for operators.”
Hansen also confirmed that he believes even existing coal plants are less foundational than they once were.
Why Tri-State needs it
Duane Highley, the chief executive of Tri-State, has practical experience in the benefits of regional markets. A veteran of 38 years in electrical cooperatives in the Midwest, he recalled being in Arkansas a few years ago when he drew on the power of the Midwest Independent System Operator, or MISO, to deliver wind power from Iowa during winter to Arkansas customers.
Duane Highley via The Mountain Town News
This enabled coal-fired power plants to be shut down. He called it “decommitting” of resources.
Tri-State must decommit coal resources in coming years to meet Colorado’s decarbonization targets. The utility, Colorado’s second largest, behind Xcel, has started shifting from coal. It closed one small plant in Colorado, at Nucla, in September 2019, and Escalante, in New Mexico, in September 2020. The three much larger units at Craig, of which Tri-State shares ownership with other utilities, will close between 2025 and 2030.
On the flip side, Tri-State is adding 1,000 megawatts of renewable generation before the end of 2024. That will get Tri-State to 50% renewables across its four-state operating area. It then has plans for more than 2,000 megawatts of additional renewable generation from 2025 to 2030.
That won’t be enough to get Tri-State to the 80% emission reduction by 2030 that Colorado lawmakers want to see. In preliminary filings with the PUC, Tri-State has not shown its cards about how it intends to get there. Environmental groups have started making noise. In a filing with the PUC, Western Resource Advocates pointed out that current plans will get Tri-State to only a 34% reduction in carbon emissions by 2030 as compared to 2005 levels.
Crucial will be what Tri-State intends to do with its share of two other coal-fired power plants, the Laramie River Station in Wyoming and the Springerville plant in Arizona.
Highley, in the webinar, did not acknowledge the critique directly. He did, however, say that Tri-State needs an RTO to get across the finish line.
“We see a strong need for an RTO to get us past that 50% renewable level as we try to integrate larger and larger amounts of renewables,” he said.
Colorado and its neighbors in the Rocky Mountains currently operate bilateral markets. Highley described it as getting “on the phone and calling your neighbors. That’s sort of the way the West operates. It’s very inefficient,” he said.
This is from the Oct. 2, 2020 issue of Big Pivots. If you want to be on the subscription list, go to BigPivots.com
Utilities in Colorado in 2017 began getting together in an ad hoc organization called the Mountain West Transmission Group to talk about how to do it more efficiently. That effort fell apart in spring 2019 when Xcel pulled out. The company said the benefits weren’t obvious relative to the cost.
Tri-State, which delivers about roughly a quarter of electricity in Colorado, and Xcel, which has more than 60% of market share, have gone their separate ways. Both have led efforts to create energy imbalance markets, or EIMs. These are best described as the first step toward an RTO or ISO, with smaller risk and smaller rewards.
The first, small step
Only five months after arriving from Arkansas to chart a new course for Tri-State, Highley in September 2019 announced formation of an energy imbalance market, or EIM, in conjunction with the Western Area Power Authority, the federal agency that delivers electricity from federal dams. The federal government makes the low-cost hydroelectric power available to co-operatives and municipal utilities, but not to Xcel and other investor-owned utilities.
Think of an energy imbalance market, or EIM, as being like a 100-level class in energy markets. It is a low-cost, low-gain endeavor. RTOs are a graduate-level course.
With an EIM, utilities can share power, but on a somewhat limited basis. There is sub-hourly balancing, but not the day-ahead planning that begins to deliver big benefits.
“We wanted to get something going. It may not be the ultimate solution for the West, but we can recover the cost from the savings in three years. Maybe this is the first step toward an ultimate market or restarting the Mountain West conversation,” Highley said.
Graphic via The Mountain Town News
This new EIM will go on-line in February 2021 and will be administered through the Arkansas-based Southwest Power Pool.
Xcel and its three partners—Platte River, Colorado Springs Utilities, and Black Hills Energy—are looking west. Are you ready for more alphabet soup? They will have CAISO creating an EIM for them. CAISO stands for California Independent System Operator. It was established in 1998. An ISO, like an RTO, is motivated to produce efficiency. They’re often compared to air traffic controllers, because they independently manage the traffic on a power grid that they don’t own, much like air traffic controllers manage airplane traffic in the airways and on airport runways. CAISO has advanced services to utilities north and east. This, however, will not be an RTO.
Highley said that the “real prize will be getting the RTO,” and then he threw down a spade in the conversation.
“About 90% of transmission (in Colorado) is controlled by Tri-State and our partner, the Western Area Power Authority,” he said. “We are key to what happens regionally and not just in the state of Colorado.”
It’s been conventional wisdom that an RTO will look either east or west. There are problems in both directions.
Graphic via The Mountain Town News
One challenge is that of political control. Do you think for a second that Wyoming will allow control of its electrical grid in the hands of appointees of the governor of California? Colorado, which of late has aligned more comfortably with California in its politics, nonetheless has its own hesitancy about that sort of arrangement. It’s not a hypothetical example. California legislators in 2019 refused to put administration of CAISO into independent hands. In other words, the better acronym for CAISO would be CASO. Forget about Independent.
Tooting the horn
Highley, coming from Arkansas, toots the horn of the Southwest Power Pool. “It would make sense in some ways for us to help SPP to move west, and CAISO, of course, is moving east. Think of it like the great railroad days.”
The golden spike completing the transcontinental railroad was hammered down in the salt flats along the Great Salt Lake in 1869. Highley describes a different geography, with a fortune yet to be made – or costs reduced – depending upon who can get wind-generated electricity of the Great Plains to markets.
“There’s an extremely large amount of wind in SPP area that needs to go somewhere, and it has negative pricing now at some points in time. And they haven’t built all the wind that will be built in Kansas yet,” he said. “It’s going to be an opportunity for whoever manages the DC ties to better tie together the grids east and west. Everything east of those ties is currently managed by SPP,” said Highley.
The DC stands for direct-current. The DC ties provide portals between the Eastern Interconnection Grid and the Western Interconnection, which hum along not quite on the same tune and both on alternating current. (Surely you have experience with this part of the alphabet soup). Think of narrow gates along a very tall fence. There are eight such DC portals between Artesia, N.M., and Miles City, Mont. One is north of Lamar, Colorado. There are also two in the Nebraska panhandle.
The afternoon of the webinar, I drove to the one near Stegall, Neb., which is about 35 minutes southwest of Scottsbluff. How would I not? I had been hearing about this for near 40 years. You leave the valley of the North Platte River and its fields of corn and climb into the landscape out of a Remington painting. There was a flock of wild turkeys and then, just over the hill, the focus of all the electrical lines: the David Hamil Tie.
It’s owned and operated by Tri-State, but used exclusively to get electricity from the Laramie River Station at Wheatland, about an hour to the west, to its customers in the Eastern grid. I was neither thrilled nor disappointed by what I saw. An electrical engineer probably understood what was evident to the eye, but I did not.
There has been much talk about creating greater permeability between this giant electrical wall just beyond eyesight of the Rocky Mountains and the energy resources of the Great Plains. A study by the National Renewable Energy Laboratory was devoted to that idea, with the goal being to integrate greater quantities of renewables. It was called the Seams study, but it got smothered by Trump administration officials. It is likely to re-emerge.
“Yes, that study will be very helpful in guiding our policy discussions in this area, as will the DoE study being done by Utah on western grid options,” said Hansen in an e-mail after the webinar.
The David Hamil DC Tie in western Nebraska is one of eight portals between the Eastern and Western alternating current grids. Photo/Allen Best
Optimizing the east-west gates
These portals currently can accommodate transmission of 1,300 megawatts. Highley suggested – but did not go into details – about figuring out creating wider gates at these portals.
“Who best could manage those DC ties and optimize them than possibly SPP,” he asked rhetorically, referring to the Arkansas-based Southwest Power Pool.
(The Colorado Public Utilities Commission will host an information meeting devoted specifically to transmission on Oct. 22, and I would be shocked if this is not addressed. I also expect much discussion of the infamous Seams Study squelched by the coal-happy Trump administration.)
Highley said the real benefit of renewables will be realized by creating opportunities to move them east and west – and in different time zones. “The person who sits on the seams will have the opportunity to either make a lot of money or lower prices, however you look at it,” he said.
Much has been made about seams in Colorado (including a story I did that was published in March). “I do think there will be a seam somewhere,” Highley said. Too much has been made of seams, too much “fear” expressed. “If you look east of us, there are seams all over the place. This problem has been solved any number of times. We can figure this out, too.”
Carrie Simpson via The Mountain Town News
Simpson, representing Xcel, suggested a third option for an RTO, one that does not explicitly look either east or west but instead uses Colorado as a focal point. But, she said, Colorado alone cannot deliver the market efficiencies. The footprint must be somewhat larger, but she did not specify exactly how large.
When may Colorado become part of an RTO? That was the parting question, and all three panelists answered much alike,
“Five years might be a little quick, but I would love to see this happen in the 2025-2028 time-frame,” said Hansen.
Xcel’s Simpson largely agreed. “Five years may be a little aggressive, but I do think that the EIM will open up new opportunities for us to learn about our system and how we can interact with the rest of the West more efficiently.”
Tri-State’s Highley was the most sporting. He offered to bet a bottle of wine that a quicker pace can occur, delivering an RTO by the end of 2025.
“I will keep that wine bottle bet out there,” he said.
Allen Best is a Colorado-based journalist who publishes an e-magazine called Big Pivots. Reach him at allen.best@comcast.net or 303.463.8630.
FromThe Grand Junction Daily Sentinel (Dennis Webb):
In the world of surface water supply measurement and management, what’s known as the 2020 water year just came to an end, on Sept 30. And people in places like Colorado can only hope that when it comes to precipitation, water year 2021 has better things in store.
As of the weekly U.S. Drought Monitor update issued Thursday, more than 99% of Colorado was in some level of drought, and most of the Western Slope was in at least extreme drought. Worse yet, nearly 17 percent of the state — mostly on the Western Slope and including eastern and southern Mesa County and large parts of nearby counties — is now in exceptional drought, the worst drought category the Drought Monitor uses.
“What we’re seeing across the entirety of the Intermountain West following this brutal hot, dry summer is basically moderate drought to extreme drought,” Peter Goble, a climatologist with the Colorado Climate Center at Colorado State University, said in a webinar update on the drought situation Tuesday.
While there are pockets of exceptions, “things are certainly pointing dry for the most part,” Goble said.
Precipitation during the 2020 water year in most of the Upper Colorado River Basin was below 70% of normal, said Zach Schwalbe, a research associate at the Colorado Climate Center.
Insufficient snowpack in many areas was followed by a summer where monsoonal rains largely failed to arrive. Cumulative flows on the Colorado River near the Colorado/Utah line for the water year came in just under 3 million acre-feet, compared to more than 4 million in an average year.
Blue Mesa Reservoir, which managed to fill last year following a dry 2018, is now down to 71% of the 1981-2018 average for this time of year. Lake Powell and Lake Mead, the two largest reservoirs on the Colorado River storage system, are at 66 and 59% of average, respectively. Upper Colorado River Basin states rely on water in Lake Powell to meet water delivery obligations to downstream states and Mexico.
Some reservoir levels, such as at Lake Granby in the Colorado River’s headwaters, are doing better. Goble said local conditions can vary when it comes to reservoir storage…
Streamflows also are suffering from the drought. Schwalbe said the Animas River was flowing through Durango Tuesday at a record-low level for that date.
Warmer-than-normal temperatures this summer have aggravated the impacts of below-average precipitation. Combined with other factors such as winds, the heat has driven up evaporative demand, which means how quickly plants and trees use water. Soil moisture conditions are also much drier than normal across much of Colorado, Goble said.
He noted that among other things, the drought conditions contributed to a disastrous fire season in Colorado that has included respectively the first- and third-largest wildfires in the state’s history, the Pine Gulch Fire north of Grand Junction and the Cameron Peak Fire west of Fort Collins.
Treste Huse, a hydrologist with the National Weather Service, noted in Tuesday’s webinar that possible precipitation is in the forecast in Colorado for this weekend, along with cooler weather that could result in snow in the mountains and some high mountain valleys. But she said that unfortunately drier- and warmer-than-normal conditions are expected in the eight- to 14-day outlook in Colorado. The outlook for the next month as a whole also shows above-average chances for above-normal temperatures and below-normal precipitation…
Goble noted that La Niña climate conditions also are developing and are generally associated with a dry fall in Colorado. Once winter arrives, La Niña conditions can be favorable when it comes to snowfall in the northern Rockies in Colorado and parts of Utah, and Wyoming, but a La Niña is “certainly not good news, fall or winter, for the southern portion of the Intermountain West,” he said.
Here’s the release from Utah State University (Lynnette Harris):
A team of scientists at Utah State University has developed a new tool to forecast drought and water flow in the Colorado River several years in advance. Although the river’s headwaters are in landlocked Wyoming and Colorado, water levels are linked to sea surface temperatures in parts of the Pacific and Atlantic oceans and the water’s long-term ocean memory. The group’s paper, “Colorado River water supply is predictable on multi-year timescales owing to long-term ocean memory” was published October 9 by Communications Earth and Environment, an open-access journal from Nature Research.
Researchers whose work on a tool a to predict Colorado River flows appears in Communications Earth and Environment, from left to right are climate scientists Simon Wang, Robert Gillies and Yoshi Chikamoto, agroclimate Extension specialist Matt Yost, and fire ecologist Larissa Yocom. Photo credit: Utah State University
The Colorado River is the most important water resource in the semi-arid western United States and faces growing demand from users in California, Arizona, New Mexico, Colorado and Utah. Because water shortages in the Colorado River impact energy production, food and drinking water security, forestry and tourism, tools to predict drought and low water levels could inform management decisions that affect millions of people.
Because water shortages in the Colorado River impact energy production, food and drinking water security, forestry and tourism, tools to predict drought and low water levels could inform management decisions that affect millions of people. Photo credit: Utah State University
Current drought forecasts focus on short-term indicators which limits their usefulness because short-term weather phenomena have too great an influence on the models.
“This new approach is robust and means that water managers, for the first time, have a tool to better estimate water supply in the Colorado River for the future,” Robert Gillies, professor in USU’s Department of Plants, Soils and Climate (PSC) and director of the Utah Climate Center, said. “The model can be run iteratively so every year a new forecast for the next three years can be created.”
In addition to ocean memory, water flows are impacted by land systems—including soils, groundwater, vegetation, and perennial snowpack—which play important roles in tempering the effects of short-term precipitation events. The researchers hypothesized that multi-year predictions could be achieved by using long-term ocean memory and associated atmospheric effects and the filtering effects of land systems.
The study’s lead author, Yoshimitsu Chikamoto, assistant professor of earth systems modeling in USU’s PSC department, said the components of the complex climate model include simulations of clouds and aerosols in the atmosphere, land surface characteristics, ocean currents and mixing and sea surface heat and water exchange.
“These predictions can provide a more long-term perspective,” Chikamoto said. “So if we know we have a water shortage prediction we need to work with policymakers on allocating those water resources.”
Simon Wang, USU professor of climate dynamics, said water managers and forecasters are familiar with El Niño and La Niña and the ocean’s connections to weather in the southwestern U.S. However, the upper basin of the Colorado River is not in the southwest and forecasts have not connected the dynamics of parts of the oceans with the Colorado River as the new forecasting tool does.
Matt Yost, PSC assistant professor and USU Extension agroclimate specialist, said having a two-year lead-time on preparing for drought could have a huge impact on farmers as they plan crop rotations and make other business decisions.
Co-author Larissa Yocom, assistant professor of fire ecology in USU’s Department of Wildland Resources, said a tool that can provide a long-term forecast of drought in areas impacted by the Colorado River could give managers a jump-start in preparing for wildland fire seasons.
Wang said Utah Climate Center researchers have developed models of drought cycles in the region and have recently studied the dynamics of river flows and shrinking water levels in the Great Salt Lake.
“In doing that work, we know that water managers don’t have tools to forecast Colorado River flows very long into the future and that is a constraint on what they can do,” Wang said. “We have built statistical models in the past, and Yoshi (Chikamoto) has expertise and in-depth knowledge of ocean dynamics so we talked about giving this idea a try because we found nothing in the literature to model these dynamics in the upper basin.”
“Using our tool we can develop an operational forecast of the Colorado River’s water supply,” Chikamoto added.
Improving the performance of water systems in western basins such as the Colorado River can entail a variety of expensive changes to infrastructure, policy, and management. Throughout much of the 20th century water development era, federal appropriations were sufficient to cover major investments. Today however, other sources of governmental and non-governmental funds and funding mechanisms are essential to improving water management and system performance. Determining the “how” and “who” of water financing raises several thorny questions about what approaches are most efficient, practicable, and equitable. In this webinar series, we will explore issues such as the rise of creative funding mechanisms, the role of private investments and water markets, leveraging the resources of the business community, and the linkages between healthy landscapes, climate adaptation, and improved water management resiliency.
Community members can now share comments about Denver Water’s Gross Reservoir expansion project proposal, which is being reviewed by Boulder County.
Although a postcard sent to property owners near Gross Reservoir said public comment about the proposed expansion project should be in by Oct. 14, county staff clarified that community members can comment at any point until the Boulder County Board of Commissioners makes a final decision.
The current Oct. 14 deadline is for referral agencies and even that may be pushed if enough agencies request an extension. If an extension is granted, a new postcard will be sent to property owners, according to Boulder County.
While Boulder County spokesman Richard Hackett said it’s helpful to have community comments in early, he stressed there is no official deadline or cutoff. Some adjacent property owners, such as Timberline Fire Protection District, also are referral agencies on the project, which Hackett said is part of the explanation for the postcard’s wording.
No public meetings or hearings have been scheduled yet, but the county will announce them to its Gross Reservoir Expansion Project news list. People who want to receive emailed or text messaged notifications can sign up at here.
Meanwhile, community members can submit questions or written comments to grossreservoir@bouldercounty.org.
Gross Reservoir — The Gross Reservoir Expansion Project will raise the height of the existing dam by 131 feet, which will allow the capacity of the reservoir, pictured, to increase by 77,000 acre-feet. The additional water storage will help prevent future shortfalls during droughts and helps offset an imbalance in Denver Water’s collection system. With this project, Denver Water will provide water to current and future customers while providing environmental benefits to Colorado’s rivers and streams. Photo credit: Denver Water
All week, the Animas River has recorded record lows at a gauge station in Durango, which has been tracking flows on the river for 107 years.
On Thursday, for instance, the Animas River was reportedly running at 117 cubic feet per second – under the previous record low of 138 cfs in 1957 and far below the average of 447 cfs for this time of year.
The low flows on the Animas River come as no surprise as the region has been gripped by a prolonged drought.
Since January, a weather station at Durango-La Plata County Airport has recorded just 5 inches or so of precipitation, a 7-inch departure from historic averages at the site.
On Thursday, the U.S. Drought Monitor released a report that showed all of La Plata County engulfed in the “extreme” and “exceptional” drought categories, the center’s highest listings for dryness in a region.
West Drought Monitor October 6, 2020.
And, several weather stations in the headwaters of the Animas River recorded the lowest precipitation levels in August and September based on about 40 years of record keeping.
“The combination of an extremely dry spring, lack of a monsoon and above-average summer and fall temperatures has resulted in very low flows on the Animas River,” said Ashley Nielson, a senior hydrologist with the Colorado Basin River Forecast Center…
Becky Bollinger, a research associate with the Colorado Climate Center, said 2020’s water year was the third-driest on record, behind only the infamous drought years of 2002 and 2018…
The high country of the San Juan Mountains received about normal snowpack this winter, but it melted fast and early. On top of that, soils were so dry they absorbed more water than usual.
San Miguel, Dolores, Animas, and San Juan Basin High/Low graph May 14, 2020 via the NRCS.
One issue that concerns Bollinger is that the atmosphere is so dry, it is causing rapid evaporation of what little moisture there is – called evaporative demand…
Bollinger wonders whether a lack of monsoons in Colorado is the new normal.
“This is the fourth year in a row we have not gotten the benefits of monsoon moisture,” she said. “It’s concerning to think that might be a trend. Or is it just really bad luck? I don’t know the answer to that right now.”
[…]
As of this week, Vallecito and Lemon reservoirs were at about 24% and 27% capacity. Ken Beck, superintendent of the Pine River Irrigation District, said in an email to constituents that outflows were reduced to 5 cfs on Thursday…
The main concern for water managers is whether the upcoming winter will bring enough snowpack to replenish reservoirs. In previous drought years, such as 2018, the next winter brought heavy snowfall.
But meteorologists say the region may be stuck in a La Niña cycle, which typically means less snow for Southwest Colorado. That could result in less water for livestock and municipalities, and spell disaster for next year’s wildfire season.
Click on a thumbnail graphic to view a gallery of drought data from the US Drought Monitor.
US Drought Monitor October 6, 2020.
West Drought Monitor October 6, 2020.
Colorado Drought Monitor October 6, 2020.
Click here to go to the US Drought Monitor website. Here’s an excerpt:
This Week’s Drought Summary
Temperatures for the week were below normal over much of the Plains, Midwest, South, Southeast and Mid-Atlantic, with departures of 5-10 degrees below normal for many locations. The West continued to be warm with temperatures near normal to slightly above through the Rocky Mountains and 5-10 degrees above normal over the West Coast. Temperatures in New England were also slightly above normal, with the greatest departures in Maine. Below-normal precipitation dominated almost the entire country. Precipitation amounts were greatest over the eastern seaboard, with the Northeast recording the most rain. Almost no precipitation was recorded in the western two-thirds of the country. In the next several days, eyes will be on Hurricane Delta and where it will make landfall along the Gulf Coast. Current projections are taking the storm ashore in Louisiana…
Cooler than normal temperatures dominated the eastern half of the region with departures of up to 6-8 degrees below normal while the western half was warmer than normal with departures of 4-6 degrees above normal. Precipitation was almost none existent in the region for the week, with only a few areas of light showers in portions of South Dakota and Nebraska. Moderate drought and abnormally dry conditions were expanded in portions of eastern North Dakota. In eastern, southwest and central Nebraska, severe drought expanded along with some expansion of moderate drought. Moderate, severe, and extreme drought also expanded in western Nebraska as the entire state continues to dry out. In South Dakota, moderate drought was expanded in the northwest while severe drought was expanded in the southeast. A new area of extreme drought was also introduced in southeast South Dakota. Extreme drought was introduced in far southwest South Dakota while moderate drought also expanded to the east. In northeast Wyoming, moderate drought expanded while severe drought expanded slightly in the southeast. Eastern Colorado had a large expansion of extreme drought conditions while severe drought expanded in the northeast…
Hot and dry continues to be the theme of the region and also the monsoon season that was minimal at best, all of which is providing the conduit for continued deterioration in the region. Over the last 6 months, Arizona and California have had their warmest April–September period ever in 126 years, with New Mexico and Nevada the 2nd warmest. During that same 6-month period, Utah and Arizona have also had their driest period ever, with New Mexico having their 2nd and Colorado their 3rd driest. In Arizona, the new established record for statewide precipitation was greater than 2 inches drier than the previous record. During the current week, temperatures were warmest along the coast, where departures were 5-10 degrees above normal for the week. Drought intensified and expanded over southeast Montana and into northwest Wyoming where moderate, severe, and extreme drought all increased in coverage. A new area of moderate drought was introduced in southwest Wyoming and into southeast Idaho. Western Colorado and eastern Utah had large expansions of exceptional drought, and this also went into northwest New Mexico. Extreme drought also expanded over north central Colorado. Western and northern New Mexico as well as northeast Arizona had severe and extreme drought expand while a new area of extreme drought was introduced in eastern portions of New Mexico. In southern Arizona, extreme and exceptional drought also expanded in coverage. In Idaho, abnormally dry conditions and moderate drought expanded over the southeast and southwest portions of the state as well as into southeast Oregon. Central and northeast Oregon also had expansion of severe and extreme drought this week…
Although most of the region received no precipitation during the week, cooler temperatures helped to reduce the amount of drought expansion this week as temperatures were generally 3-6 degrees below normal. Abnormally dry conditions and moderate drought were expanded over northern Oklahoma this week while extreme drought expanded over the southwest portions of the state. Abnormally dry conditions expanded over portions of southern Louisiana and eastern Mississippi while moderate drought and abnormally dry conditions expanded over northwest Arkansas. Texas continued to see conditions deteriorate over the panhandle and areas of the south Texas Plains and into the Hill Country.
US Drought Monitor one week change map ending October 6, 2020.
Golfers take shots on the green lawns of the City Park Golf Course in central Denver on Sept. 28 2020. Urban utilities this summer saw sharp increases in single-family home and outdoor water use, primarily due to drought. Photo credit: Lindsay Fendt/Aspen Journalism
The COVID-19 pandemic has dominated much of life and the economy in 2020, but when it comes to water use along the Front Range, drought is still the ruling force.
Most municipal water providers saw commercial water use plummet at the beginning of the pandemic, but those savings were quickly erased once the hot summer rolled in and the region’s residents switched on their sprinklers.
“The increase in residential and irrigation use have more than offset the decrease in commercial use, resulting in above normal water use across the service area,” said Todd Hartman with Denver Water. “The short story from our perspective is that we are seeing higher use this watering season because of very hot, dry conditions.”
The entire state of Colorado has been under some level of drought since early August, meaning that grass, shrubs and trees need more water than normal. To make up for that increased demand, Front Range communities have to rely more on the Western Slope water contained in their reservoirs.
In a typical year about 48% of Denver’s water comes from the Western Slope, while Colorado Springs pipes in about 75% of its water from the other side of the divide. Fort Collins typically gets more than half of its water from the Western Slope and Aurora Water gets 25% of its water from sources within the Colorado River basin.
Even though most of western Colorado is now in an extreme drought, Front Range water providers are able to rely on their storage from previous years to provide that additional water and then refill the reservoirs during the next snowmelt season.
Northern Water manages the Colorado Big-Thompson project, which pumps water from west of the Continental Divide to municipal and agricultural users along the northern Front Range. During a drought, the water district’s board generally increases the amount of water per share of the project that it doles out, known as a quota, allowing more water to be drawn from its reservoirs and increasing the amount of water delivered to shareholders. In a typical year, the project delivers about 217,000 acre-feet of water to its users. This year, to make up for drought, the board gave users an additional 31,000 acre-feet of water.
“The more water that’s available on the Front Range, like through soil moisture and local storage, the lower the quota we set because the rest of the demand can be furnished by local sources,” said Jeff Stahla with Northern Water. “The drier it is then the higher the quota, because we’re supplementing.”
Dillon Reservoir in late August 2020. The reservoir is the largest in Denver Water’s collection system, which delivers water to 1.5 million people. With drought leading to increased water use this year through August, Front Range water providers have had to rely more on water stored in reservoirs. Photo credit: Lindsay Fendt/Aspen Journalism
Outdoor watering dominates
The data from the year so far show just how overwhelming a factor outdoor water use is on overall water-use trends. Even in a pandemic, the watering needs of yards on the Front Range during drought seem to supersede any other behavior changes. In a typical year, 40% of urban water use on the Front Range is for outdoor use. That number often increases during a drought.
Preliminary consumption numbers for the year through August show single-family use up in Denver by about 20% and multi-family use up 5%. Industrial use is down 5%, office buildings are down 9% and restaurants — which remain under limited operations due to the pandemic — are down a whopping 31%. Altogether, Denver Water saw a 12% increase in water use system wide this year, through August. The increase in single-family use began in May when many home irrigation systems were likely first turned on. Other Front Range cities saw similar trends.
Because the pandemic overlapped with a hot, dry summer, it’s been difficult for utilities to determine how much of an effect either event had on overall water use. The most revealing data comes from the spring when businesses closed and most people had yet to turn on their sprinklers.
At Aurora Water, the water conservation team started pulling data early in the pandemic to see if any trends emerged. Between March and April — right as the state transitioned to a stay-at-home order — Aurora saw a commercial water use drop of 14.3% accompanied with an 8.8% increase in residential water use and a 4.6% increase in multi-family use.
But according to Tim York, a water conservation specialist at Aurora Water, the modest increases in residential water use skyrocketed once irrigation season began. Commercial use also ticked back up once businesses began reopening. According to York, Aurora Water saw a 10.3% system-wide increase from January to July that they attribute almost entirely to drought conditions.
“Indoor use kind of is what it is, right? I mean, you’ve got to use the toilet as many times as you need to, you’ve got to do dishes when they’re dirty, you’re going to take your showers just like you normally would, but people react differently to weather,” York said.
A couple sits at the edge of the lake at City Park in central Denver on Sept. 28 2020. In a typical year, about 48 percent of Denver’s water comes from the Western Slope. Photo credit: Lindsay Fendt/Aspen Journalism
‘People are home and wanting to work on their yards’
Most utilities had an adequate amount of water storage going into the summer to make up for the increased water use. Denver, Colorado Springs and Aurora have maintained their normal summer watering restrictions, which include guidelines on when and how often to water outdoors.
On Oct. 1, Fort Collins went under mandatory level IV water restrictions in order to avoid a water shortage in the fall. In most cases residents are no longer allowed to water their lawns and cannot wash their cars. The restrictions are due partially to drought conditions and some planned maintenance on water infrastructure, but the city is also taking preemptive measures to conserve water in case the Cameron Peak Fire begins to affect the water quality in the Poudre River.
Though the drought has been the driving factor in water use this year, water managers say that the pandemic likely did have some effect on behavior and might even pay dividends down the line. Abbye Neel, a water conservation specialist in Fort Collins, says the city has seen a large increase in its Xeriscape Incentive Program. The program provides rebates and project support for Fort Collins residents to redesign their yards to be more water-efficient.
“I have nothing to back this up, but I think it’s just like people are home and wanting to work on their yards,” she said. “There’s a high potential to do more projects this year as people actually get their ducks in a row and sign up.”
This story initially ran online in the Sky-Hi News on Oct. 3 and in print in the Summit Daily News Oct. 4.
Water from an aquifer that lies below Colorado’s San Luis Valley flows through a center-pivot irrigation system, one of some 14,000 that draw water from below. Photo credit:Luna Anna Archey/High Country News
FromThe Grand Junction Daily Sentinel (Dennis Webb):
The Colorado Department of Natural Resources on Wednesday held the first meeting of the Anti-Speculation Law Work Group. The task force was established as a result of passage of a bill this year to consider ways to strengthen the current anti-speculation law and recommend any changes to a legislative committee by Aug. 15 [2021].
The bill was sponsored by state Reps. Dylan Roberts, D-Avon and Marc Catlin, R-Montrose, and Sens. Kerry Donovan, D-Vail, and Don Coram, R-Montrose. It was inspired by a growing number purchases of agricultural land and associated water rights by investment firms, including wide-scale purchases in the Grand Valley by Water Asset Management, which is based in New York.
Current state law prohibits water speculation by requiring water to be used for a beneficial purpose. An 18-member work group made up of state agency staff, water lawyers and others will be considering how the law might be tightened.
None of the bill sponsors participated in Wednesday’s meeting. But Scott Steinbrecher, an assistant deputy attorney general co-chairing the task force, said a clear purpose of the bill is to examine how the law should be strengthened to prevent situations where water rights are bought and leased back to farmers though the intent is to use the water like an investment.
Alex Funk, a task force member who is an agricultural water resource specialist with the Colorado Water Conservation Board, a state agency, voiced concern about approaches that might limit the value of assets to agricultural producers.
“There is certainly a tension here where land and water assets are extremely valuable to producers. In some cases these are sort of their only asset,” he said…Task force member Peter Fleming, general counsel for the Colorado River District, which has been watching some of the area water-related acquisitions by investment firms with concern, said agricultural producers looking to sell their assets are entitled to do that.
“I assume we don’t want to prevent that from happening,” he said.
He said what’s important under even the current law is the intent of the buyer of water rights. He said they can profit from the water’s use but their end goal in buying rights can’t be the pure value of the water, and he’s interested in looking at ways to determine intent.
Daris Jutten, a rancher in the Uncompahgre Valley, said his interest in serving on the task force is considering impacts on property rights.
“I want to keep the land value prices where they are but I also don’t want to see buy and dry,” he said.
He was referring to situations in which transactions result in water no longer being used to irrigate agricultural land and instead going for other uses such as by municipal utilities.
Task force member Joe Frank, general manager of the Lower South Platte Water Conservancy District, said the district sees entities buying up water there with the intent to dry up land in the future.
“In addition to that we do have those who want to sell, so water is a property right. … It’s a dilemma, but we don’t want to impact people’s property rights,” he said.
River system withdrawal 2020. Photo credit: Edvin Johansson via North Carolina State University
Here’s the release from North Carolina State University (Sankar Arumugam, Sudarshana Mukhopadhyay, Matt Shipman):
River systems are essential resources for everything from drinking water supply to power generation – but these systems are also hydrologically complex, and it is not always clear how water flow data from various monitoring points relates to any specific piece of infrastructure. Researchers from Cornell University and North Carolina State University have now developed a tool that draws from multiple databases to give water resource managers and infrastructure users the information they need to make informed decisions about water use on river networks.
“A streamgage tells you what the water level is at a specific point in the river – but that’s not really enough information,” says Sankar Arumugam, co-author of a paper on the work and a professor of civil engineering at NC State. “If you are an infrastructure operator, what you really need to know is how long it will take for that water-level information to be relevant to your infrastructure. How far away is the streamgage from your water intake along the river path, not just as the crow flies? How closely connected are those two things, hydrologically?”
“This information is important for managing water systems efficiently, for ensuring that infrastructure – such as power plants – are able to continue operating, and for protecting the infrastructure,” says Sudarshana Mukhopadhyay, first author of the paper and currently a postdoctoral researcher at Cornell University. “The information is particularly important during extreme conditions, such as flooding or drought.
“All of that data already exists, it’s just scattered across separate databases. We’ve developed an algorithm that efficiently pulls all of that information into one place and accounts for how the streamgages and the various infrastructure sites are hydrologically connected over a large watershed,” says Mukhopadhyay, who worked on the research as a Ph.D. student at NC State.
To demonstrate the tool’s utility, the researchers used the algorithm to create a connectivity network demonstrating the interconnectedness of about 1,400 reservoirs and 1,600 streamgages in the upper and lower Colorado River basins.
For this network, the algorithm used data from three sources: topographic information from the U.S. Geological Survey’s (USGS) National Hydrographic Dataset; streamgages from the USGS National Water Information System; and reservoir data from the National Inventory of Dams.
“This is a tool that can be used by power plant operators, reservoir operators, water resource managers – really it’s for anyone who draws water from the river system,” Mukhopadhyay says. “It can inform them about river conditions both upstream and downstream, and help them make decisions about where they should draw water from the system.”
The researchers have also made a template publicly available, allowing anyone to develop similar connectivity networks for other watersheds.
“It should be fairly easy for water resources professionals,” Mukhopadhyay says.
“We are currently working on a national version, which we think will help us better understand all of the ways that river basins connect infrastructures across the country,” Arumugam says.
The work was done with support from the National Science Foundation, under grants 1823111 and 1442909; and from the USGS Powell Center Working Group Project “A global synthesis of land-surface fluxes under natural and human-altered watersheds using the Budyko framework.”