Here’s the release from the Bureau of Reclamation (Becki Bryant and Patti Aaron):
The Bureau of Reclamation has released its October 24-Month Study and 2-year projections of major reservoir levels within the Colorado River system. These projections detail hydrologic conditions and projected operations for Colorado River system reservoirs and are used by Reclamation and water users in the basin for future water management planning.
The October projections are the first to include inflow forecasts developed by the National Oceanic and Atmospheric Administration’s (NOAA) Colorado Basin River Forecast Center (CBRFC) that incorporate updated climate conditions and data sets known as the “U.S. Climate Normals.” Compared to the previous period used by the CBRFC to develop the inflow forecasts (1981-2010), the more recent 30-year period (1991-2020) eliminates the wetter hydrology experienced in the 1980s and includes most of the 22-year drought that started in 2000 (and continues to the present). NOAA updates the “Climate Normals” to a new 30-year period every 10 years, consistent with weather and forecasting offices in the U.S.
As a result of this update, the median water year 2022 inflow forecast into Lake Powell decreased by 800,000 acre-feet and Reclamation’s October projections show lower Lake Powell elevations compared to the September projections.
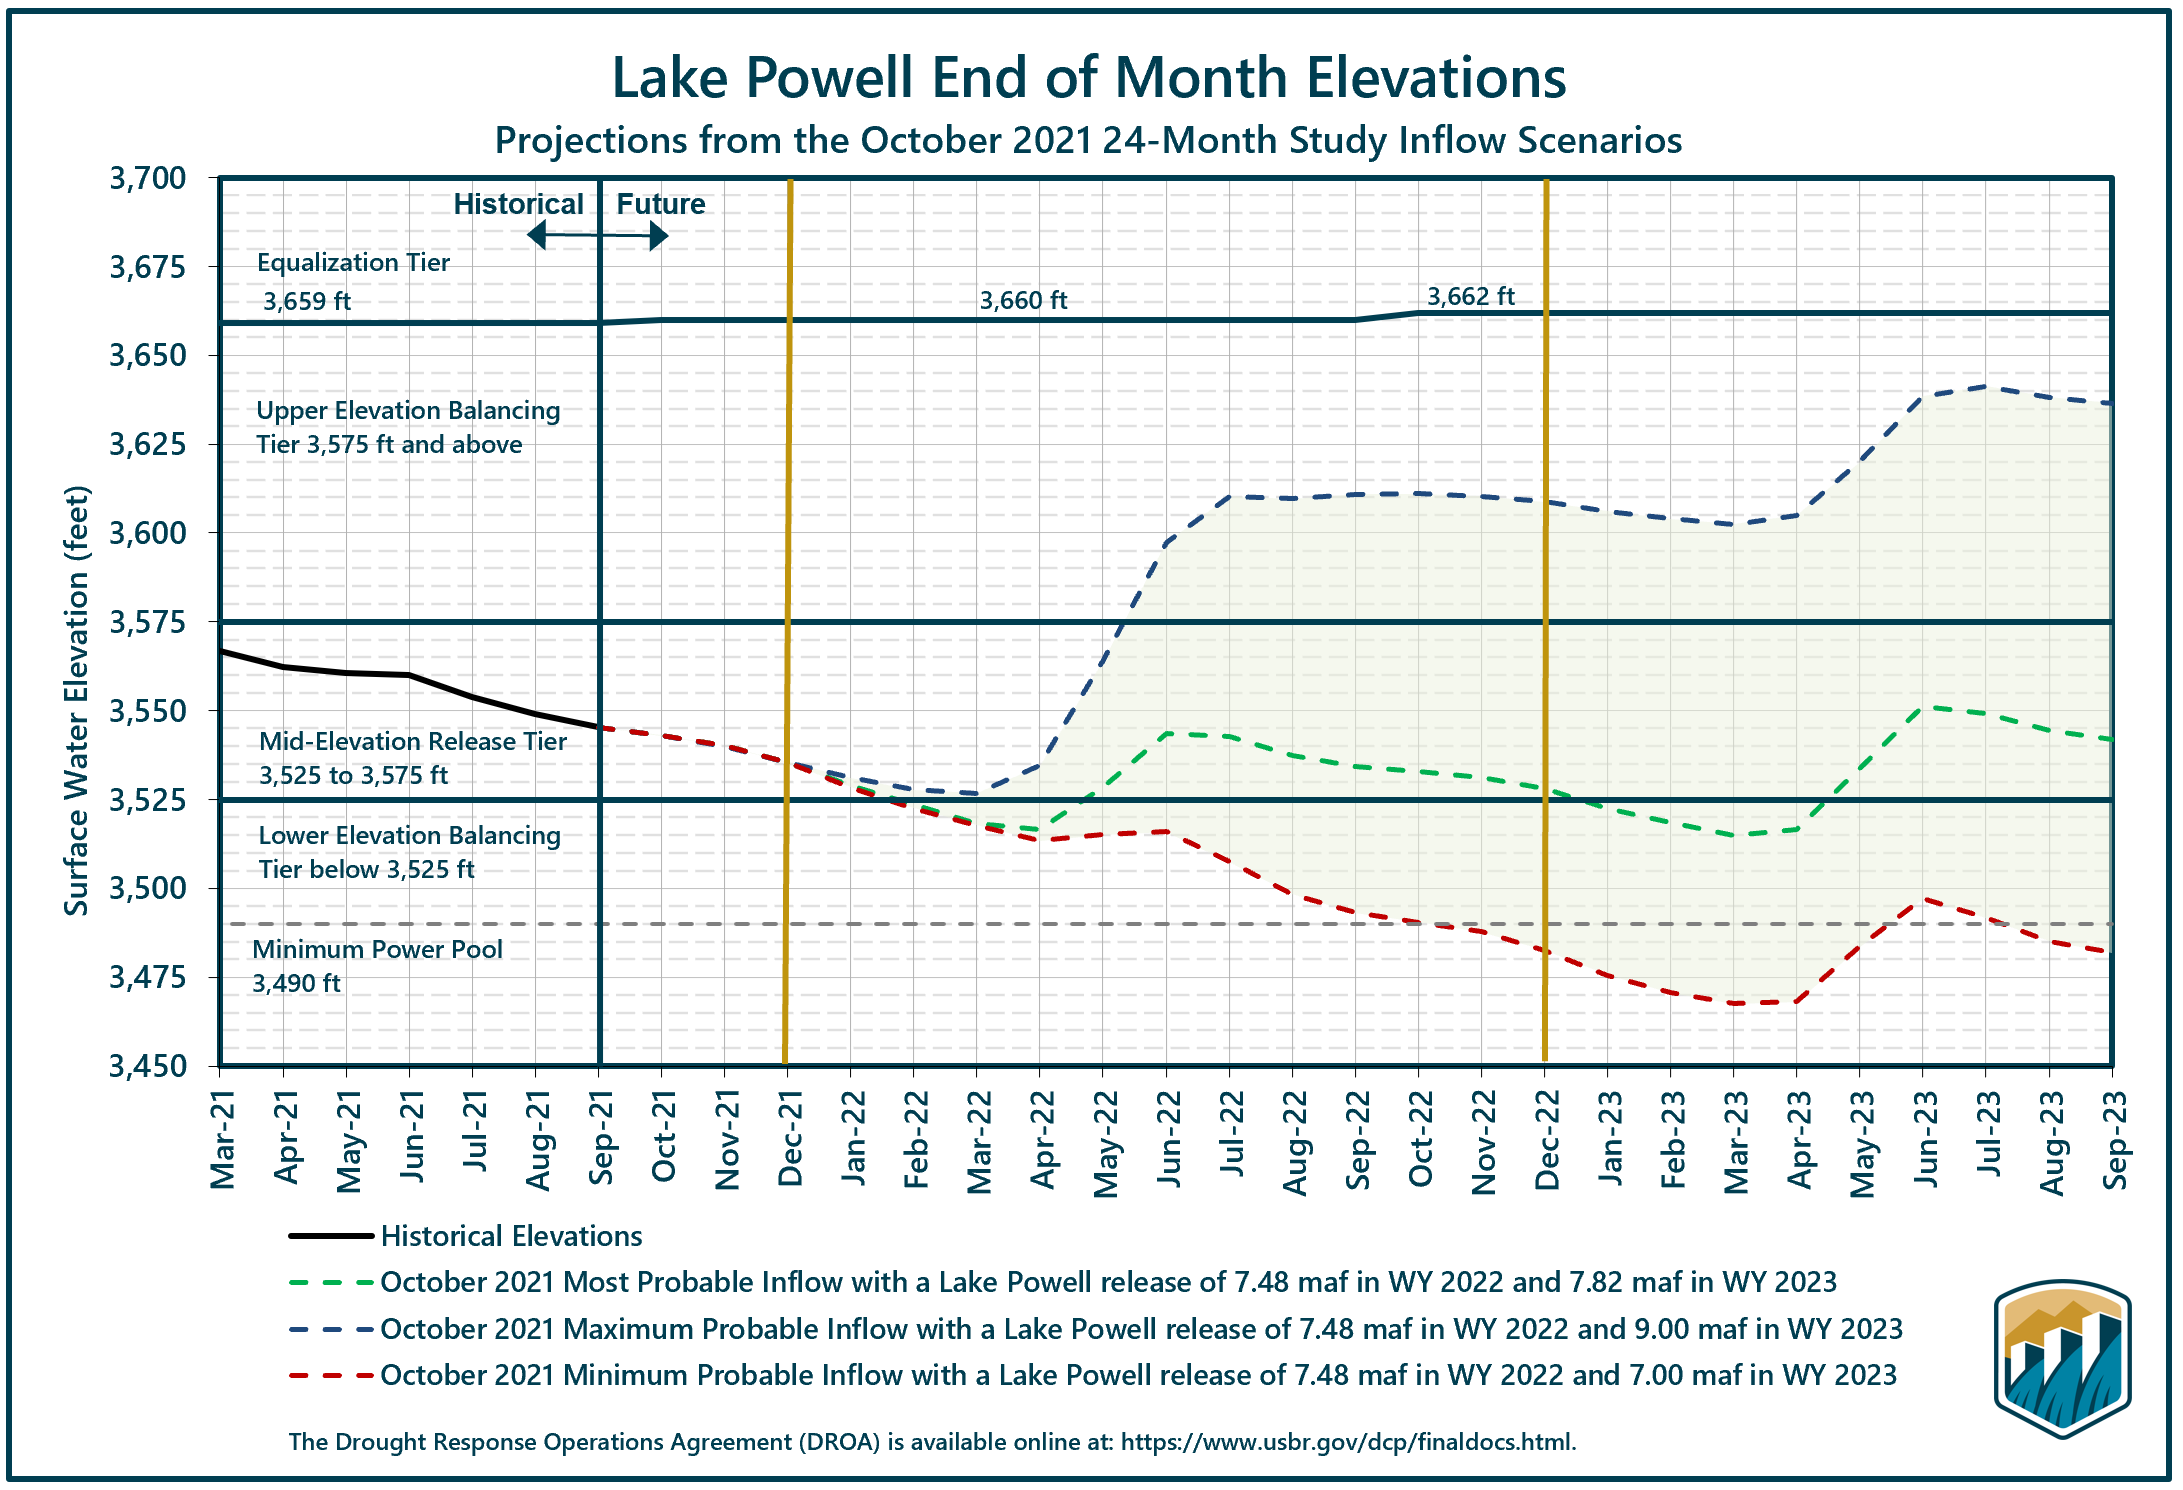
Projected Lake Powell end-of-month elevations from the latest 24-Month Study inflow scenarios.
Lake Powell Projections
With the decrease in the inflow forecast in water year 2022, Reclamation’s October projections indicate Lake Powell’s elevation at the end of water year 2022 (Sept. 30, 2022) will be about eight feet lower than the September projections. The projections also indicate the increased potential of falling below minimum power pool, elevation 3,490 feet, in 2022. Should extremely dry hydrology continue into next year, Lake Powell could reach elevation 3,490 feet as early as July 2022.
“Incorporating the updated climate normals into the CBRFC forecasts, and, in turn, into our modeling projections, provides us with a better understanding of what is happening now and will give us a more informed assessment of potential future conditions,” said Reclamation’s Upper Colorado Basin Regional Director Wayne Pullan.
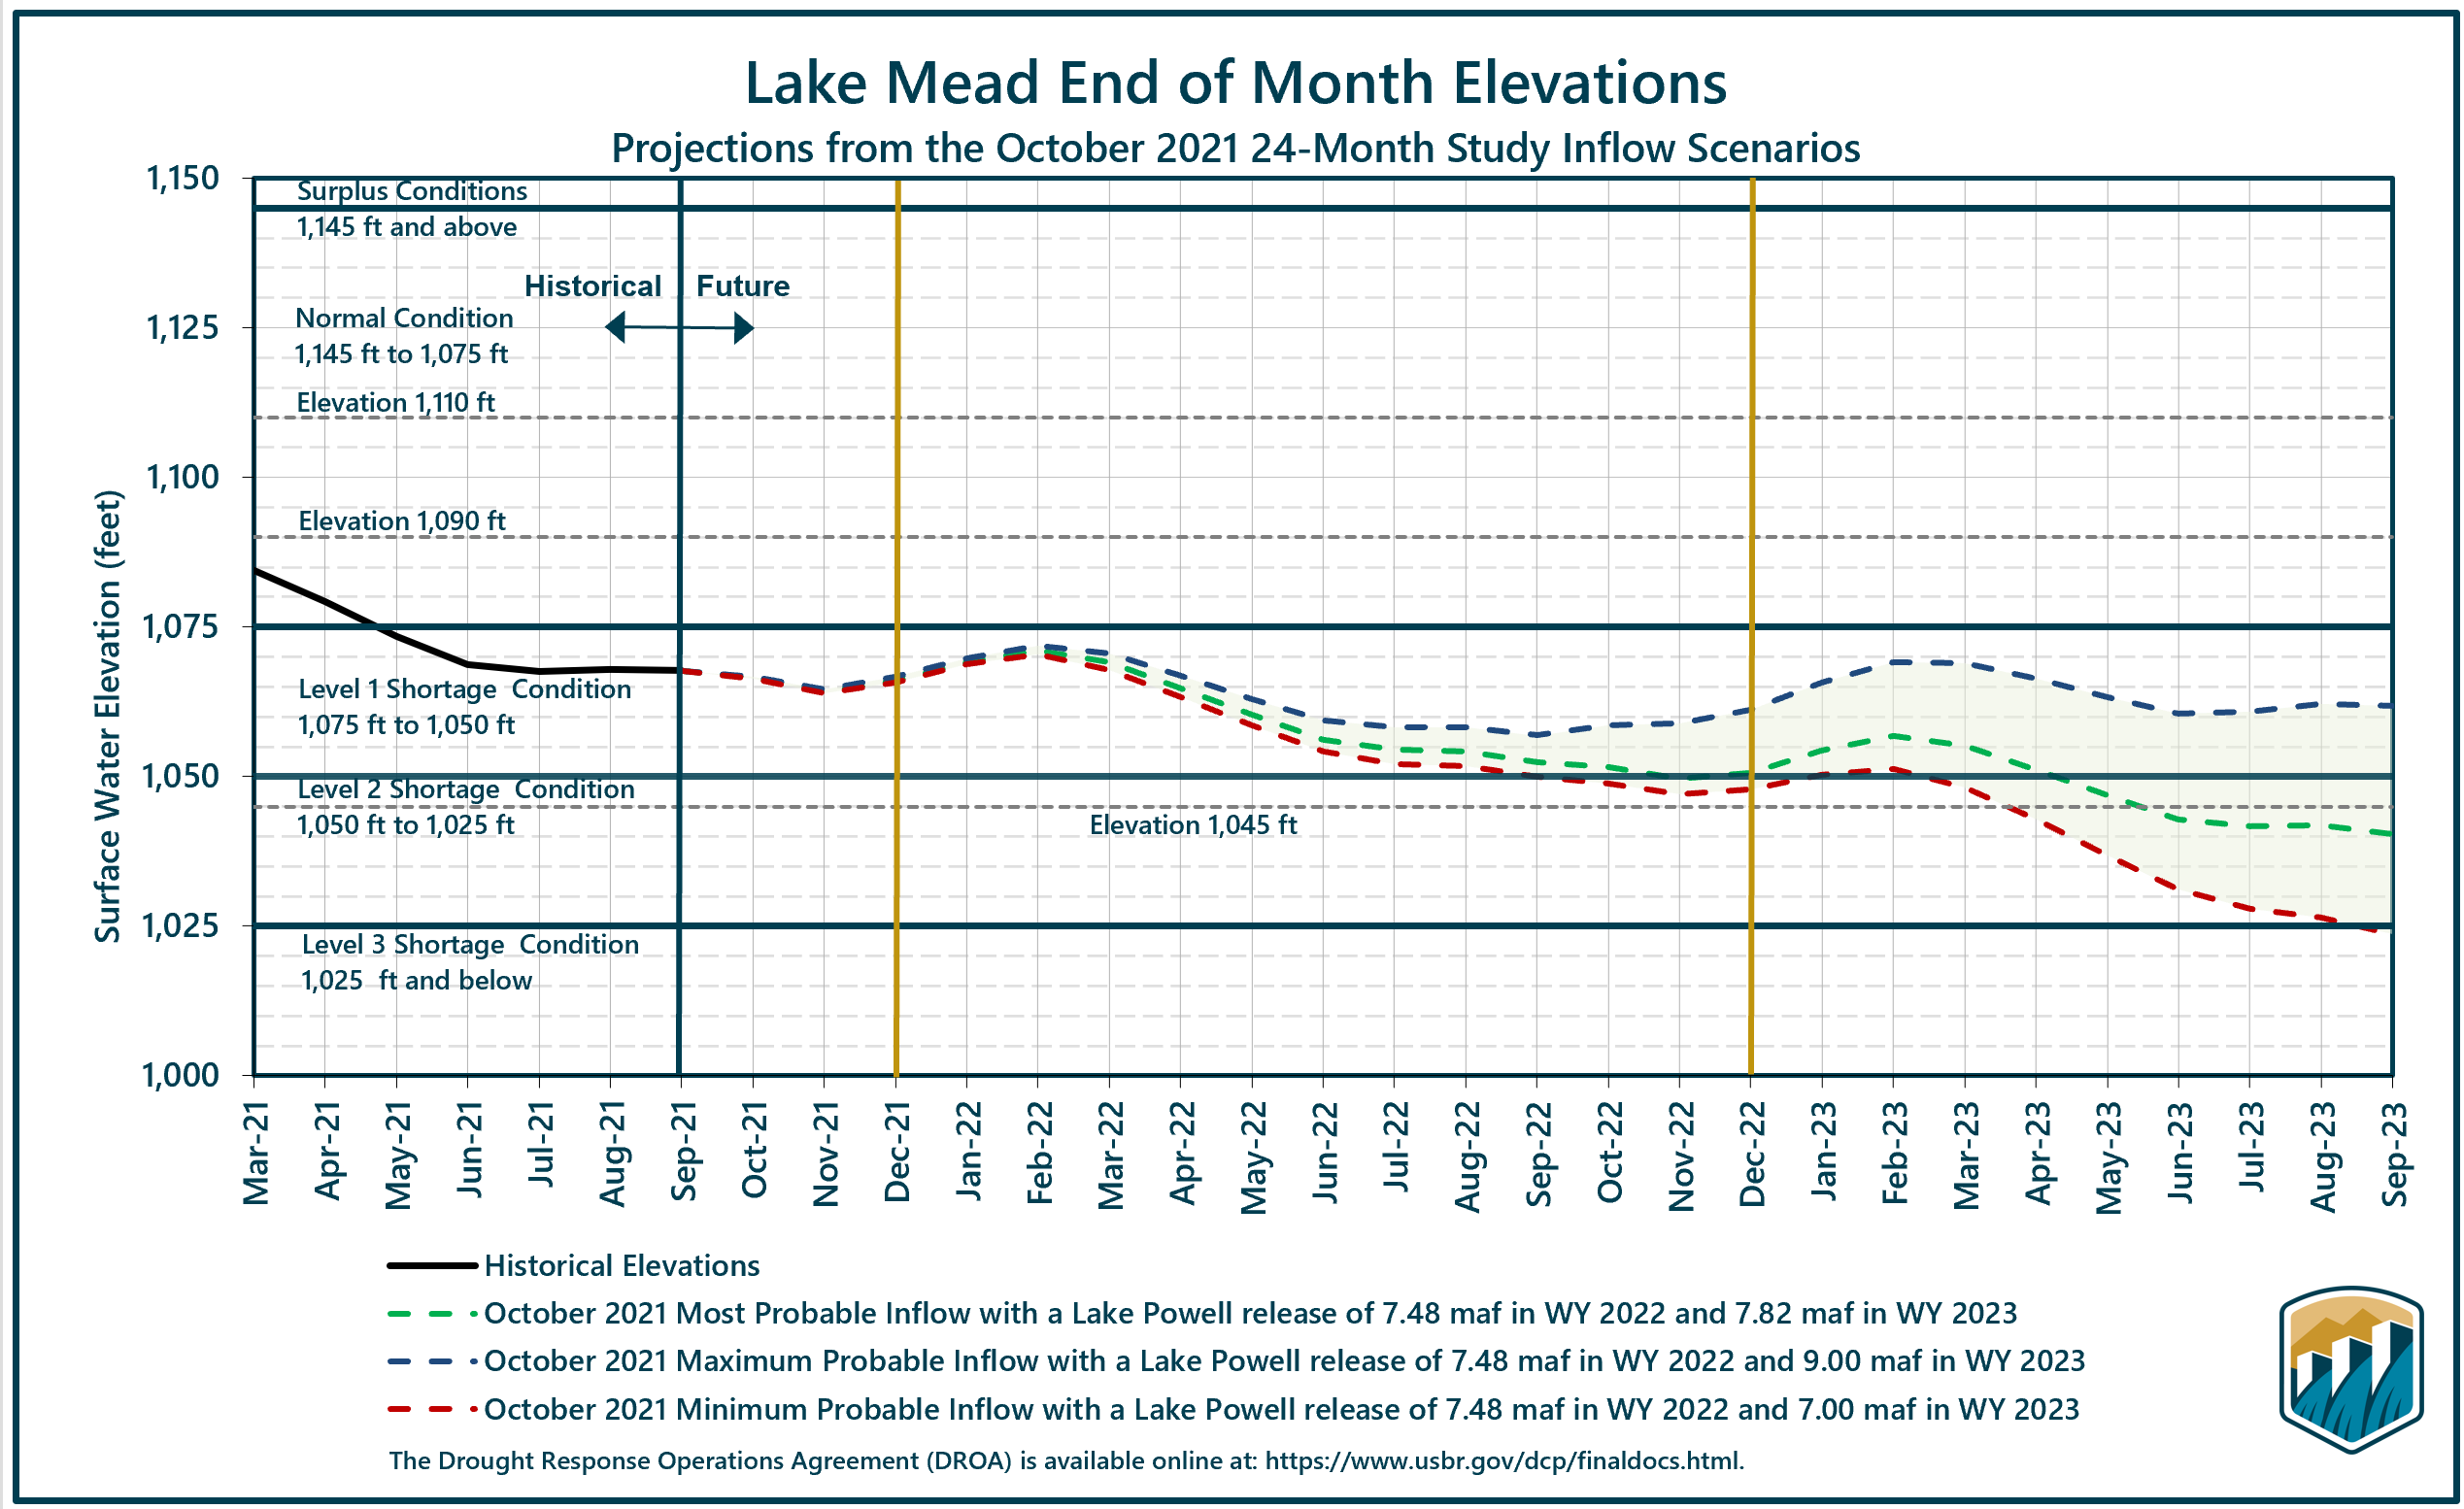
Projected Lake Mead end-of-month elevations from the latest 24-Month Study inflow scenarios.
Lake Mead Projections
At Lake Mead, the October projections indicate Lake Mead will be at elevation 1,050.63 feet at the end of calendar year 2022, less than one foot above the Tier 2 shortage elevation threshold of 1,050 feet. Recent analysis indicates approximately a 16% chance of a Tier 2 shortage condition in 2023.
“We have had to make difficult choices this year, and we will all have to make more difficult decisions if it continues to remain dry next year to protect Lake Mead and Lake Powell,” said Reclamation’s Lower Colorado Basin Regional Director Jacklynn Gould.
Most of the flow of the Colorado River originates in the Rocky Mountains. The Upper Basin experienced an exceptionally dry spring in 2021, with April to July runoff into Lake Powell totaling just 26% of average, despite snowpack reaching 89% of median, due to dry soil conditions and above-average temperatures.
Reclamation remains committed to reducing the collective risk of both Lake Powell and Lake Mead falling to critical elevations and will continue to work with all partners across the Colorado River Basin to ensure that both facilities continue to function as authorized to meet the natural, municipal and agricultural needs of the basin.
#LakePowell is seen in a November 2019 aerial photo from the nonprofit EcoFlight. Keeping enough water in the reservoir to support downstream users in Arizona, Nevada and California is complicated by climate change, as well as projections that the upper basin states of Colorado, Utah, Wyoming and New Mexico will use as much as 40% more water than current demand. A recent white paper from a lineup of river experts calls those use projections into question. CREDIT: ECOFLIGHT via Aspen Journalism
From the University of Nevada Reno (Steph McAfee):
Drought on the Colorado River has been in the news this year. In August, the US Bureau of Reclamation’s water-level forecasts for January 2022 indicated that the water levels in Lake Mead, one of the system’s major reservoirs, would stay below 1,075 feet elevation. Because of how low water levels have fallen, a Tier 1 shortage was declared. This means that southern Nevada, which gets about 90% of its water from the Colorado, will have to make do with 7% less water.
But steadily dropping river flows and reservoir levels are not exactly a surprise. Scientists have long warned that higher temperatures, especially if they coincide with a drought, could stress water supply in the Colorado Basin and force us to be more thoughtful and creative in how we use and manage water. This year has underscored that message.
The Colorado River basin stretches from southwestern Wyoming to the Sea of Cortez in Mexico. Most of the water – about 90% — that feeds the Colorado River falls as rain and snow in the upper, or northern, part of the basin. The Upper Colorado River Basin drains the west side of the Rocky Mountains in Wyoming, Colorado and Utah, collecting a bit of water from northwest New Mexico. The Lower Colorado River Basin, which covers most of Arizona and extends just into New Mexico, Nevada, and California, contributes less water. The Colorado River Delta, where the river flows into the sea, is in northern Mexico.
In the 1980s and 1990s, the Lake Mead reservoir on the Colorado River was close to full, though water levels were sometimes a little lower and sometimes a little higher. Since then, less and less water has flowed out of the Rocky Mountains into the massive reservoirs that buffer the Southwest and Mexico against droughts, water the farm fields of southern California, and generate cheap electricity.
In 2008, Tim Barnett and David Pierce, researchers at the Scripps Institute of Oceanography, caused something of a furor by publishing a scientific paper titled, “When will Lake Mead go dry?” They concluded that there were even odds that Lake Mead would be essentially empty, with so little water that dam operators couldn’t send water downstream, in 2021. This finding was, as they put it, “startling” in how dire it was, but it was hardly the first time that scientists had discussed how climate impacts water supply and drought in the Colorado. In the decades before 2008 and since then, many scientists (myself included) have worked diligently to better understand how changes in climate affect water resources in the Southwest.
Not surprisingly, flow in the Colorado River drops when the mountains that feed it get less rain and snow. This kind of drought is not unusual. Historically, drought has impacted flow along the Colorado River during the 1930s, 1950s, 1960s, 1970s, in the late 1980s to early 1990s and again over the last 20 years. Tree-ring researchers have also identified long and sometimes severe droughts on the Colorado in the centuries before we started tracking flow with stream gages.
Currently, flow in the Colorado is very low – much lower than would be expected given that the Upper Colorado Basin has only been somewhat short of rain and snow. What’s different is that temperatures have been consistently high.
There are a number of ways that temperature can alter the amount of water that flows down the Colorado River. Warmer temperatures increase the atmosphere’s thirst for water, so it can pull more water from rivers, lakes, soils, and even snow. As temperatures rise, the growing season starts earlier and ends later, lengthening the window of time when plants are active and moving water from the soil through their leaves to the air. Getting more precipitation as rain instead of snow can also alter how much water evaporates, soaks into the soil, or runs off into streams.
It is now obvious that higher temperatures are already starting to stress water supplies, with further impacts on energy production, agriculture, the environment, and even recreation. What’s not currently clear is how much influence temperature has. Scientific studies using a variety of tools have come up with somewhat different answers about how big a role temperature plays. A recent review of the scientific literature led by the Wester Water Assessment found that temperature may have caused anywhere from a fifth to more than half of the recent drop in flow in the Upper Colorado River.
Scientists expect temperatures to rise in the coming decades. There is still some uncertainty about just how big a sip those higher temperatures will take out of the Colorado, but as it warms, the overall amount of water available will drop and droughts will be worse than they would otherwise have been. To meet Nevada’s current and new water demands, we will need innovation in water policy and management, new technology and conservation strategies, and the research to support those changes.
OpenET uses best available science to provide easily accessible satellite-based estimates of evapotranspiration (ET) for improved water management across the western United States. Using the Data Explorer, users can explore ET data at the field scale for millions of individual fields or at the original quarter-acre resolution of the satellite data…
Transformative, Timely ET Data
OpenET employs several well-established methods to generate daily, monthly, and annual satellite-based ET estimates at the field scale. OpenET also provides access to field-scale information on weather and vegetation conditions. Potential applications include:
Support for ET-based irrigation practices that maximize “crop per drop” and reduce costs for fertilizer and water.
Support for water trading programs that protect the financial viability of farms during droughts while helping to make water available for other beneficial uses.
Development of water budgets and innovative management programs that promote adequate water supplies for agriculture, people, and ecosystems.
Support for groundwater management programs that require consistent, accurate ET data for monitoring historical and current consumptive water use…
Reliable Monthly Data at the Field Scale
OpenET provides data at daily, monthly, and annual time steps. ET data are available at the field scale or for other user-defined boundaries with minimal data latencies – making OpenET a powerful tool for real-time water management and decision-making…
Developed with Best Available Science
The project team includes national and international experts in remote sensing of ET, cloud computing, and web development. Our team has worked with leaders from western agriculture, water policy, and water management communities in developing the platform. Our models, data inputs, and accuracy assessments will ultimately be available on an open source basis, making OpenET a transparent resource for ET data developed by leading experts…
An Ensemble of Well-Established Methods
OpenET provides data from multiple satellite-driven models that are used to map ET, and provides a single “ensemble ET” value that is calculated from those models for each location and timestep. OpenET uses Google Earth Engine as a shared platform for data processing and model operation, allowing the science community to work collaboratively and to use consistent, high-quality data inputs to all models. This approach ensures data continuity, helps improve the methods, and creates a well-documented, shared basis for decision-making that truly represents the best available science…
How it Works
OpenET relies entirely on publicly available data as inputs to multiple well-established ET models to calculate ET. The primary inputs include data from Landsat, Sentinel-2, GOES, and other satellites; weather station networks and models; and field boundary and crop type datasets. The satellite data from Landsat are one of the most important inputs to the ET models, which use the satellite data to measure patterns in land surface temperature and vegetation extent and condition at the scale of individual fields. A complete description of the methods used by OpenET can be found here.
NASA on Thursday launched an online platform with information on how much water evaporates into the atmosphere from plants, soils and other surfaces in the U.S. West, data it says could help water managers, farmers and state officials better manage resources in the parched region.
The platform, OpenET, uses satellite imagery from the Landsat program, a decades-long project of NASA and the U.S. Geological Survey that records human and natural impacts on Earth’s surface.
Specifically, it provides data for 17 Western states — down to the quarter-acre — on how much evapotranspiration has taken place. That’s the process by which moisture in leaves, soil and other surfaces evaporates into the air.
The West has been mired in drought for more than two decades. Scientists say human-caused climate change has intensified conditions. Water levels at key reservoirs on the Colorado River have fallen to historic lows alongside growing demand, prompting the federal government to declare water cuts for some states next year. A blazing summer and years of record-breaking wildfires have also zapped moisture from the ground.
Detailed information on soil moisture could help farmers and water managers better plan during dry conditions and reduce how much water is used for irrigation, NASA scientists said on a Thursday call with reporters.
“Farmers and water managers have not had consistent, timely data on one of the most important pieces of information for managing water, which is the amount of water that’s consumed by crops and other plants as they grow,” said Robyn Grimm, a water specialist with the Environmental Defense Fund, which helped NASA develop the tool alongside other environmental groups and Google.
“To date, that data has been expensive and fragmented,” she said.
Many large farms in dry areas, such as California’s Central Valley, already have years of experience using advanced data systems to measure evapotranspiration and other water metrics that influence their growing and harvesting seasons and watering schedules.
Cannon Michael runs an 11,000-acre (4,452 hectare) farm in Merced County, California, that produces tomatoes, melons, cotton and alfalfa. Michael said he looked at NASA’s new platform, but didn’t think it would provide any additional benefit for his farm.
“We closely monitor and understand our water use,” he said. “Our farm is 75% drip irrigation, and we have a very detailed scheduling and forecasting process already in place.”
Meanwhile, Colorado rancher Joe Stanko in Steamboat Springs had read about the new tool in a magazine. Her family grows hay for their cattle, and she said the platform could help them determine which fields need more water to replenish soil. It could also help them decide when to harvest hay.
NASA said the platform includes historical data dating back to 1984. In coming months, it will be updated to include information about precipitation rates with the same level of detail. Eventually, the tool will extend to other parts of the U.S., including areas around the Mississippi River and Appalachian region, scientists said.