National #Climate Report – February 2022 — NOAA

Click the link to read the report on the NOAA website:

National Overview

February Highlights

February Temperature

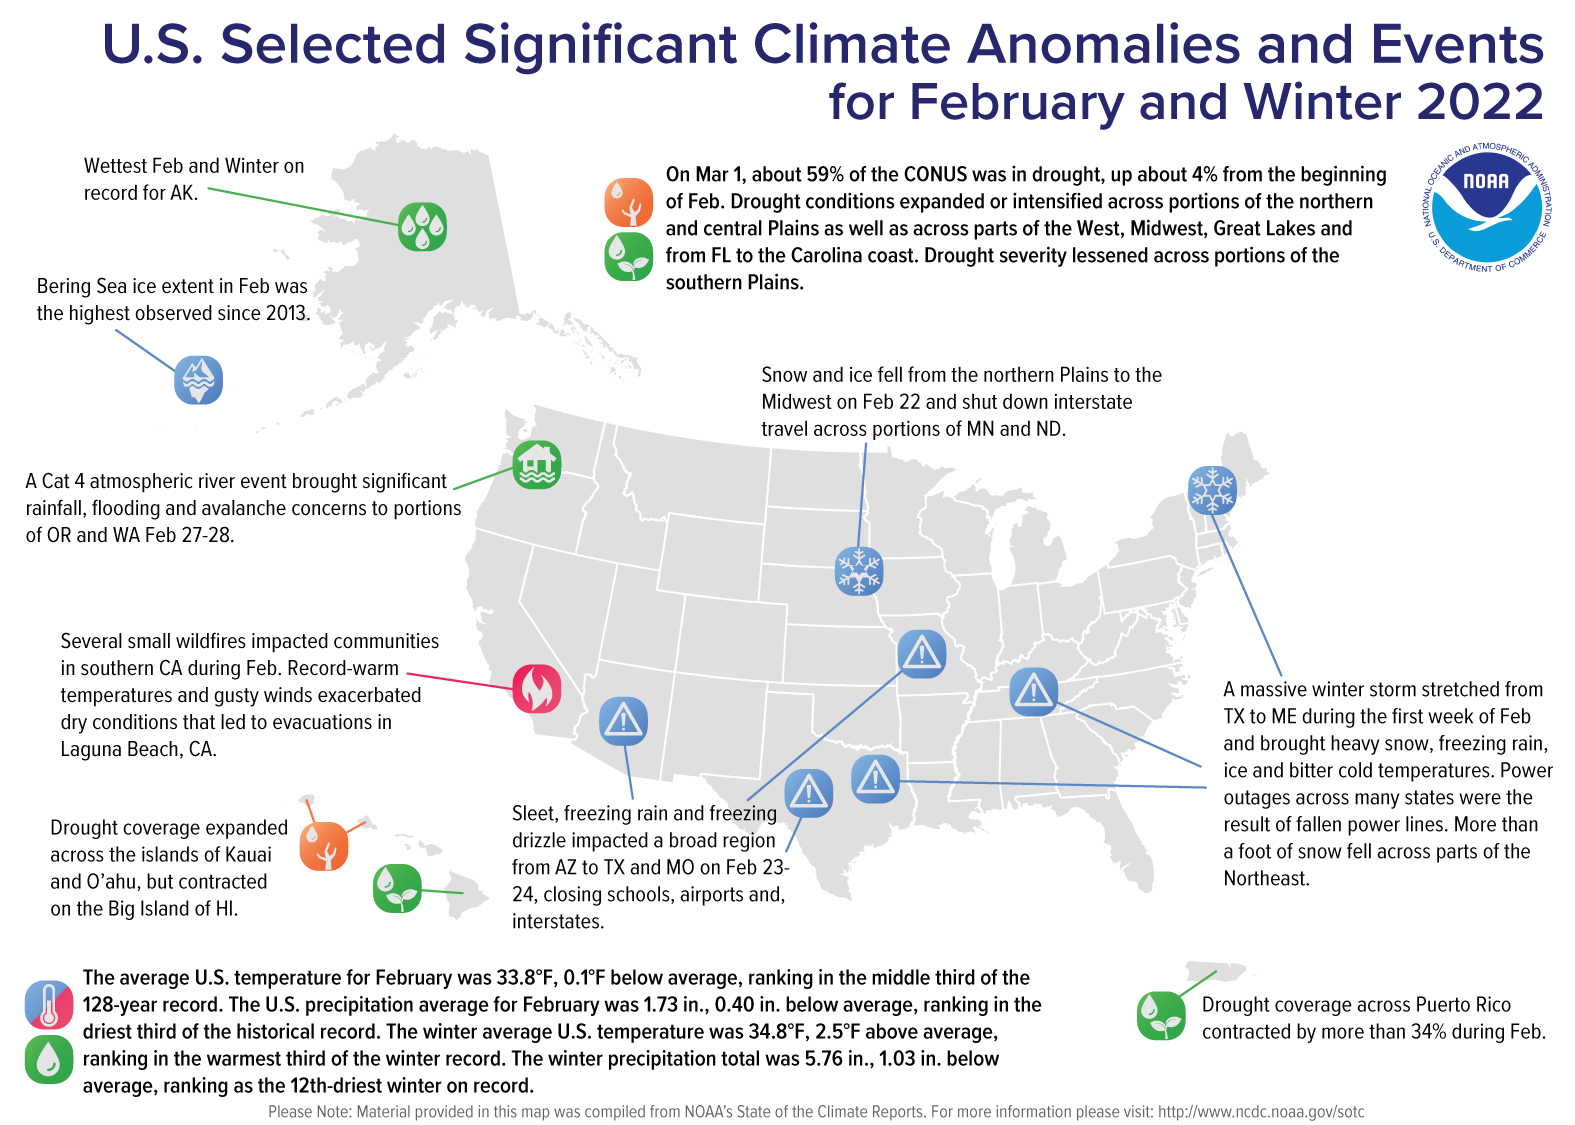
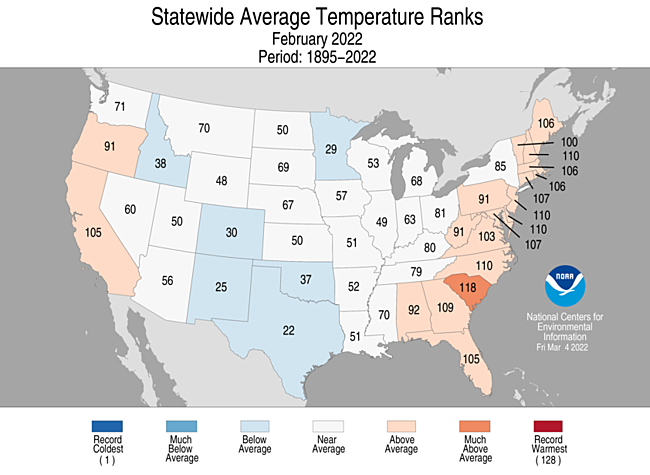
  • The average contiguous U.S. temperature during February was 33.8°F, 0.1°F below the 20th-century average, ranking in the middle third of the 128-year period of record.
  • Temperatures were below average across portions of the Upper Mississippi Valley as well as from the central Rockies to the Gulf Coast. Temperatures were above average across portions of the West Coast and from the Southeast to New England.
  • The Alaska statewide February temperature was 8.6°F, 3.8°F above the long-term average. This ranked among the middle one-third of the 98-year period of record for the state.
    • Temperatures were below average across parts of the North Slope while above-average temperatures were observed across the southern third of the state. King Salmon ranked fifth-warmest while Anchorage and Kodiak each had their sixth-warmest February on record.
    • Bering Sea ice extent in February was the highest value observed since 2013, but fell rapidly the last 10 days of the month and was slightly below the 1991-2020 median by March 2.
  • The contiguous U.S. average maximum (daytime) temperature during February was 46.3°F, 1.5°F above the 20th-century average, ranking in the middle third of the historical record. Above-average maximum temperatures were observed across parts of the West, northern and central Plains and from Florida to New England. Below-average daytime temperatures occurred across portions of the Rockies, South and Great Lakes. California ranked 10th warmest on record for maximum temperature.
  • The contiguous U.S. average minimum (nighttime) temperature during February was 21.2°F, 1.6°F below the 20th-century average, ranking in the coldest third of the record. Above-average minimum temperatures were observed across portions of the East Coast. Below-average minimum temperatures dominated across much of the West, Plains, Midwest and Great Lakes. Texas ranked 11th coldest for nighttime temperatures during February.
  • As of March 8, there were 3,165 record warm daily high (1,867) and low (1,298) temperature records in February, which was about 65 percent of the 4,870 record cold daily high (2,423) and low (2,447) temperature records observed during February.
  • Based on NOAA’s Residential Energy Demand Temperature Index (REDTI), the contiguous U.S. temperature-related energy demand during February was 20 percent below average and the 39th-lowest value in the 128-year period of record.

February Precipitation

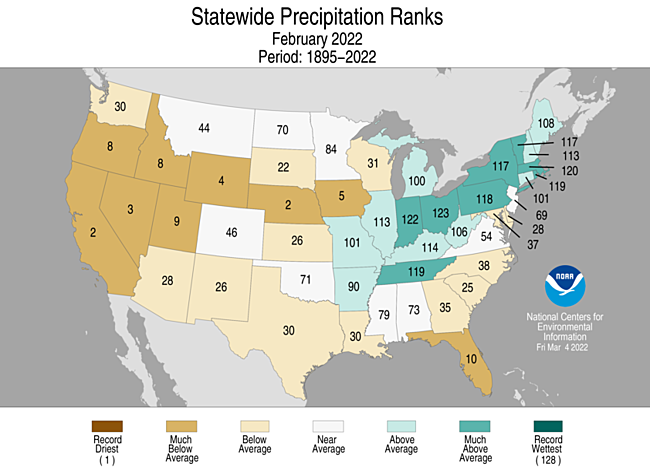
  • The February precipitation total for the contiguous U.S. was 1.73 inches, 0.40 inch below average, and ranked in the driest third of the historical period of record.
  • Precipitation was above average from the Mid-Mississippi Valley to New England. Ohio had its sixth-wettest February. Precipitation was below average across most of the West and portions of the Plains, Southeast and Mid-Atlantic. California and Nebraska each had their second-driest February with Nevada ranking third driest.
    • A Category 4 atmospheric river event brought significant rainfall, flooding and avalanche concerns to portions of Oregon and Washington during February 27-28.
  • The state of Alaska, as a whole, ranked as the wettest February in the 98-year record. Juneau had its wettest February following its wettest January on record. King Salmon also experienced its wettest February on record, while Anchorage ranked second-wettest. Snowpack was above normal across most of the state.
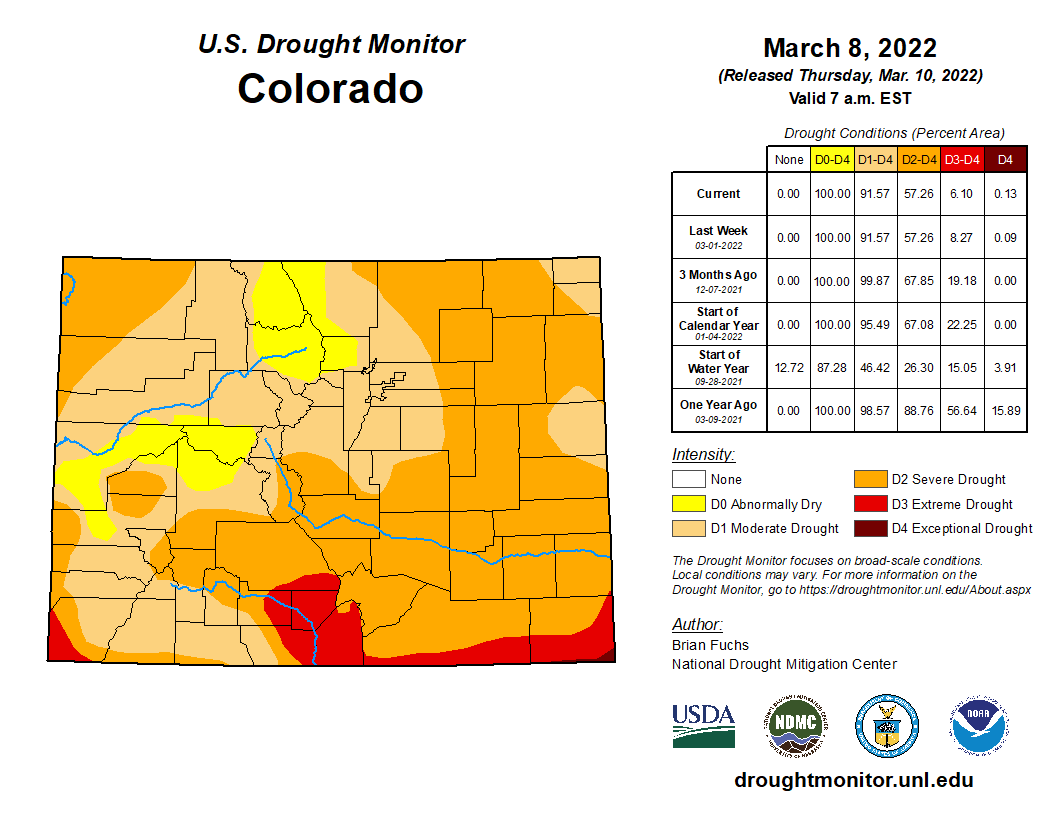
  • According to the March 1 U.S. Drought Monitor report, 59.2 percent of the contiguous U.S. was in drought, up nearly 4 percent from the beginning of February. Drought conditions expanded or intensified across portions of the northern and central Plains, as well as across parts of the West, Midwest, Great Lakes and from Florida to the Carolina coast. Drought contracted on the Big Island of Hawaii, but expanded across the islands of Kauai and O’ahu. Drought severity lessened across portions of the southern Plains and across Puerto Rico.

Winter Highlights

December-February Temperature

  • The winter (December-February) average contiguous U.S. temperature was 34.8°F, 2.5°F above average, ranking in the warmest third of the winter record.
  • Winter temperatures were above average across much of the Lower 48 with Georgia and South Carolina each experiencing their seventh-warmest winter on record. Temperatures ranked near average from the Pacific Northwest to the western Great Lakes with no states ranking below average for the winter season.
  • The Alaska December-February temperature was 6.3°F, 2.7°F above the long-term average, ranking among the middle one-third of the 97-year record. Above-average temperatures were observed across the Aleutians, Bristol Bay, Cook Inlet and the southern half of the West Coast, Central Interior and Southeast Interior regions. Temperatures were below average across portions of the North Slope and the southern Panhandle.
  • The contiguous U.S. average maximum (daytime) temperature during December-February was 46.4°F, 3.7°F above the 20th-century average, ranking eighth warmest in the historical record. Above-average temperatures were observed across most of the Lower 48 with Oklahoma ranking second warmest and Arkansas, third warmest on record. No states across the Lower 48 ranked below average for the winter season.
  • The contiguous U.S. average minimum (nighttime) temperature during December-February was 23.1°F, 1.4°F above the 20th-century average, ranking in the warmest third of the record. Above-average temperatures were observed across parts of the West and from the Gulf Coast to the Northeast. Nighttime temperatures were below average across parts of the Upper Mississippi Valley and central Plains.
  • Based on NOAA’s Residential Energy Demand Temperature Index (REDTI), the contiguous U.S. temperature-related energy demand during the winter season was 45 percent of average and the 15th-lowest value in the 127-year period of record.

December-February Precipitation

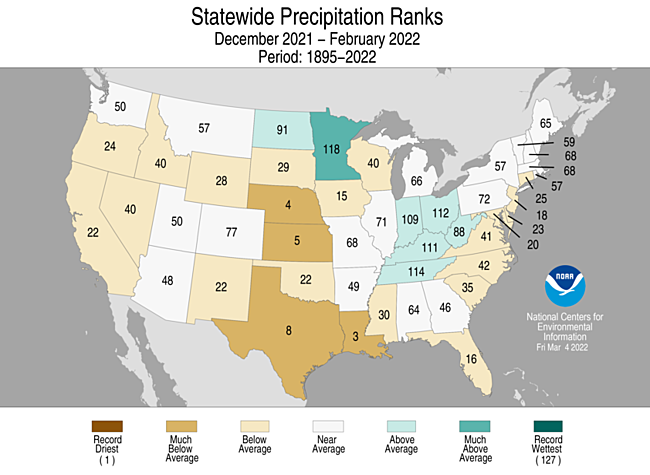
  • The winter precipitation total for the contiguous U.S. was 5.76 inches, 1.03 inches below average, and ranked as the 12th-driest winter in the 127-year period of record.
  • Precipitation was above average across parts of the Upper Mississippi, Ohio, and Tennessee valleys. Minnesota had its 10th-wettest winter. Precipitation was below average across portions of the West, central and southern Plains, Gulf Coast and across parts of the Southeast and Mid-Atlantic. Louisiana had its third-driest winter on record with Nebraska ranking fourth driest and Kansas, fifth driest.
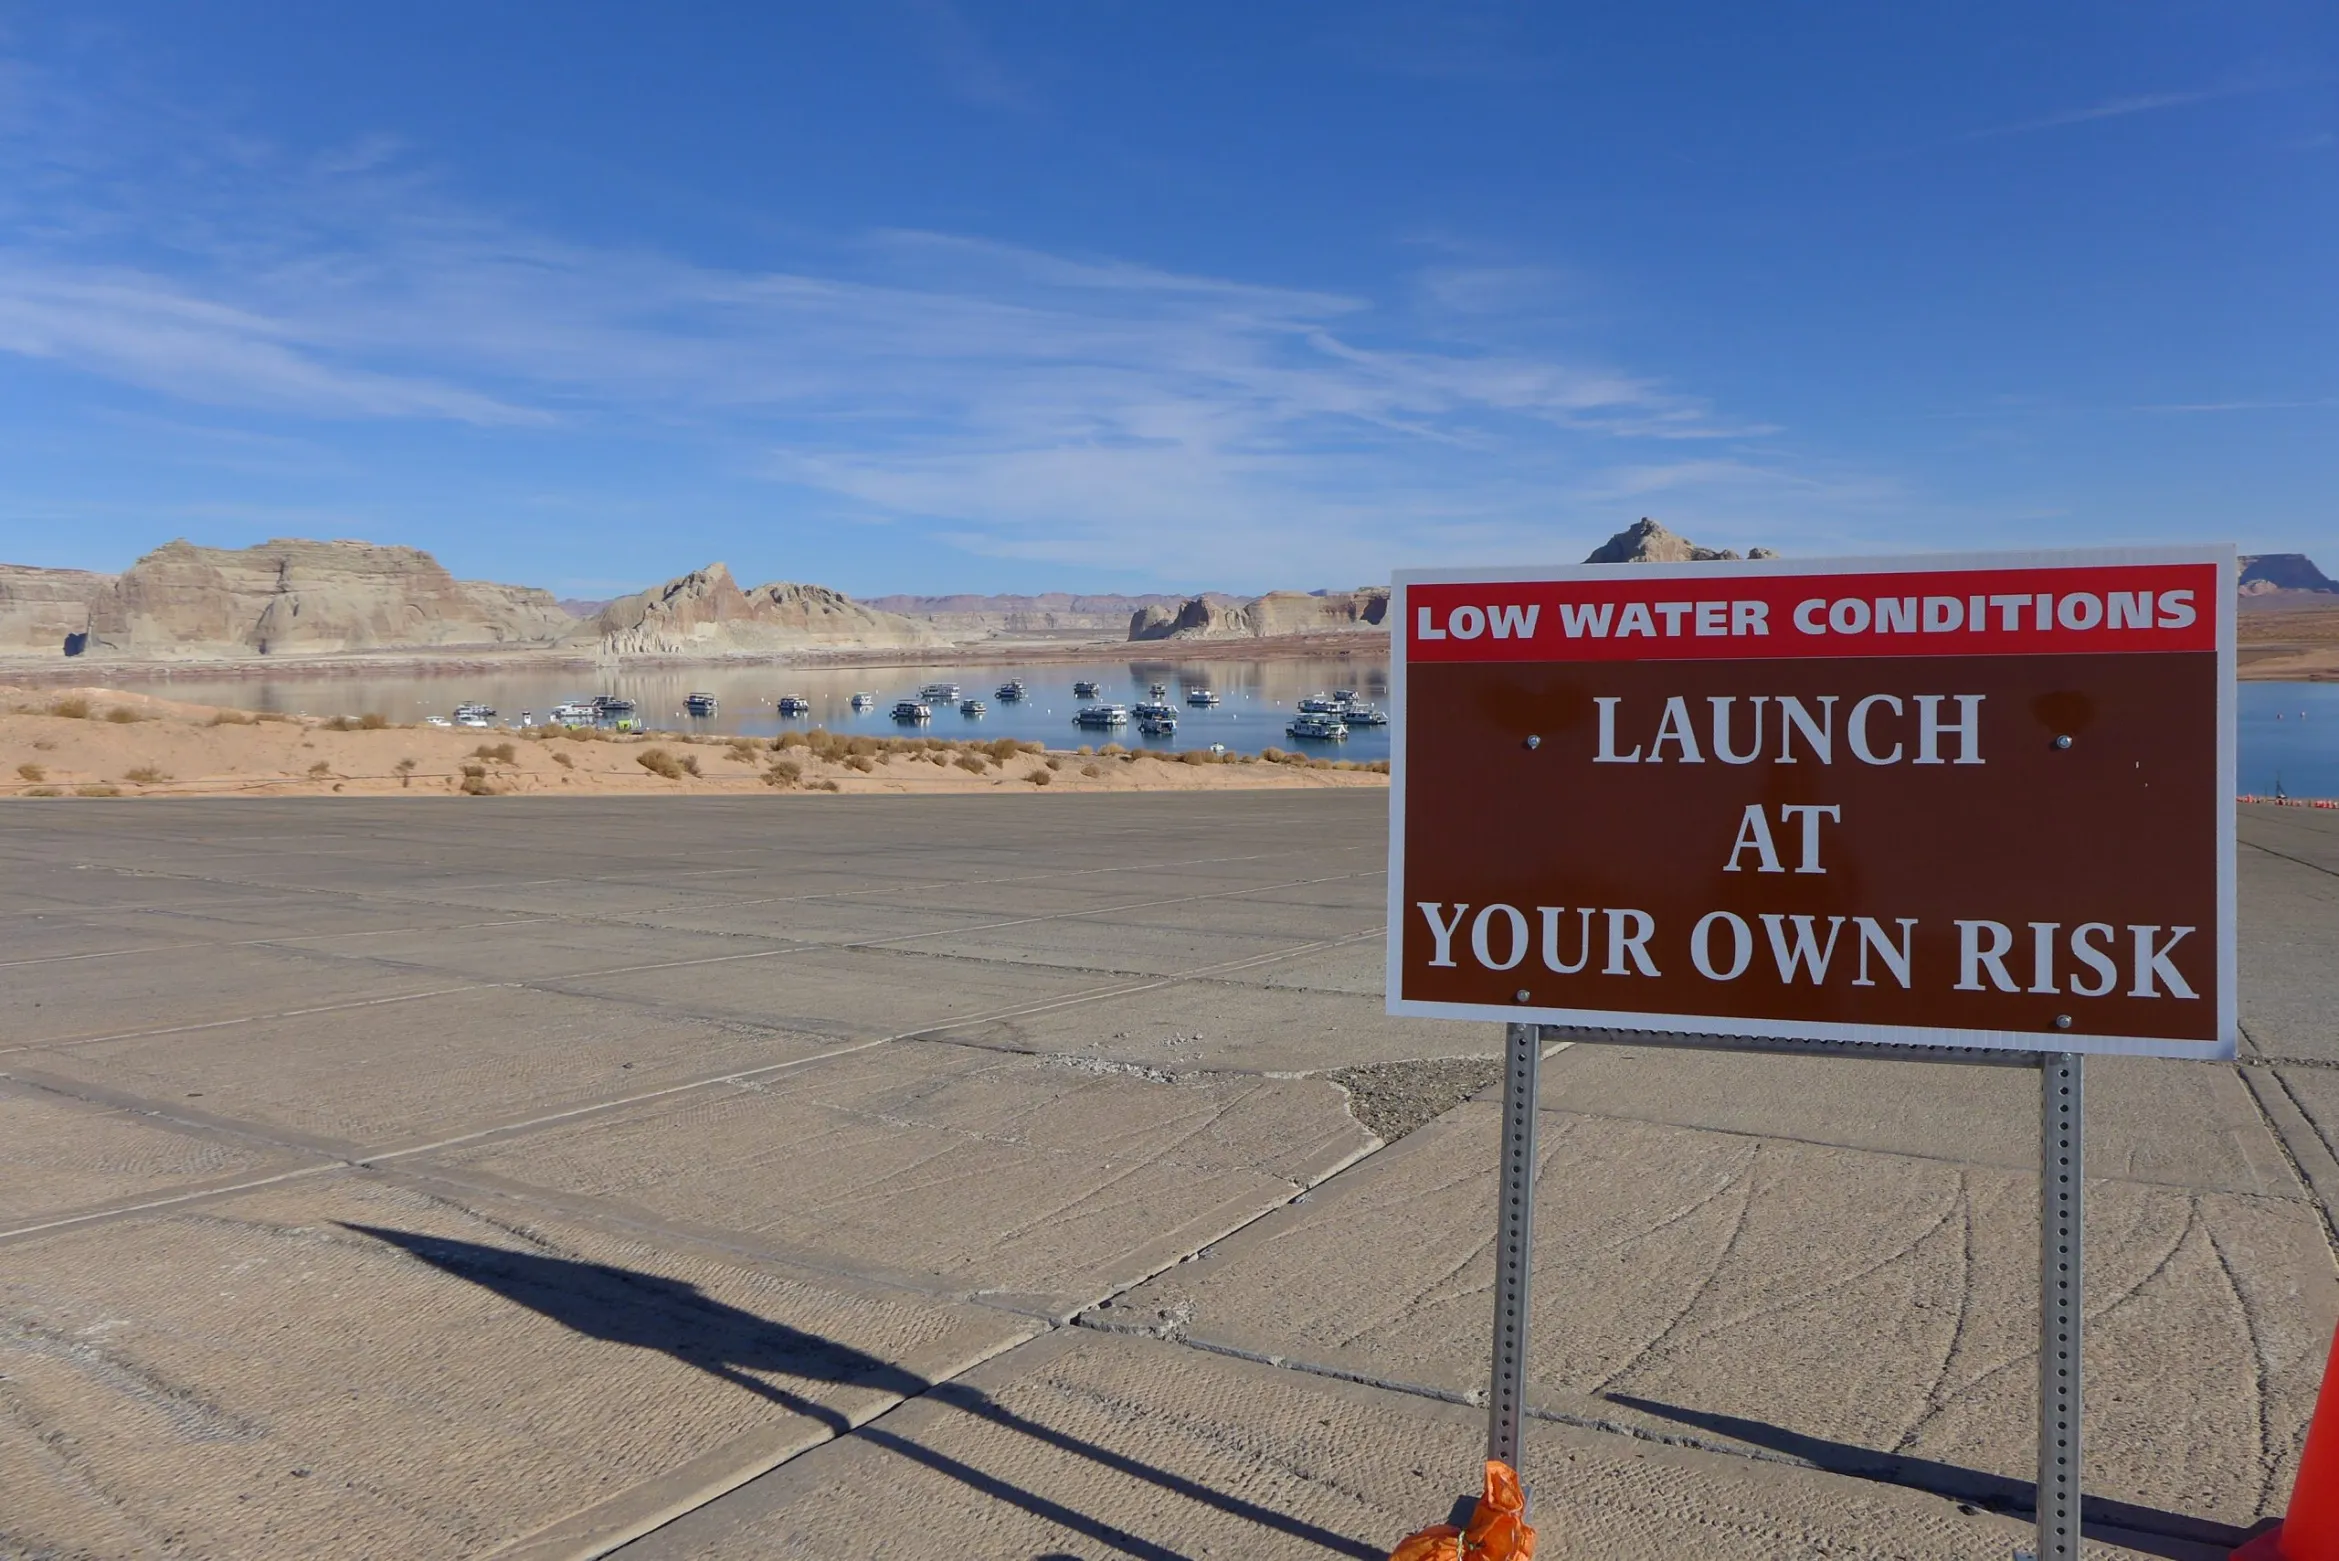
  • Climatologically speaking, winter is the wet season across much of the western U.S. If the dry conditions experienced in January and February across portions of the West were to continue into March and April, insufficient water resources may result during the dry season (summer), as well as an increased potential for drought intensification and wildfires in the fall.
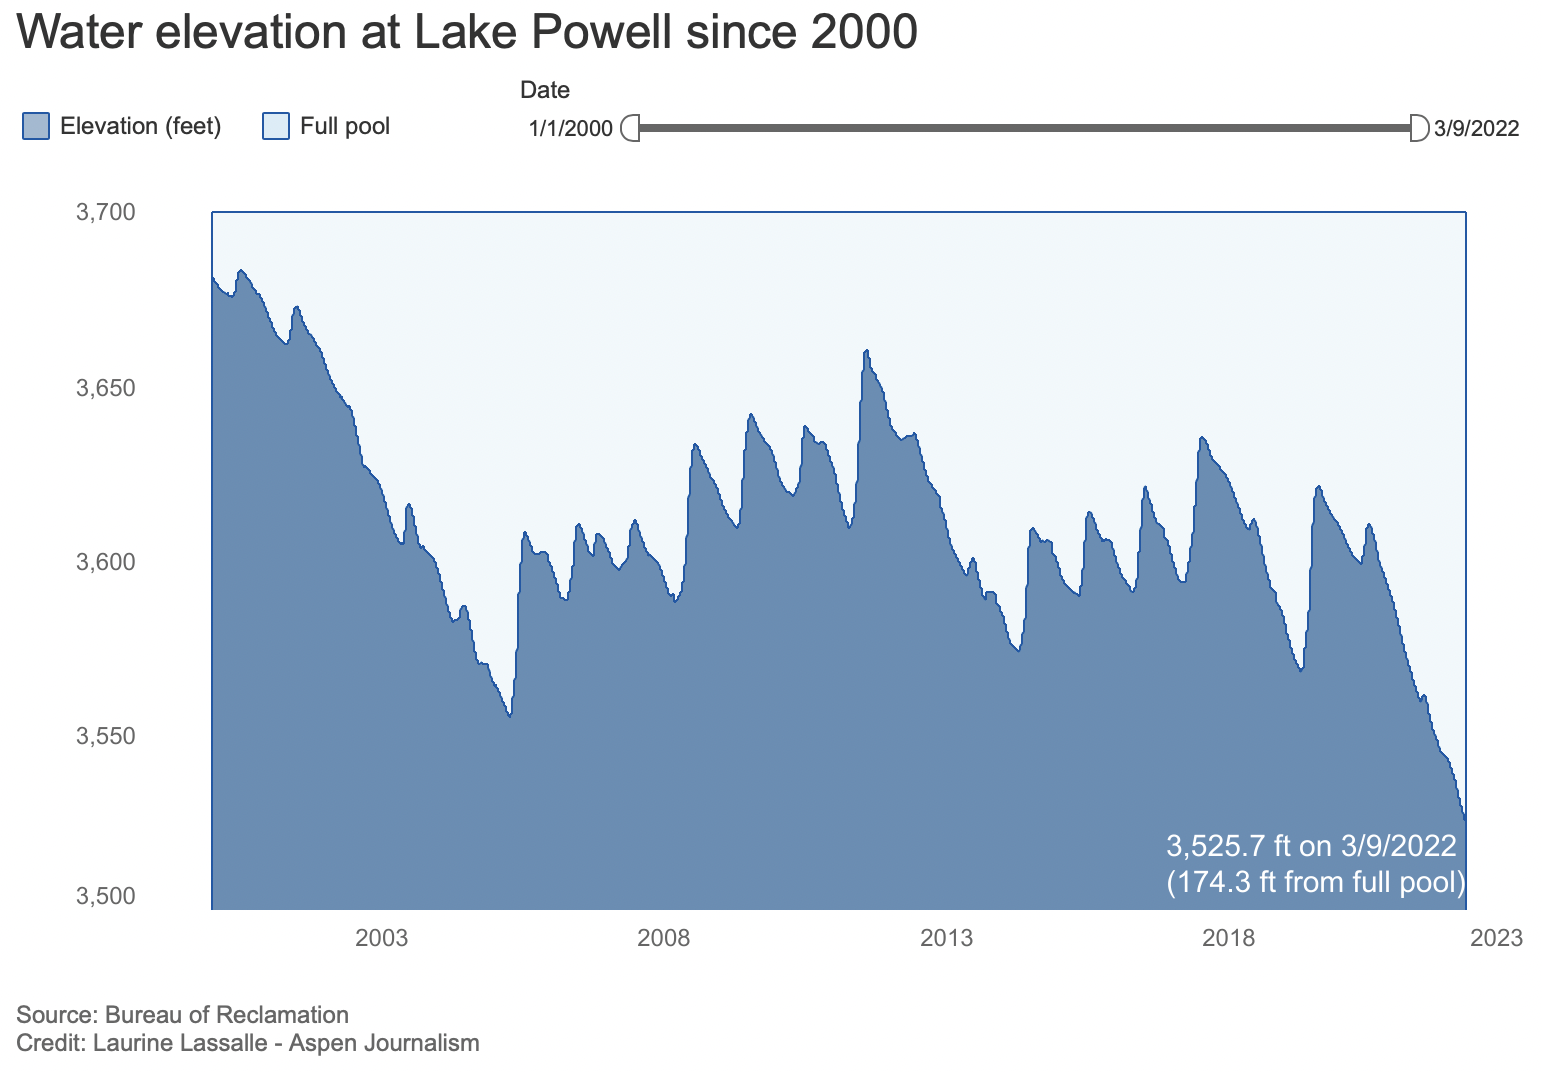
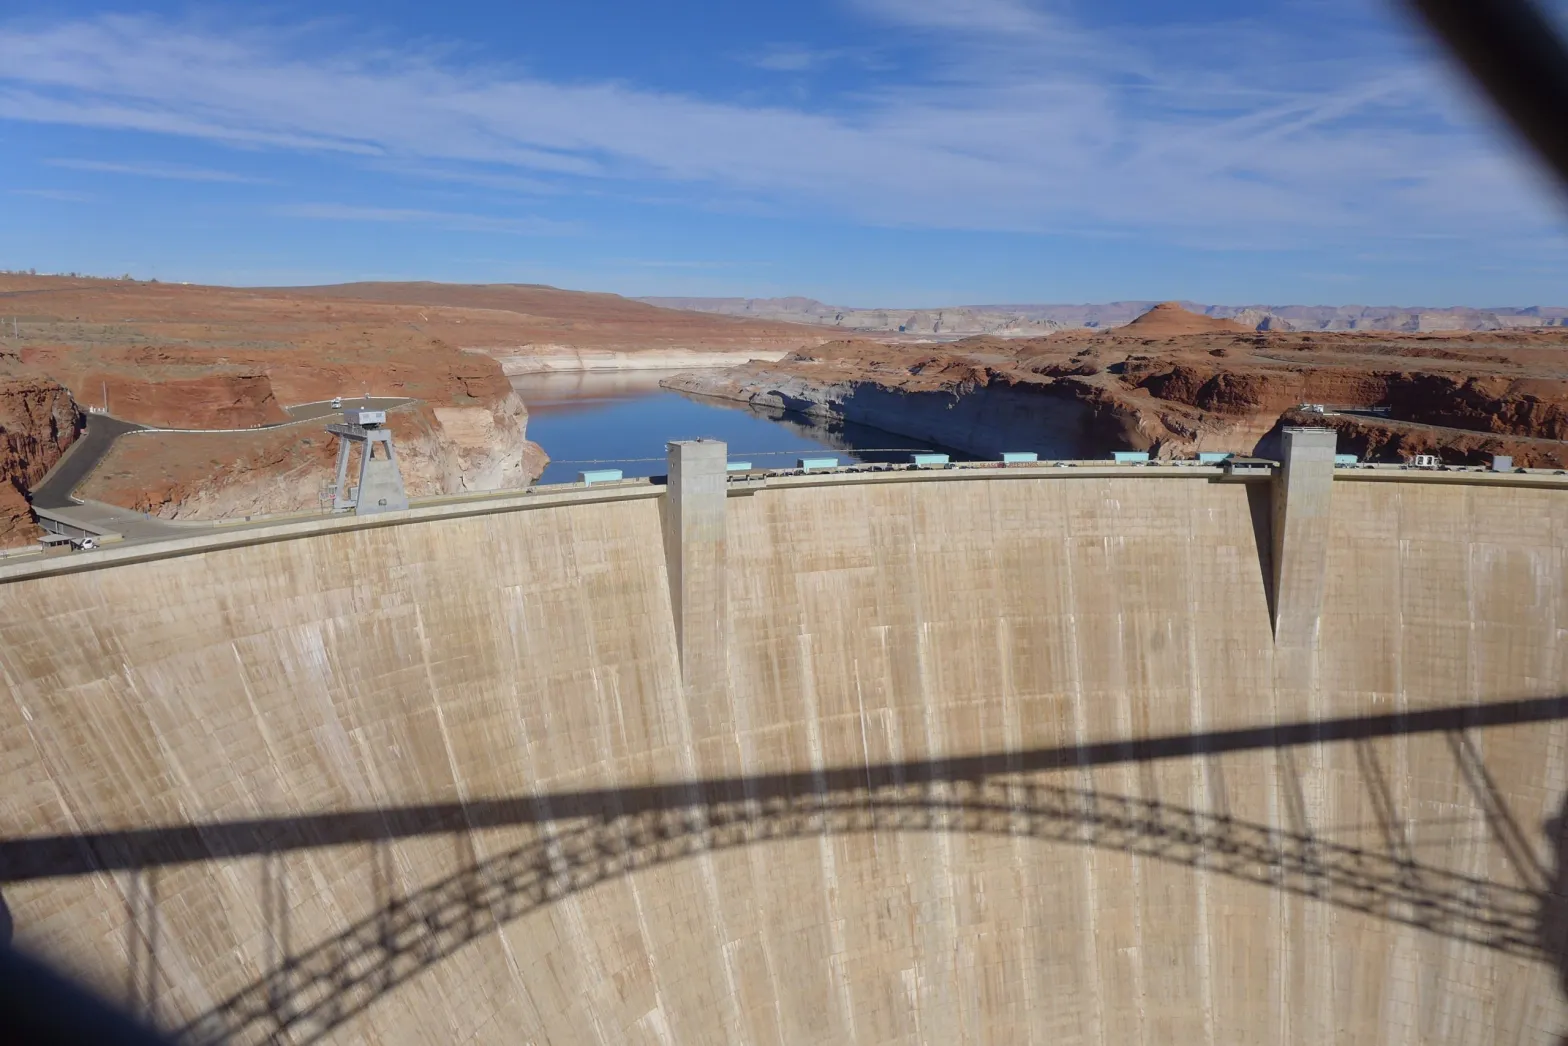
    • Lake Powell, the second-largest reservoir in the U.S., is nearing its lowest water level since it was filled more than 50 years ago. By mid-March, the water level is expected to drop below 3,525 feet above sea level, threatening the region’s water supply and ability to generate hydropower.
  • Five regions in Alaska — Bristol Bay, West Coast, North Slope, Northeast Interior and Southeast Interior — ranked wettest on record for the winter season, contributing to a record-wet winter for the state of Alaska, eclipsing the previous record set in 1928-29. Nome experienced its wettest winter since 1943-44 and King Salmon had its wettest winter on record.

Extremes

  • The U.S. Climate Extremes Index (USCEI) for the winter season was 26 percent above average and ranked in the middle third of the 113-year period of record. Extremes in warm maximum temperatures, dry PDSI values and extremes in 1-day precipitation each contributed to this elevated CEI value for this season. The USCEI is an index that tracks extremes (falling in the upper or lower 10 percent of the record) in temperature, precipitation and drought across the contiguous United States.
    • On the regional scale, the Northwest and Southeast regions had CEI composite values that were above average for the winter season. Across the Northwest, extremes in dry PDSI across the eastern portion of the region were juxtaposed with elevated extremes in 1-day precipitation along the Pacific Coast. In the Southeast, extremes in warm maximum temperature as well as extremes in 1-day precipitation were elevated.

#LakePowell to dip below target elevation: Impact of emergency releases debated as officials work on operating plan — @AspenJournalism #ColoradoRiver #COriver #aridification

The main boat ramp at Wahweap Marina at Lake Powell was unusable in December 2021 due to low water. Lake Powell is set to dip below the target elevation of 3,525 feet between March 11 and 15. CREDIT: HEATHER SACKETT/ASPEN JOURNALISM

Click the link to read the article on the Aspen Journalism website (Heather Sackett):

Despite emergency releases from three upper basin reservoirs last summer and fall aimed at propping up Lake Powell, levels in the reservoir are projected to dip below a critical threshold in the coming days.

The second largest reservoir on the Colorado River is predicted to fall below the target elevation of 3,525 feet between March 11 and 15, according to Becki Bryant, public affairs officer with the U.S. Bureau of Reclamation. The dip is temporary and levels are expected to rise above the threshold again in May when snowpack runoff gets underway. As of March 10, Lake Powell was at 3,525.66 feet.

The 3,525 feet number is important because that was the elevation set in the 2019 Drought Response Operations Agreement (DROA). That number gives water managers a 35-foot buffer in which to take action before water levels reach the minimum level needed to generate hydropower for millions of people in the southwest: 3,490 feet.

“All of us sort of picked 3,525 as a cushion to give us some maneuvering room in case the negotiations took time or the forecasts were off,” said Eric Kuhn, author and former general manager of the Glenwood Springs-based Colorado River Water Conservation District and one of the crafters of the Drought Contingency Plan. “If you’re going to preserve power pool a year from now, you need a number of months to get that job done.”

Last summer and fall the Bureau of Reclamation released 161,000 acre-feet from the upper basin reservoirs to prop up Powell, including 36,000 acre-feet from Blue Mesa Reservoir in Gunnison County, 125,000 acre-feet from Flaming Gorge and 20,000 acre-feet from Navajo Reservoir. The releases were expected to boost Powell by about 3 feet.

Some Colorado water managers criticized the move for what they said was a lack of advanced notice, which cut short the summer recreation season on Blue Mesa. Some also questioned the timing of the releases. Hot, dry weather in late summer and fall means more transit losses because plants and soils will pick up more of the additional water, with fewer acre-feet making it all the way to Lake Powell.

“I think that is a valid criticism,” said Dave Kanzer, an engineer with the River District. “We have concerns about the timing of the release.”

According to Bryant, without the releases — plus a second DROA action of holding back 350,000 acre-feet in Powell to be released later this spring — Powell levels would be 8.5 to 9 feet lower than they are now.

“Those two actions combined have prevented the drop in elevation from being deeper and longer in duration,” she said.

But the releases came at the cost of depleting Blue Mesa, which on March 9 sat at 29% full, down from 48.5% on March 9, 2021. As this angered some in Colorado, and the amount of water is proving to be the proverbial drop in the bucket, questions of the impact of the releases and were they worth it generate debate.

“That’s a difficult question,” said Rebecca Mitchell, director of the Colorado Water Conservation Board. “You have to look at the past few years and what the future will hold for us. So that’s going to be a difficult question.”

Director of the Upper Colorado River Commission Chuck Cullom said criticism of the reservoir releases is fair, but that in the end, they did what they were intended to do: Prop up Powell to give water managers time to hammer out an annual operating plan.

“I think the data supports that the 2021 actions, although imperfect, were beneficial to prop Lake Powell up,” he said.

New framework coming for emergency releases

Representatives from the upper basin states — Colorado, Utah, Wyoming and New Mexico — along with Bureau of Reclamation officials are working on an annual framework for sending water to Powell that would avoid a repeat of 2021’s emergency releases.

“As early as May we will have completed the DROA plan for May through April of 2023 releases with the same intent: to keep Lake Powell above 3,525 if we can, but certainly to keep it above power pool of 3,490,” Cullom said.

Mitchell said water managers coming together to figure out a path forward with annual drought operations, which came about as a result of the federal government stepping in with last year’s emergency releases, is valuable.

“That includes a full analysis of potential options and implications of the various options, so we have an opportunity now to fully consider timing impacts and any other matters,” Mitchell said. “I think that’s going to be helpful.”

Glen Canyon Dam in Page, Ariz., forms Lake Powell. Water levels in Powell are declining and projected to hit a critical threshold in the coming days, just 35 feet above the elevation needed to maintain hydropower production.
CREDIT: HEATHER SACKETT/ASPEN JOURNALISM

DROA public comments

Glen Canyon Dam is what’s known as a “cash register” dam. The power it produces is used to repay the cost of building the project and provide power to millions of people in the southwest, including Colorado. Lake Powell is also a strategic bucket for the states of the upper basin — Colorado, New Mexico, Utah and Wyoming — which allows them to meet their water delivery obligations to the lower basin under the Colorado River Compact. Water managers have many good reasons for wanting to preserve this system.

But during the public comment period for the DROA plan framework, which closed on Feb. 17, some questioned the wisdom of trying to preserve Powell at all, especially in the face of the worsening impacts of climate change. William Lipscomb, a climate scientist with the National Center for Atmospheric Research in Boulder, said the DROA draft does not adequately address the long-term challenges posed by climate change. As hotter temperatures and drought continue to rob the river of flows, lakes Powell and Mead are at less than one-third full, their lowest levels since filling.

“Given that Lake Powell is approaching dead pool, I hope you will consider the eventual phasing out of Lake Powell as a reservoir,” he wrote in a comment letter. “Storage could be consolidated in Lake Mead, opening more of Glen Canyon for restoration.”

Sixty-one comments, 55 of them form letters, shared this sentiment, urging federal officials to consolidate storage in Lake Mead or remove Lake Powell.

But the vast majority of comments — 698 — came from people asking Reclamation officials to fill Lake Powell. Nearly all of these were form letters and said the target elevation of 3,525 is too low for recreation. Some recounted fond family boating experiences on the human-made lake. The low water levels have led to the closure of marinas and boat ramps in recent months.

“While maintaining Lake Powell at higher elevation levels will require tradeoffs elsewhere in the Colorado Basin, Lake Powell should be given preferential treatment,” read one form letter from Hannah Cook. “It is a national treasure for outdoor recreation, vitally important for local economies, the reservoir and dam provide clean energy and water certainty for downstream users.”

A single comment from a southern Utah resident and boatman on the Green and Colorado rivers named Phoebe Brown argued that decision makers should value the long-term ecological implications over economic needs or power generation.

“Thinking about my life and my future, the only hope I see in the West is maintaining the ecological integrity of river corridors, and I want to see Lake Powell managed for sedimentation and making sure there is healthy water and a livable future for young Westerners like myself,” she wrote.

Aspen Journalism covers water and rivers in collaboration with The Aspen Times.

DON’T PANIC: Here’s where Colorado’s #snowpack stands 28 days from the typical peak — Out There #Colorado

Click the link to read the article on the Out There Colorado website (Spencer McKee). Here’s an excerpt:

[Snowpack] is now at about 97 percent of the to-date median statewide following this week’s round of precipitation. The median peak snowpack is still 28 days away, so the next few weeks could be very telling as to where Colorado’s snowpack will end up this winter. If Colorado were to get no more snow for the rest of the year, it would be at 79 percent of the median peak snowpack…

Colorado Drought Monitor map March 8, 2022.

In terms of how this winter’s snowfall has impacted Colorado’s persistent drought issue, it’s still bad, but it’s not as bad as last year. According to data valid as of March 8 and released on March 10, about 92 percent of the state is under some level of drought. Obviously, that’s a lot, but three months ago, that number was 99.87 percent and last year, it was 98.57. Really, where the good news lies is in the level of more severe drought found around the state. One a four-level system, just six percent of Colorado falls under the two most severe stages of drought. This compares to 19 percent three months ago and 57 percent a year ago. There has been a very slight uptick in the most severe level of drought over the past week, but this is limited to 0.13 percent of the state, specifically in a slim portion of the southeast corner.

Snow measurement technology evaluated in new report — Reclamation #snowpack

Photo shows Tennessee Creek near the confluence of the East Fork Arkansas River in winter with snow on the Continental Divide of the Americas. The report evaluates current and emerging snow measurement technologies for the Western United States. Photo: Reclamation

Click the link to read the release on the Reclamation website (Peter Soeth):

The Bureau of Reclamation released The Emerging Technologies in Snow Monitoring report as part of Reclamation’s new Snow Water Supply Forecasting Program. The program aims to improve accuracy of water supply forecasts and the report evaluates current and emerging snow measurement technologies for the Western United States.

“Snow provides important water storage for the west by slowly releasing water through the late spring and summer,” said Chief Engineer David Raff. “A changing climate and an increasing population are stressing water supplies and making it more important to know how much water the snowpack contains.”

Findings

The report identified several under-utilized emerging technologies in snow measurement. These emerging technologies have the potential to enhance water supply forecasts in the near term.

Additional findings include:

  • Existing snow measurement stations and tools remain invaluable in monitoring how much water is in snow and in verifying new technologies.
  • No single snow monitoring technology currently provides complete snow condition information throughout the west.
  • Improvements in weather forecasting for temperature and precipitation complement enhanced snow monitoring to provide a more complete picture of future water supplies.
  • Several snow monitoring technologies are in the research and development phase and showing promise for substantial future benefits.
  • A commitment from federal, state and local agencies is needed to allow emerging technologies to be incorporated into common use for snow monitoring and water supply forecasting.
  • About the Report

    The report was authorized in the Snow Water Supply Forecasting Program Authorization Act of 2020 (P.L. 260-116, Sec.1111). The act placed the program responsibility within the U.S. Department of the Interior. Reclamation is implementing the program on behalf of the Secretary of the Interior.

    SOUND UP for today’s moment of Zen. Hear the trumpet of Sandhill cranes arriving by the 1000s for stopover — @CPW_SE

    Biochar Research Project Report 2021 — Citizens for Clean Air #GrandJunction

    Lobato Farms and Santa Fe HOA biochar test plots. Photo credit: Citizens for Clean Energy

    Click the link to read the report on the Citizens for Clean Air website. Here’s the project summary:

    Biochar and compost both have the potential to increase crop productivity in the short term and improve resilience by retaining soil moisture and nutrients in the long-term. As an added benefit, biochar also sequesters carbon for long periods of time because biochar is primarily elemental carbon that is not easily converted to CO2 by soil microorganisms.

    The first year’s experiment focuses on short term benefits. It took place at two locations, each with four subplots planted with the same vegetables – Ace Bell Peppers, Charger Peppers, Asian Eggplant and Curly-leafed Kale. The four subplots had different soil amendments – compost plus 20% biochar, compost plus 10% biochar, compost-only, and none.

    The table below presents summary statistics of the weight of each crop in each subplot and a comparison of the subplots to the control subplot 4. The subplot with the greatest harvest weight relative to subplot 4 is bolded; the amended subplots with values less than subplot 4 are red.

    Summary Statistics- Production Quantity by crop and subplot.
    Notes: Plot 1 is compost + 20% biochar, Plot 2 is compost + 10% biochar, Plot 3 is compost only, Plot 4 is no amendment.

    In all cases, the harvest weight from at least one of the amended plots, was greater than from subplot 4 (no amendment – the control). Subplot 2, which contained 10 percent biochar, yielded the largest produce weight for two of the four crops at Lobato Farms but none of the sub plots at the Santa Fe HOA. Subplot 1, which contained 20 percent biochar, yielded the greatest harvest weight for kale at Lobato Farms. The mixture of 20 percent biochar for both chili pepper and kale yielded the highest weight at the Santa Fe HOA.

    Using estimates of the market value of the crops, it is possible to assess the relative value of adding the different soil amendments (see table below). For both locations, using the amendments generated higher yields and the potential for more revenue. The sub plots containing biochar (1 and 2) also had higher value of output than the compost-only plot 3 at the Lobato Farm. Plot 3 did slightly better overall at Santa Fe than plot 2. The results for individual crops differ somewhat from the overall results. But only in one case (kale at Lobato’s) did plot 4 (no amendments) do better than an amended plot (plot 3). These results provide some initial confirmation of the value of using compost with biochar added.

    Estimated value of production per crop and subplot USD ($).
    Note: Prices used for value calculation reflect wholesale value in September 2021. Kale, $8 per lb. Other crops, $1 per lb.

    Click the link for coverage from The Grand Junction Daily Sentinel website (Nathan Deal). Here’s an excerpt:

    On Thursday, CCA issued a final report on its first-year study on the effects of implementing biochar into local agriculture at the Mesa County Public Library. The result: biochar-compost combinations have the potential to increase crop productivity in the short-term with the possibility of improving resilience by retaining soil moisture and nutrients in the long-term. Biochar also sequesters carbon for long periods of time because biochar is not easily biodegraded, reducing the carbon that’s released into the atmosphere. Biochar is a charcoal-like material made by heating plant matter to 600 to 800 degrees in a low-oxygen or oxygen-absent environment…

    To the naked eye, biochar is simply shiny, black material, but under a microscopic view, the heating causes pores to develop, exhausting everything except remaining carbon from the material. Those pores can then be used to hold healthier elements for long periods of time. For instance, because those pores can store water, any farm that implements biochar can operate as normal without using as much water. If materials such as field stubble, tree trimmings and yard waste can be turned into biochar in a properly operated kiln, the waste can be used to help reduce smoke pollution in the valley instead of being burned in tall, smoky piles.

    The study included growing four plots of bell peppers, chili peppers, eggplants and kale at Lobato Farms. The plots included 20% biochar and compost, 10% biochar and compost, compost only and a plot with no soil amendments. The 10% biochar-compost plot proved to produce the healthiest, most valuable crops, followed by the 20% biochar-compost plot.

    How biochar works. Graphic credit: The High Country News

    The #PuebloWest Metro District board to consider extending their temporary pause on permit sales to April 12, 2022 — The Pueblo Chieftain #ArkansasRiver

    Pueblo West. By Jeffrey Beall – Own work, CC BY 4.0, https://commons.wikimedia.org/w/index.php?curid=61051069

    Click the link to read the article on The Pueblo Chieftain website (Tracy Harmon). Here’s an excerpt:

    The Metro District Board is set to meet at 5 p.m. Monday, March 14, to vote on a possible extension of the temporary pause on permit sales until April 12. The board initially voted to pause the sales in January and had hoped to resume them this month…

    According to a report from Alan Leak at RESPEC Engineering, Pueblo West could support the sale of 14,000 total water taps “without a significant reduction in water stored in Pueblo West’s accounts in Pueblo Reservoir and Twin Lakes over the next 5 years.”

    Pueblo West currently has about 33,000 residents, so total growth could be about 47,000 people. The district’s 1972 service plan called for growth to 39,000 residents…The halt on water tap sales came after a standing- room-only crowd of residents urged the board to stop explosive growth at the Nov. 8 meeting, making it clear they don’t want to see skyrocketing water and sewer rates….

    Data provided by the district’s consulting groups will be available for residents to review prior to Monday’s meeting at http://pueblowestmetro.com/waterstudy.