The drought-monitoring period, which began on the morning of February 22 and ended early March 1, featured some wild temperature swings, along with a band of heavy precipitation stretching from the mid-South into the Northeast. In fact, this represented the second consecutive monitoring period with significant precipitation along nearly the same axis, while many other parts of the country received little or no moisture. As a result, gradual expansion of dryness and drought was the rule across much of the western half of the nation, extending into parts of the upper Midwest, as well as the southern Atlantic States and the Gulf Coast region. In contrast, heavy precipitation kept drought at bay from the Ozark Plateau into the Ohio and Tennessee Valleys and the lower Great Lakes region. Significant precipitation also fell in drought-free areas of the Pacific Northwest, leading to another round of flooding in parts of western Washington…
For much of the winter of 2021-22, the High Plains were beset by sharp temperature fluctuations and only periodic precipitation, leaving drought largely intact through the cold season. Sub-zero, daily-record lows on February 23 plunged to -8°F in Burlington, Colorado, and -2°F in Russell, Kansas. Several weather stations, including Goodland, Kansas, and Grand Island, Nebraska, reported four consecutive sub-zero minima from February 22-25. By March 1, temperatures rebounded to 73°F in Goodland and 75°F in Grand Island. Farther north, however, drought has been eradicated from the eastern Dakotas, with spring flooding becoming more likely in the Red River Valley of the North. In eastern North Dakota, persistently cold weather has helped to maintain an impressive snow cover. Across the remainder of the region however, short-term precipitation deficits have become superimposed over long-term shortfalls. By February 27, the U.S. Department of Agriculture reported topsoil moisture in Kansas was 80% very short to short, while 38% of the state’s winter wheat was rated in very poor to poor condition. In part due to short-term precipitation deficits, severe drought (D2) was broadly expanded across Kansas and Nebraska, with corresponding increases in other drought categories…
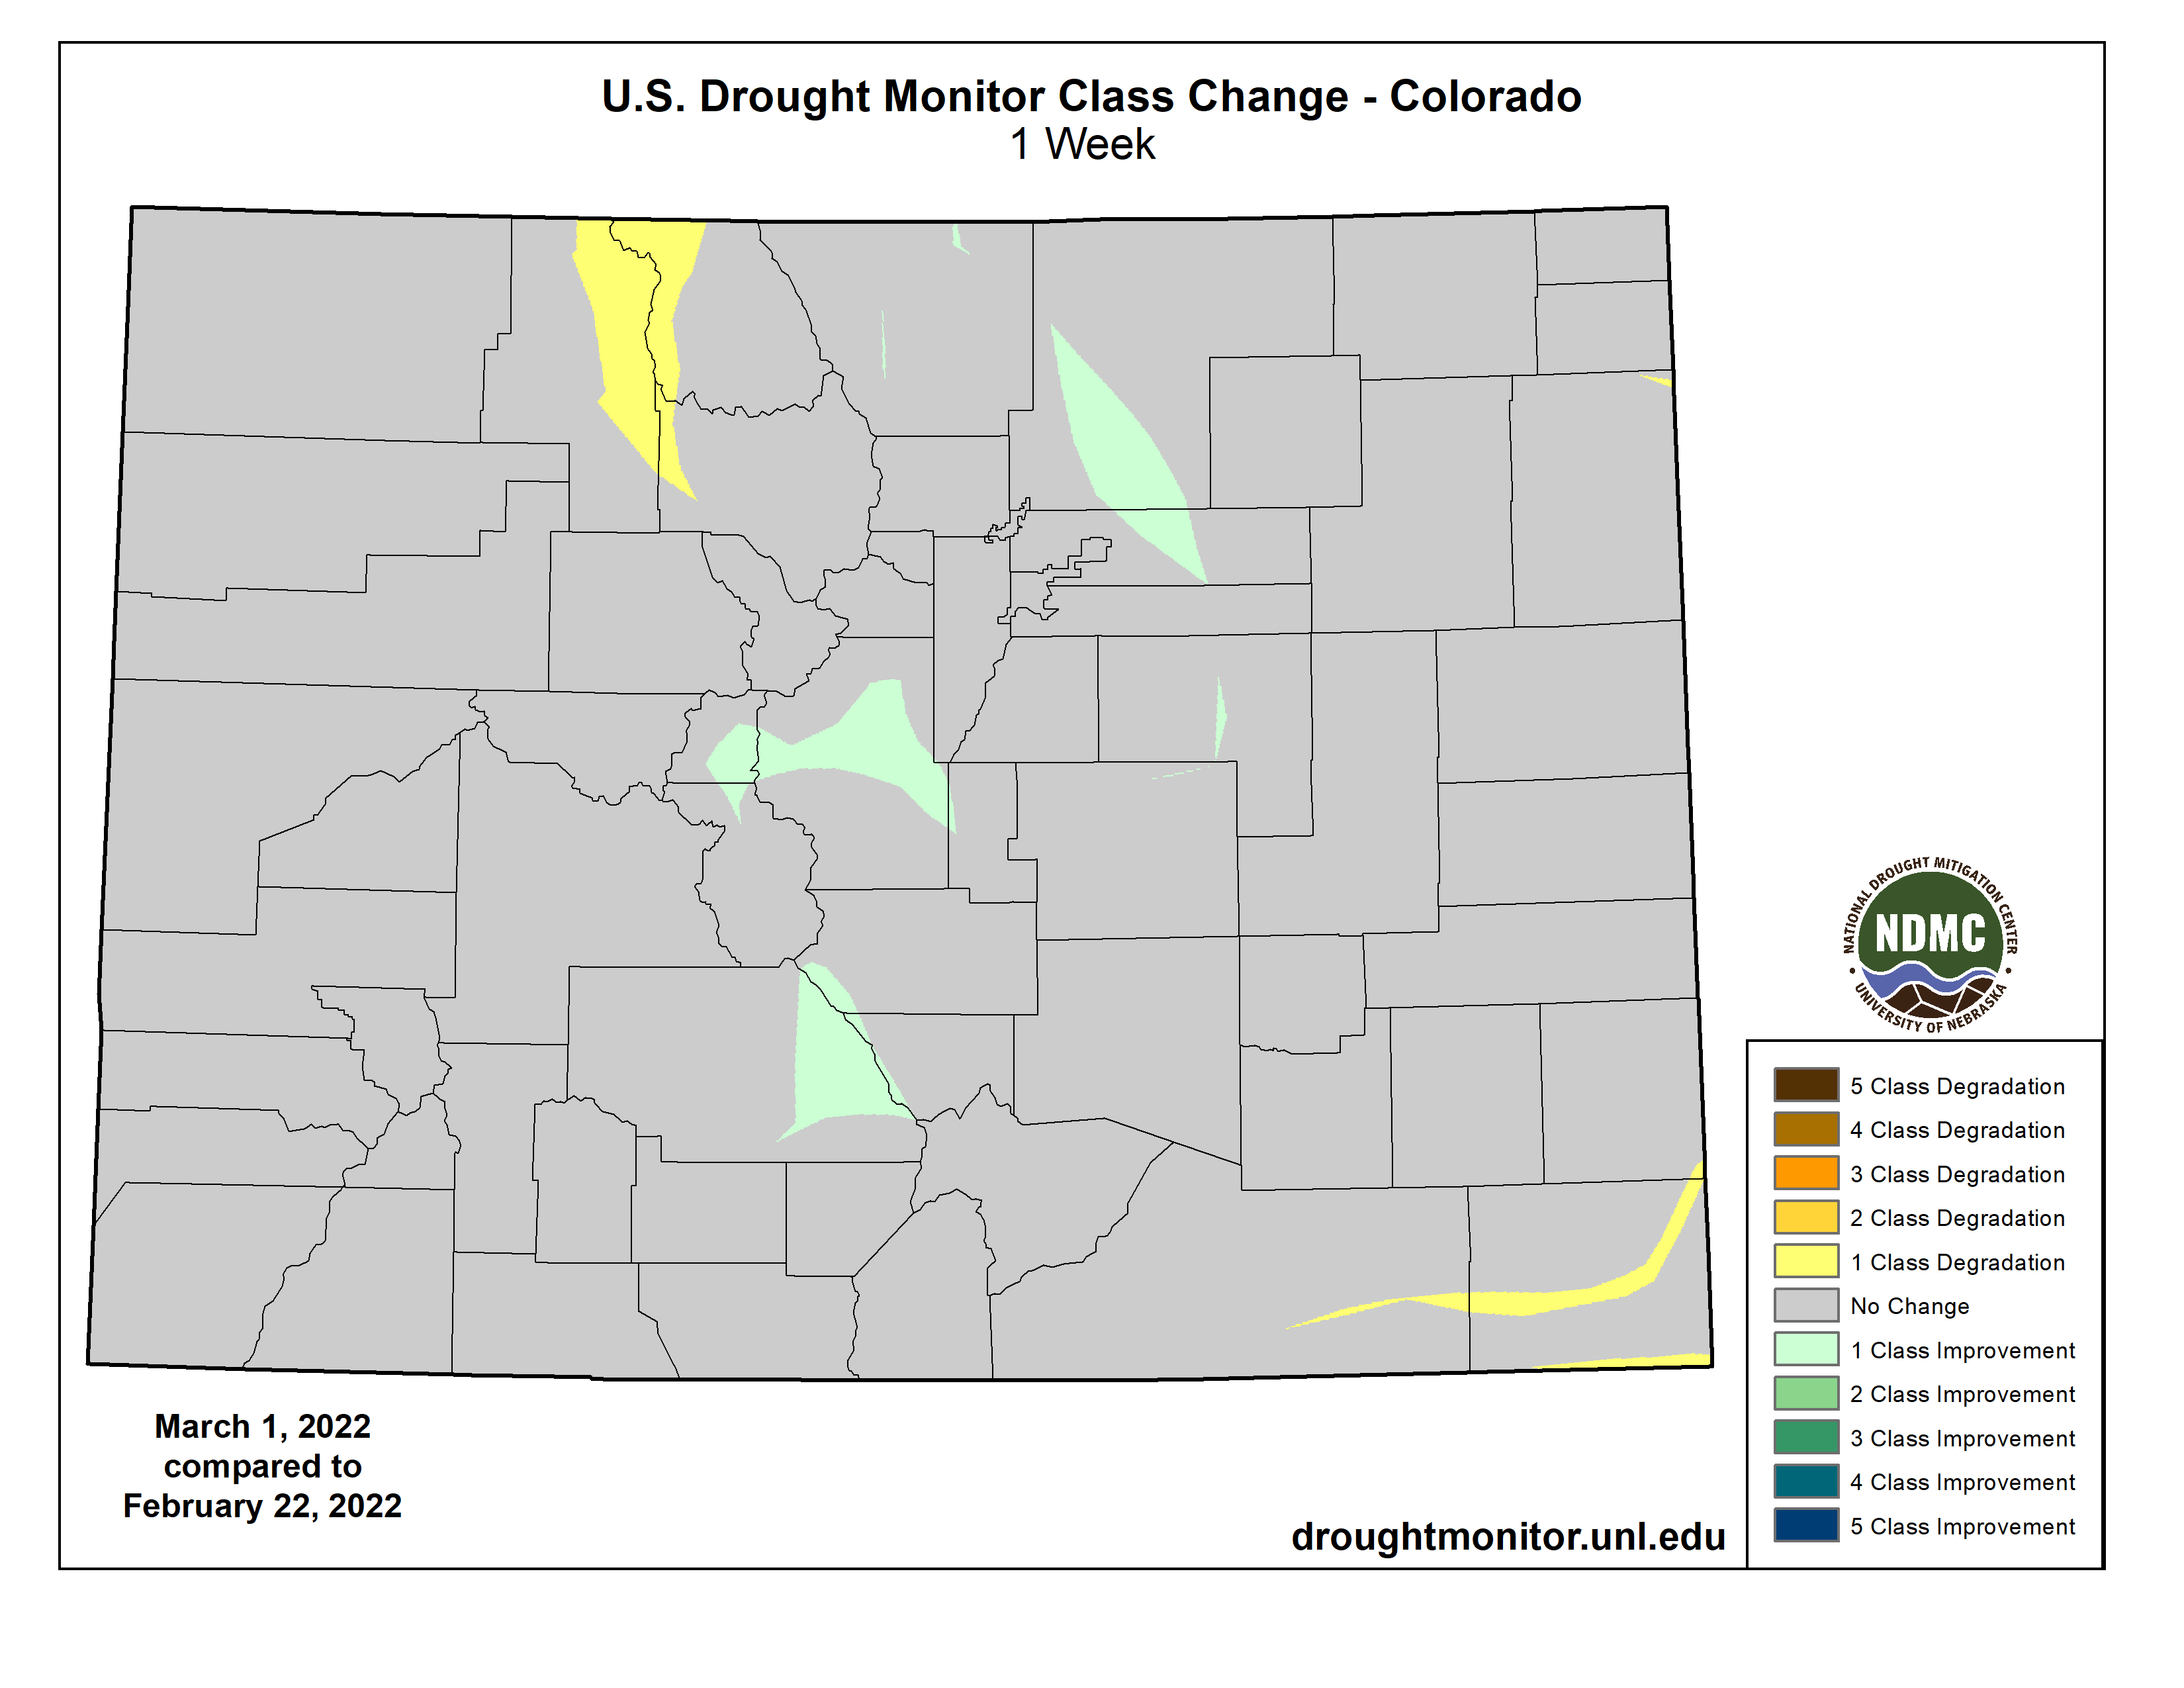
Colorado Drought Monitor one week change map ending March 1, 2022.
Most of the region experienced an extremely disappointing January-February period, with some locations, including downtown San Francisco, California, reporting record-low precipitation totals for those 2 months. San Francisco’s 2-month total of 0.65 inch (7% of normal) eclipsed the record of 0.72 inch established in January-February 1852. Downtown San Francisco also received no rain—not even a trace—from January 8 to February 20, a span of 44 days, followed by a meager 0.04 inch on the 21st. San Francisco’s longest winter dry spell remains 46 days, from December 1, 1876, to January 15, 1877—a streak that began in late autumn (on November 17) and extended to 60 days. The longest modern winter dry spell in San Francisco’s history stretched 43 days, from December 25, 2014 – February 5, 2015. Other California locations setting records for January-February dryness included San Jose (0.01 inch), Fresno (0.04 inch), Sacramento (0.05 inch), and Eureka (2.39 inches). According to the California Department of Water Resources, the average water equivalency of the Sierra Nevada snowpack stood near 15 inches at the end of February (less than two-thirds of average for the date)—effectively no change from the beginning of the year. Similar scenarios played out in many other areas of the western U.S., with promising early-season snowpack “flatlining” during January and February. By the end of February, basin-average snowpack water equivalency values were close to normal only in selected areas, including the northern Cascades, portions of the northern and central Rockies, and the Wasatch Range. Significantly below-average snowpack (less than 70% of average) was common across the Sierra Nevada and the northern Great Basin, extending into parts of southern and eastern Oregon. Low snowpack numbers were also noted in parts of eastern Wyoming and large sections of the Southwest…
For the second week in a row, a sharp contrast existed between heavy precipitation in the mid-South and mostly dry weather closer to the Gulf Coast and across the southern Great Plains. That pattern, consistent with La Niña, helped to sharpen the drought gradient across Arkansas and Mississippi. Meanwhile, extreme drought (D3) was expanded in several areas, including southwestern Louisiana. Winter (December-February) rainfall totaled just 5.18 inches (39% of normal) in New Iberia, Louisiana, and 3.94 inches (29%) in Beaumont-Port Arthur, Texas. On February 27, statewide topsoil moisture in Texas and Oklahoma was rated at least three-quarters very short to short, according to the U.S. Department of Agriculture. On that date, winter wheat was rated 75% very poor to poor in Texas, along with 65% in Oklahoma. Texas also reported 69% of its rangeland, pastures, and oats were rated very poor to poor. Burn bans were in effect for dozens of counties across Texas, as well as western and central Oklahoma.
US Drought Monitor one week change map ending March 1, 2022.
Just for grins here’s a gallery of early March US Drought Monitor maps for the past few years.
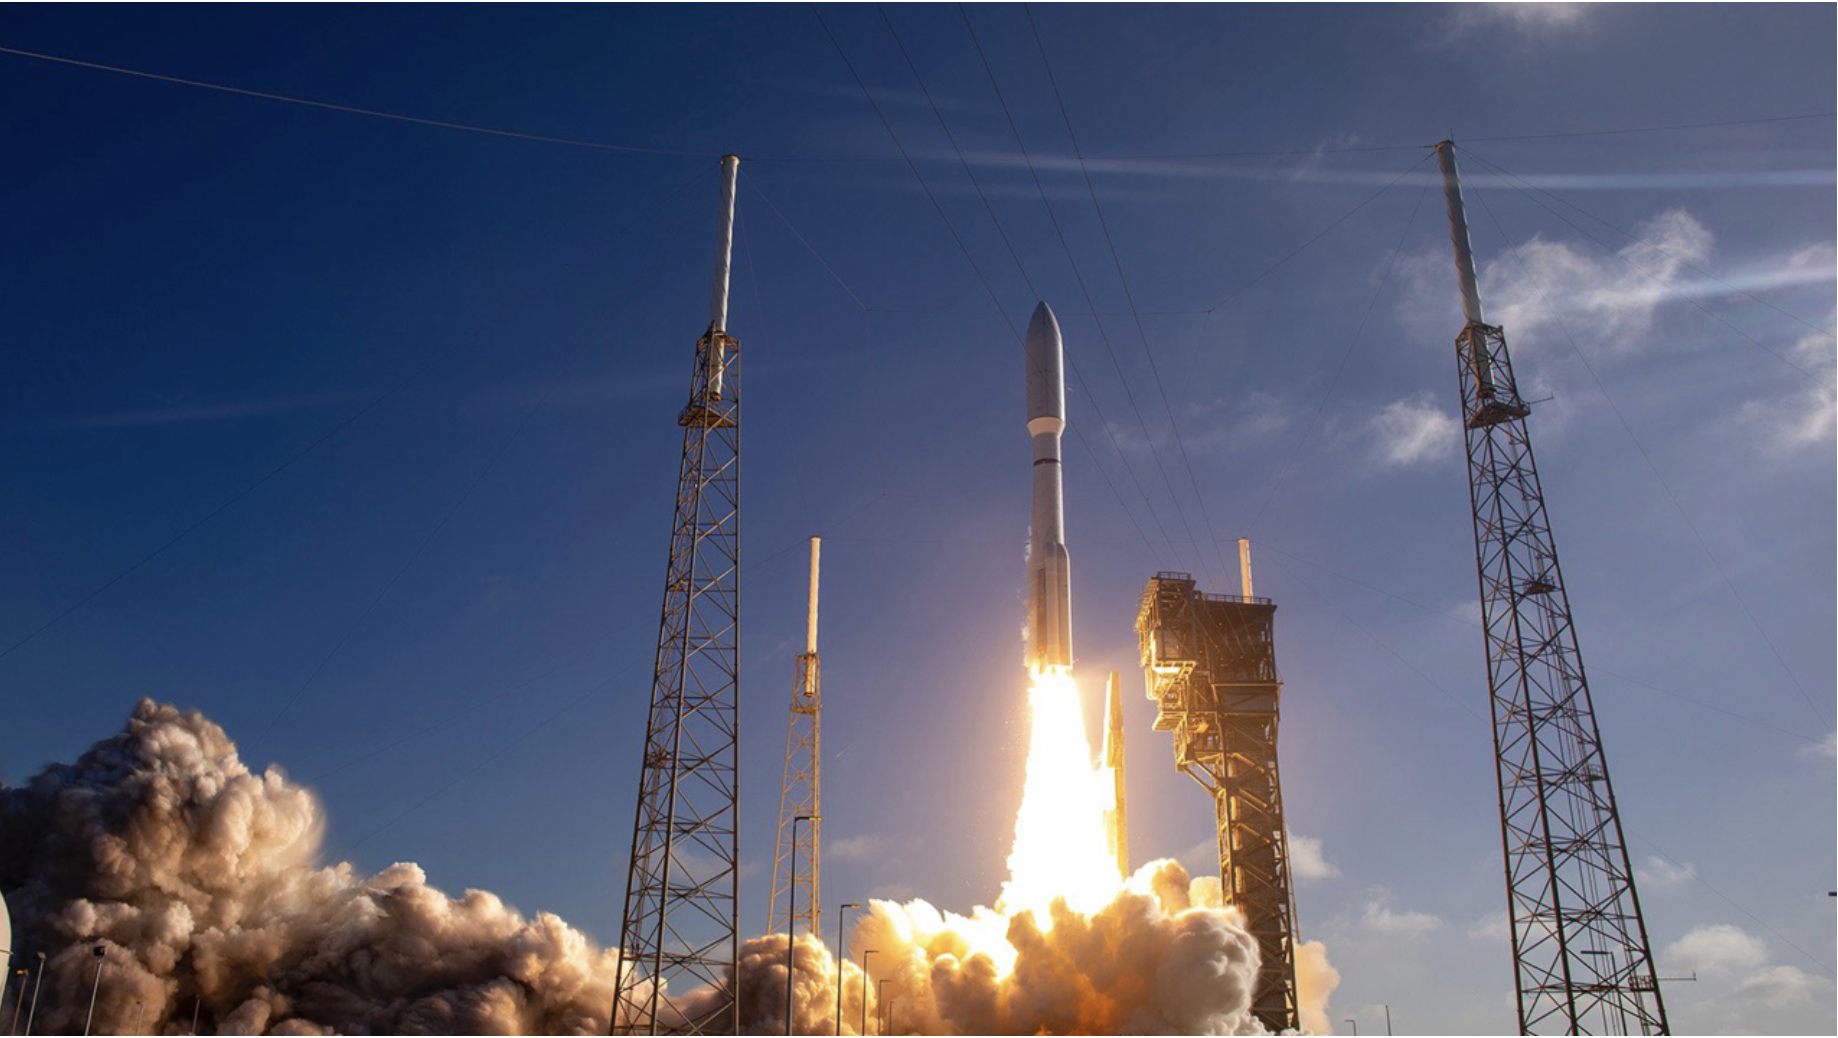
Liftoff of NOAA’s GOES-T satellite from Cape Canaveral, Florida, on March 1, 2022. (United Launch Alliance)
Click the link to read the article on the NOAA website (John Leslie):
NOAA’s GOES-T, the third in a series of four advanced geostationary weather satellites, blasted into orbit aboard a United Launch Alliance Atlas V 541 rocket at 4:38 p.m. ET today from Cape Canaveral, Florida. GOES-T’s mission managers confirmed that its solar arrays successfully deployed at 8:28 p.m. EST, and the satellite was operating on its own power.
GOES-T will track destructive wildfires, lightning, Pacific Ocean-based storms, dense fog, and other hazards that threaten the U.S. West Coast, Hawaii and Alaska. It will also monitor solar activity and space weather to provide early warnings of disruptions to power grids, communications and navigation systems.
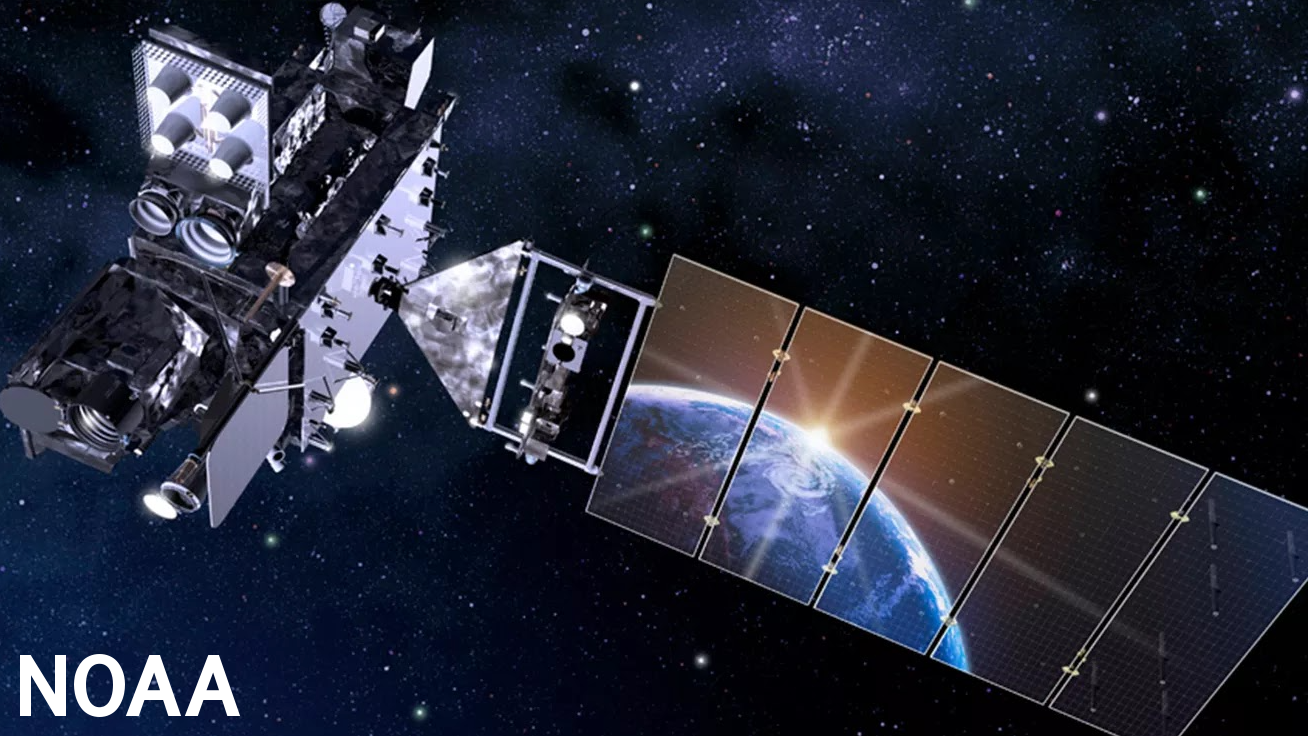
Artist’s rendering of NOAA’s GOES-T, which will provide coverage for U.S. West Coast, Hawaii and Alaska. (NOAA)
“GOES-T joins the suite of advanced technology providing critical data and imagery to forecasters and researchers tracking hazardous weather and working toward building a climate ready nation,” said NOAA Administrator Rick Spinrad, Ph.D.
Once GOES-T is positioned in a geostationary orbit 22,300 miles above the Earth, after approximately two weeks, it will be renamed GOES-18. After undergoing a full checkout and validating its six high-tech instruments, the new satellite will move to the GOES-West position and replace GOES-17 in early 2023.
From there, it will constantly provide advanced imagery and atmospheric measurements. Observations from GOES-18 will be fed into the NOAA’s National Weather Service’s computer models used by meteorologists to develop forecasts and help predict the formation, growth, intensity and movement of hazardous weather systems.
Additionally, the GOES-18 lightning mapper’s robust and continuous data over the ocean and in mountainous and rural areas not covered by radar will assist in making tropical, aviation and marine forecasts. The lightning data can alert us to the potential ignition of a wildfire and its imager will help pinpoint the initial location of a wildfire — crucial for emergency response teams fighting the fires and initiating evacuations. GOES-18 will also help forecasters track and predict the formation and dissipation of fog, which can disrupt airport operations.
GOES-18 will work in tandem with GOES-16, the first satellite in NOAA’s new geostationary series, in the GOES-East position. Together, the satellites will observe more than half the globe — from the west coast of Africa to New Zealand and from Alaska to Antarctica.
“NOAA’s geostationary satellite system provides the only continuous coverage of the Western Hemisphere, enabling forecasters to issue warnings to protect the lives and property of the one billion people, who live and work in the Americas,” said Steve Volz, Ph.D., acting assistant secretary for environmental observation and prediction and the assistant administrator of NOAA’s Satellite and Information Service.
NOAA oversees the GOES-R Series Program through an integrated NOAA-NASA office, manages the ground system, operates the satellites and distributes their data to users worldwide. NASA’s Goddard Space Flight Center oversees the acquisition of the GOES-R spacecraft and instruments, and built the Magnetometer for GOES-T and the future GOES-U. Launch management is provided by NASA’s Launch Services Program based at the agency’s Kennedy Space Center. Lockheed Martin designs, builds, and tests the GOES-R series satellites. L3Harris Technologies provides the main instrument payload, the Advanced Baseline Imager, along with the ground system, which includes the antenna system for data reception.
Looking forward, NOAA is working with NASA on the next-generation geostationary satellite mission called GeoXO, which will bring new capabilities in support of U.S. weather, ocean and climate operations in the 2030s. NASA will manage the development of the GeoXO satellites and launch them for NOAA.
The East Troublesome Fire in Grand County burned down to the shore of Willow Creek Reservoir, one of the lakes in Northern Water’s collection system in Grand County. Dec. 13, 2020. Credit: Jerd Smith
As forecasters call for a warm summer ahead in Colorado, threatening to further weaken the state’s water supplies, water and fire officials plan a major two-day confab later this month in Grand Junction, in hopes of bringing more people together to understand and plan how best to protect the state’s vital mountain watersheds.
Like other Western states, Colorado derives the majority of its water for cities, farms and industry from mountain snowmelt, a resource that is coming under increasing pressure due to drought and climate change.
“Before the Fire: Protecting the Water Towers of the West,” is designed “to frame the issue around challenges, and demonstrate the impacts of unhealthy watersheds and inaction,” said Christian Reece, executive director of Grand Junction-based Club 20, an economic development group that is sponsoring the conference.
Representatives of the U.S. Forest Service, the Colorado State Forest Service, and other experts will be presenting at the conference, slated for March 24 and 25.
The summit comes as Colorado and other Western states prepare for what may become another rough wildfire season.
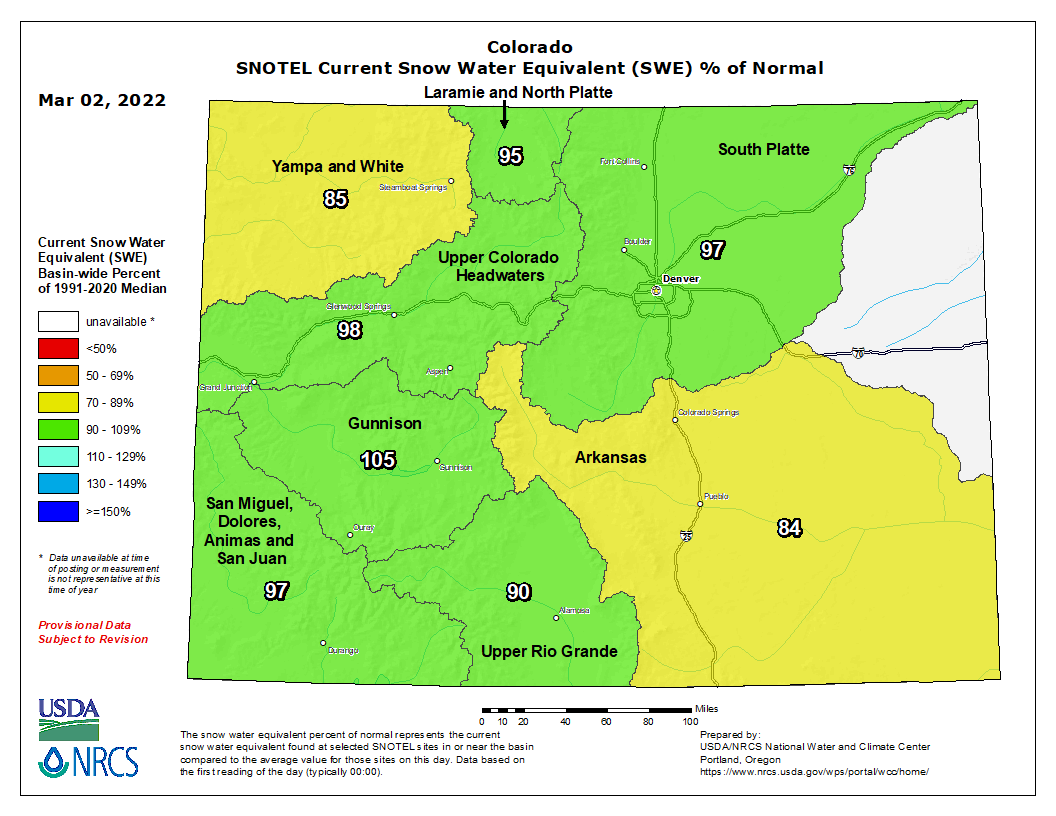
Colorado snowpack basin-filled map March 2, 2022 via the NRCS.
Colorado’s snowpack is resting at average for this time of year, and whether traditional spring snows will materialize to boost it above average remains unclear.
Peter Goble, a climate specialist with the Colorado Climate Center at Colorado State University, said the weather outlook for the spring could go either way, but warm summer temperatures could leave the state under fire threat again.
“There is not as clear a picture as we would like,” Goble said. And though the near-term forecasts for March indicate the state could receive good snow, the runoff forecasts for the spring and summer are likely to be lower than average.
“The way temperatures are trending, we’re more likely to have a warmer summer and we need to factor that in,” he said.
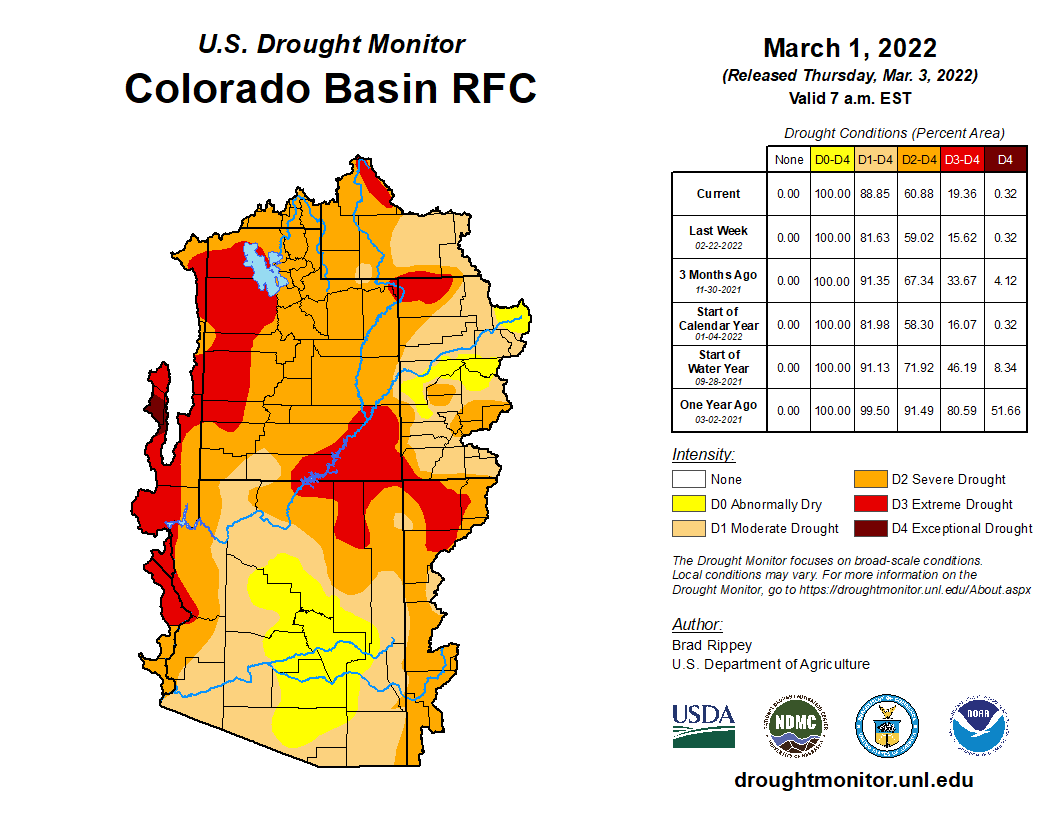
Colorado River Basin Drought Monitor snowpack basin-filled map March 1, 2022.
The seven-state Colorado River Basin, suffering under what is considered to be the worst drought in 1,200 years, will need several back-to-back years of mega snowpacks in order to recover, according to the Colorado Climate Center.
“The 1,200-year drought is not good news,” Reece said. “But it helps make the case for why watershed work is so critical.”
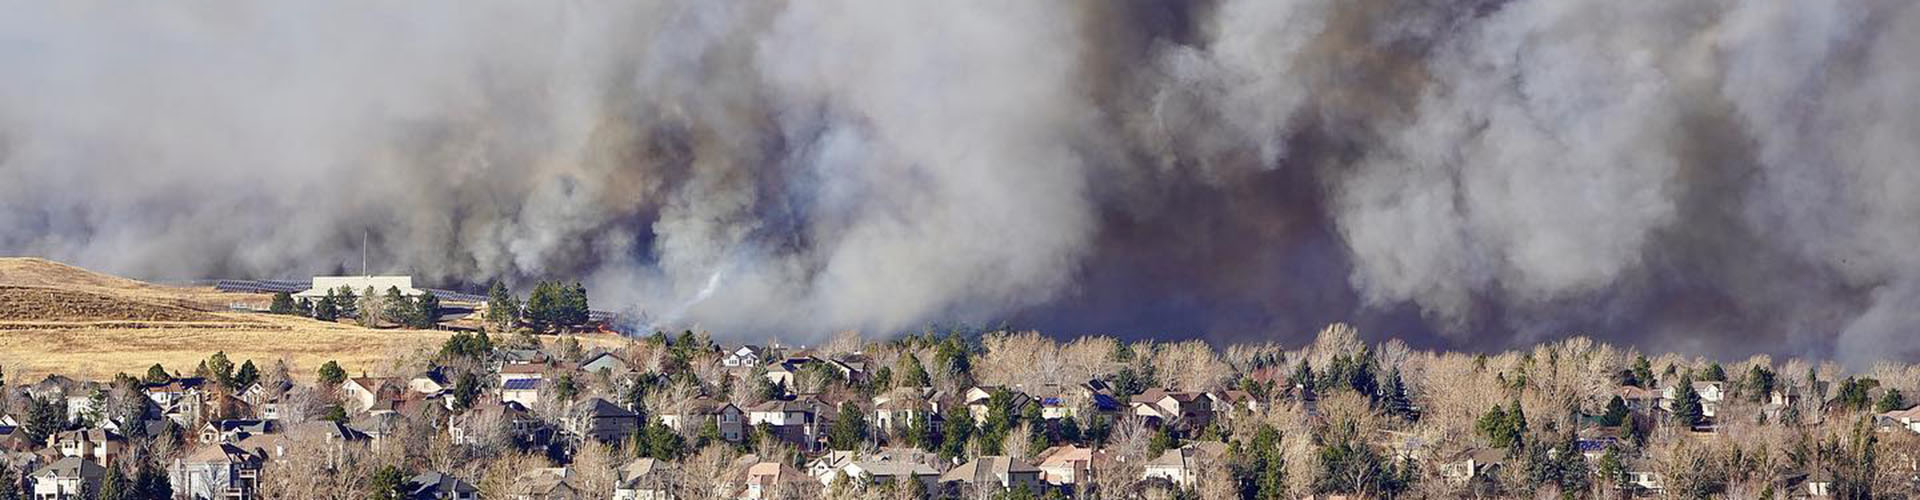
After the catastrophic Marshall Fire burned 25 miles north of Denver on Dec. 30, the state has been on edge, unnerved by the emergence of urban wildfires and a winter fire season.
“Here in Colorado, after our 2020 fire season and now the Marshall Fire, I truly believe we have to change how we tackle wildfires,” said Dan Gibbs, executive director of the Colorado Department of Natural Resources, via email. Gibbs will be presenting at the conference.
Among the topics on tap is how to utilize tens of millions of dollars in federal and state funding that is being set aside to reduce fuel loads in mountain watersheds and to help restore the water systems that lie within the burn areas.
“We’ll try to break down the silos and elevate the importance of watersheds,” Reece said. “We hope we inspire people so much that they leave the summit and decide that they want to take on watershed protection work when they get home.”
Jerd Smith is editor of Fresh Water News. She can be reached at 720-398-6474, via email at jerd@wateredco.org or @jerd_smith.
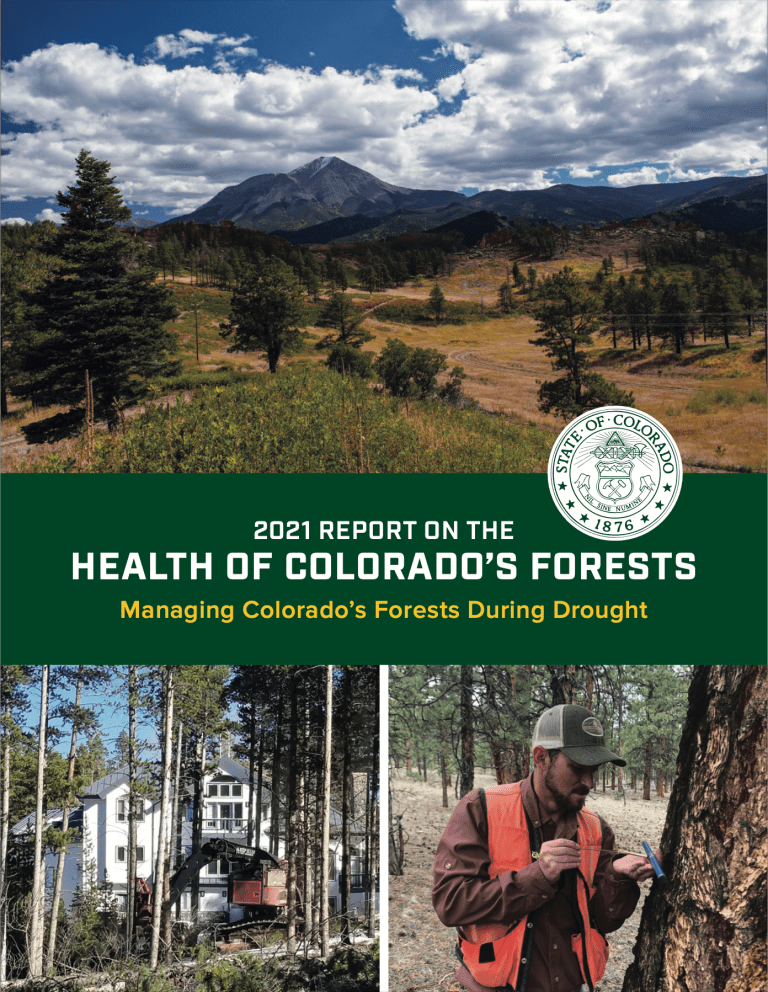
Ongoing drought in Colorado is affecting the state’s forests, leaving trees susceptible to outbreaks of deadly bark beetles and increasing the risk of wildfires.
These conditions, combined with more people living in areas where wildlands intermingle with neighborhoods, are creating enormous challenges for Colorado’s forests and communities.
The 2021 Report on the Health of Colorado’s Forests looks at the trends driving these issues and what the Colorado State Forest Service, partners and all of us must do to protect our forests and prepare for inevitable wildfires.
Human-caused climate change is disrupting ecosystems, upending the lives of billions of people around the world and has set the stage for dangerous, possibly unavoidable hazards, said scientists in the latest report from the Intergovernmental Panel on Climate Change.
In Colorado, the impacts are being felt statewide, from worsening wildfires to shrinking snowpacks and ongoing droughts — and the future could see more of the same, or worse.
The warming is already driving an uptick of droughts, floods and heatwaves that are endangering plants and animals and threatening human health, scientists wrote in the report, part of the sixth major assessment of climate science from the United Nations. The warming is intensifying so rapidly researchers say it could soon threaten the ability of nature and humans to adapt unless greenhouse gas emissions are quickly reduced, they write…
Here’s are some of the key findings for Colorado and the Western United States:
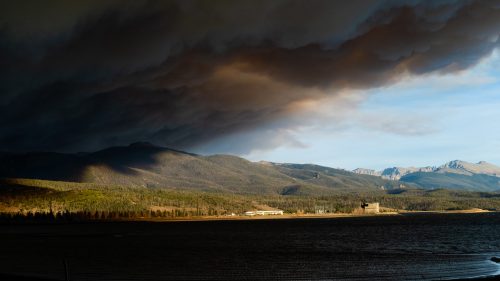
Smoke from the East Troublesome fire looms over Granby Reservoir. Photo credit: Evan Wise via Water for Colorado
Wildfires are expected to increase and intensify as climate change leads to warmer and drier conditions. Warming has also led to longer fire seasons and increased firefighting costs. Smoke from intensified wildfires is linked to respiratory health problems and increased hospital admissions, which are projected to grow even more, especially in elderly, low-income and Black and Native American communities
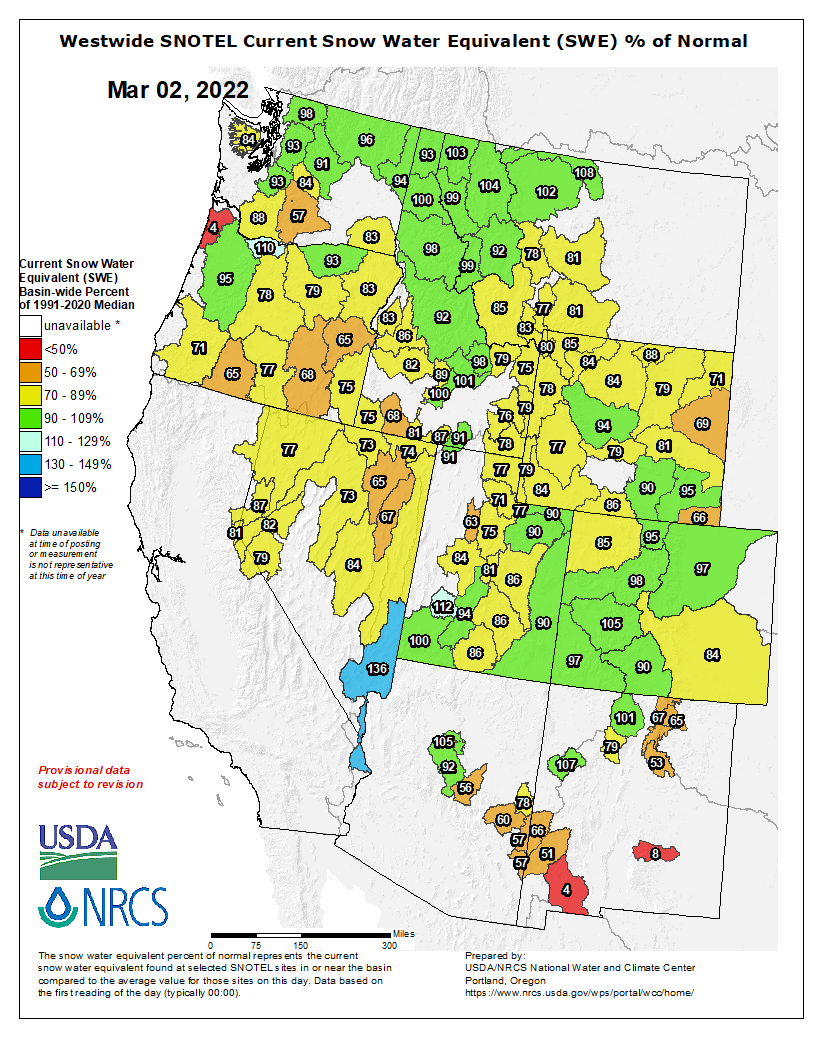
Westwide SNOTEL basin-filled map March 2, 2022 via the NRCS.
Snowpack and snow cover have declined as temperatures have increased. The warming is driving “snow droughts” that reduce the runoff that recharges critical water supplies
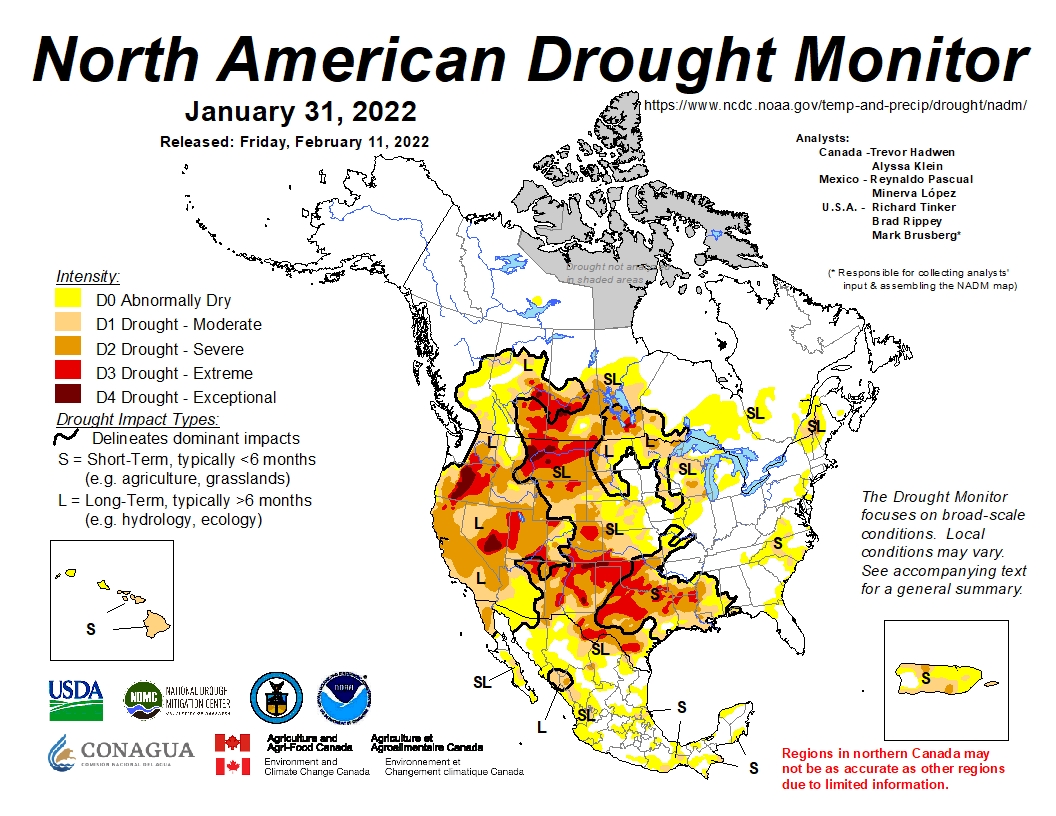
North American Drought Monitor map January 2022
Droughts are getting longer, more severe and are causing environmental and economic damage. Warming is also worsening tensions over competing water use interests
A stock pond that is normally full of water stands dry because of drought on the Little Bear Ranch near Steamboat Springs, Colo., on Aug. 11, 2021. Due to low snowpack, warming temperatures and dry soil during the past two years, followed by the same in 2021, Northwest Colorado is in a severe drought. Credit: Dean Krakel, special to Fresh Water News.
Freshwater supplies that are being hurt by reduced snowpack and earlier runoff seasons are being further degraded by overuse, poor management and deteriorating water infrastructure
Eastern Colorado farmer Jay Sneller watches the mowing of his drought-ravaged corn crop during the drought of 2012. JOHN MOORE / GETTY IMAGES
Farming and food production are also threatened by drought and water shortages, and warming is already negatively affecting crop yields, quality and marketability of agricultural products. Increased warming is also expected to affect the occurrence and severity of diseases that infect livestock
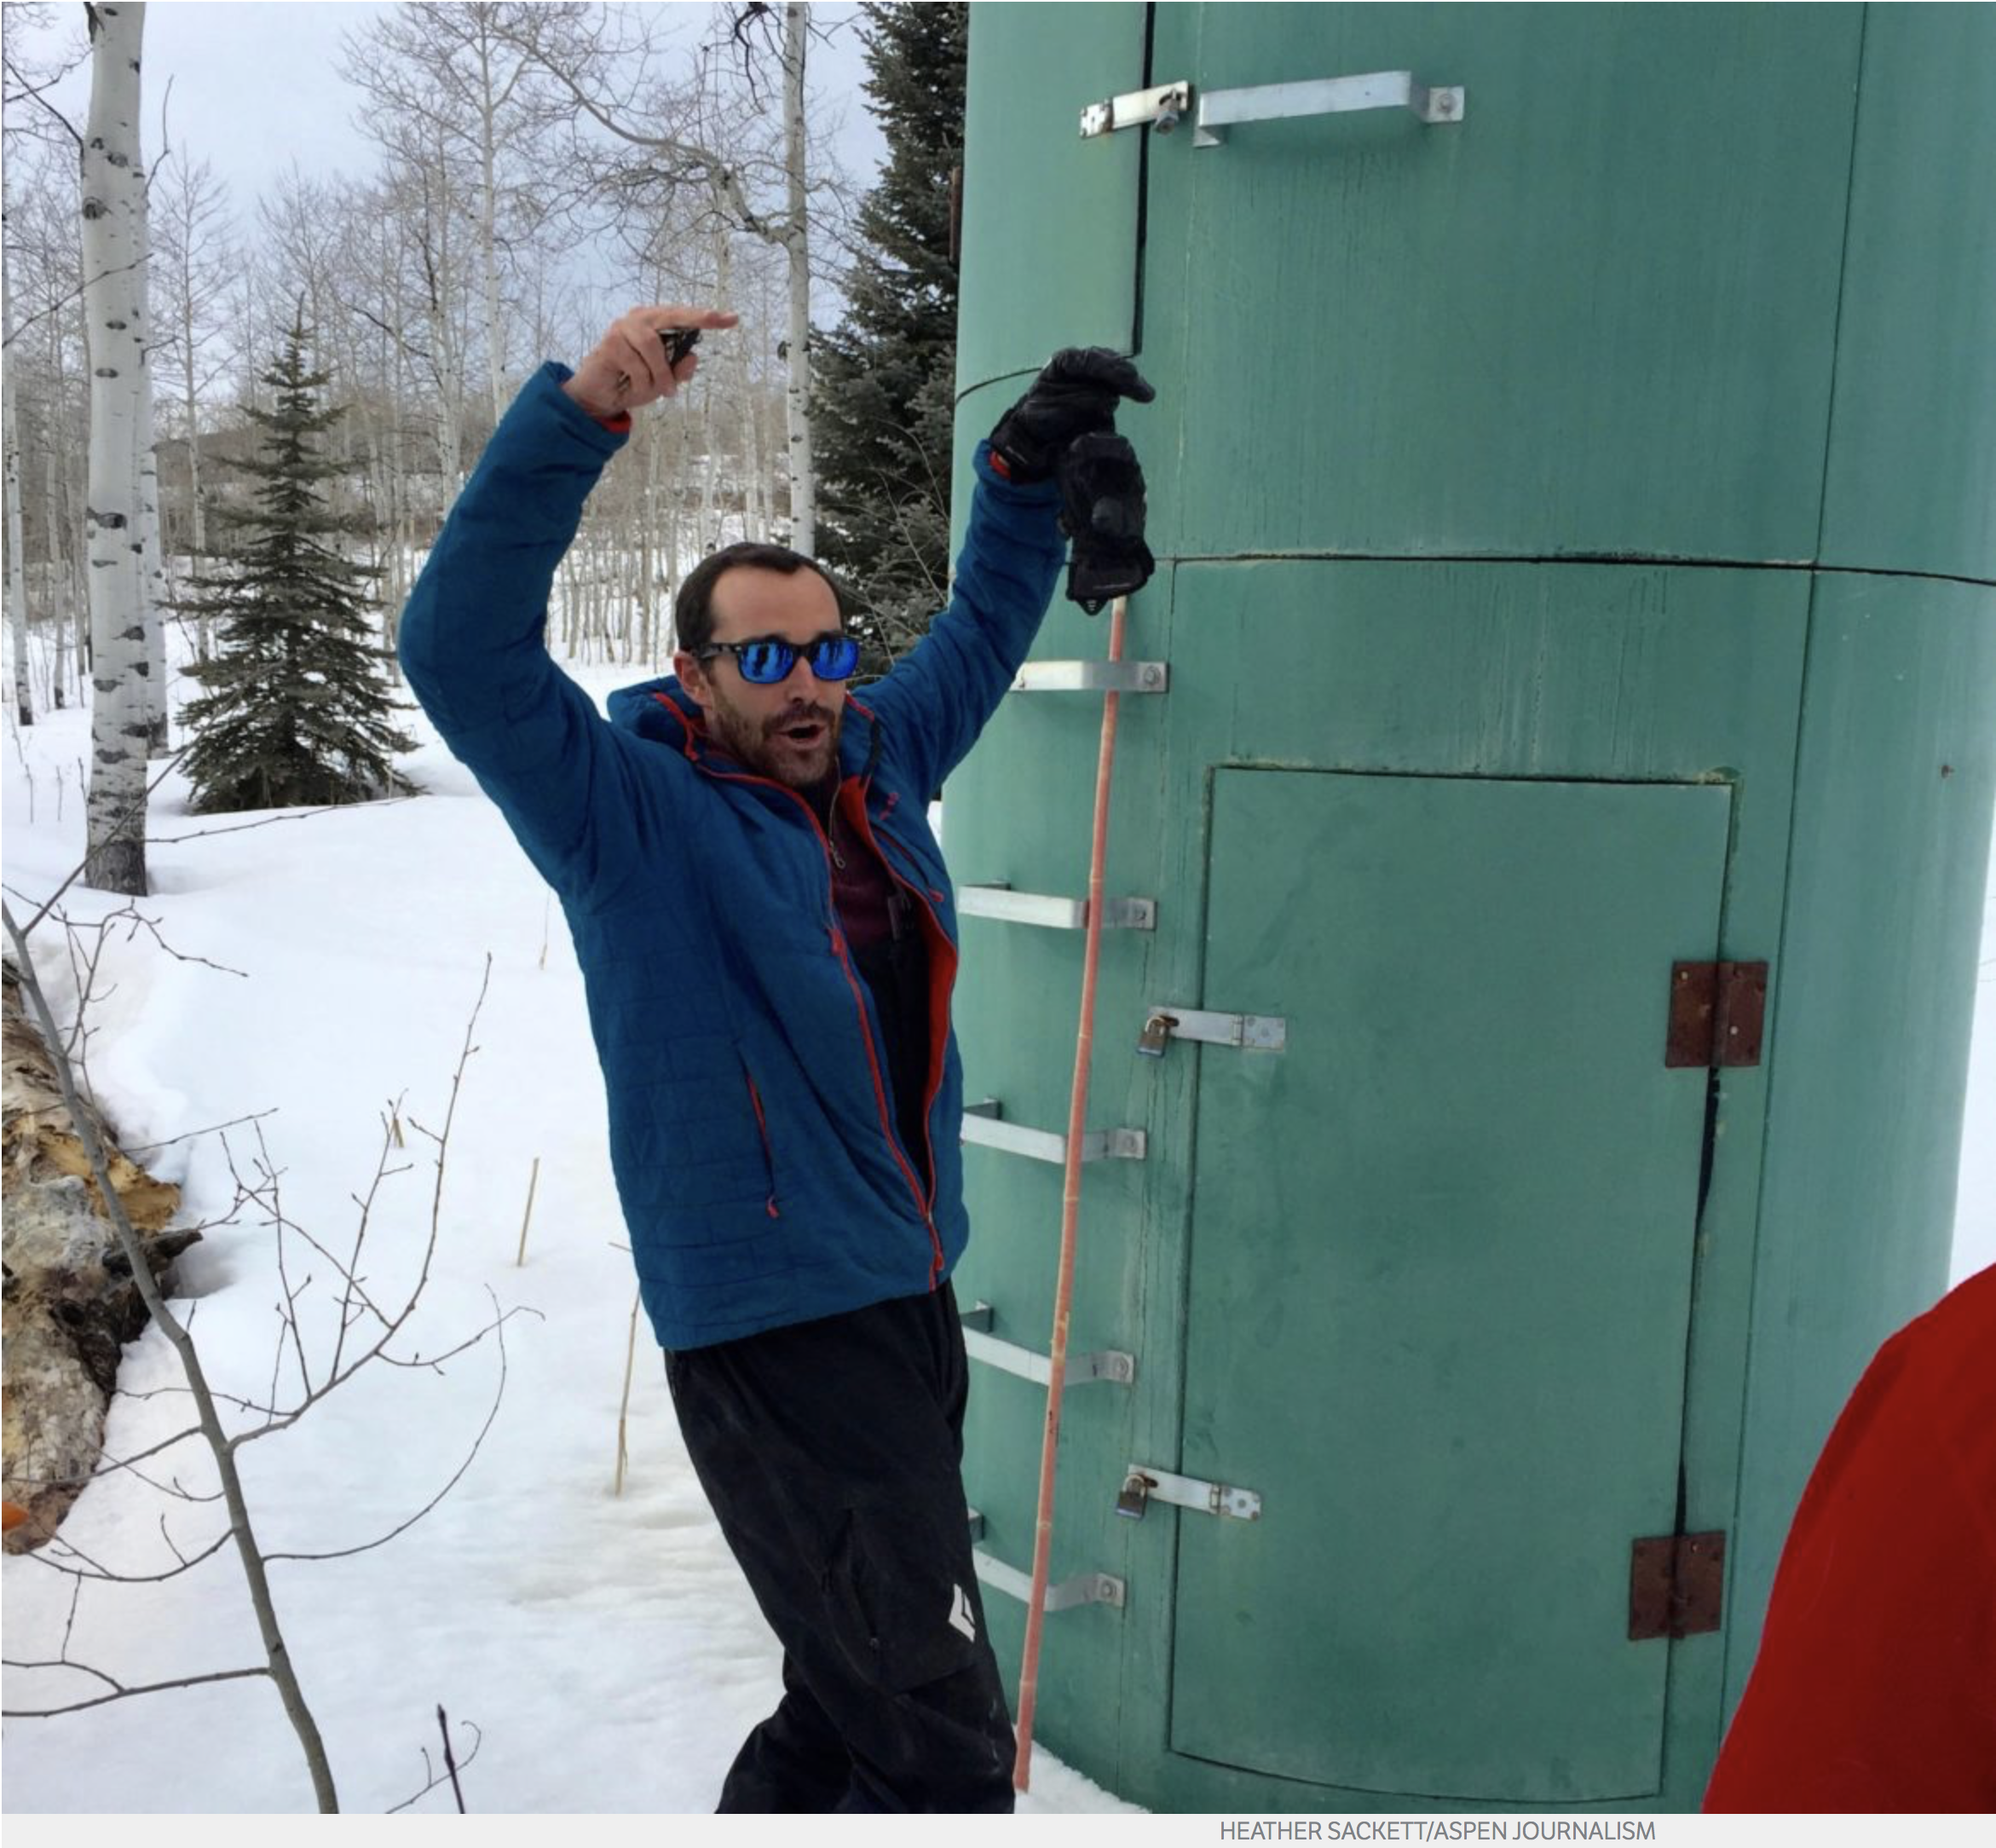
In March of 2018 Karl Wetlaufer, a hydrologist and assistant supervisor with the National Resources Conservation Service Colorado Snow Survey, gestures to indicate how high snowpack has been in past years at the McClure Pass site. Data collectors would have to climb the rungs up to the second, higher door to access the shelter. Photo credit: Heather Sackett/Aspen Journalism
Click the link to read the article on the KUNC website (Alex Hager). Here’s an excerpt:
The snow that accumulates in the mountains of Colorado and Wyoming will eventually become water in the Colorado River. Some of it will flow as far south as Mexico, running through kitchen faucets in cities and suburbs along the way, or watering crops that keep America fed through the winter. Year by year, those piles are getting slightly smaller and melting earlier — slowly exhibiting the sting of a warming climate. The way we measure the snow is changing too, as a shifting baseline for what counts as “average” paints a somewhat deceptive picture of how much snow is stored up in the mountains…
It’s noticeable to the scientists too, who have data to back up observations that Colorado’s snowpack is changing.
“If you look at long-term climate trends, you see a general warming in climate,” said Heather Lewin, science and policy director at Roaring Fork Conservancy. “Which doesn’t necessarily change the amount of precipitation in headwaters areas, but changes how it falls.”
The conservancy does river research and education just downstream of Aspen, where snowmelt rushes through the valley on its way to the Colorado River. The Roaring Fork watershed makes up 0.5% of the landmass in the Colorado River basin, but provides about 10% of its water…
Roaring Fork River back in the day
As snow behavior changes, so does the way we understand snow measurement. In spring 2021, the National Oceanic and Atmospheric Administration (NOAA) shifted how it calculates averages for all of its data. In a way, it’s routine. Every 10 years, NOAA moves the three-decade window that it uses for averages. But the rapidly accelerating effects of climate change mean the current window sticks out from previous 30-year periods. The current window runs from 1991 to 2020, which includes the hottest-ever period in America’s recorded weather history. Because of that, snowpack data tells a slightly deceptive story. It’s most frequently shared as a percent of average when it appears in newspapers and reports for skiers and river users. For example, if snowpack is at 120%, the number would appear far lower if current totals were compared to normals going back further than 30 years.
SNOTEL Site via the Natural Resources Conservation Service