The health of our waters is the principal measure of how we live on the land — Luna Leopold
The #ColoradoRiver starts as snow, and the way we understand it is changing — KUNC #snowpack #COriver #aridification
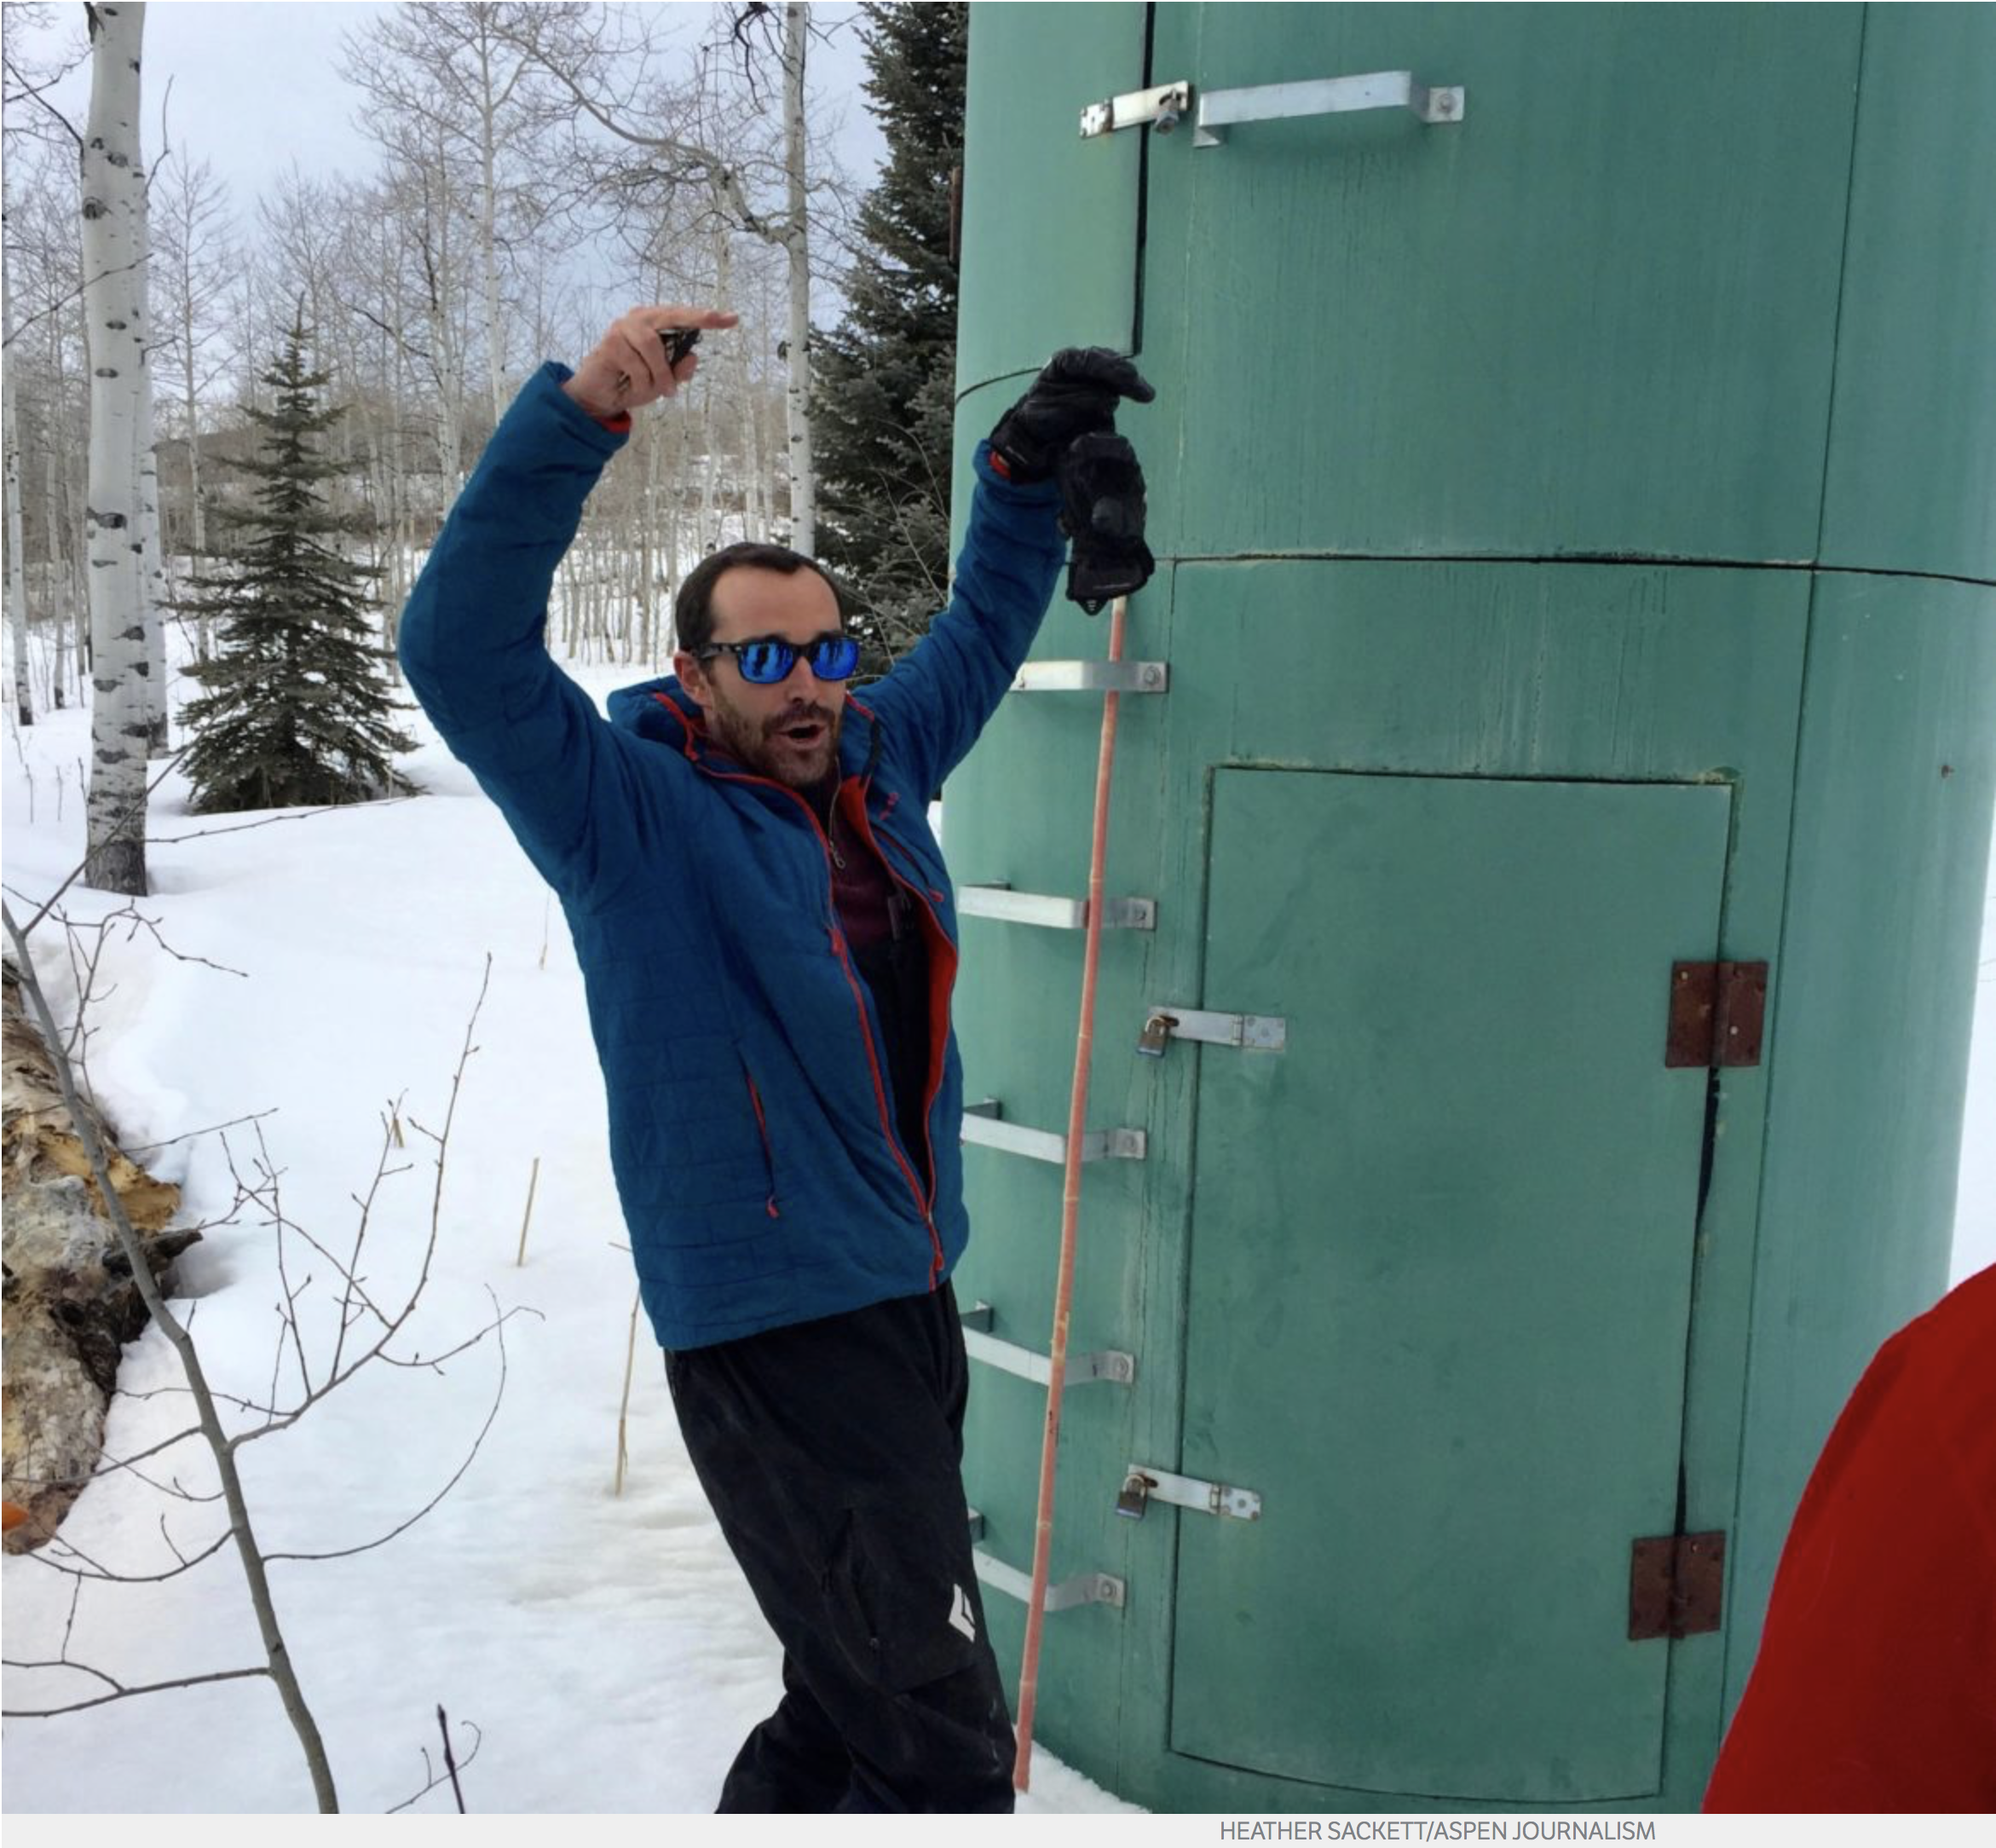
In March of 2018 Karl Wetlaufer, a hydrologist and assistant supervisor with the National Resources Conservation Service Colorado Snow Survey, gestures to indicate how high snowpack has been in past years at the McClure Pass site. Data collectors would have to climb the rungs up to the second, higher door to access the shelter. Photo credit: Heather Sackett/Aspen Journalism
Click the link to read the article on the KUNC website (Alex Hager). Here’s an excerpt:
The snow that accumulates in the mountains of Colorado and Wyoming will eventually become water in the Colorado River. Some of it will flow as far south as Mexico, running through kitchen faucets in cities and suburbs along the way, or watering crops that keep America fed through the winter. Year by year, those piles are getting slightly smaller and melting earlier — slowly exhibiting the sting of a warming climate. The way we measure the snow is changing too, as a shifting baseline for what counts as “average” paints a somewhat deceptive picture of how much snow is stored up in the mountains…
It’s noticeable to the scientists too, who have data to back up observations that Colorado’s snowpack is changing.
“If you look at long-term climate trends, you see a general warming in climate,” said Heather Lewin, science and policy director at Roaring Fork Conservancy. “Which doesn’t necessarily change the amount of precipitation in headwaters areas, but changes how it falls.”
The conservancy does river research and education just downstream of Aspen, where snowmelt rushes through the valley on its way to the Colorado River. The Roaring Fork watershed makes up 0.5% of the landmass in the Colorado River basin, but provides about 10% of its water…
Roaring Fork River back in the day
As snow behavior changes, so does the way we understand snow measurement. In spring 2021, the National Oceanic and Atmospheric Administration (NOAA) shifted how it calculates averages for all of its data. In a way, it’s routine. Every 10 years, NOAA moves the three-decade window that it uses for averages. But the rapidly accelerating effects of climate change mean the current window sticks out from previous 30-year periods. The current window runs from 1991 to 2020, which includes the hottest-ever period in America’s recorded weather history. Because of that, snowpack data tells a slightly deceptive story. It’s most frequently shared as a percent of average when it appears in newspapers and reports for skiers and river users. For example, if snowpack is at 120%, the number would appear far lower if current totals were compared to normals going back further than 30 years.
SNOTEL Site via the Natural Resources Conservation Service