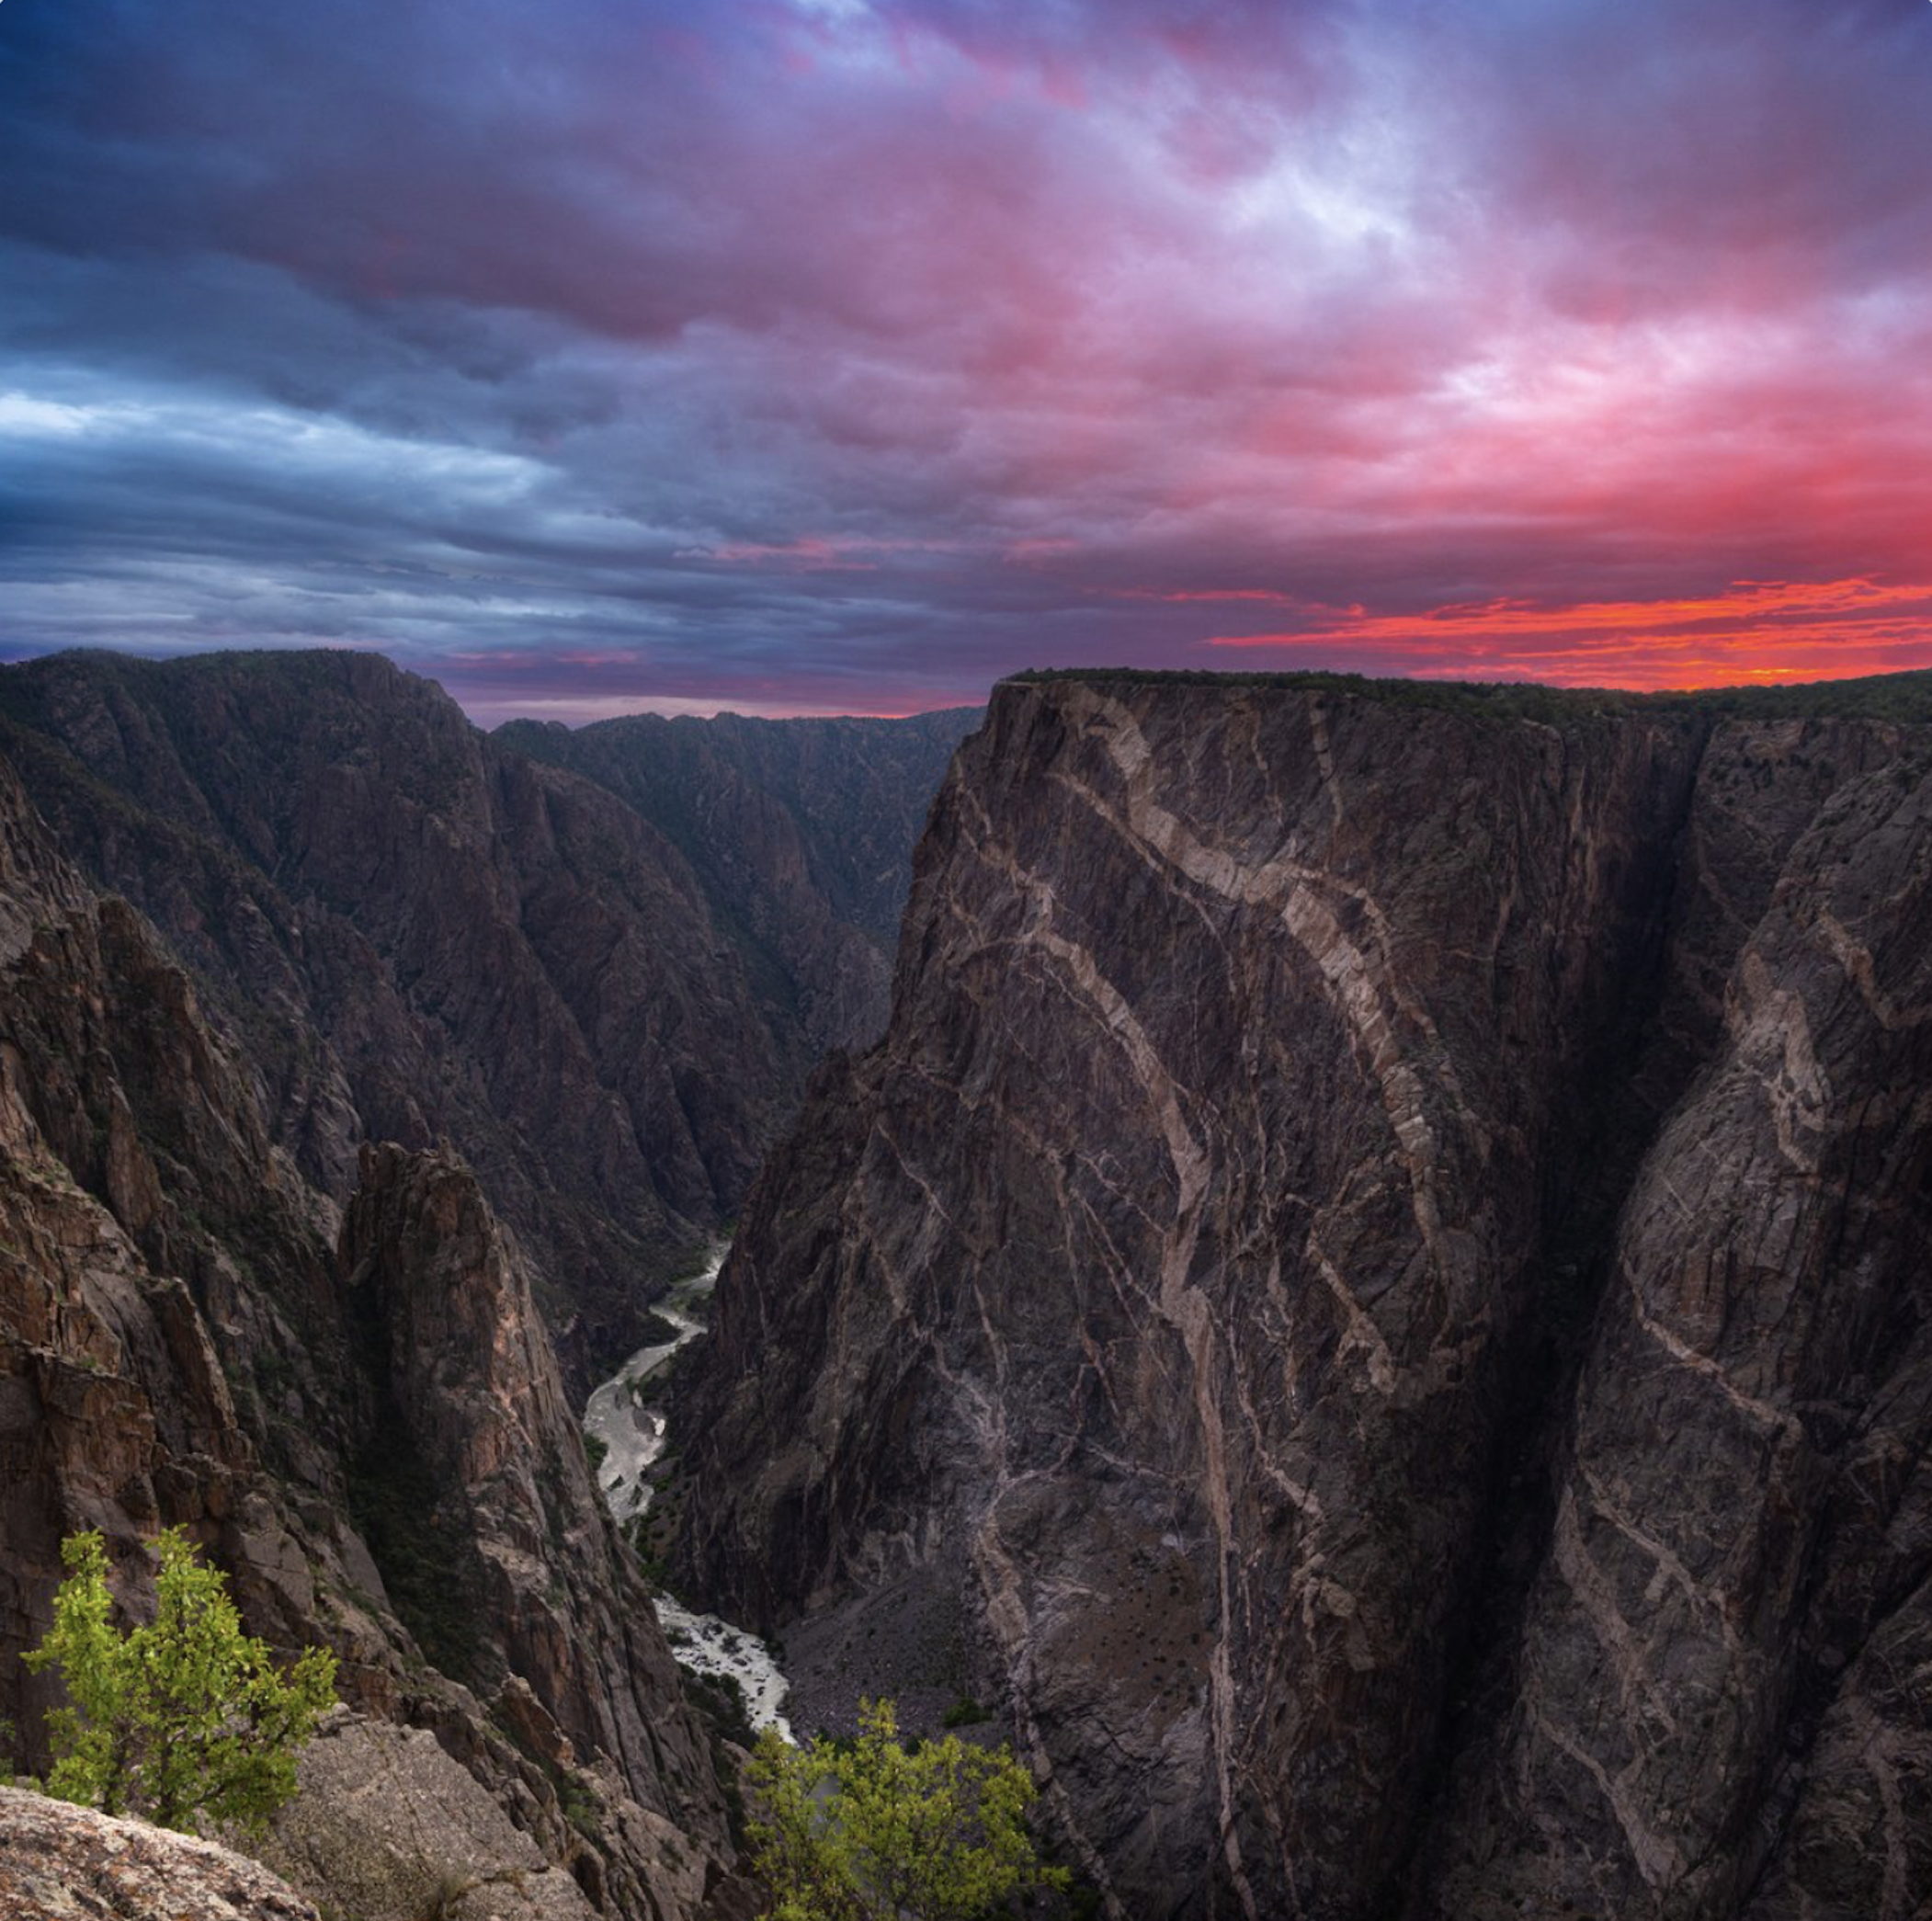
Black Canyon National Park July 2020. Photo credit: Claire Codling/The Department of Interior
From email from Reclamation (Erik Knight):
Releases from the Aspinall Unit will be decreased from 1675 cfs to 1610 cfs on Saturday, August 7th. Releases are being decreased to bring flows in the lower Gunnison River closer to the baseflow target while still providing the additional release volume under the emergency provision of the Drought Response Operations Agreement (DROA). The April-July runoff volume for Blue Mesa Reservoir came in at 47% of average.
Flows in the lower Gunnison River are currently above the baseflow target of 890 cfs. River flows are expected to stay at levels above the baseflow target for the foreseeable future.
Pursuant to the Aspinall Unit Operations Record of Decision (ROD), the baseflow target in the lower Gunnison River, as measured at the Whitewater gage, is 890 cfs for August and September.
Currently, Gunnison Tunnel diversions are 1040 cfs and flows in the Gunnison River through the Black Canyon are around 660 cfs. After this release change Gunnison Tunnel diversions will still be around 1040 cfs and flows in the Gunnison River through the Black Canyon will be near 600 cfs. Current flow information is obtained from provisional data that may undergo revision subsequent to review.
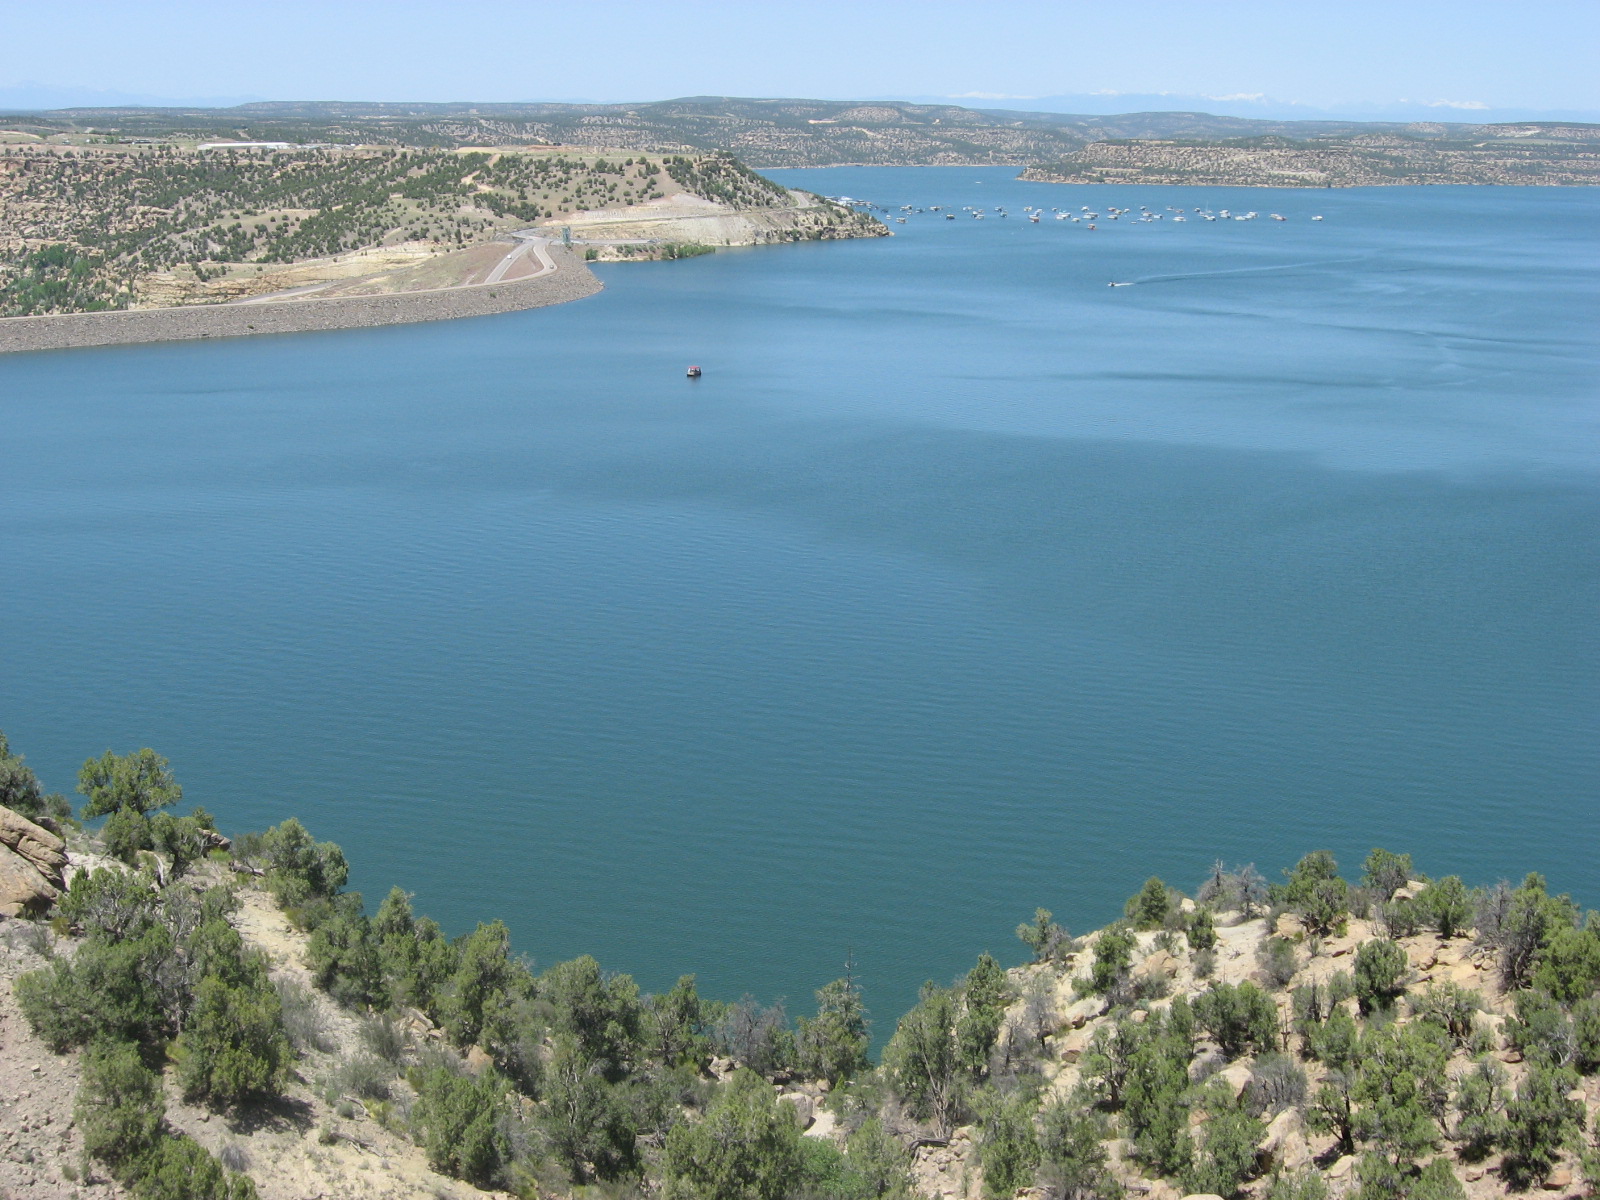
Navajo Reservoir, New Mexico, back in the day.. View looking north toward marina. The Navajo Dam can be seen on the left of the image. By Timthefinn at English Wikipedia – Transferred from en.wikipedia to Commons., Public Domain, https://commons.wikimedia.org/w/index.php?curid=4040102
From email from Reclamation (Susan Novak Behery):
In response to decreasing flows in the critical habitat reach, the Bureau of Reclamation has scheduled an increase in the release from Navajo Dam from 500 cubic feet per second (cfs) to 700 cfs today, Saturday, August 7th, starting at 4:00 PM. Releases are made for the authorized purposes of the Navajo Unit, and to attempt to maintain a target base flow through the endangered fish critical habitat reach of the San Juan River (Farmington to Lake Powell).
The San Juan River Basin Recovery Implementation Program recommends a target base flow of between 500 cfs and 1,000 cfs through the critical habitat area. The target base flow is calculated as the weekly average of gaged flows throughout the critical habitat area from Farmington to Lake Powell.
The Covid-19 pandemic resulted in the largest-ever decline in global emissions
The Covid-19 pandemic and resulting economic crisis had an impact on almost every aspect of how energy is produced, supplied, and consumed around the world. The pandemic defined energy and emissions trends in 2020 – it drove down fossil fuel consumption for much of the year, whereas renewables and electric vehicles, two of the main building blocks of clean energy transitions, were largely immune.
As primary energy demand dropped nearly 4% in 2020, global energy-related CO2 emissions fell by 5.8% according to the latest statistical data, the largest annual percentage decline since World War II. In absolute terms, the decline in emissions of almost 2 000 million tonnes of CO2 is without precedent in human history – broadly speaking, this is the equivalent of removing all of the European Union’s emissions from the global total. Demand for fossil fuels was hardest hit in 2020 – especially oil, which plunged 8.6%, and coal, which dropped by 4%. Oil’s annual decline was its largest ever, accounting for more than half of the drop in global emissions. Global emissions from oil use plummeted by well over 1 100 Mt CO2, down from around 11 400 Mt in 2019. The drop in road transport activity accounted for 50% of the decline in global oil demand, and the slump in the aviation sector for around 35%. Meanwhile, low-carbon fuels and technologies, in particular, solar PV and wind, reached their highest ever annual share of the global energy mix, increasing it by more than one percentage point to over 20%.
Transport sees the biggest decline
A common theme across all economies is the scale of the impact of the pandemic and lockdown measures on transport activity. The decline in CO2 emissions from oil use in the transport sector accounted for well over 50% of the total global drop in CO2 emissions in 2020, with restrictions on movement at local and international levels leading to a near 1 100 Mt drop in emissions from the sector, down almost 14% from 2019 levels. With various travel advisories and border restrictions, international aviation was the sector hardest hit in 2020, with global flight activity reaching a low in April 2020 of 70% below the level in the same month a year earlier. In contrast to pre-crisis levels, emissions from international aviation fell by almost 45% or 265 Mt CO2 across the year to a level last seen in 1999. This decline is equivalent to taking around 100 million conventional cars off the road.
Road transport was also severely affected, with its demand for oil dropping 10% relative to 2019. The impact of the pandemic on global car sales was even greater: these fell by close to 15%. Electric cars bucked this trend, however, with their sales growing by more than 40% in 2020 to over 3 million, largely driven by policy support in the European Union and stimulus measures in the People’s Republic of China (“China”). This is an encouraging sign for clean energy transitions globally, although emissions growth last year from the continued shift towards larger vehicles such as SUVs offset the decrease in emissions from higher electric car sales.
With transport typically accounting for around 60% of oil demand, and the drop in oil demand contributing the largest share to the decline in 2020 emissions, the recovery of global transport activity is an important bellwether for the rebound in global oil demand and in global CO2 emissions. In emerging economies, the recovery of road transport activity through the second half of 2020 was one of the principal drivers of the rebound in emissions. In advanced economies, road transport activity remained suppressed through the second half of 2020 relative to 2019 levels.
Power sector decarbonisation accelerates
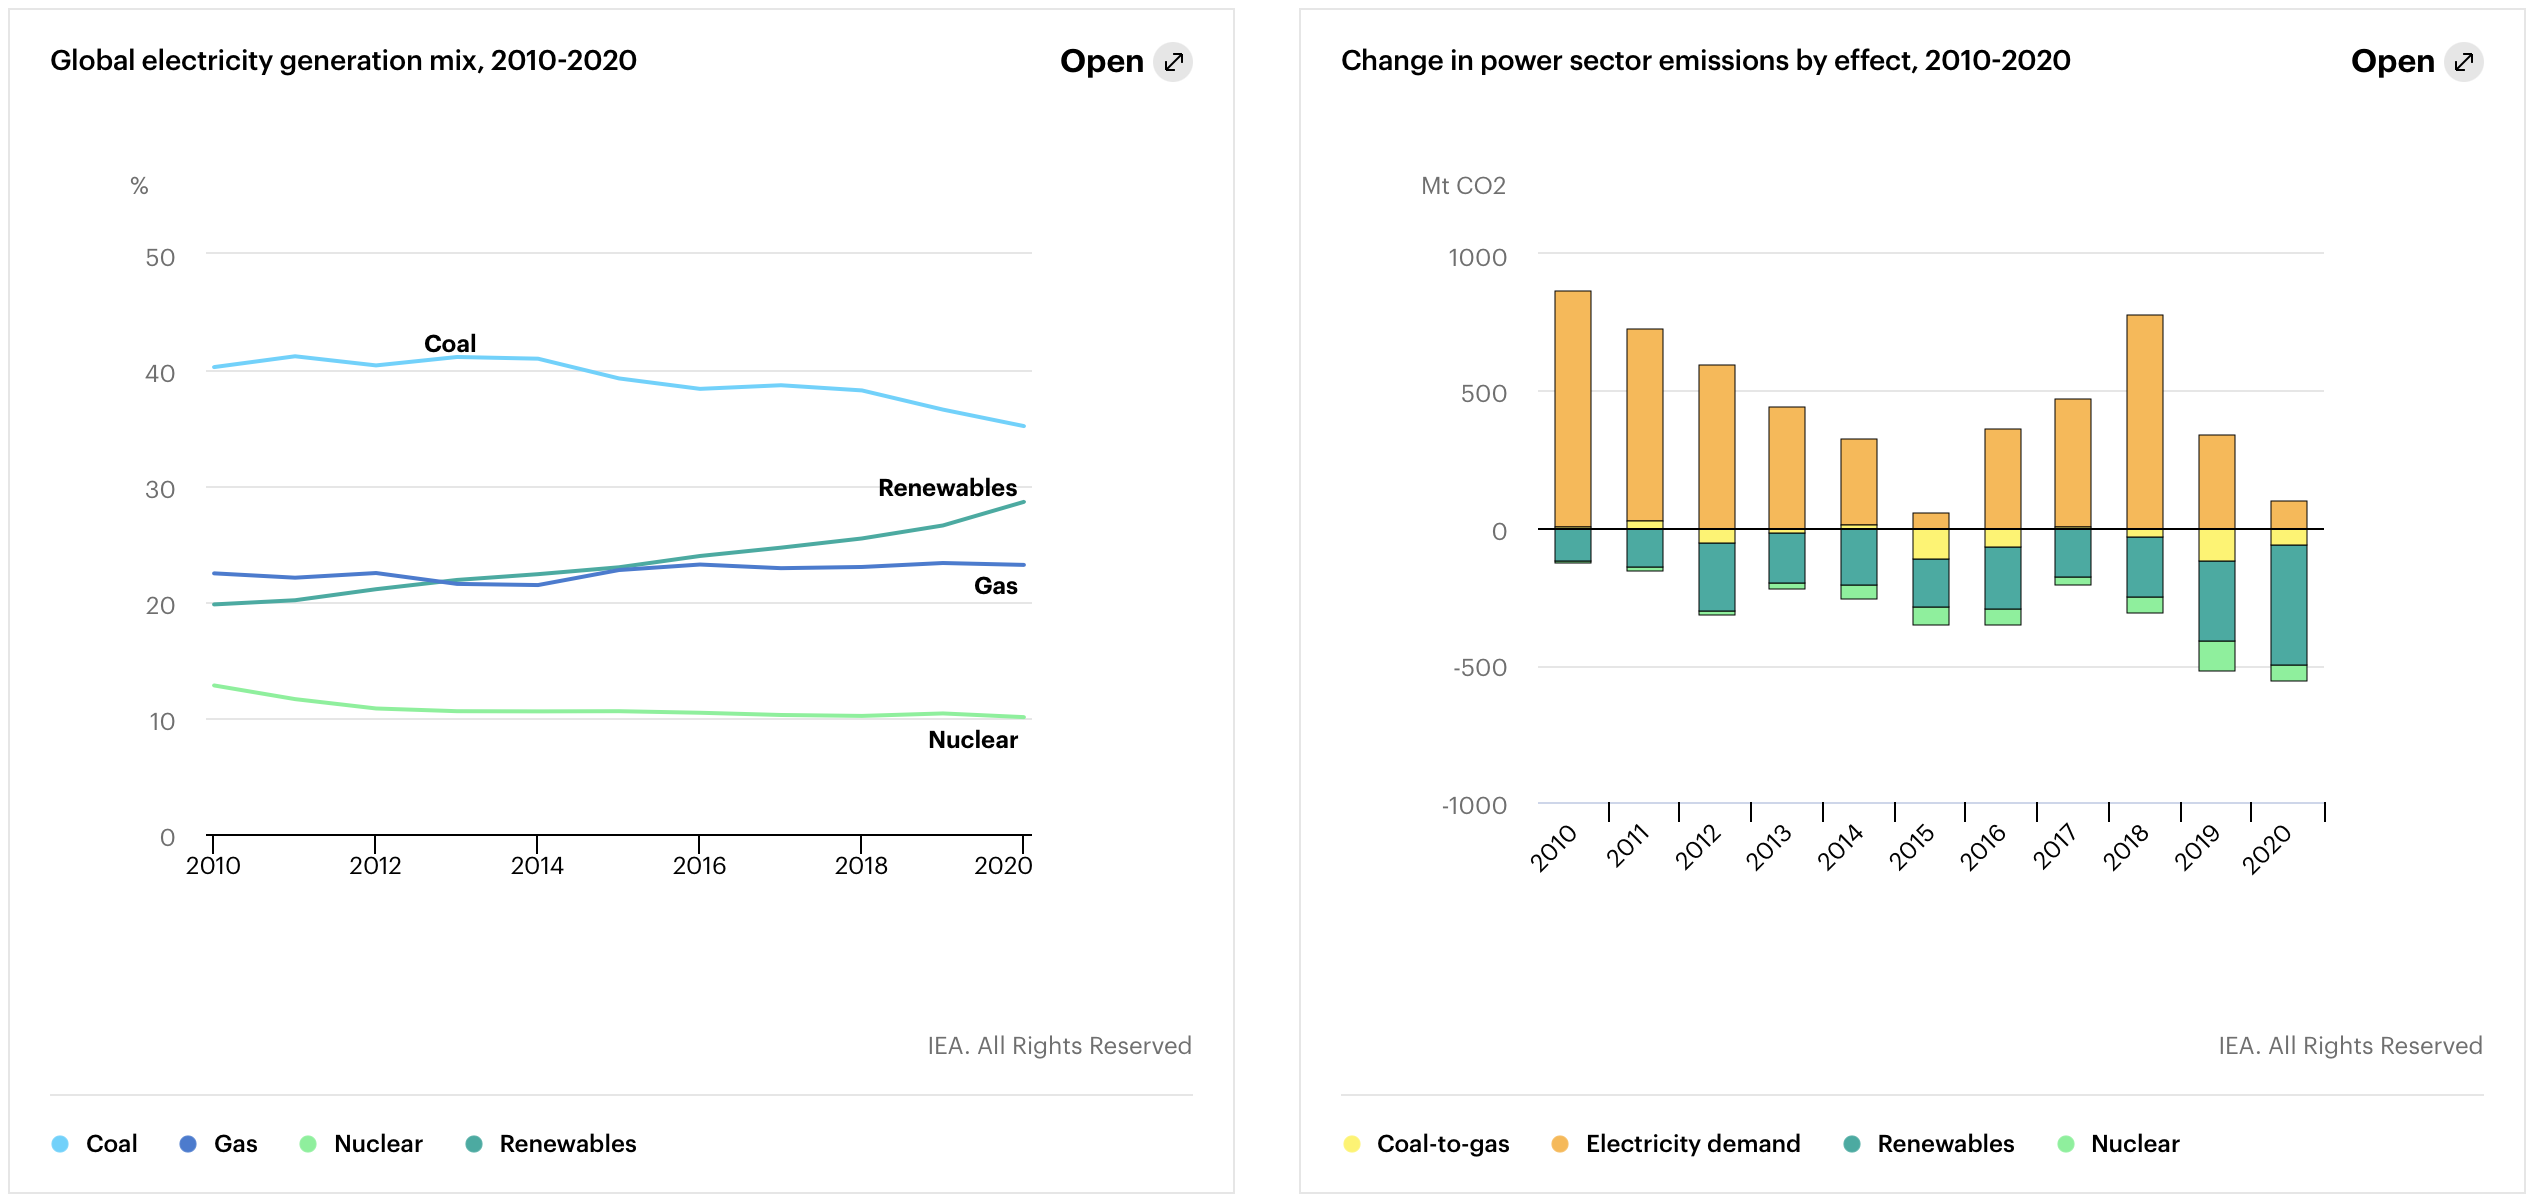
In the power sector, CO2 emissions declined by 3.3% (or 450 Mt) in 2020, the largest relative and absolute fall on record. While the pandemic reduced electricity demand last year, the accelerating expansion of power generation from renewables was the biggest contributor to lower emissions from the sector. The share of renewables in global electricity generation rose from 27% in 2019 to 29% in 2020, the biggest annual increase on record. Over the last ten years, the rise of renewables in the power sector has been having a growing impact on that sector’s emissions, with avoided carbon emissions growing by an average 10% each year. Despite the shock of the pandemic, renewables accelerated their expansion in 2020, with a 50% increase in their contribution to lowering power sector emissions relative to 2019.
Monthly data show a rapid recovery of economic activity and rebounding CO2 emissions
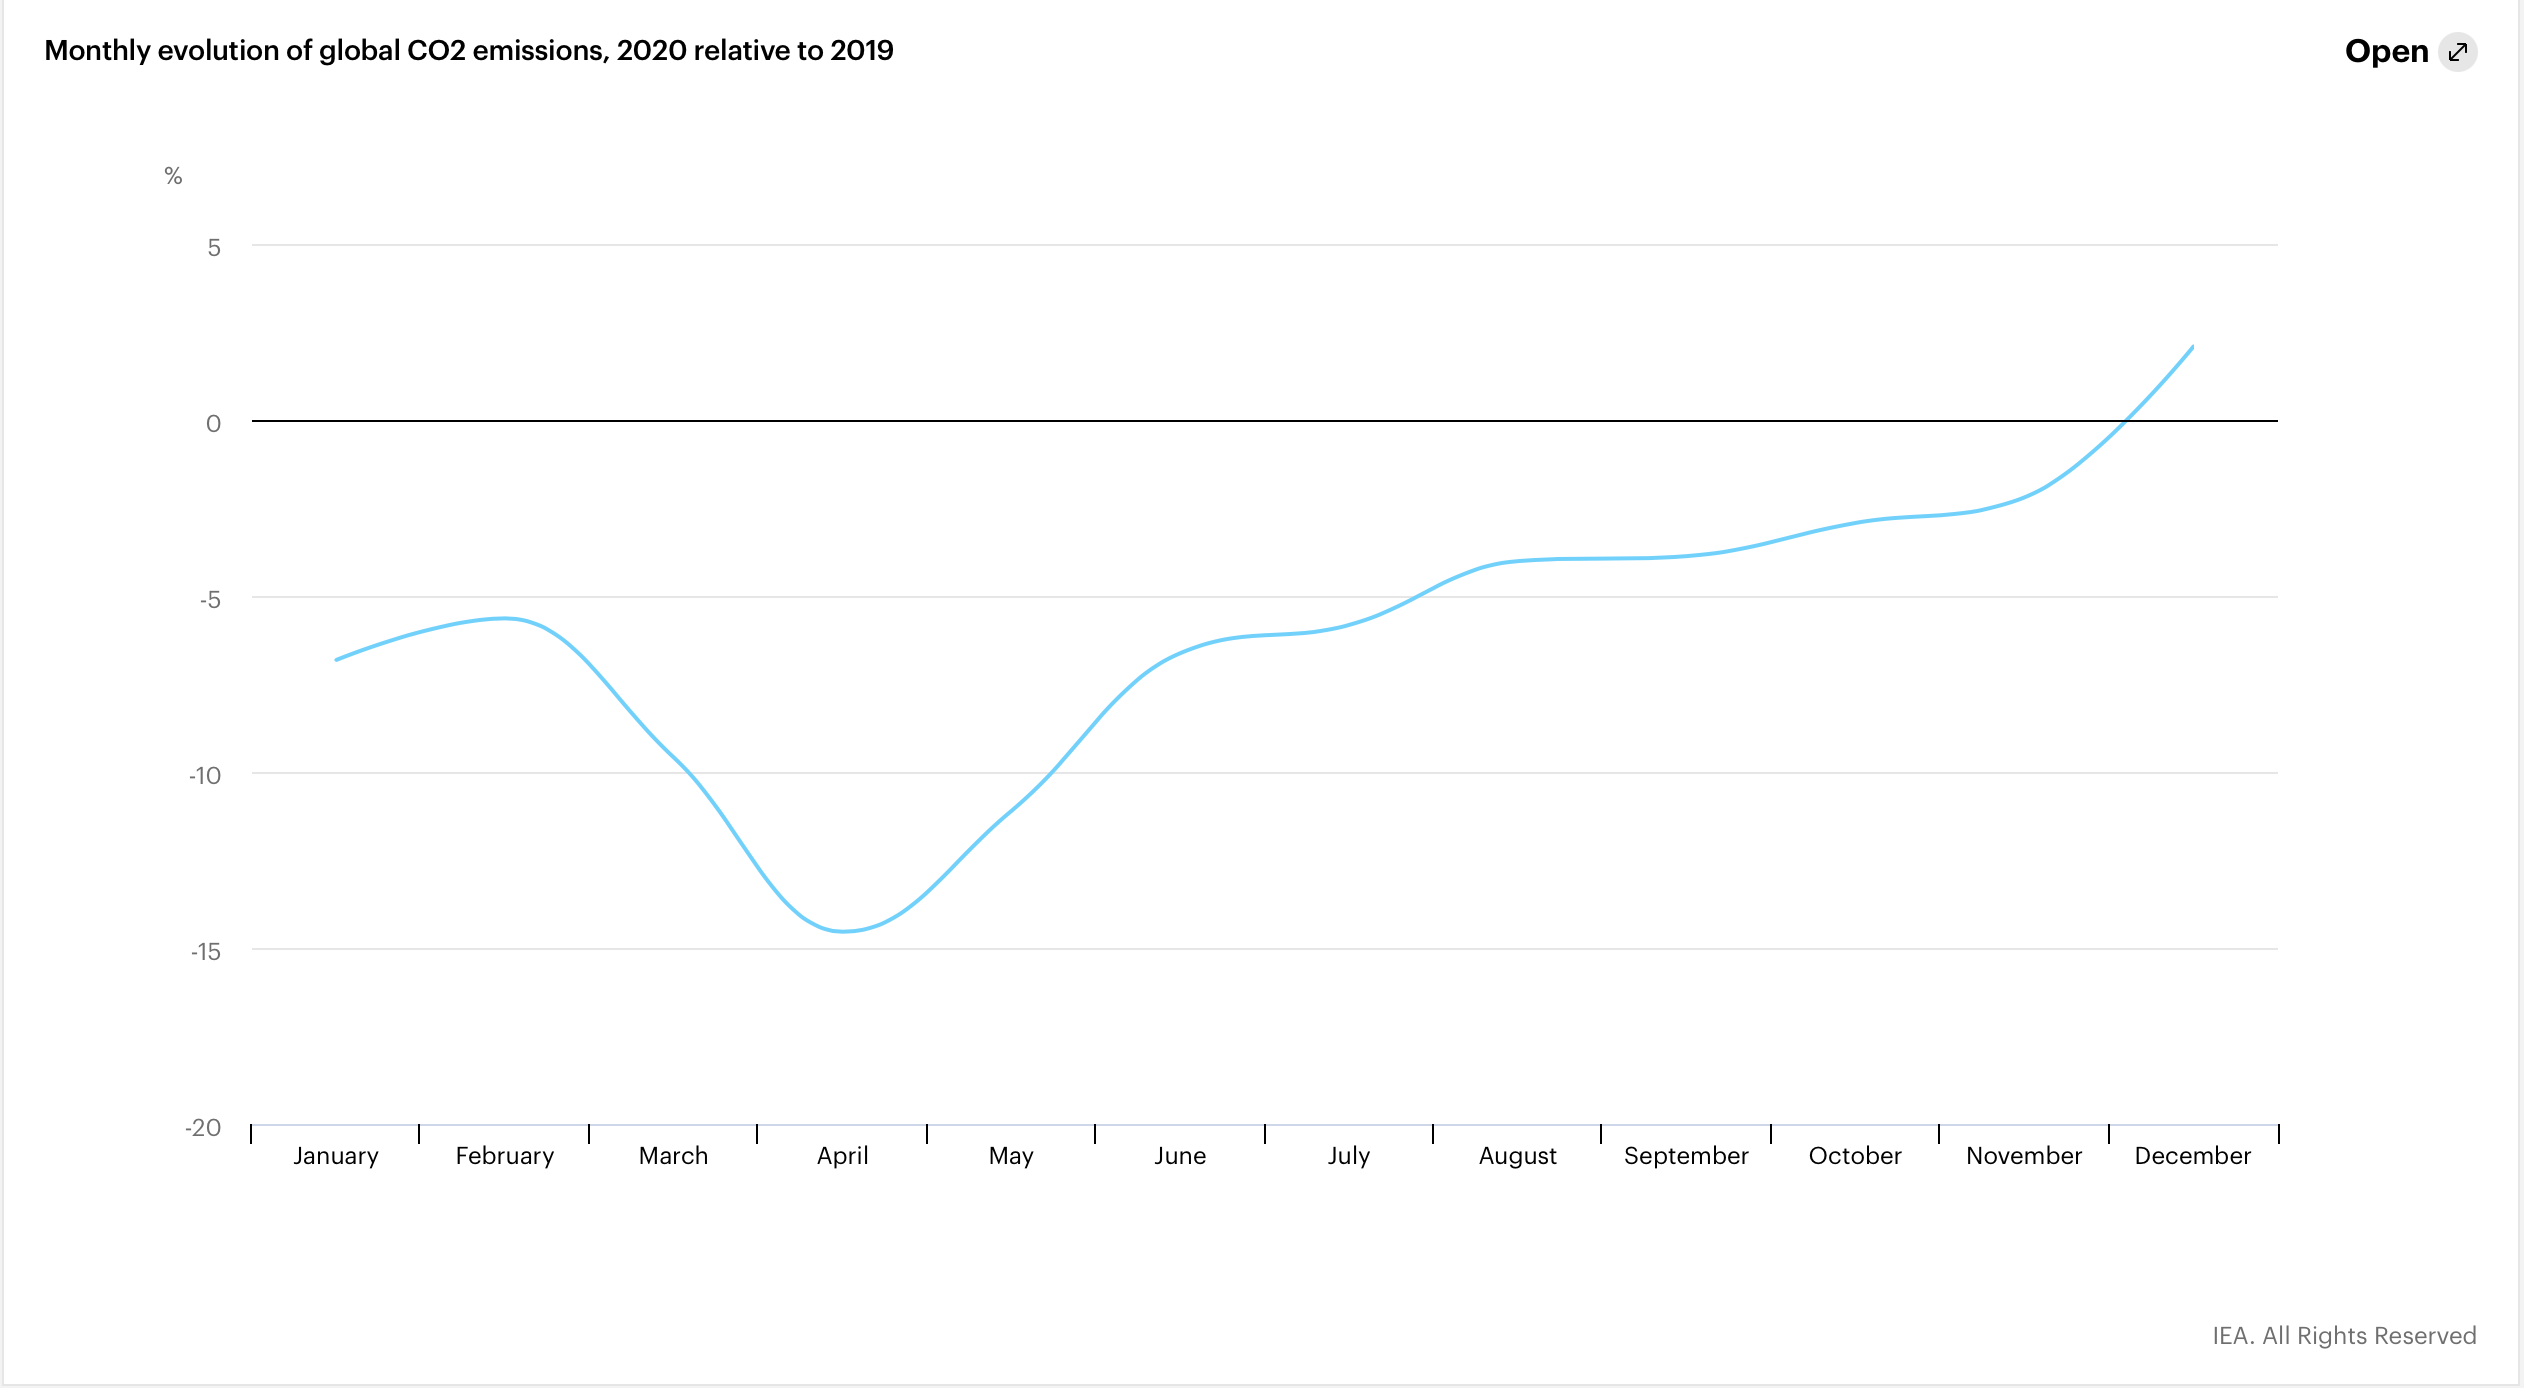
Last year, for the first time the IEA began to track energy demand and CO2 emissions trends on a monthly basis – and in some cases, in real-time. This provides a valuable tool for understanding the impacts of the pandemic on the energy sector. In January 2020, weather was the major driver of lower global CO2 emissions relative to 2019, with heating needs in major economies such as the United States, Germany, the United Kingdom and Russia 15% to 20% lower than in January 2019, due to milder-than-usual weather. The impact of the pandemic started to be felt in late February; and, by April, global emissions registered their largest monthly drop when a majority of advanced economies experienced various forms of restrictions on movement and travel. As the first wave of the pandemic was brought under control and economic activity increased towards the middle of the year, emissions increased. They continued to rebound through the rest of the year. In December 2020, global emissions were 2% higher than they were in the same month a year earlier.
Regional differences
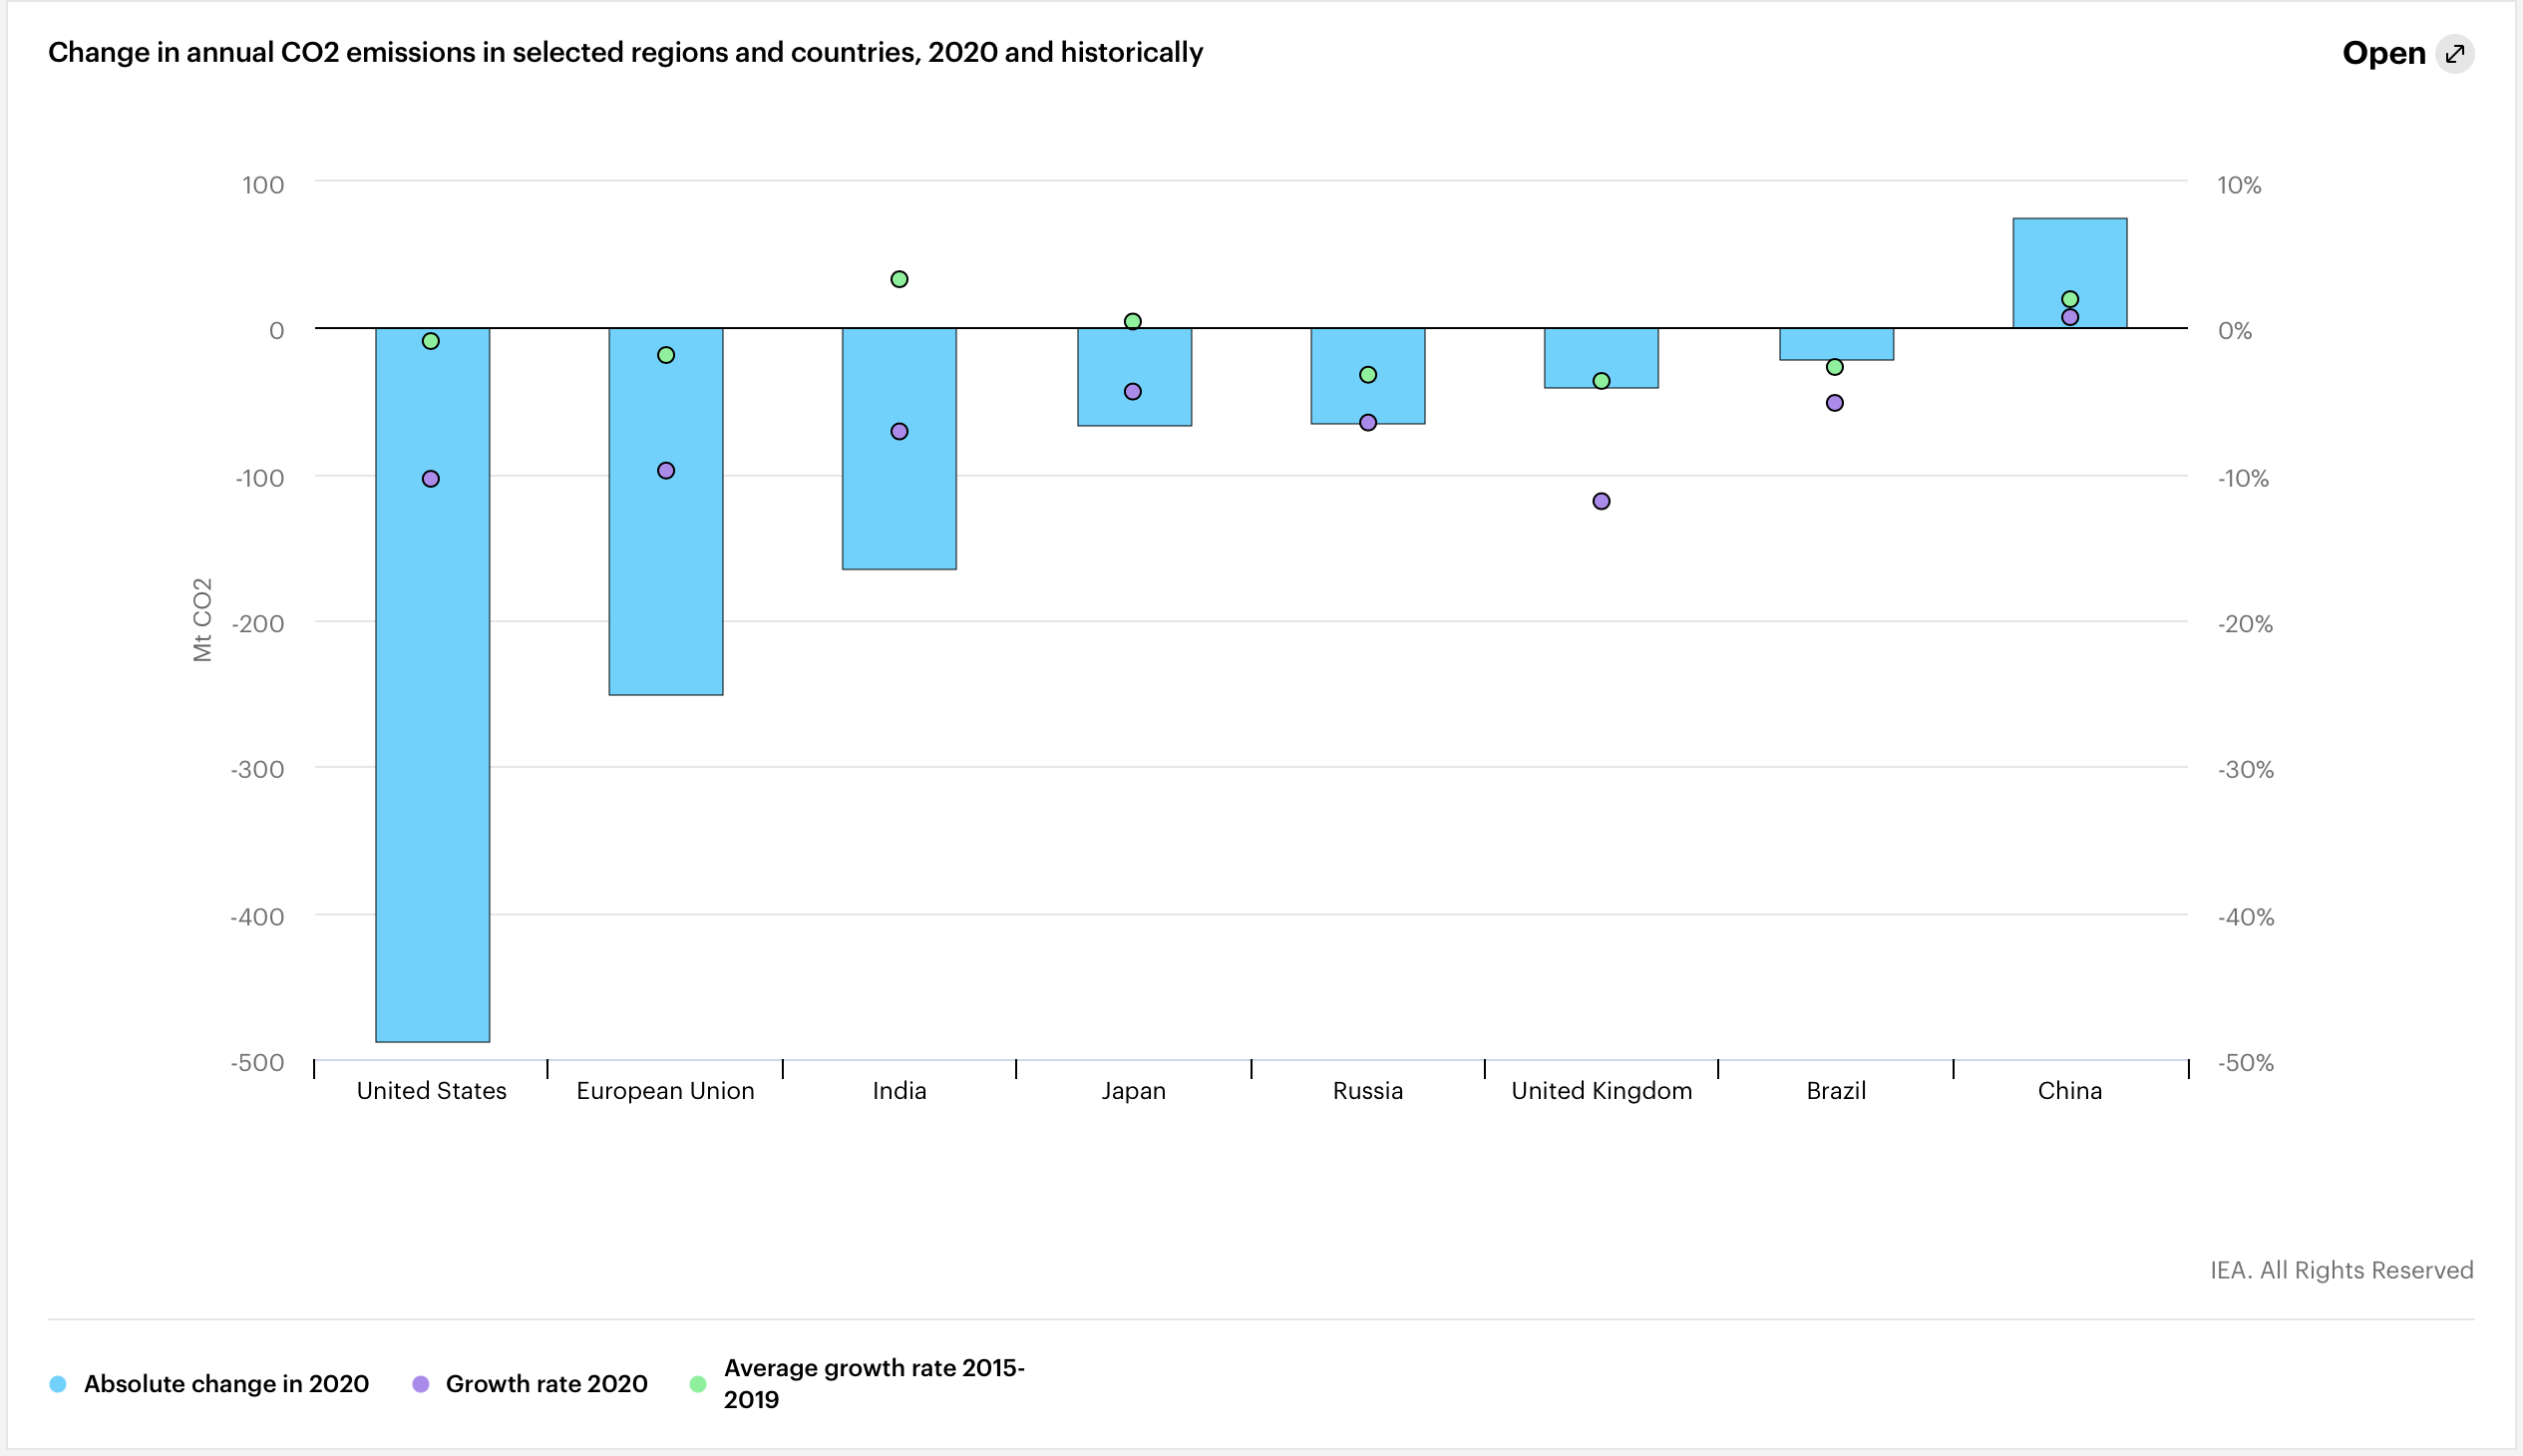
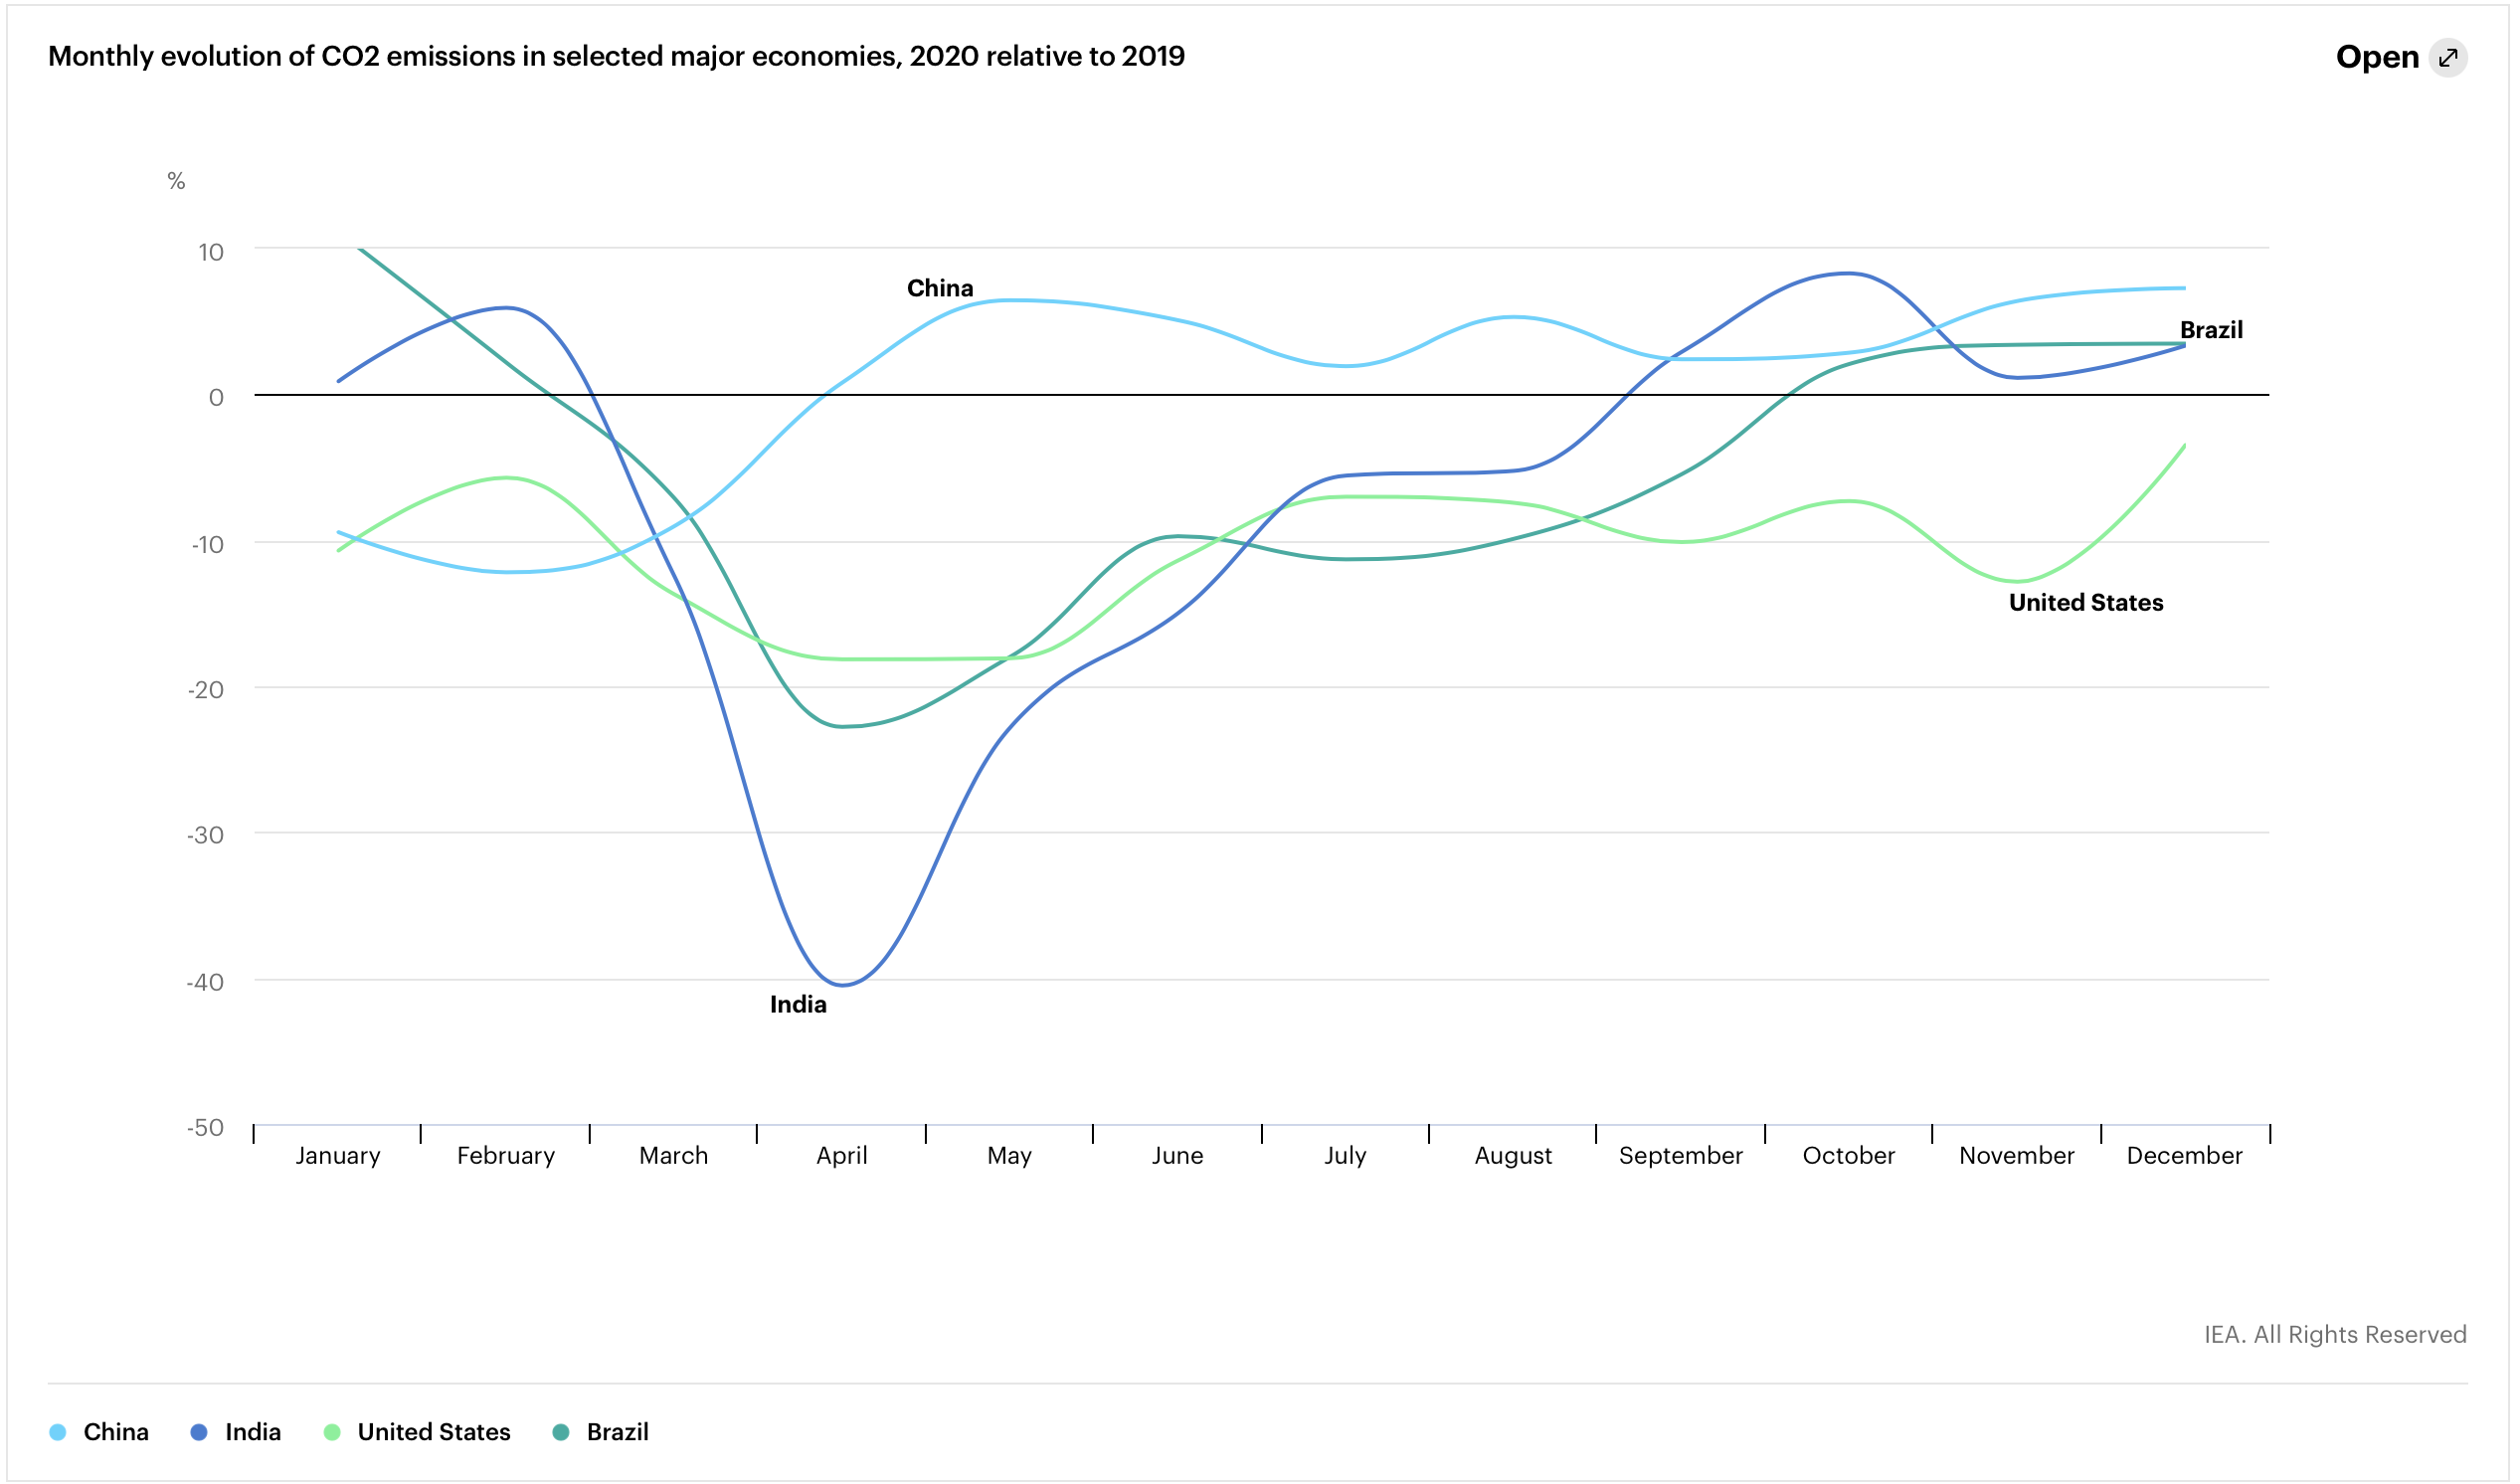
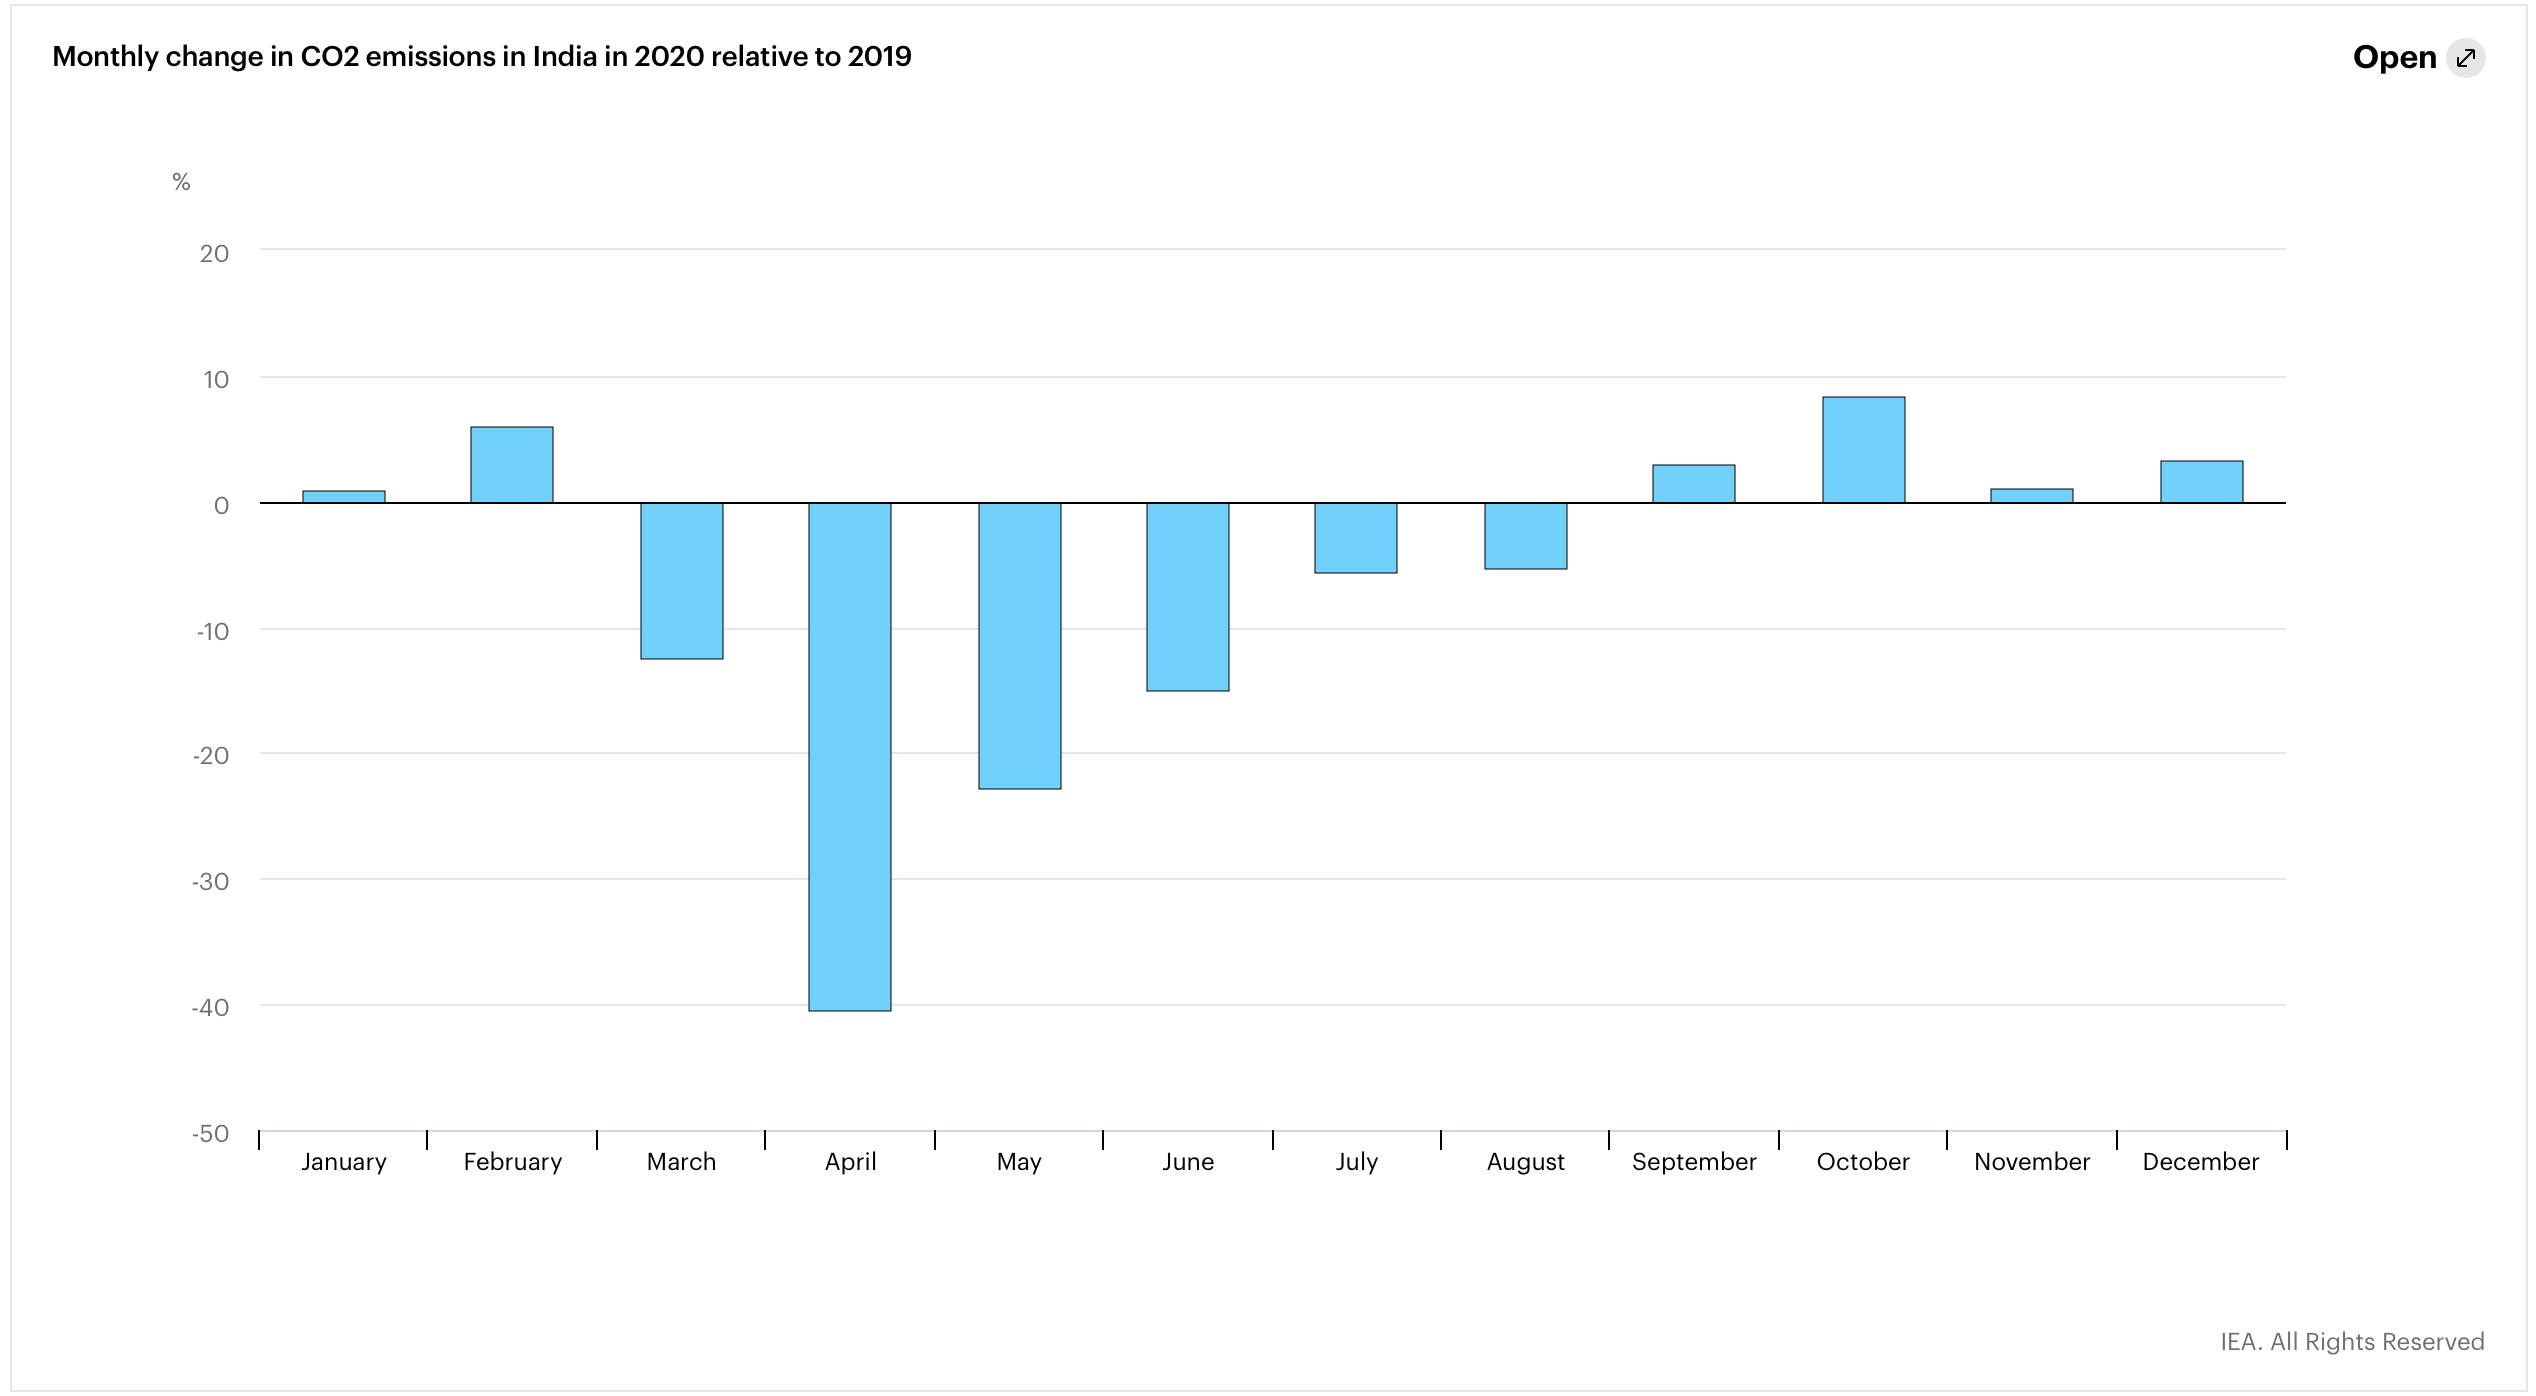
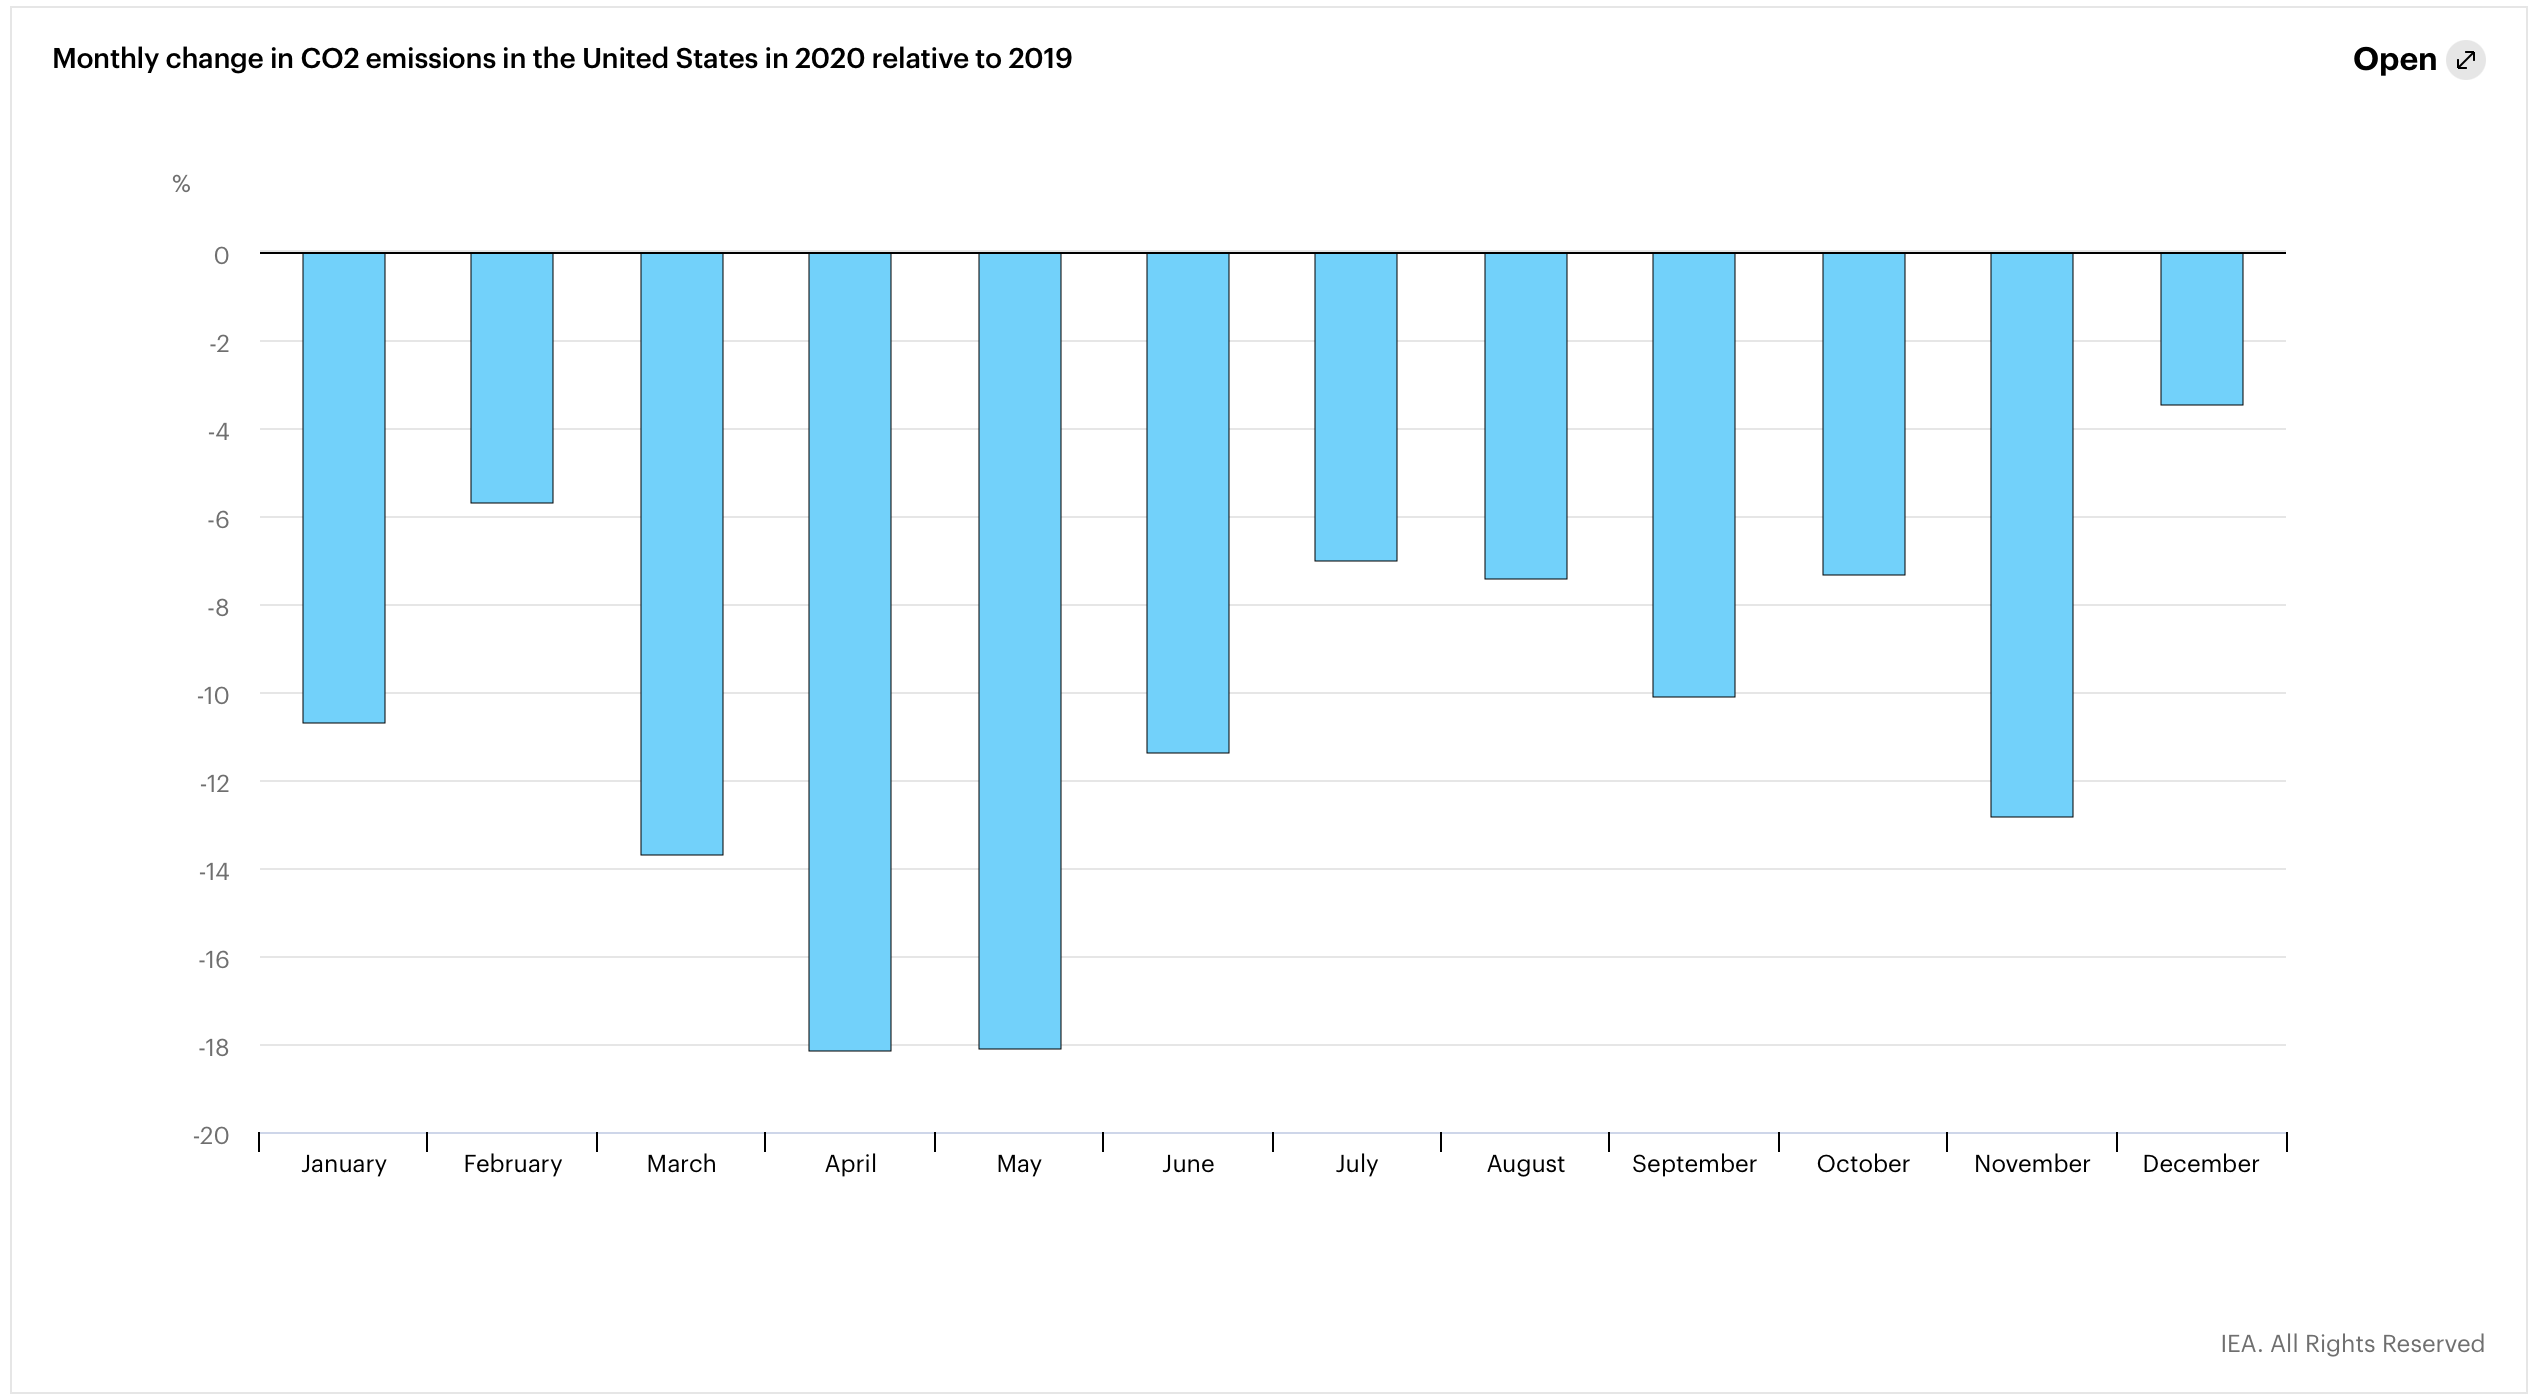
Major emitters underpinned the rebound of global CO2 emissions in 2020, as a pick-up in economic activity boosted energy demand, with many economies already seeing emissions above pre-COVID levels. China, the first major economy to emerge from the pandemic and lift restrictions, saw a 7% increase in emissions in December 2020 compared with a year earlier. Emissions in India rose above 2019 levels in September as the economic environment improved and restrictions were relaxed. Meanwhile, the Diwali holiday period in November 2020 (rather than October, as in the previous year), as well as strikes in the agricultural sector, temporarily lowered energy demand and emissions in November. In Brazil, the recovery of road transport activity in September drove a recovery in oil demand, while increases in gas demand in the later months of 2020 pushed emissions above 2019 levels. Emissions in the United States fell by 10% in 2020. But on a monthly basis, after hitting their lowest levels in April and May, they started to bounce back. In December, US emissions were approaching the level seen in the same month the year before, as greater economic activity and the combination higher natural gas prices and of colder weather favoured an increase in coal use.
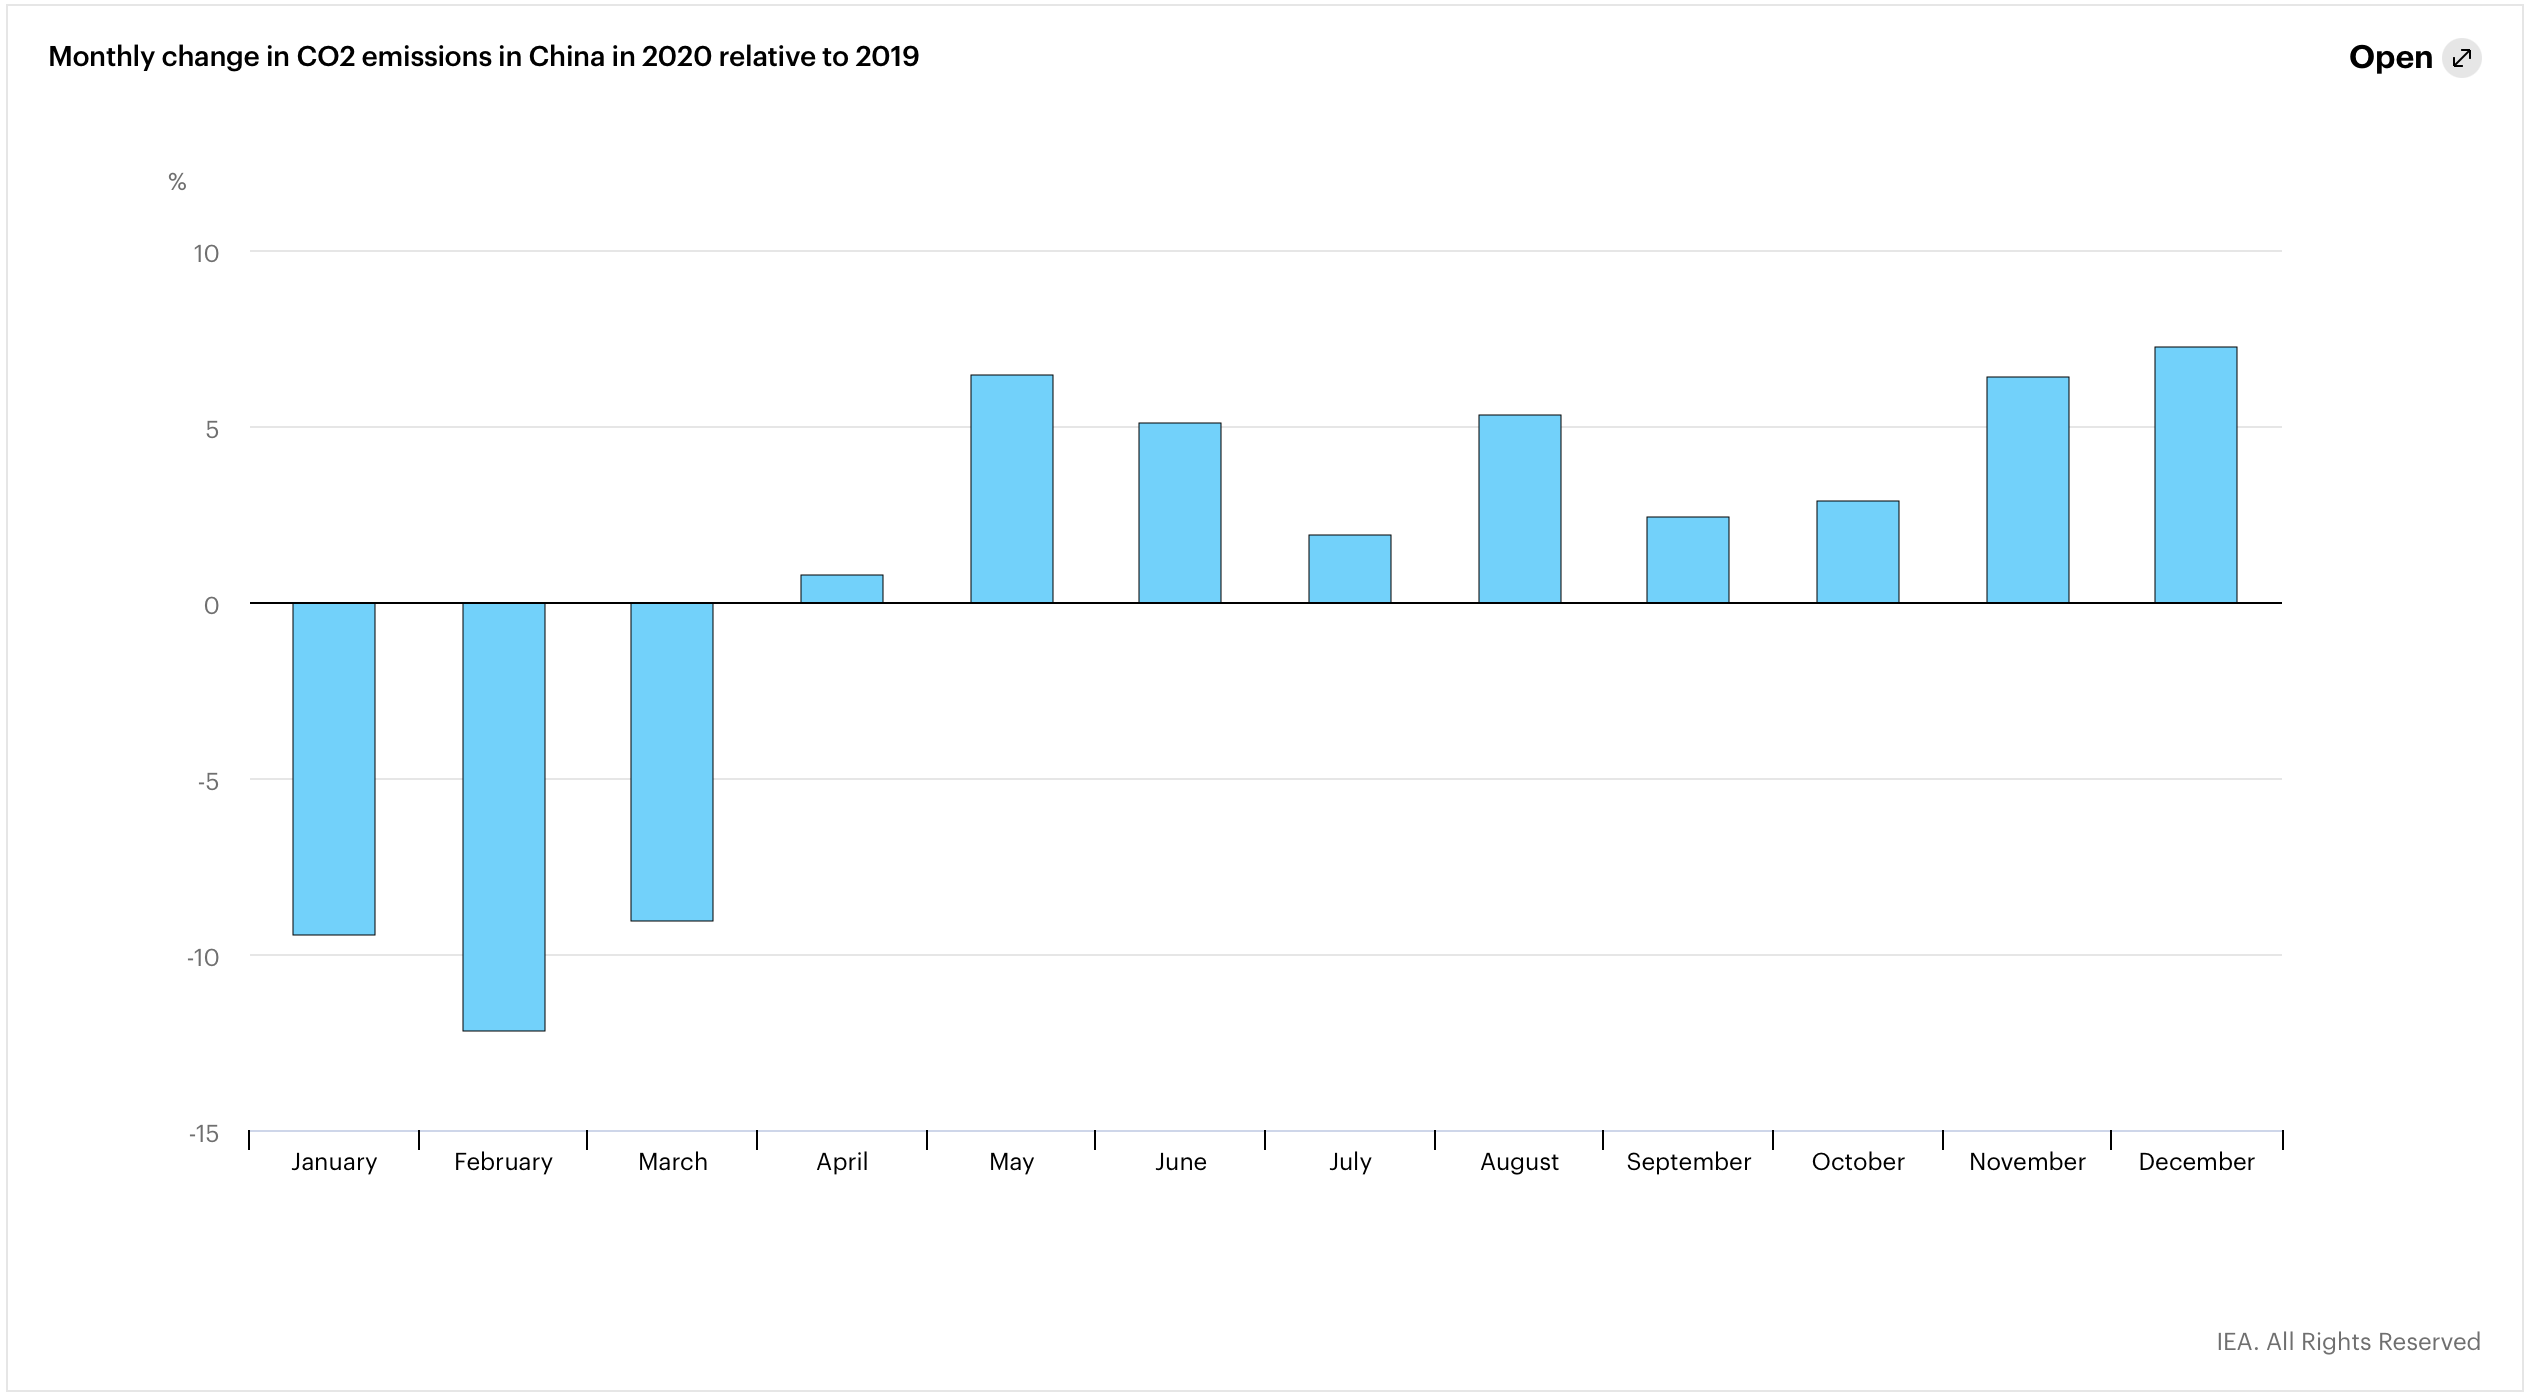
In China, the world’s largest CO2 emitter and the first country to be impacted by the Covid-19 pandemic, CO2 emissions dropped by 12% in February relative to the same month in 2019, as economic activity was curtailed. In April, China’s economic recovery lifted its monthly CO2 emissions above their 2019 level. For the remainder of the year, emissions in China were on average 5% higher than 2019 levels. The latest annual figures indicate that the country’s overall CO2 emissions in 2020 were 0.8% (or 75 Mt CO2) above the levels assessed at the end of 2019.
In India, annual CO2 emissions declined by 7% (or 160 Mt CO2) in 2020, a stark contrast with its average emissions growth of 3.3% from 2015 to 2019. With India’s almost 1.4 billion citizens in total lockdown during April 2020, emissions in that month fell by a staggering 40% compared with April 2019, the largest decline in a single month experienced by any major economy. Annual emissions from coal-fired power plants across India fell by 5% relative to 2019, adjusting to lower electricity demand while generation from renewables grew by close to 4%, increasing their share in the generation mix to 22%. With most industrial production and freight transport coming to a standstill during the lockdown, annual emissions from the transport and industry sectors both declined by close to 50 Mt CO2. This resulted in the lowest recorded levels of air pollution in recent years in many major Indian cities. In September, a rebound in economic activity saw energy demand in India return to 2019 levels, albeit a low bar given the economic slowdown towards the end of 2019.
The impact of the pandemic on advanced economies endured well beyond the initial lockdowns of March and April. Economic activity remained at lower levels for much of the second half of the year and dropped again in the final months of 2020 as new restrictions on movement were imposed in many countries. Nonetheless, the impact of a second wave of lockdowns on energy demand was lower than that of earlier lockdowns, and many advanced economies are already well on the way to seeing a recovery in their emissions.
In the United States, the lack of national lockdowns mitigated the impact of the enduring health crisis on overall energy use and emissions. Nonetheless, stay-at-home orders in several states and the economic crisis induced by the pandemic led overall annual CO2 emissions to decline by more than 10%, or almost 500 Mt CO2. Transport emissions fell the most, with a 14% decline as activity plummeted in April. Emissions in the United States have been on a declining trend in recent years, largely due to changes in the power sector. With a strong coal-to-gas shift as natural gas prices have moved towards historic lows, and the rapid growth of renewables, emissions from coal-fired power generation declined 27% from 2015 to 2019. This trend accelerated in 2020, with monthly inflation adjusted gas prices hitting an all-time low of USD 1.63 per million British thermal units in June at Henry Hub, and lower electricity demand driving emissions from coal generation down by a further 20%. However, coal demand would have fallen even further if not for the increase in gas prices in the second half of the year and the subsequent reversal of some coal-to-gas switching. This trend combined with colder temperatures to push up emissions in December.
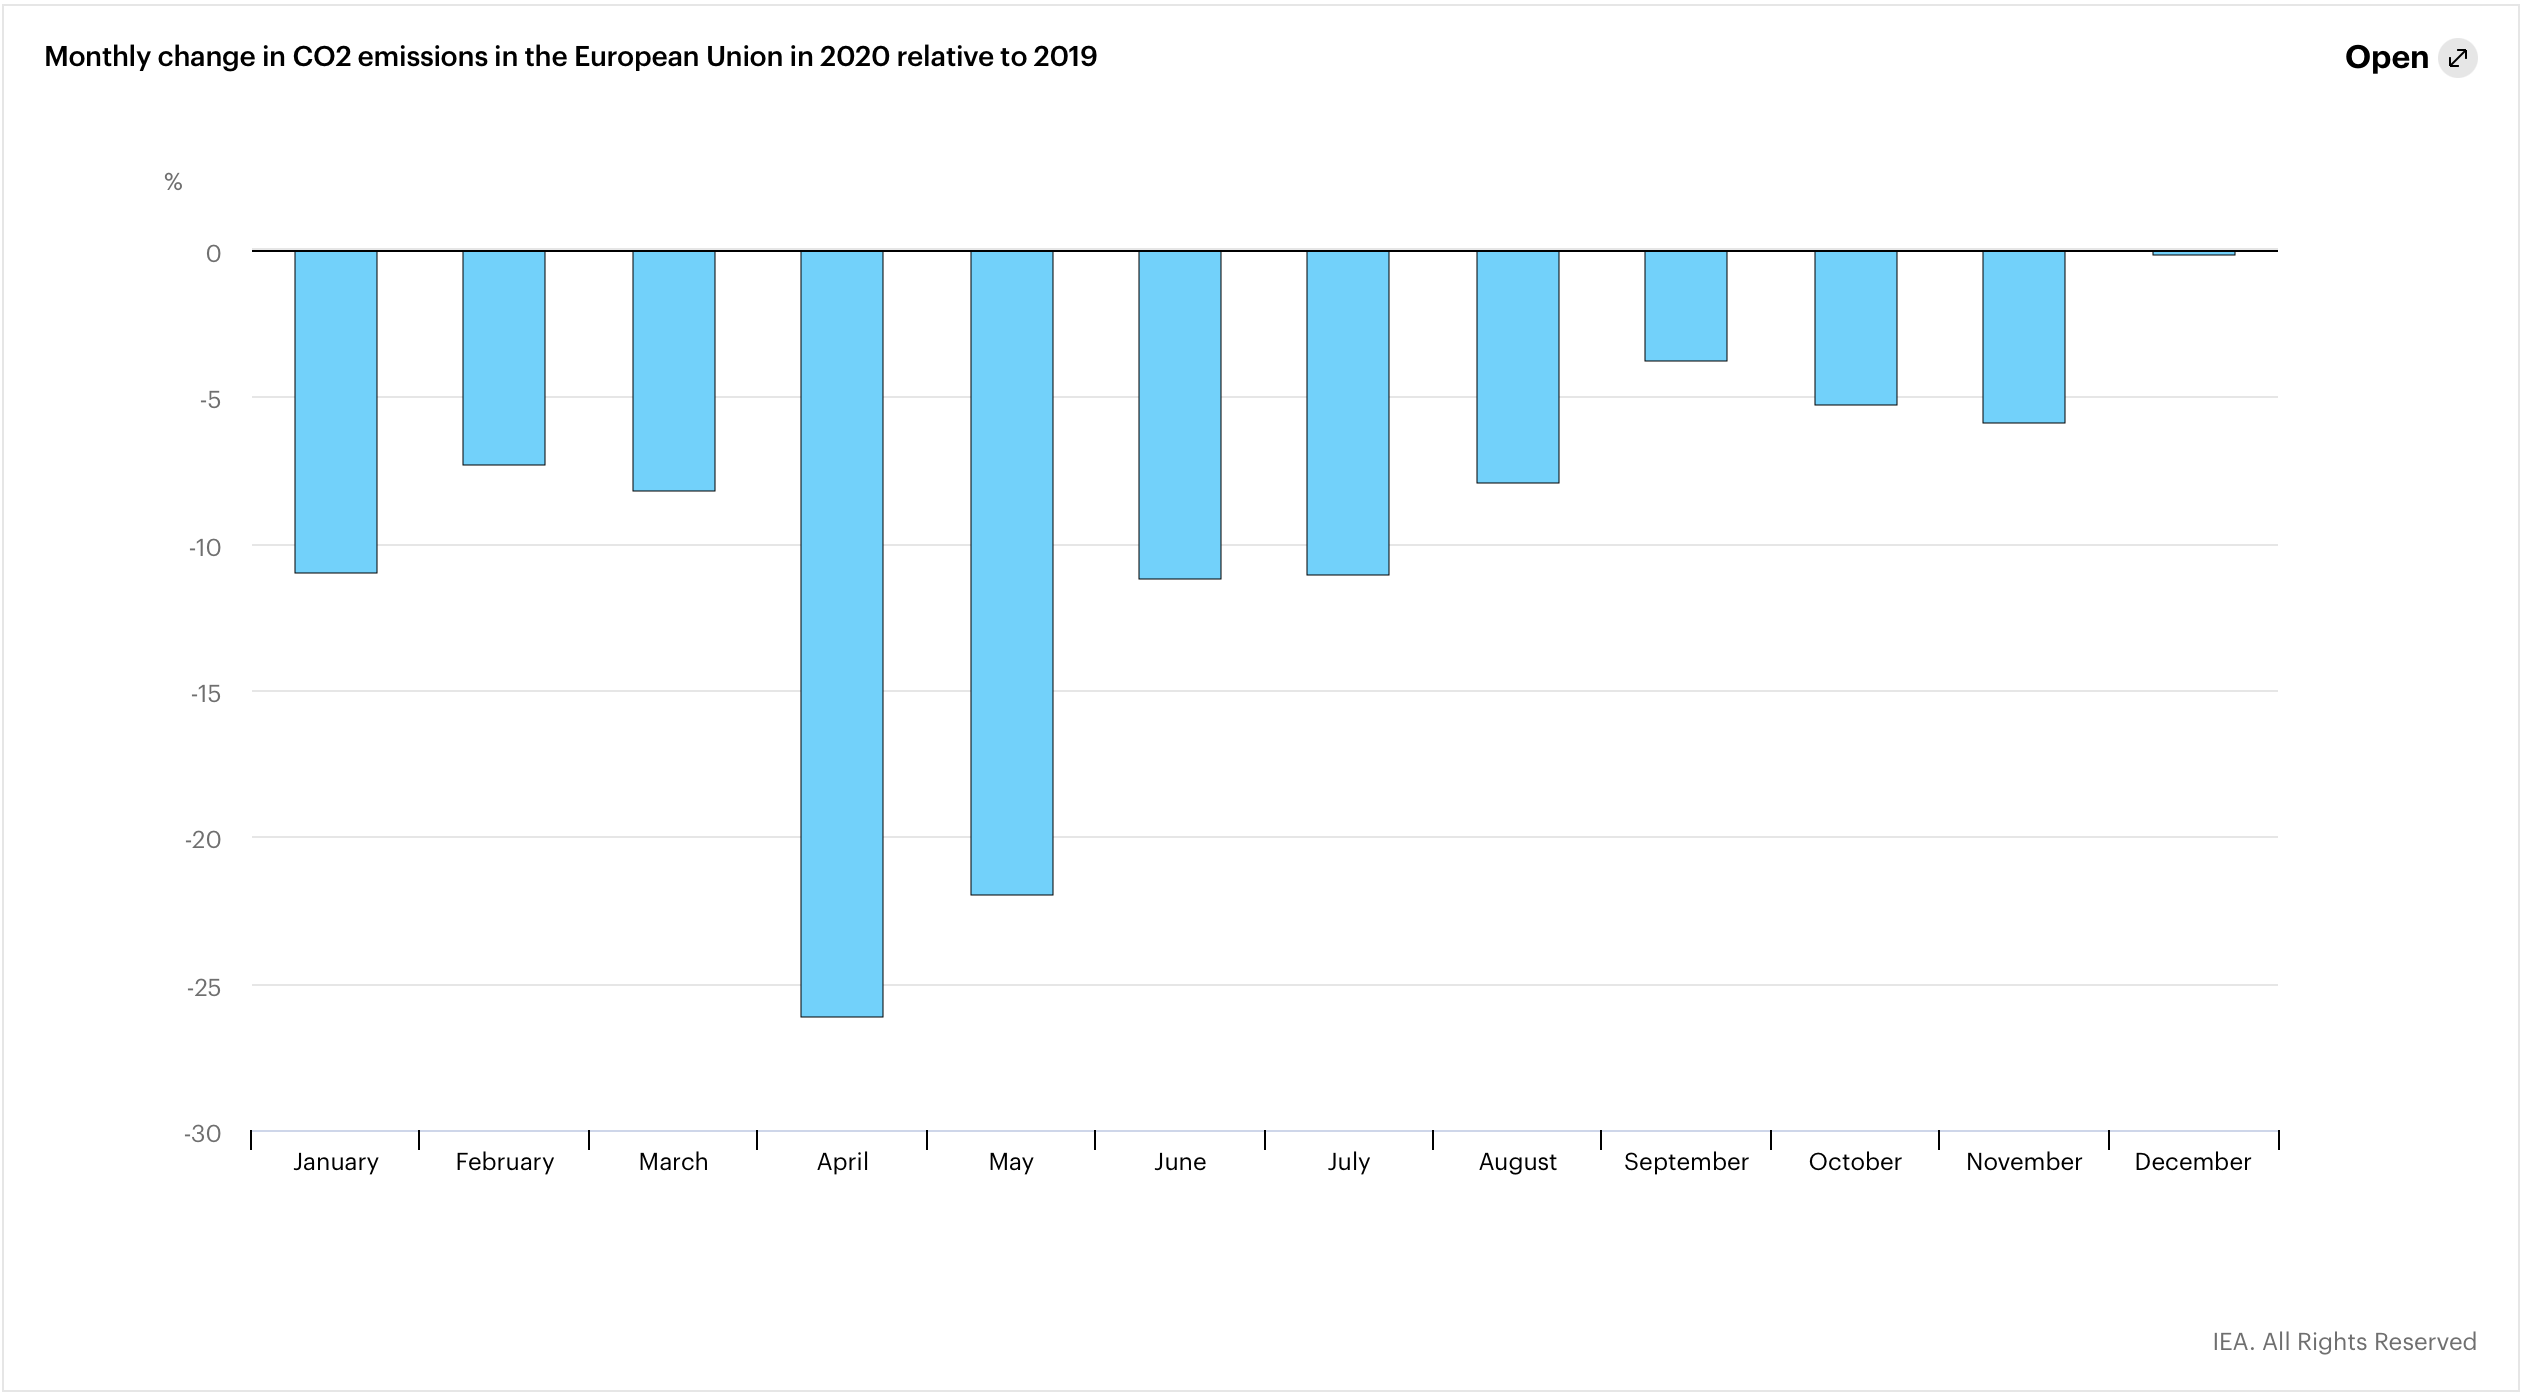
Across the European Union, a region that saw multiple restrictions and lockdowns being imposed in almost all member states, annual CO2 emissions fell by 10% relative to 2019. Lower electricity demand across the bloc and an 8% increase in output from renewables drove a more than 20% decline in coal-fired power generation. As a result, the share of renewables in electricity generation increased to a record 39% in 2020, four percentage points higher than in 2019. Transport oil demand fell by 12%, a consequence of strict lockdown measures and restrictions on intra-European movement. In Germany, overall energy-related CO2 emissions dropped by almost 9% in 2020, with generation from coal-fired power plants falling by over 20% due to lower electricity demand and higher output from wind and solar. In France, annual emissions were 11% lower than in 2019, with emissions from transport declining by almost 20 Mt CO2 and accounting for 60% of the total reduction in France’s emissions as a result of the two nationwide lockdowns in the spring and autumn.
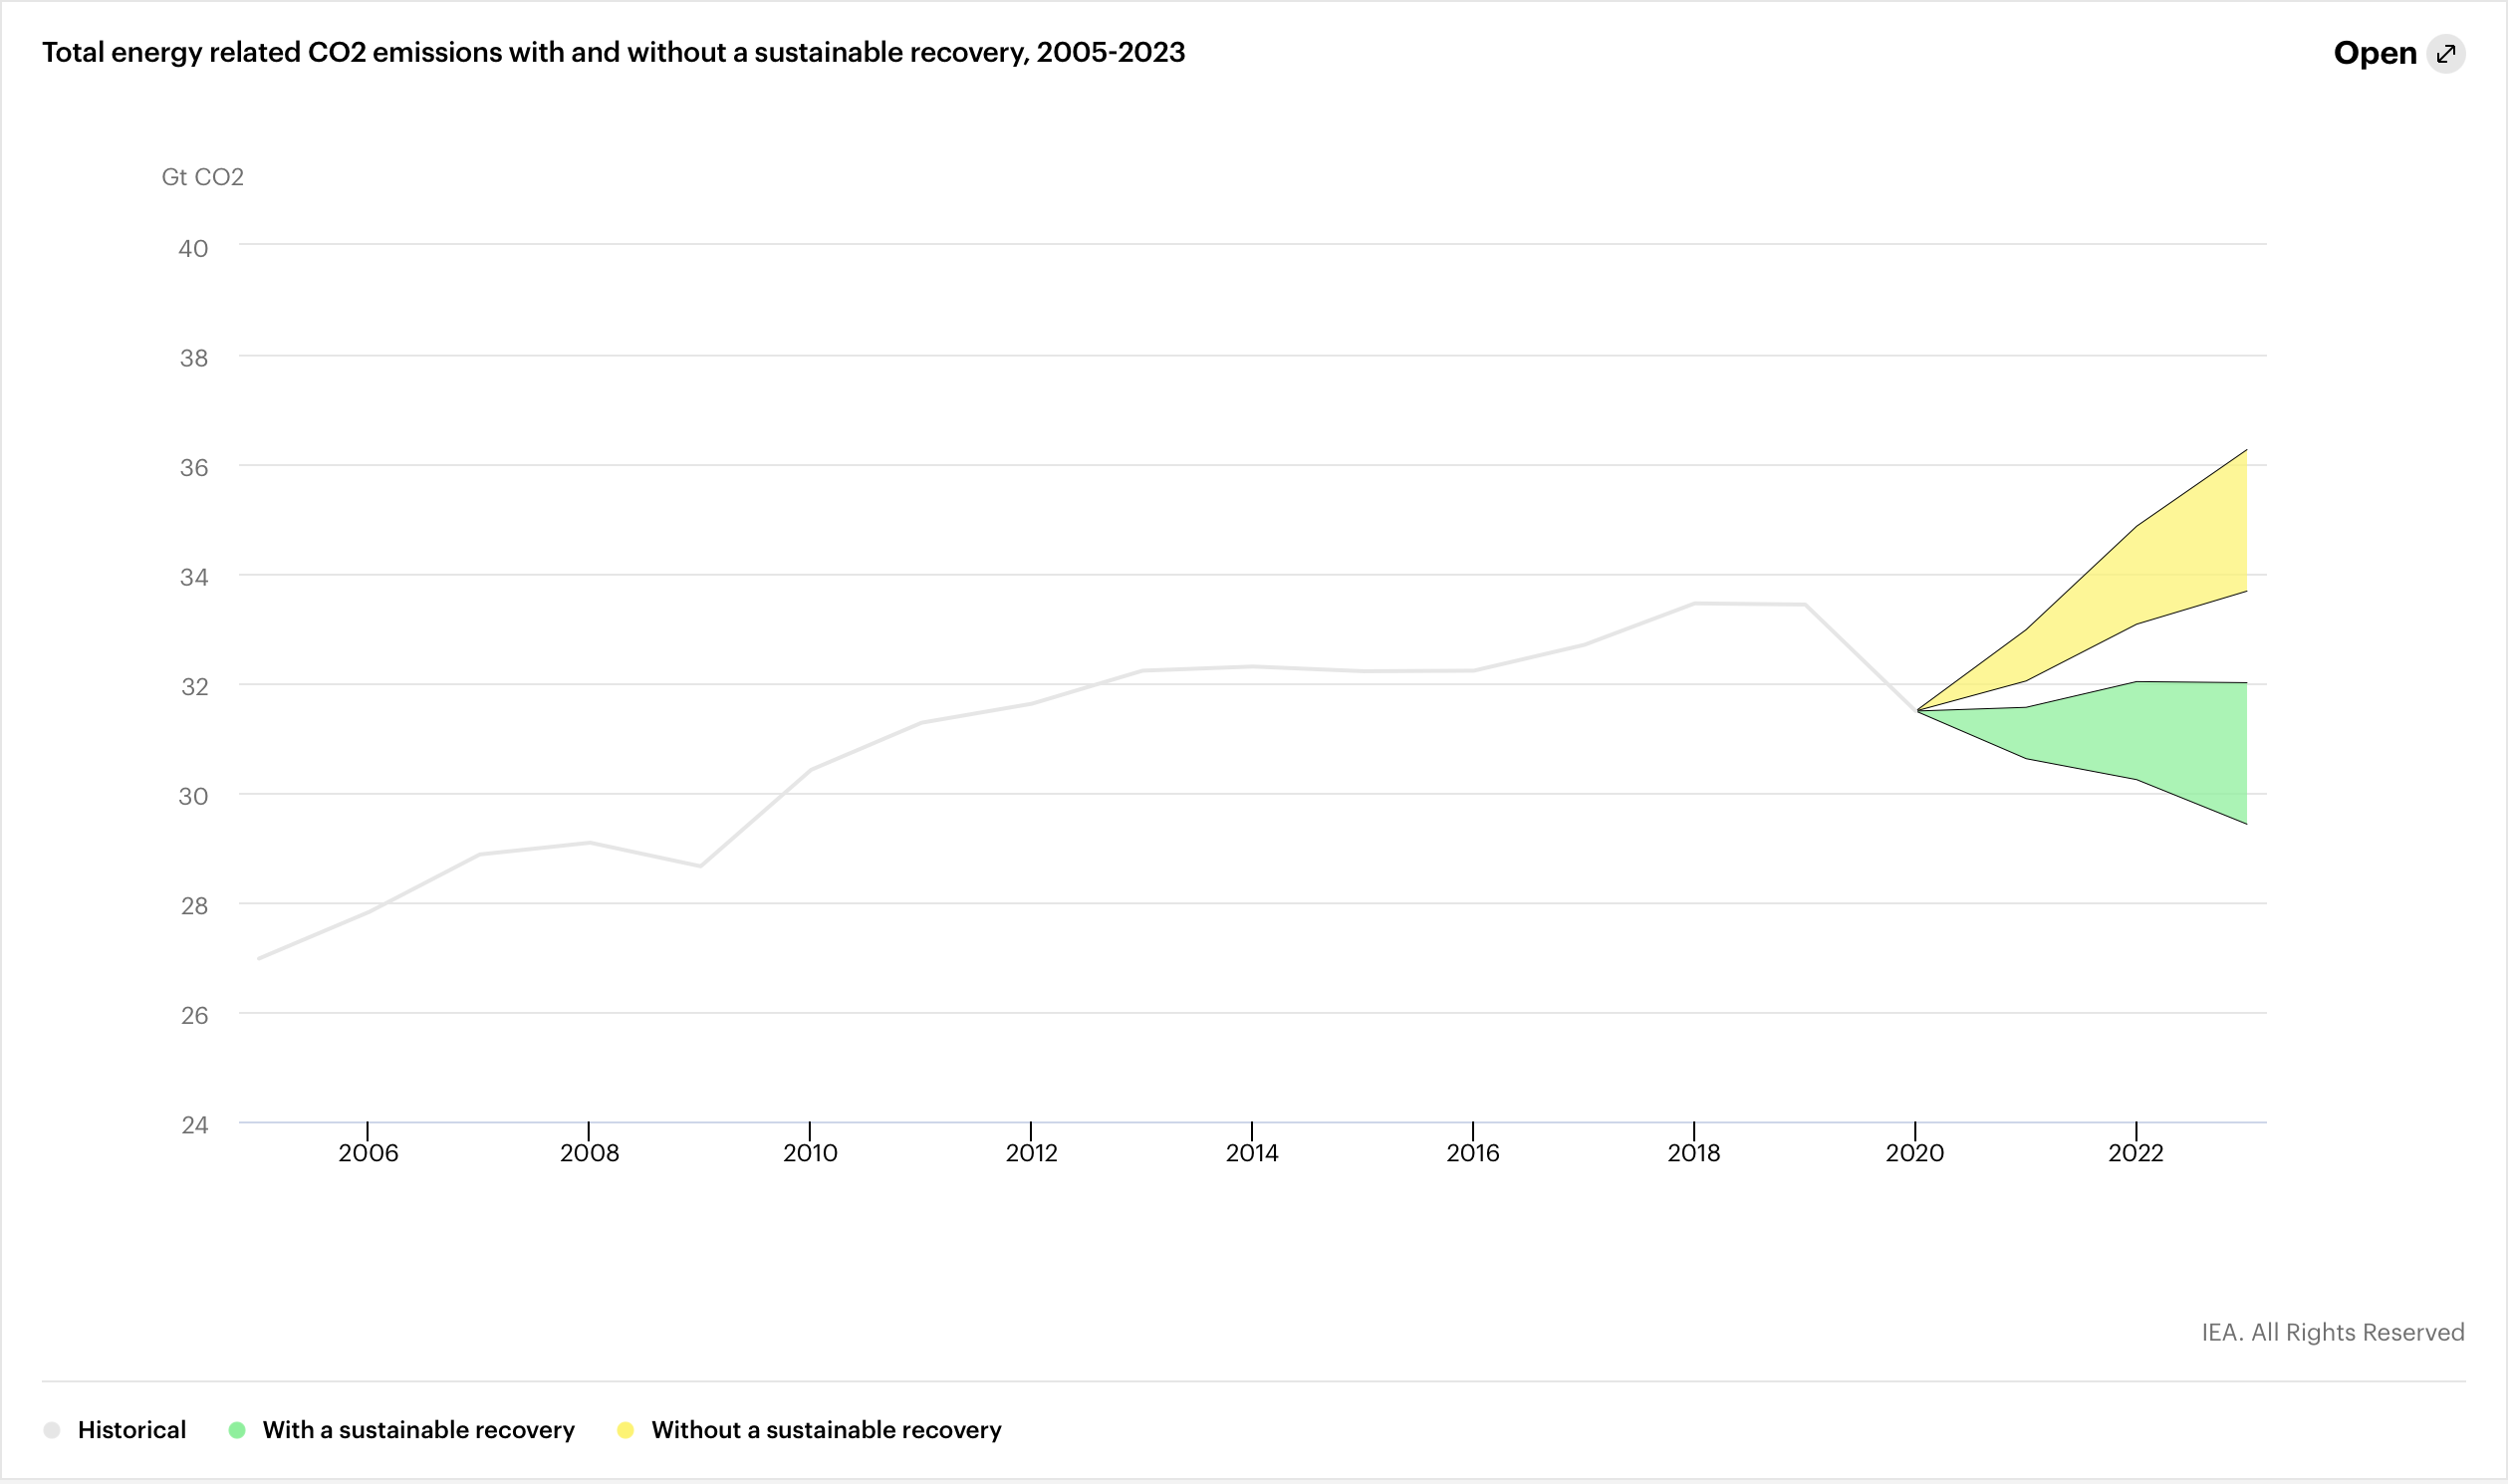
How will 2020 affect future emissions trends?
While 2020 marked the largest absolute decline in global CO2 emissions in history, the evidence of a rapid rebound in energy demand and emissions in many economies underscores the risk that CO2 emissions will increase significantly this year. What happens to energy demand and emissions in 2021 and beyond will depend on how much emphasis governments put on clean energy transitions in their efforts to boost their economies in the coming months. Avoiding a rebound in emissions requires rapid structural changes in how we use and produce energy. The IEA Sustainable Recovery report, published in June 2020, outlined a pathway to avoid a rebound in emissions, with the Sustainable Recovery Plan providing clear recommendations on how to create jobs, boost economic growth and significantly reduce emissions simultaneously.
Ensuring that 2019 marks a definitive peak in global CO2 emissions will be extremely challenging, but last year offers some valuable lessons that provide cause for optimism as we look ahead. Many power systems successfully kept the lights on, allowing hospitals to function or communication systems to operate with much higher shares of variable renewables. This provides a glimpse of things to come and offers greater confidence in operating large electricity systems powered with higher shares of renewables. Further, consumer preference for electric vehicles continues to grow, as does the number of electric vehicle models available.
Data sources and method
The IEA draws upon a wide range of respected statistical sources to construct estimates for the year 2020 and the month-to-month evolutions of energy demand and CO2 emissions. Sources include the latest monthly data submissions to the IEA Energy Data Centre (including December 2020 when available), real-time data from power system operators across the world, other statistical releases from national administrations, and recent market data from the IEA Market Report Series that covers coal, oil, natural gas, renewables and electricity. Where data are not available on an annual or monthly basis, estimates may be used.
CO2 emissions include emissions from all uses of fossil fuels for energy purposes. CO2 emissions do not include emissions from industrial processes, industrial waste and non-renewable municipal waste. CO2 emissions from international marine and aviation bunkers are included at the world level only.
Modern climate science is old enough for many of its early predictions to be checked against evidence—the overall global warming trend; specific patterns like nighttime warming exceeding daytime warming; or the cooling of the stratosphere. Even with all that new evidence, the estimated amount of warming you get for a given amount of greenhouse gas emissions hasn’t really changed since 1979.
The flip side to this is also true. Those who have opposed climate science’s conclusions—they’re a broad menagerie, including scientists in different fields, politics-obsessed bloggers, and think-tank employees—have also been squawking long enough for predictions to be tested. Despite their alternate-reality insistence that climate science never predicted anything, these contrarians don’t spend much time showing off their own predictions’ track record.
The reason for that is that the track record is very, very bad. Like the cringeworthy poetry you wrote in high school, they probably hope that everyone will just forget about it.
What goes up must come down
Before we turn on the scoreboard, it’s worth reviewing some commonalities of these predictions. Most of them appeal to cycles—particularly solar cycles. This lets them place any alarming upward trend in the comforting blanket of a downward trend that is just around the corner.
The Sun goes through an 11-year cycle of activity, which has been apparent for a very long time from records of sunspots. The length of the cycle is quite consistent, driven by an oscillation of the Sun’s magnetic field. The magnitude of change over each cycle does vary, though, including famous “minimum” periods where sunspots were nearly absent across multiple cycles.
While this cycle does produce a measurable variation in solar radiation, the effect on Earth’s climate is quite small. Scientists who study our atmosphere, weather, and climate know this. Some scientists who study the Sun, however, have managed to escape awareness of this fact and attempted to explain (or predict) every wiggle in Earth’s climate based on the timing of solar cycles.
Beyond the Sun, this mathematical but physics-free approach has led to many confident but false predictions. In any data with variance, one can find signals of cycles of various lengths. Some will be meaningful—like annual cycles in temperature or oscillations of El Niño and La Niña conditions in the Pacific—while others will simply be coincidental.
If you look hard enough, you can find a specific data set and specific time period where a particular cycle length shows up. Make up a good story to go with the curve you fit to that spurious cycle, and you can write a persuasive blog post about what will happen next. Of course, reality doesn’t read your blog and is famously difficult to persuade.
Must replenish my strength with rays of the Sun
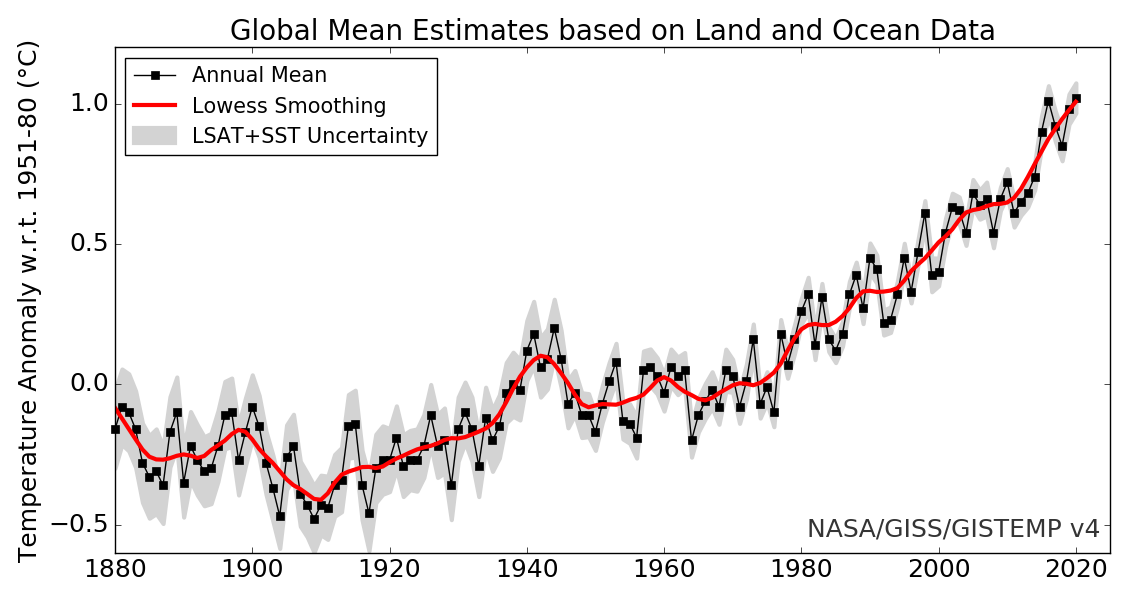
For comparison with past predictions, we’ll use NASA’s global surface temperature data set—though any of the major data sets would do. In the reality that is tracked by this data set, each year from 2015 through 2020 turned out to be warmer than any year previous to 2015.
The specific predictions we dug up were made between 2005 and 2013. To be accurate, these predictions would have to account for the long-term warming trend of the preceding decades. But accounting for warming would undermine the whole endeavor of labeling climate change a “hoax,” so none of these predictions did.
NASA’s global surface temperature record through 2020 via ars technica
2008, Don Easterbrook (source): “global climates can be expected to cool over the next 25-30 years[…] The real danger in spending trillions of dollars trying to reduce atmospheric CO2 is that little will be left to deal with the very real problems engendered by global cooling.”
Easterbrook, a retired professor of geology, makes this claim based on the appearance of roughly 30-year fluctuations in a Greenland ice core. Inappropriately extrapolating this local record to the entire globe, he declared that warming between 1977-1998 was entirely due to this unidentified cycle. That would mean 30 years of cooling was next—physics of the greenhouse effect be damned.
He repeated this claim over a number of years, starting in 1998, when he predicted that temperatures would start dropping in the first decade of the 2000s. They did not.
2009, Henrik Svensmark (source): “In fact global warming has stopped and a cooling is beginning[…] Everything indicates that the Sun is going into some kind of hibernation[…]”
Svensmark is a Danish physicist who long pushed a hypothesis that climate should fluctuate with solar and orbital cycles because incoming galactic cosmic rays—which are less common when the Sun’s magnetic field deflects more of them—controlled the production of condensation nuclei for clouds.
An experiment at CERN was actually built to test this mechanism, which didn’t pan out. It’s no surprise, then, that the predictions of imminent cooling (including those in his 2007 book titled The Chilling Stars: A New Theory of Climate Change) didn’t pan out, either.
2010, Anastasios Tsonis (source): “We have such a change now [of ocean oscillations] and can therefore expect 20 or 30 years of cooler temperatures[…] Perhaps we will see talk of an ice age again by the early 2030s, just as the [ocean oscillations] shift once more and temperatures begin to rise.”
Tsonis—a retired professor of atmospheric science—was a temporary star of the climate contrarian movement for his repeated assurances of a cooling trend. Like Easterbrook, this was based on natural oscillations around 30 years long. Specifically, Tsonis appealed to known ocean oscillations in the Pacific and Atlantic.
This fed off the meme that warming had stopped in 1998—a cherry-picked year that was anomalously warm—and thus the cycle had already turned downward. As late as 2013, Tsonis was on Fox News saying that “I would assume something like another 15 years of leveling off or cooling.” Unlike global temperatures, that prediction isn’t looking so hot.
2011, Nicola Scafetta (source): “The climate will likely stay steady until 2030/2040 and may warm by about 0.3-1.2° C by 2100.”
Scafetta—a physicist who loves to publish papers on topics outside of physics—was the king of fitting wiggly cycles to temperature data and then extrapolating into the future. In this instance, Scafetta claimed that a pile of astronomical cycles with varying lengths was controlling Earth’s climate. Running this mathematical model forward predicted about three decades of small ups and downs followed by a much smaller warming trend than what we see in climate models.
Scafetta’s prediction (blue) and observed temperatures (red) as of 2011 via ars technica
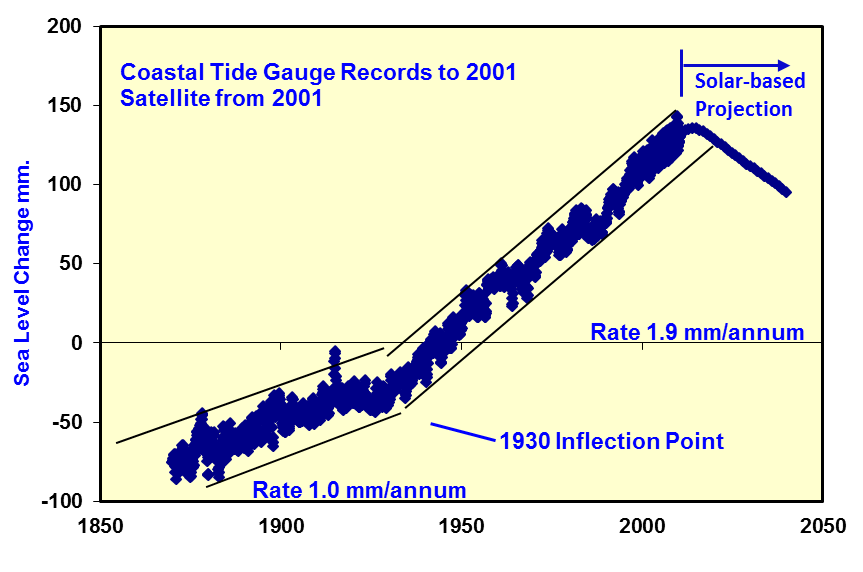
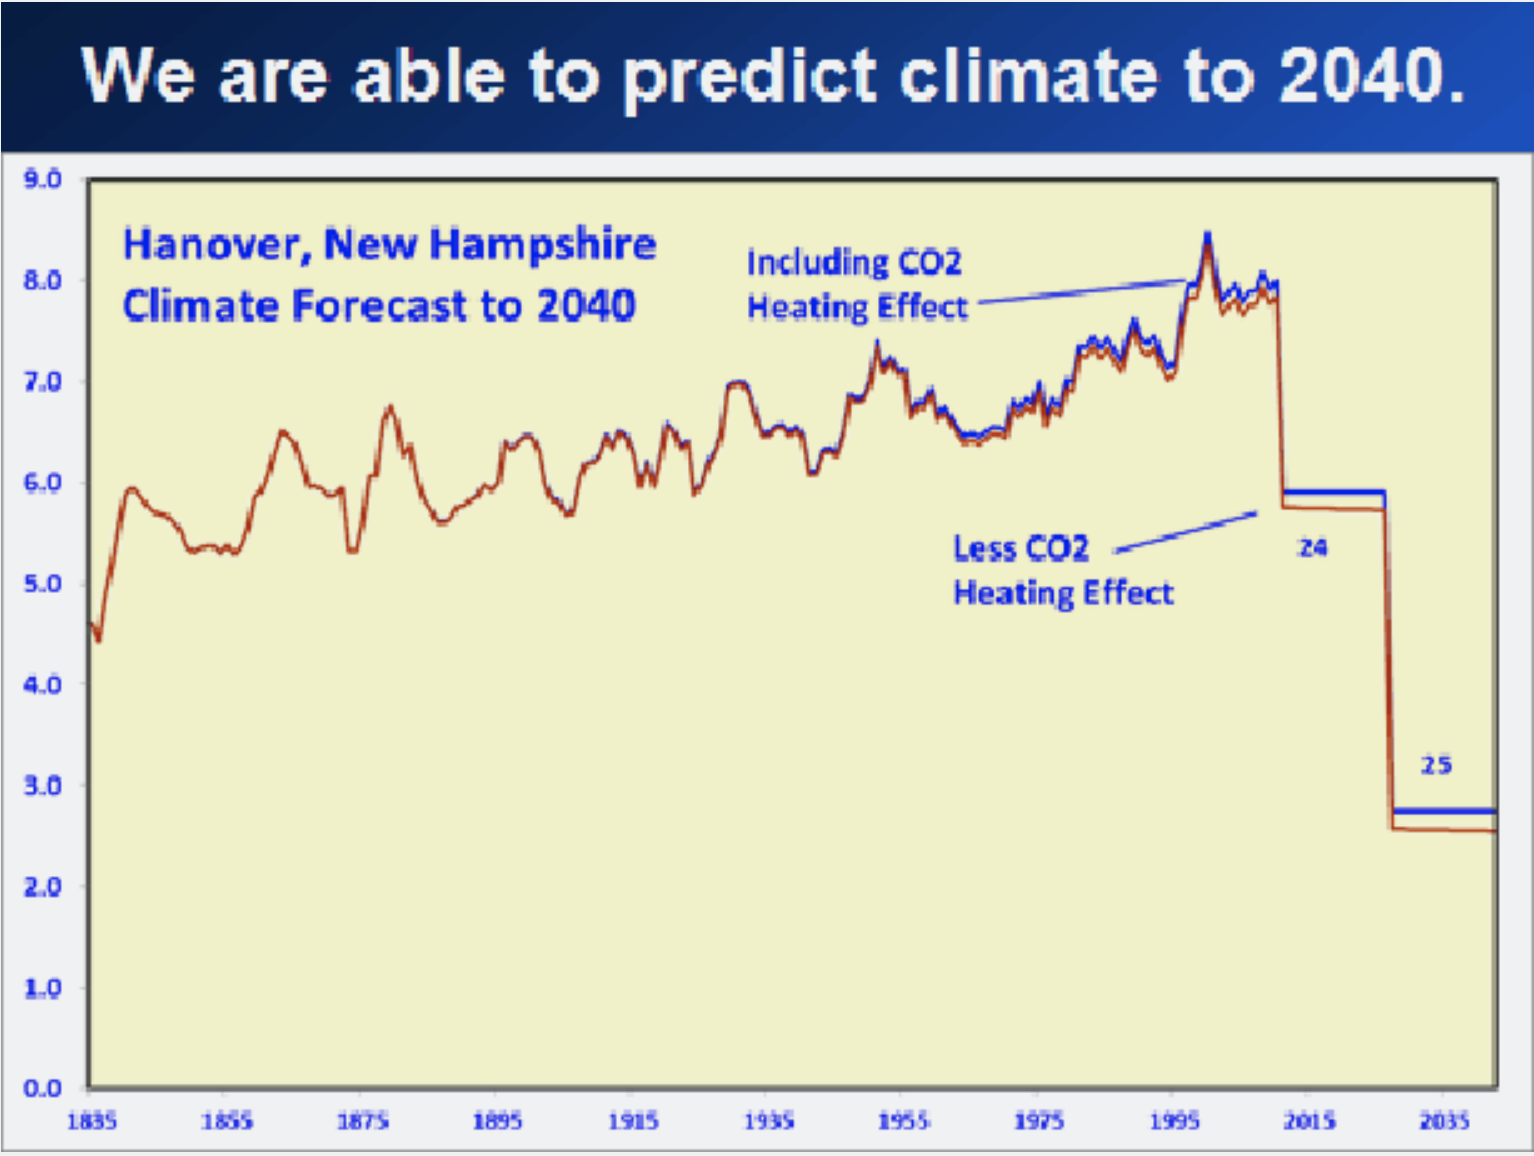
2012, David Archibald (source): “Sea level has a few more mm of rise to the maximum of Solar Cycle 24 in 2013 and then will fall 40 mm to 2040 taking us back to levels of the early 1990s.”
Archibald predicted a sudden reversal of sea level rise in 2011 via ars technica
Lest you think this is limited to temperatures, let’s take a quick detour to sea level. Archibald’s profile on the website of the Heartland Institute (a climate contrarian “think tank”) describes him as “a scientist operating in the fields of cancer research, climate science, and oil exploration.” Here he seized on a temporary dip in sea level rise caused by strong La Niña rains that transported water onto continents around the Pacific.
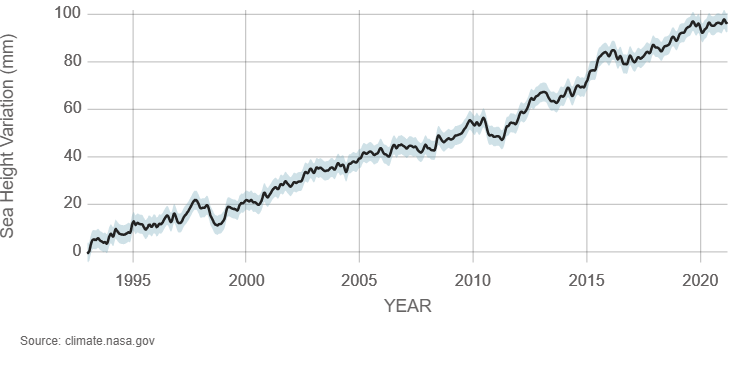
Despite this extremely obvious cause, some contrarian commentators declared that sea level rise had ended. Archibald declared that 30 years of sea level fall had begun in 2011. But in reality, it resumed apace the following year and has continued rising.
Sea level rise did not, in fact, end via ars technica
Archibald, again (source): “The total temperature shift will be 4.9° C for the major agricultural belt that stretches from New England to the Rockies straddling the US-Canadian border.”
Yep, he went there! At the same time Archibald assumed solar cycles would somehow turn sea level around, he predicted a drastic cooling trend. He used a favored method of focusing on individual locations (whichever ones fit the narrative best!) rather than the global record, but his cooling prediction applied around the world. (And no, his prediction for Hanover didn’t work, either.)
This 2012 prediction has not aged well via ars technica
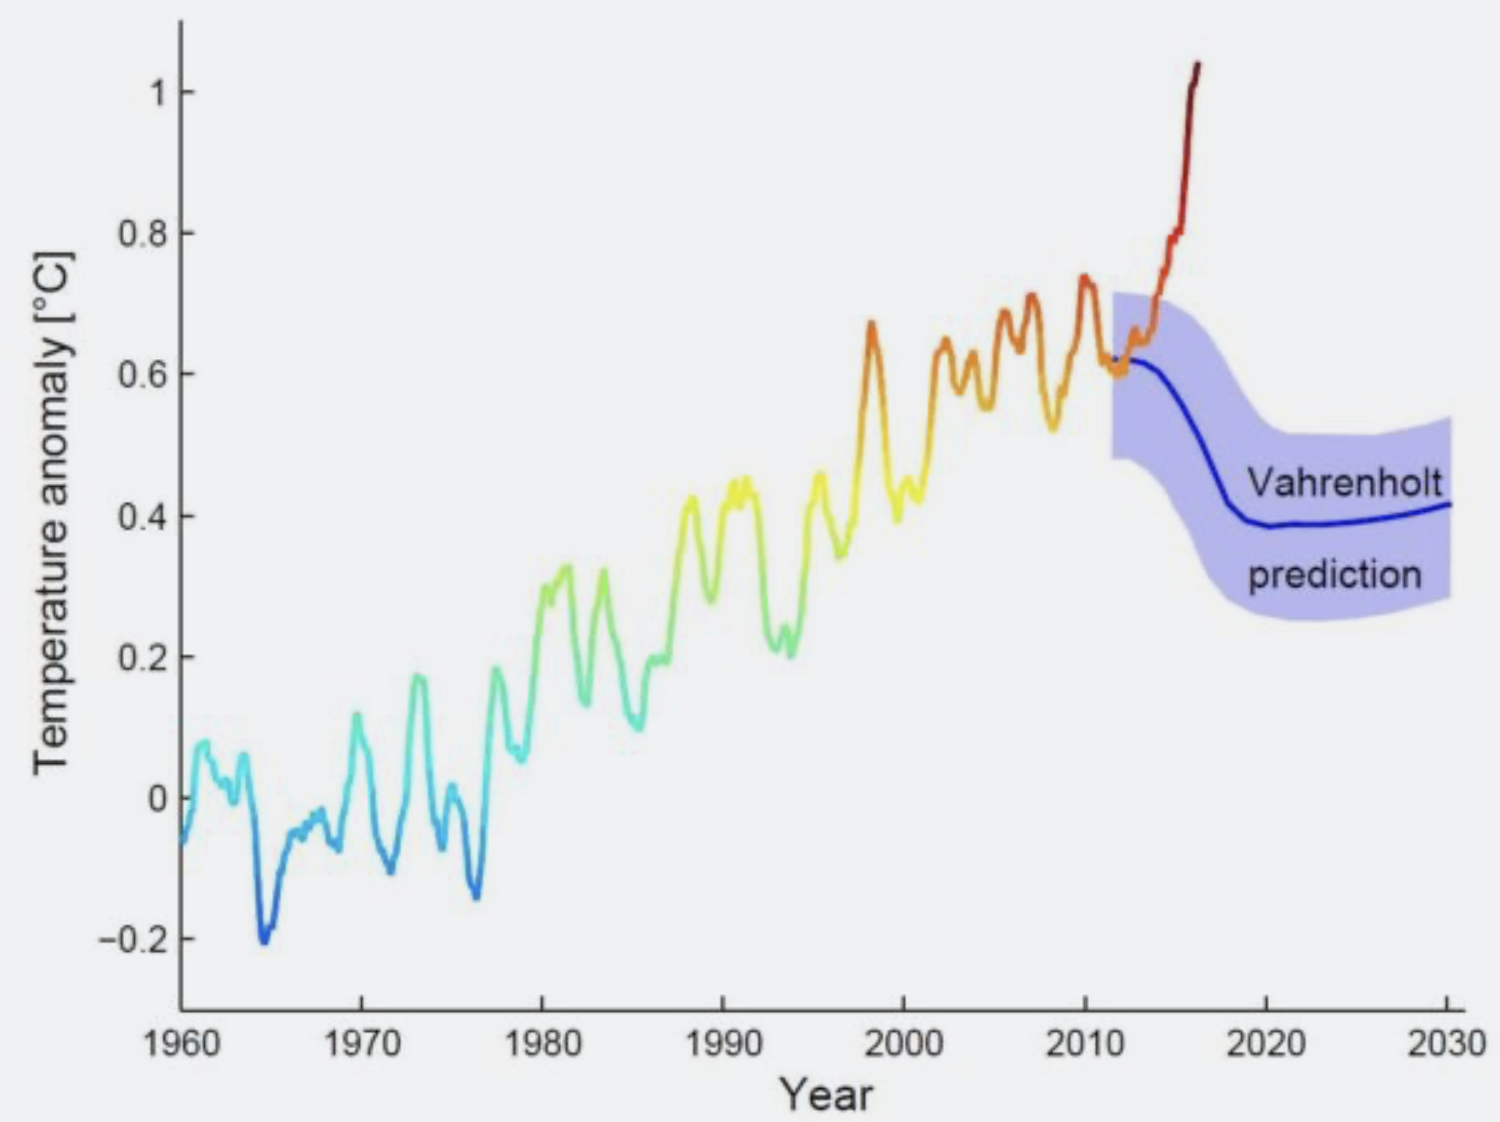
2012, Fritz Vahrenholt (source): “But the Sun has been getting weaker since 2005, and it will continue to do so in the next few decades. Consequently, we can only expect cooling from the Sun for now.”
Vahrenholt co-authored a book titled Die Kalte Sonne (The Cold Sun), on which the chart below is based. It speaks for itself.
This chart, created by climate scientist Stefan Rahmstorf, shows how poorly Vahrenholt’s prediction fared through 2016 via ars technica.
2013, Judith Curry and Marcia Wyatt (source): “the current pause in global warming could extend into the 2030s.”
Curry was a professor of Earth and Atmospheric Sciences at Georgia Tech before retiring to start a consulting business. Through her blog, Curry lent a veneer of seriousness to all manners of low-effort contrarian nonsense while proclaiming herself persecuted by the rest of the scientific community. Her central theme was that natural climate variability was larger than everyone thought, with any clarity about human-caused climate change swallowed up by what she called the “uncertainty monster.”
For several years around the time of this paper, Curry pushed a “stadium wave” explanation for recent temperatures. The idea was that the (cherry-picked) flatter temperature trend of the 2000s was evidence of a confluence of natural cycles that would continue to cancel out human-caused global warming for several decades. But instead, the run of La Niña years that was actually causing it soon gave way—as everyone else knew it would—and the long-term warming trend plodded onward.
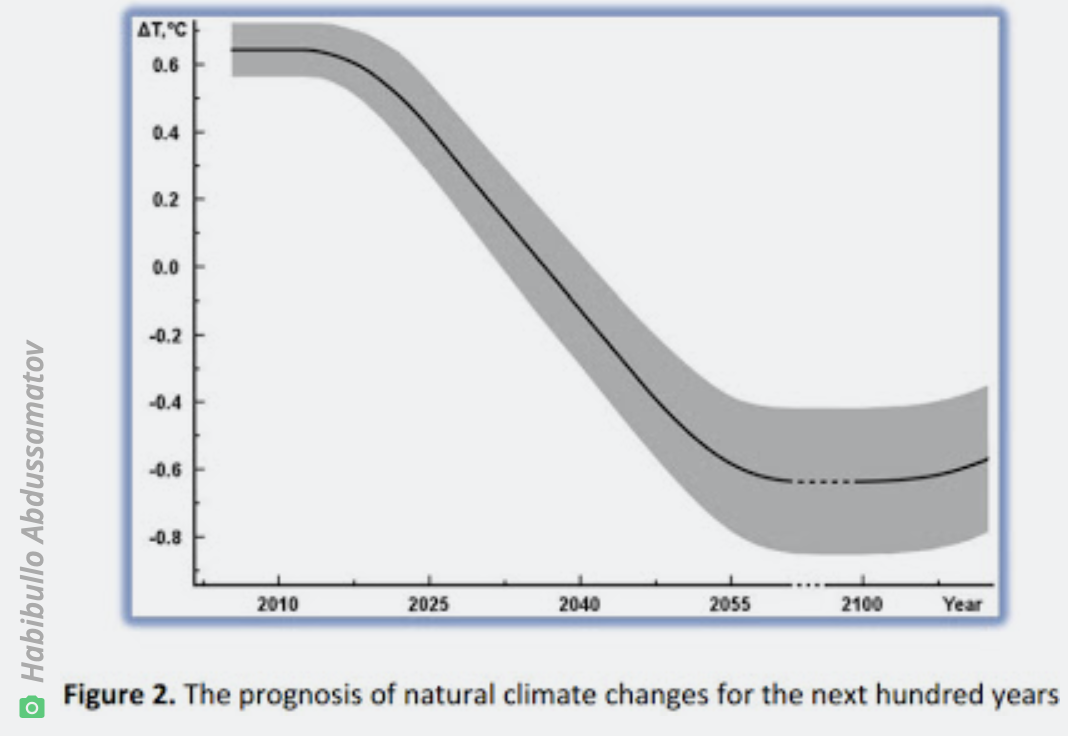
2013, Habibullo Abdussamatov (source): “Now we witness the transitional period from warming to deep cooling characterized by unstable climate changes when the global temperature will oscillate (approximately until 2014) around the maximum achieved in 1998.”
We’re back to solar cycles. The prediction here, by a Russian astrophysicist, was that cooling into a new “Little Ice Age” would commence around 2014. The comparison to the Little Ice Age of the late 1600s to early 1800s was a common one among climate contrarians, but low solar activity is actually thought to have had relatively little to do with it. In the present, with increased greenhouse gases trapping more heat, even a major solar lull would be overwhelmed—not that one has actually happened.
According to Abdussamatov, it should all have been downhill from 2014 via ars technica.
2005, the $10,000 bet (source): “James Annan, who is based at the Japan Agency for Marine-Earth Science and Technology in Yokohama, has agreed a US$10,000 bet with Galina Mashnich and Vladimir Bashkirtsev, two solar physicists who argue that global temperatures are driven by changes in the Sun’s activity and will fall over the next decade.”
Let’s go back to 2005 to round out this list. This cooling prediction by Mashnich and Bashkirtsev was similarly based on a predicted decline in solar activity for several decades. The spicy bet they agreed to certainly elevates this prediction above the rest of this list, though.
Obviously, James Annan won this bet (among others!), but it may not surprise you to learn that the losers never paid up.
Juuuuust a bit outside
It’s true that climate trend predictions should generally be judged over longer timescales to minimize the influence of short-term variability. You won’t catch actual climate scientists making definitive statements about what will happen in the next couple years because they understand that variability dominates in brief periods. The predictions evaluated here, however, represented confident claims of an imminent and persistent reversal of the warming trend—which has not manifested in the slightest.
This is not an exhaustive list, but it is representative of the constant drumbeat of the contrarian blogosphere and partisan media. After all, there’s no more eye-catching way to reject human-caused warming than to assert that “Well actually… it’s cooling!” Any such claim, no matter how preposterous or thinly supported, would get promoted without inspection across these sites.
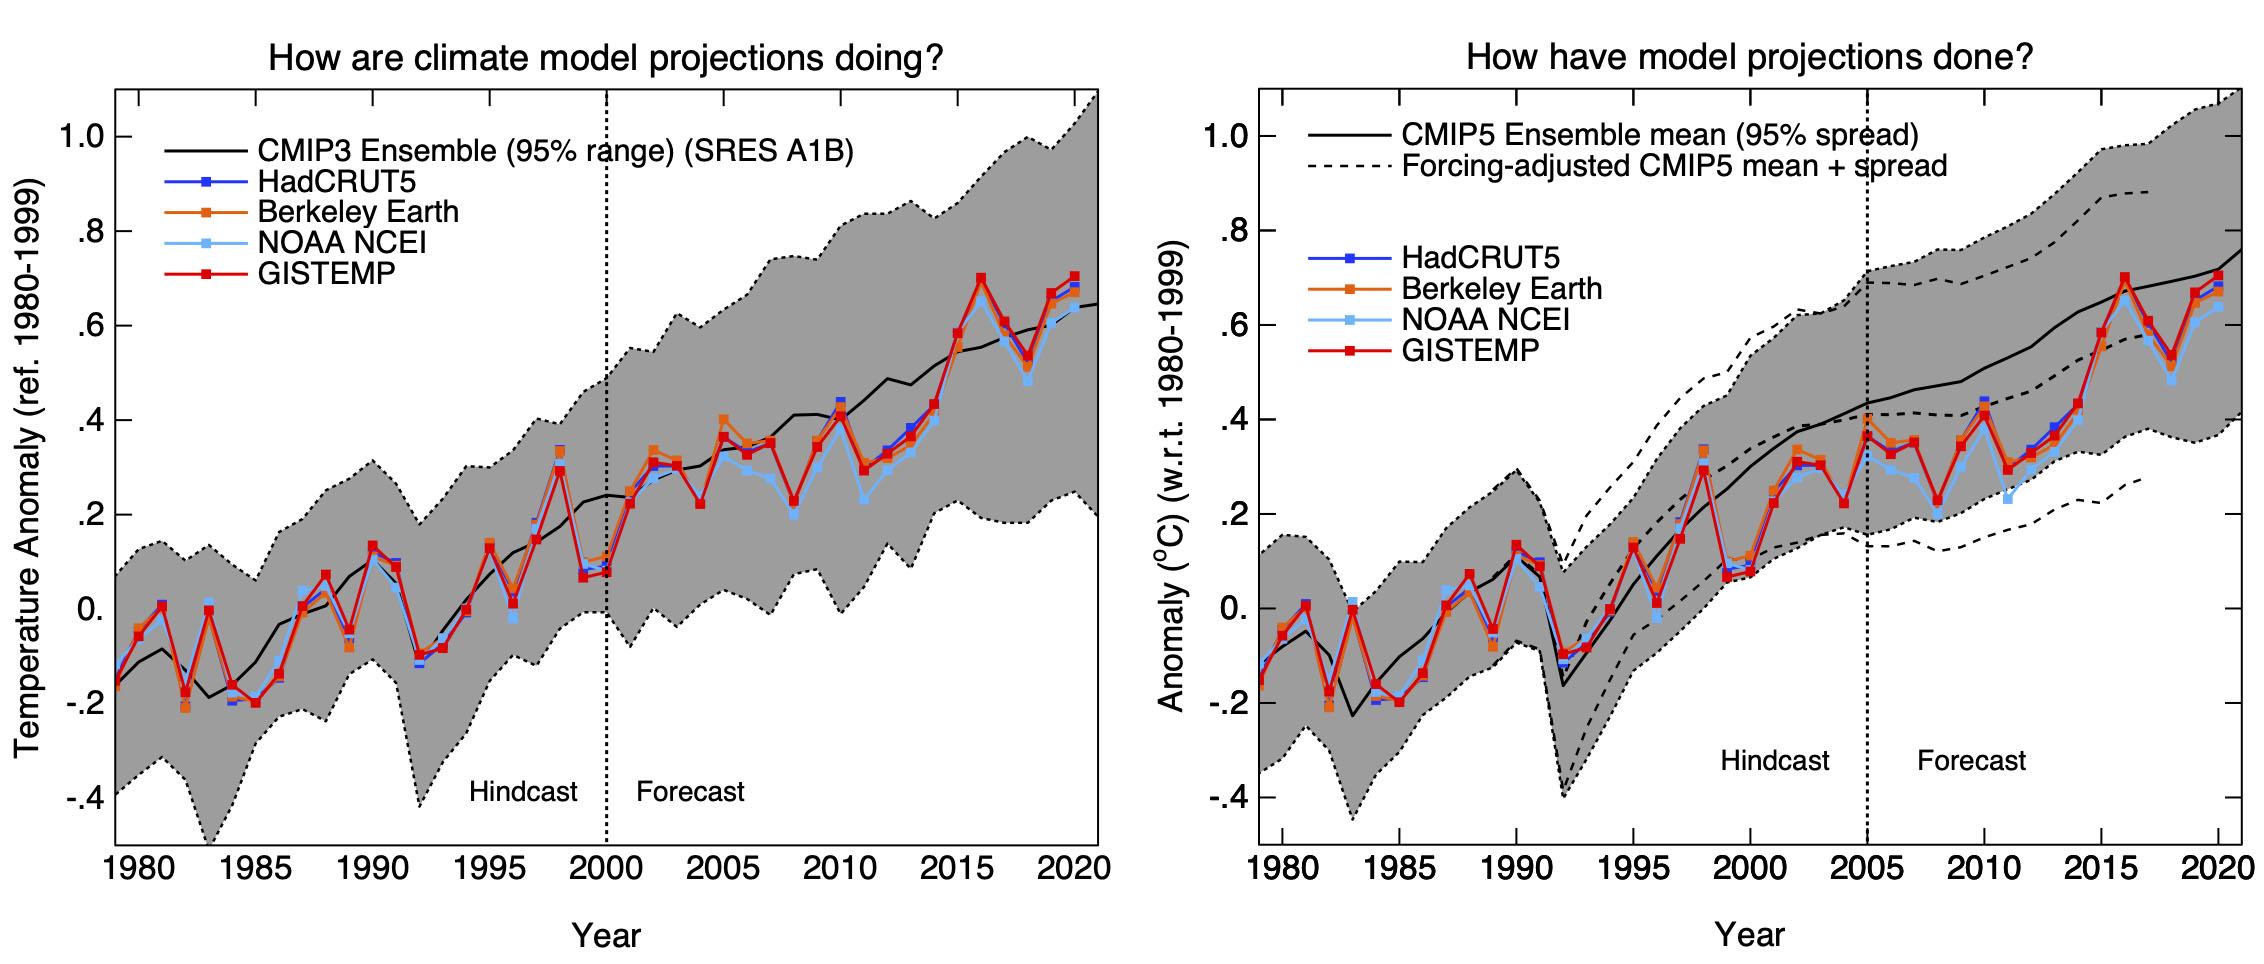
On the other hand, the products of climate science—including the Intergovernmental Panel on Climate Change (IPCC) reports—have performed admirably over this time period. Climate-model projections (which are contingent on scenarios of greenhouse gas emissions) match well with reality. Physics, it turns out, is a good thing to include in your model.
Here’s how the model projections (gray/black) from the last two IPCC reports compare to observed temperatures (colored lines) through 2020. Via ars technica.
A new IPCC report is due out soon, providing the latest summary of what we know along with a new set of model projections. One very safe prediction is that it will be much more useful than this collection of errant cooling forecasts. If anyone still doubts that, you need only point to the scoreboard.
Lawn sizes in Castle Rock are sharply limited to save water, with some homeowners opting to use artificial turf for convenience and to help keep water bills low. Oct. 21, 2020. Credit: Jerd Smith, Fresh Water News
Conservation groups want more “cash for grass” and other plans to acquire new water by saving it. But Denver and Aurora, among others, say there’s only so much to cut before a new dam is needed.
Conservation groups applaud water savings efforts like Aurora’s. What they want is far, far more of the same.
They point to reports required by the state water conservation board showing many large agencies on the Front Range cutting back spending and personnel dedicated to water conservation since 2013, at the same time those water departments press to build massive dam complexes for new water they say they desperately need.
Large water agencies like Denver Water and Aurora Water say they do have ongoing conservation efforts they take seriously, but that fast population growth on the Front Range overwhelms potential savings and they need new water storage…
It would be much better for Colorado’s environment, the conservation groups respond — not to mention cheaper — to acquire water by using less of it, rather than spending billions of dollars on dams and diversions of Western Slope water.
And yet, several projects are on the drawing board:
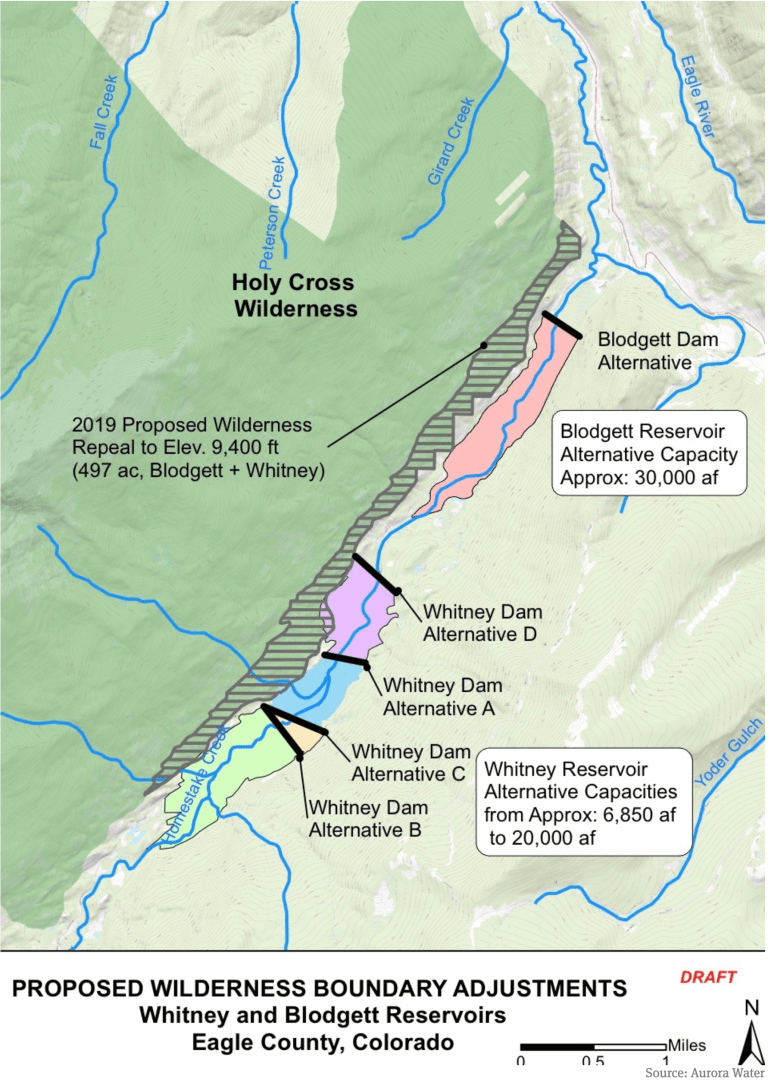
A map prepared by Aurora Water that shows a potential 500-acre adjustment to the Holy Cross Wilderness boundary near the potential Whitney Reservoir on lower Homestake Creek. The map as current as of July 16, 2019.
Aurora wants to team up with Colorado Springs to build Whitney Reservoir and divert more of Homestake Creek over the Continental Divide to the Front Range
Denver Water wants to expand Gross Reservoir above Boulder to hold more Fraser River water diverted from the Colorado River Basin
U.S. Highway 287 runs through the future site of Glade Reservoir. The Larimer county Board of County Commissioners approved the 1041 Land Use Permit for NISP in September, 2020. Photo credit: Northern Water
Northern Water has a $1 billion proposal to dam more Cache la Poudre River water for more than a dozen northern suburbs and cities
All of those would be unnecessary, the conservationists say, if the agencies doubled down on water-saving efforts that cut deeply into household use in the years after the devastating 2002 Front Range drought…
“We know that water in the West is increasingly in short supply and will only become more so as climate change results in worsening drought conditions and water shortages. The answer can’t simply be to pull every last drop of water out of our rivers,” said Juli Slivka, policy director at Wilderness Workshop, which is among the groups fighting any new dams on Homestake Creek.
Some of the bigger water agencies on the Front Range respond that conservation remains a primary goal, despite the falloff in their spending evident in annual reports required by the Colorado Water Conservation Board.
Aurora’s population will grow by hundreds of thousands of people by 2050, said Aurora Water spokesman Greg Baker. The agency focuses intensely on conservation to expand its water supply, Baker said, through programs like the smart meters and rebates to property owners who remove thirsty lawns, and with Prairie Waters, the largest potable water recycling system in the state.
But that growth, highly visible on Aurora’s eastern edge at the Highlands or Painted Prairie, means stretching existing water use is not enough for future supply, he added. Acquisition of new water must continue. The agency just spent about $17,000 an acre-foot for 500 acre-feet of farm water in the South Platte River Basin, Baker said.
“That’s more than we could find through conservation right now, unless we took such draconian measures — you know, say we banned all outdoor water use,” he said.
Denver Water, serving 1.5 million customers as the largest water agency in Colorado, said it is proud of conservation efforts launched after the wakeup call of the 2002 drought, achieving its goal of a 22% cut in per capita water use in a campaign from 2007 to 2016. Since then, said Denver Water’s manager of demand planning Greg Fisher, some resources have shifted to the concept of “efficiency” — focusing less on absolute cuts to everyone’s use, and instead consulting with larger customers and homeowners to ensure they are using only the water they actually need…
Denver Water’s officially reported tally of its conservation work fell from 36 full- and part-time staff and a budget of $8 million in 2013 — the first year of required reporting — to five full-time staffers and $1.5 million in spending in 2019, the last full year before the pandemic shut down many field services. Denver’s peak of conservation staffing, at 40 in 2016, was the same year the agency said it achieved the long-set goal of 22% per capita reductions in use.
Denver Water says daily water use fell from 211 gallons per person in 2011, before another severe drought began in 2013, to 165 gallons a day in 2016. Since then, Fisher said daily use has declined to about 140 gallons. In the years since the 2002 drought, Denver Water’s annual overall use has gone down, even as the customer base has climbed by hundreds of thousands.
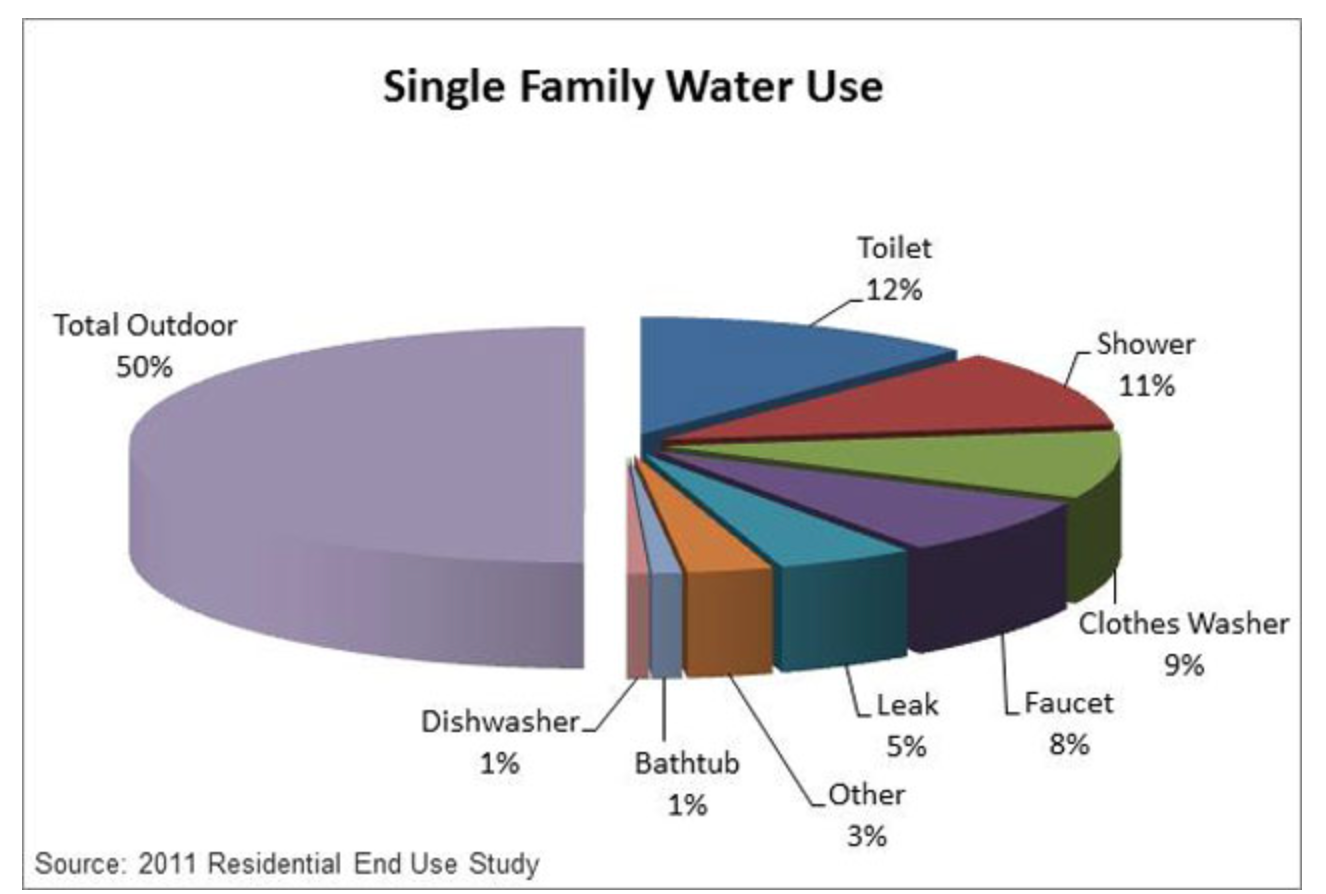
Lawn and plant irrigation still takes up by far the largest part of residential water use on Colorado’s Front Range. (Screen shot, Denver Water website)
The Denver agency says the state conservation reports are partially misleading because they ask for too narrow a classification of spending that ends up cutting water use. For example, Fisher said, Denver Water is spending more money on staff time helping local agencies rewrite green building codes to require more efficient water use…
Aurora’s conservation staffing has changed less dramatically, from 15 full-time and 13 contract positions in 2013, to a total of about 24 positions now, officials said. The emphasis has shifted over the years, Baker said. Most home and building owners have long since swapped out older toilets for efficient models, and individual homeowner irrigation audits are not as productive as broader efficiency programs…
Environmental conservation groups opposed to diverting water from Western Slope rivers are especially focused this year on Boulder County’s Gross Reservoir, where Denver Water wants to raise the dam by 131 feet at a cost of $464 million. A higher dam would allow Denver to bring over more of the water it owns in the Fraser River, part of the Colorado River Basin west of the Continental Divide. Denver also says it needs more water storage on the northern end of the Front Range in case changing climate patterns and wildfire runoff threaten water collection in the southern South Platte River basin, where most of its available water is collected…
Multiple environmental groups have sued to stop Gross Reservoir and sought to scrap it during the local permitting process. Boulder County held the power over a key construction permit Denver Water needs this year. Now Denver Water has asked a federal court to take over jurisdiction for the permit because the agency believes Boulder County Commissioners have already demonstrated their intent to block it…
Aurora Water says it is one of the few Colorado utilities that is doing exactly that [paying cash for grass], with its “water-wise landscape” payments. Aurora will design a homeowner’s low-water garden for free, and pay material costs up to $3,000 for 500 square feet — even more for a zero-water landscape, Baker said…
Denver Water says it offers everything from low-water “garden-in-a-box” kits, to rebates for installing the kind of smart controllers Aurora promotes, to training for landscapers…
Building storage, though, must remain a part of the water acquisition mix, both Denver and Aurora argue. As the system has gotten more efficient through conservation, Denver Water said, possible future gains diminish. In the 2002 drought, Denver said, its short-term restrictions cut water use 30%. After years of conservation work, similar restrictions in the 2013 drought — for a significantly larger customer base — cut water use only 20%.
“We are reaching the edges of supply,” Hartman said.