I started for Denver around 9:00 a.m. with a full charge from the night before via the Kum & Go in Steamboat Springs.
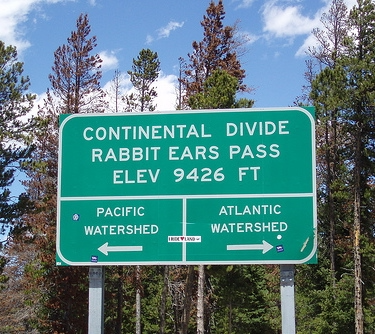
The climb up Rabbit Ears pass and run down Muddy Creek is the longest leg of the trip so I wondered how my nearly 5 year old battery would hold up. Going at highway speeds puts a real drain on it, but I pulled into Kremmling with a cushion, where charging is free.
At the the Kum & Go in Granby both chargers were busy but I wanted a bump to get to Fraser and had a short wait. It was good to see the cars, a Bolt and it looked like maybe a Chrysler Plug-In Hybrid, charging. I believe the infrastructure is helped along by the Colorado Energy Office.
I was able to get from Fraser to my house in Denver on only about 36% of charge. The regenerative braking system indicator lights were on much of the time after the summit at Berthoud Pass. I also bypassed all but a short reach of I-70 — to conserve charge and gawk at Clear Creek — using the frontage roads and US-6, then W. 44th Avenue from Golden.
With the charging infrastructure along US-40 it’s easy-peasy to get to the Yampa River Valley and back.
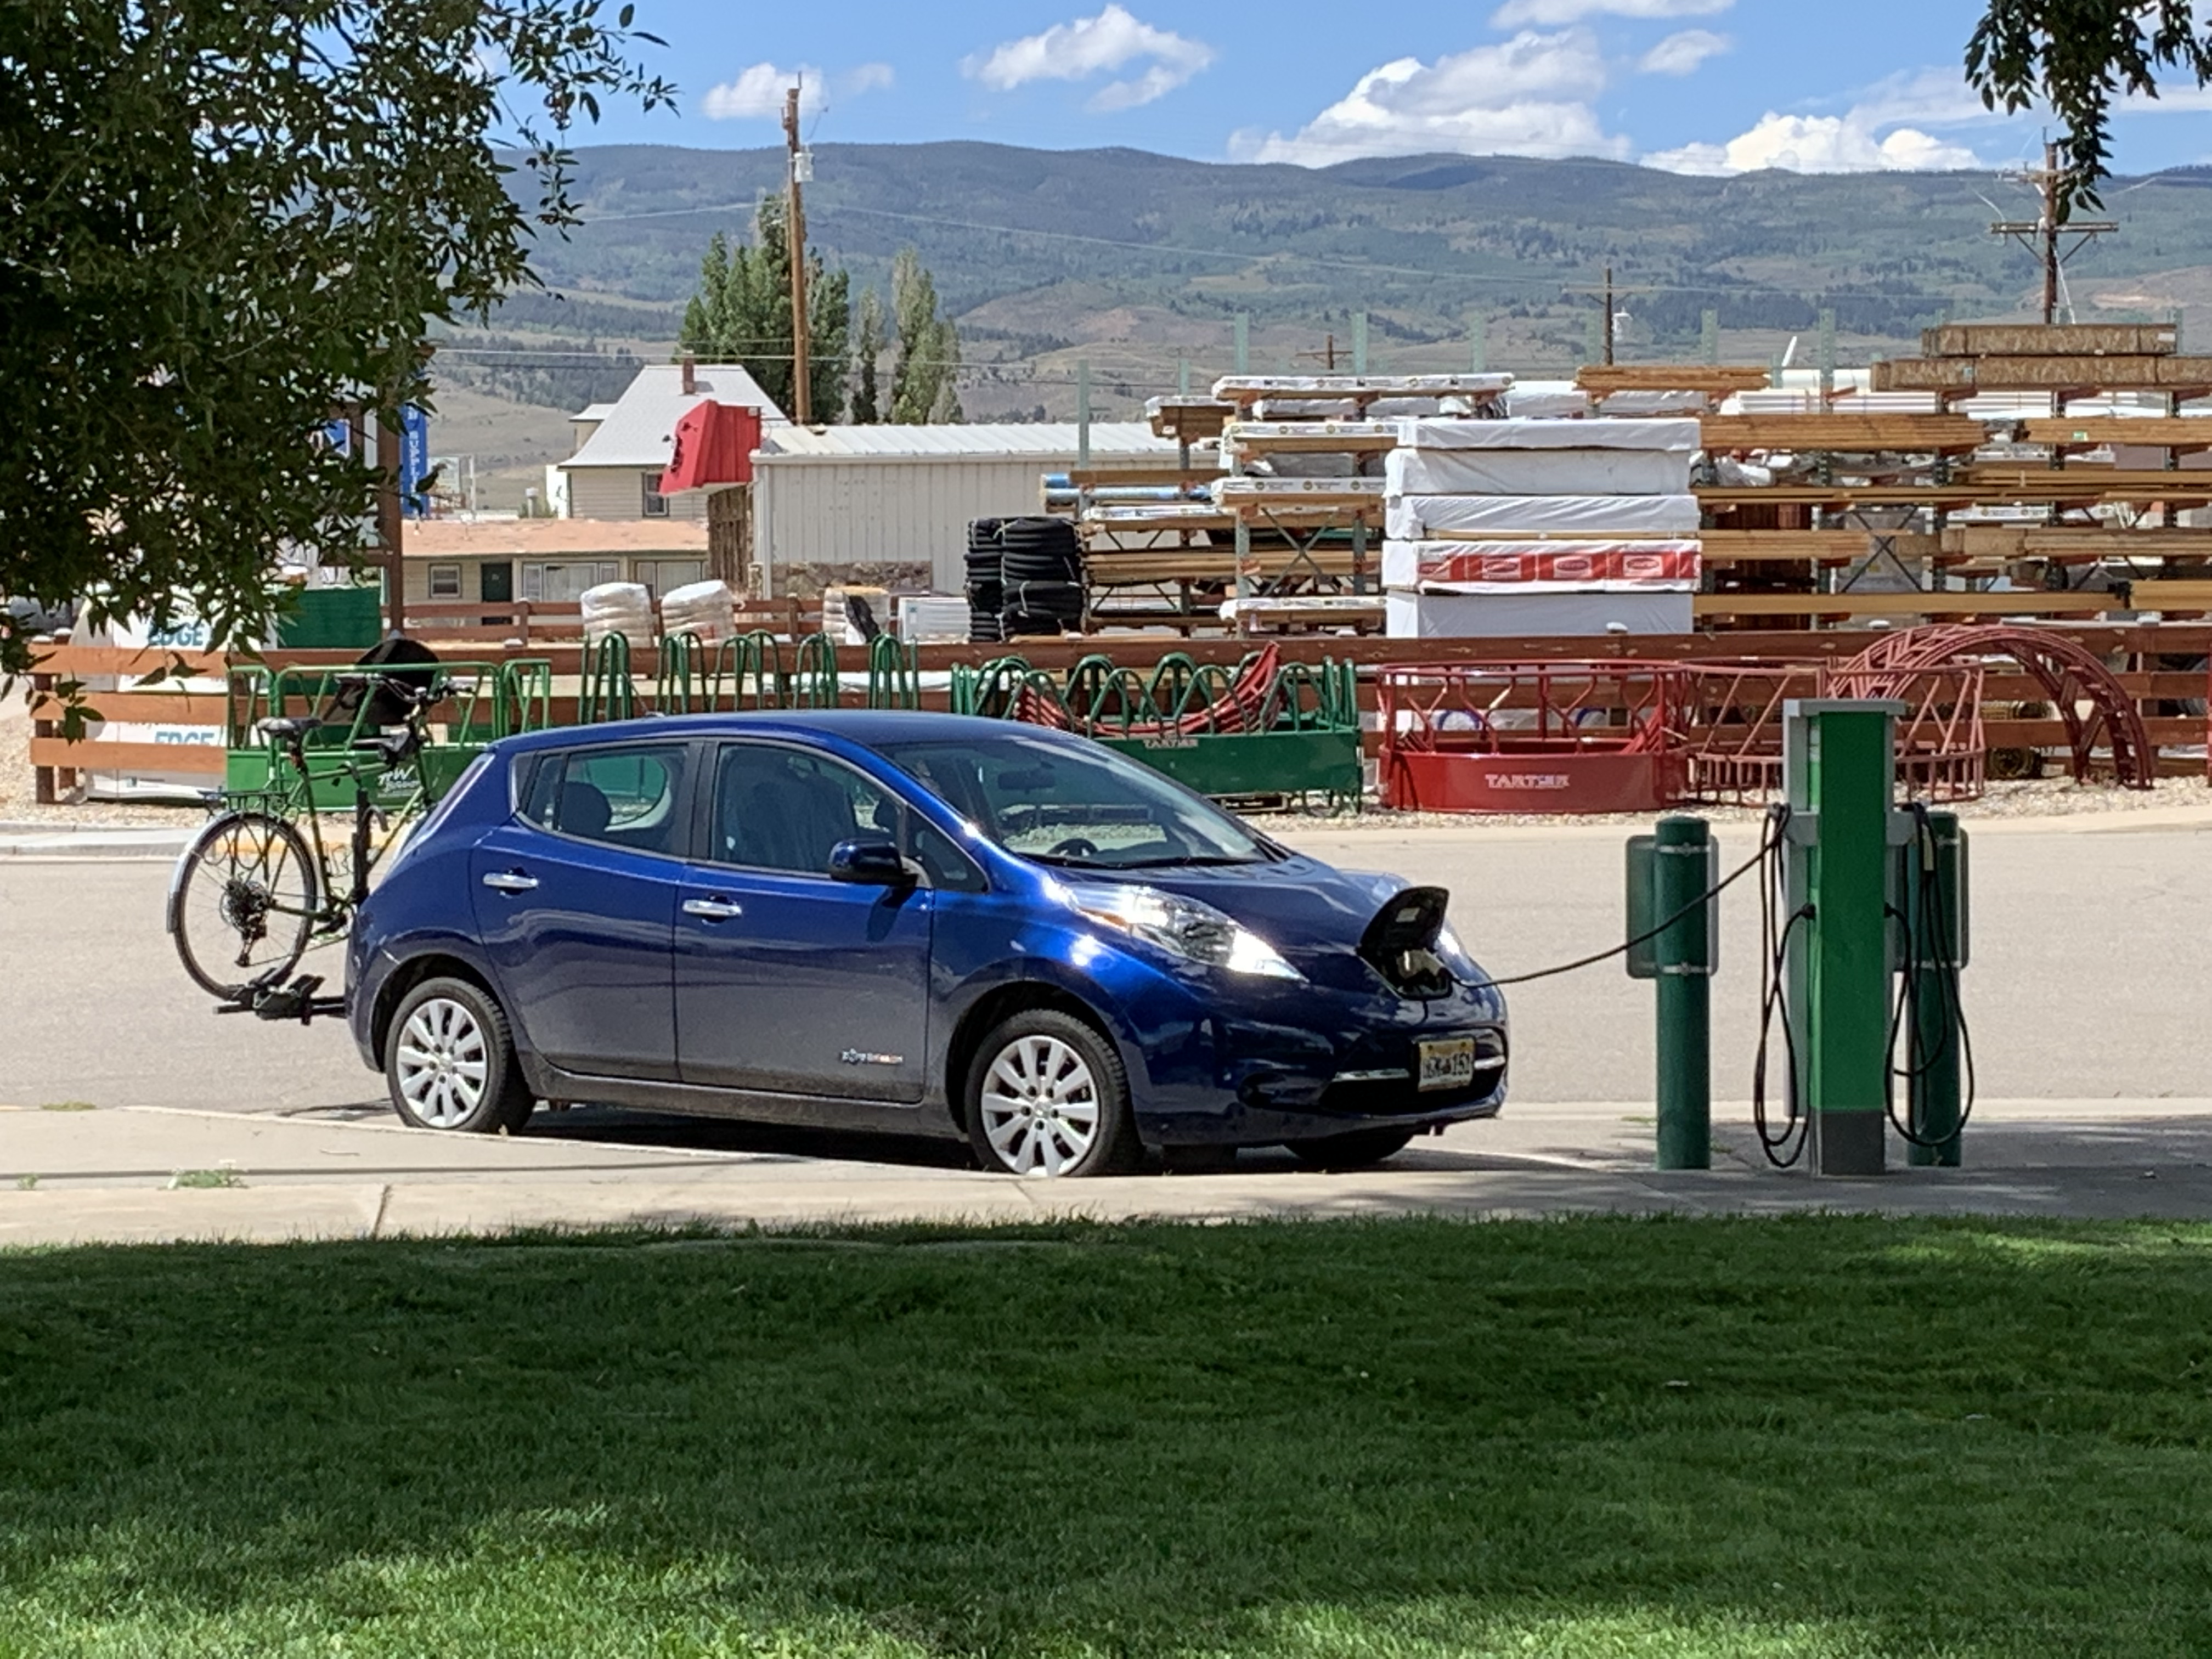
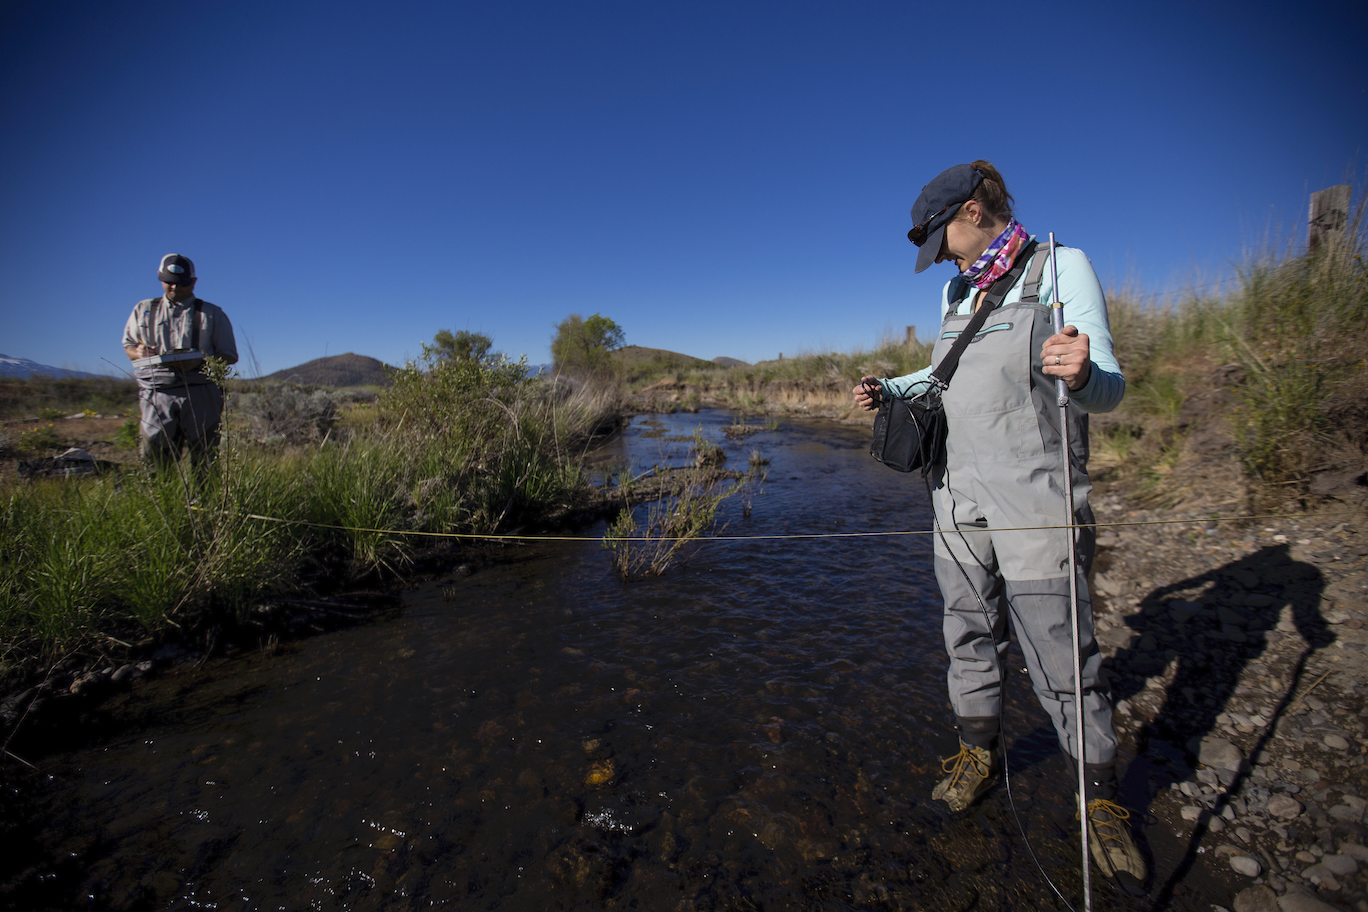
Leaf charging at the Kremmling Town Park August 23, 2021.
Charlie Watts from The Rolling Stones; Rolling Stones concert on December 11, 1981, Rupp Arena, Lexington Kentucky. Creative Commons Attribution-Share Alike 2.0
Charlie Watts, whose strong but unflashy drumming powered the Rolling Stones for over 50 years, died on Tuesday in London. He was 80.
His death, in a hospital, was announced by his publicist, Bernard Doherty. No other details were immediately provided…
Reserved, dignified and dapper, Mr. Watts was never as flamboyant, either onstage or off, as most of his rock-star peers, let alone the Stones’ lead singer, Mick Jagger. He was content to be one of the finest rock drummers of his generation, playing with a jazz-inflected swing that made the band’s titanic success possible. As the Stones guitarist Keith Richards said in his 2010 autobiography, “Life,” “Charlie Watts has always been the bed that I lie on musically.”
While some rock drummers chased after volume and bombast, Mr. Watts defined his playing with subtlety, swing and a solid groove.
“As much as Mick’s voice and Keith’s guitar, Charlie Watts’s snare sound is the Rolling Stones,” Bruce Springsteen wrote in an introduction to the 1991 edition of the drummer Max Weinberg’s book “The Big Beat.” “When Mick sings, ‘It’s only rock ’n’ roll but I like it,’ Charlie’s in back showing you why!”
Charles Robert Watts was born in London on June 2, 1941. His mother, the former Lillian Charlotte Eaves, was a homemaker; his father, Charles Richard Watts, was in the Royal Air Force and, after World War II, became a truck driver for British Railways.
Charlie’s first instrument was a banjo, but, baffled by the fingerings required to play it, he removed the neck and converted its body into a snare drum. He discovered jazz when he was 12 and soon became a fan of Miles Davis, Duke Ellington and Charles Mingus.
By 1960, Mr. Watts had graduated from the Harrow School of Art and found work as a graphic artist for a London advertising agency. He wrote and illustrated “Ode to a Highflying Bird,” a children’s book about the jazz saxophonist Charlie Parker (although it was not published until 1965). In the evenings, he played drums with a variety of groups.
Most of them were jazz combos, but he was also invited to join Alexis Korner’s raucous rhythm-and-blues collective, Blues Incorporated. Mr. Watts declined the invitation because he was leaving England to work as a graphic designer in Scandinavia, but he joined the group when he returned a few months later.
The newly formed Rolling Stones (then called the Rollin’ Stones) knew they needed a good drummer but could not afford Mr. Watts, who was already drawing a regular salary from his various gigs. “We starved ourselves to pay for him!” Mr. Richards wrote. “Literally. We went shoplifting to get Charlie Watts.”
In early 1963, when they could finally guarantee five pounds a week, Mr. Watts joined the band, completing the canonical lineup of Mr. Richards, Mr. Jagger, the guitarist Brian Jones, the bassist Bill Wyman and the pianist Ian Stewart. He moved in with his bandmates and immersed himself in Chicago blues records.
n the wake of the Beatles’ success, the Rolling Stones quickly climbed from being an electric-blues specialty act to one of the biggest bands in the British Invasion of the 1960s. While Mr. Richards’s guitar riff defined the band’s most famous single, the 1965 chart-topper “(I Can’t Get No) Satisfaction,” Mr. Watts’s drum pattern was just as essential. He was relentless on “Paint It Black” (No. 1 in 1966), supple on “Ruby Tuesday” (No. 1 in 1967) and the master of a funky groove on “Honky Tonk Women” (No. 1 in 1969).
If you live in the U.S. Southwest or northwestern Mexico, you may already be familiar with the annual climate phenomenon called the North American Monsoon, especially since rainfall in some spots has been way above average this summer. In fact, this monsoon may turn out to be the wettest on record for some places! More on that later… Now, let’s take a sojourn through some North American Monsoon basics (1).
What is the North American Monsoon?
The North American Monsoon is a seasonal change in the atmospheric circulation that occurs as the summer sun heats the continental land mass. During much of the year, the prevailing wind over northwestern Mexico, Arizona, and New Mexico is westerly (blowing from the west) and dry. (Going forward, to avoid having to say “northwestern Mexico, Arizona, and New Mexico” over and over, I’ll refer to this area as “the monsoon region.”)
As the summer heat builds over North America, a region of high pressure forms over the U.S. Southwest, and the wind becomes more southerly, bringing moisture from the Pacific Ocean and the Gulf of California. This circulation brings thunderstorms and rainfall to the monsoon region, providing much of their annual total precipitation.
Water vapor animation for the afternoon of August 22, 2018 showing the monsoon circulation and thunderstorm formation (dark blue, green, dark red). Dry air is shown in orange. Climate.gov image of original from Albuquerque, NM National Weather Service office via NOAA
The monsoon starts to develop in Mexico in June, and moves into the U.S. Southwest in July. By early to mid-September, wind patterns have generally reverted back to the westerly pattern, bringing an end to the monsoon. There is some variability in the onset and demise of the monsoon.
What impacts does it have on Mexico and the U.S. Southwest?
Rainfall associated with the monsoon is very important for the region. Northwestern Mexico receives upwards of 75% of its average annual precipitation from it, and Arizona and New Mexico more than 50%, during July–September.
Percent of total annual precipitation occurring during July–September, based on 1979–2020 using CPC Unified rain-gauge-based data. Figure by climate.gov.
For many of us, the word “monsoon” conjures images of heavy rain lasting for months. While that’s often the situation for the Indian monsoon, the monsoon in North America behaves a bit differently. The rainfall generally has a strong diurnal cycle, meaning a daily pattern of mostly dry mornings, storms developing through the day, and most rainfall occurring in the afternoon and evening. Some of these thunderstorms can be strong, delivering heavy rain and frequent lightning. Monsoon rainfall activity tends to be grouped into bursts, with periods of rainy days interspersed with drier periods, rather than rain every day. Also, the occasional eastern Pacific tropical storm can increase monsoon moisture and rainfall.
The impacts of the monsoon go beyond just rainfall amounts. There is also an important relationship between rainfall and temperature: usually, more rain leads to cooler conditions, and less rain leads to hotter conditions. One recent study explored the relationship between the monsoon and wildfires in the Southwest and northern Mexico, finding that monsoon rains were important for ending wildfires.
When was the North American Monsoon discovered?
The rainy season would have been critical for Native Americans for thousands of years, and, for some Native American tribes, continues to be so. Scientists first noted the seasonal rainfall patterns in the Southwest in the early 20th century, with the circulation pattern being understood as monsoonal by midcentury. A couple of field campaigns, including the Arizona-based South-West Monsoon Project (SWAMP, 1993) and the international North American Monsoon Experiment (NAME, 2004), provided a lot of observational data and resulted in a better understanding of the mechanics of the monsoon.
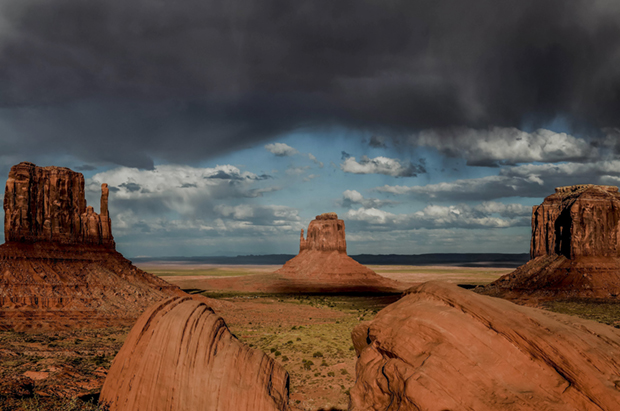
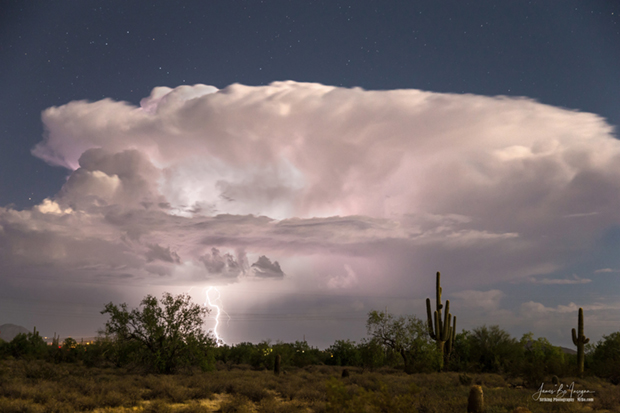
The thunderstorm begins. Photo by Udo S. Title: Monument Valley – Arizona / USA. Taken on September 23, 2017. Used under a Creative Commons license.
What affects the North American Monsoon?
Although there has been a fair amount of research into the monsoon, there are still far more questions than answers about how it works, and if the seasonal amount of rain, potential start date, or other characteristics can be predicted. I listened to the Southwest Climate Podcast from CLIMAS, the Climate Assessment for the Southwest, to learn more about what affects the monsoon and its rainfall, and how Monsoon 2021 is shaping up, and reached out to the podcast co-hosts, Zack Guido and Mike Crimmins, for help with this post.
Rainfall, as anyone who has read the ENSO Blog before will know, is an extremely complicated thing to predict! When you add in the sparse rain-gauge observations available in the U.S. Southwest and Mexico, it becomes even more difficult to make confident statements about the effects of the monsoon and how it can be predicted. In the podcast episode “2021—a generational monsoon?” Zack listed some of the factors that influence how much moisture is available to the monsoon, including the position of the high-pressure area, wind patterns, and transient weather features. Another player is land-surface feedbacks—wetter soils provide more moisture to the air through evaporation.
Zack also mentioned our good friend El Niño! Here at the ENSO Blog, we’re always curious about the role of ENSO (El Niño/Southern Oscillation, the entire El Niño/La Niña system). He pointed out that ENSO does influence Pacific tropical storms, which can supply moisture to the monsoon.
I did a quick comparison of the average July–August rainfall in the monsoon region with the Niño-3.4 index, using 70 years of records. Some earlier studies suggested that El Niño may be related to lower July–August rainfall, and La Niña related to higher rainfall, due to large-scale atmospheric circulation changes. We can see some hints of this relationship in my scatter-plot here.
July–August rainfall anomaly averaged over North American Monsoon region for every year 1950–2019 (y-axis) versus Niño-3.4 index (x-axis). Green dots show years with greater-than-average monsoon rainfall while brown dots show less than average. Monsoon region averaged over all land gridpoints, 20°N–37°N, 102°W–115°W. Data from Global Precipitation Climatology Centre (GPCC) and ERSSTv5. Figure by Emily Becker.
“Hey! But El Niño leads to more tropical storms than average,” you’re saying, because you’re not new here. “How would that result in less total July–August rain?” Good question! And yet another element of the monsoon system that needs more study to resolve.
How is climate change affecting the North American Monsoon?
Likewise, it’s not yet clear how the monsoon is changing in the warming climate, or how it will in the future. Zack and Mike mention that last year was an extremely dry monsoon, and this year is extremely wet. So is climate change increasing monsoon variability? It’s largely too soon to tell. When you take an already highly variable phenomenon like rainfall, add in uncertain regional climate change impacts, and factor in the sparse data record, it gets difficult to make a strong case about exactly how the monsoon rainfall is changing.
However, while the effect of warming on the storms is uncertain, temperatures have been increasing. The warming conditions alone can be impactful, drying out soils quicker during breaks in monsoon rainfall, for example (2).
The recent Intergovernmental Panel on Climate Change (IPCC) Sixth Assessment Report covers observed and potential future changes in the North American Monsoon. Regarding changes that have already occurred, the report finds modest evidence that the monsoon rainfall has intensified since the 1970s, and this has been partly attributed to greenhouse gas emissions. On the other hand, there is not much agreement among projections for future change in the monsoon, except for regarding the timing—most projections suggest that, under continued climate change, the monsoon will start later in the summer and end later in the fall than it currently does (3).
Arizona monsoon cloud with lightning striking the beautiful Sonoran desert in North Scottsdale. Photo by James Bo Insogna. Title: Arizona Monsoon Thunderstorm. Taken on August 15, 2016. Used under a Creative Commons license.
What about this year?
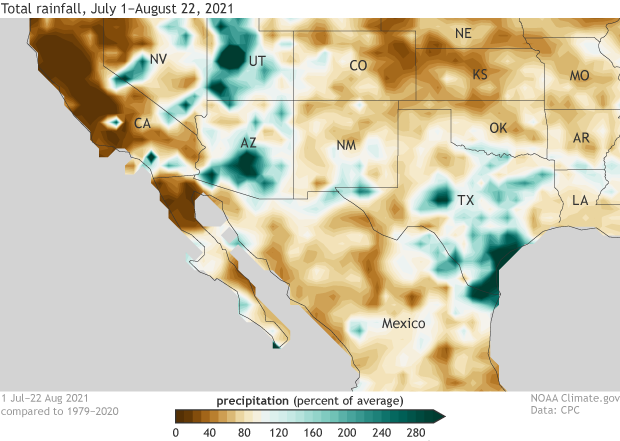
It depends where you are! Zack and Mike described this year’s monsoon for southern Arizona as “generational,” meaning once in a generation. It’s not over yet, but possible that the overall monsoon rainfall in Arizona will end up being the highest on record. Some regions have received more than 200% of the average rainfall, and Tucson recorded its wettest month ever this July. On the other hand, New Mexico and northern Mexico are near or a bit below average.
July 1–August 22, 2021 precipitation shown as a percent of the average July 1–August 22, based on 1979–2020. Brown indicates where precipitation has been less than average; green is greater than average. Figure by climate.gov; data from CPC Unified data.
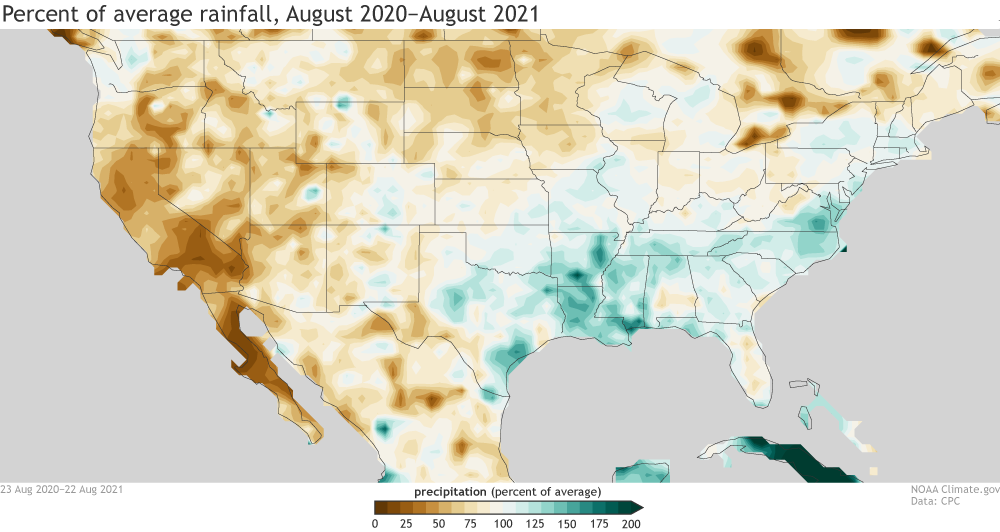
While this will help with the ongoing drought in the southwest, in many regions the precipitation deficit has been building for a long time. The current drought outlooks expect that the drought in Arizona and New Mexico will improve in the short term, but persist. Check out Tom’s recent post on the drought in Arizona to understand more about how drought works in this region.
Precipitation accumulation over the past 12 months, shown as a percent of the average mid-August through mid-August total. Despite the monsoon rainfall this year, much of the region is still in a precipitation deficit. Average is based on 1979–2020 using CPC Unified data. Figure by climate.gov.
Thanks for visiting the North American Monsoon region with me! I’ll be back on my regular beat in a couple of weeks with the September ENSO update. See you then!
Footnotes
(1) The North American Monsoon, published in the Bulletin of the American Meteorological Society by David Adams and Andrew Comrie, provides a comprehensive overview of the North American Monsoon and related research through the late 20th century.
(2) In fact, comparing 1955, a year with very similar total rainfall in Tucson as this year, to this year shows temperature between July 1 and August 23 were on average more than 2 degrees F warmer.
(3) There is a whole lot of interesting detail in this report—about everything, but about the North American Monsoon specifically. I’ve summarized their conclusions above, and include the quotes here, but I suggest you head over to the full science report if you’re in the mood for some specifics. In chapter 8.3, How is the water cycle changing and why?, the report states “In summary, both paleoclimate evidence and observations indicate an intensification of the NAmerM in a warmer climate (medium confidence). The intensification recorded since about the 1970s has been partly driven by greenhouse gas emissions (medium confidence).” In 8.4, What are the projected water cycle changes?, the summary statement is “there is low agreement on a projected decrease of NAmerM precipitation, however there is high confidence in delayed onsets and demises of the summer monsoon.”
The Colorado River at Kremmling in Grand County will enjoy a big bump in flows from August into October as Denver Water pays off a hefty water debt.
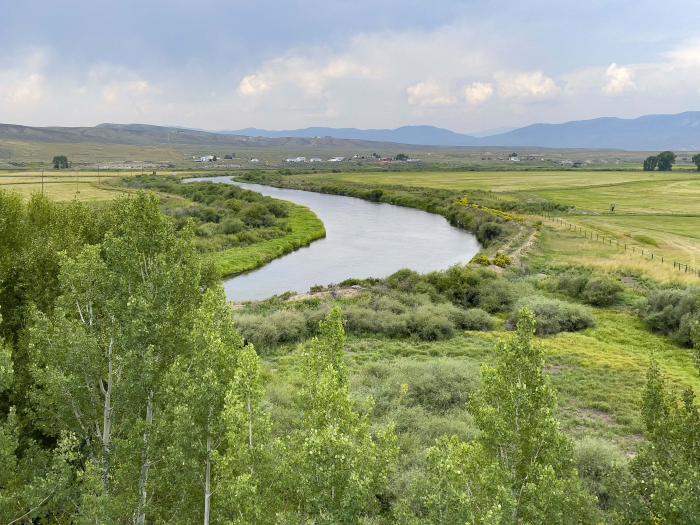
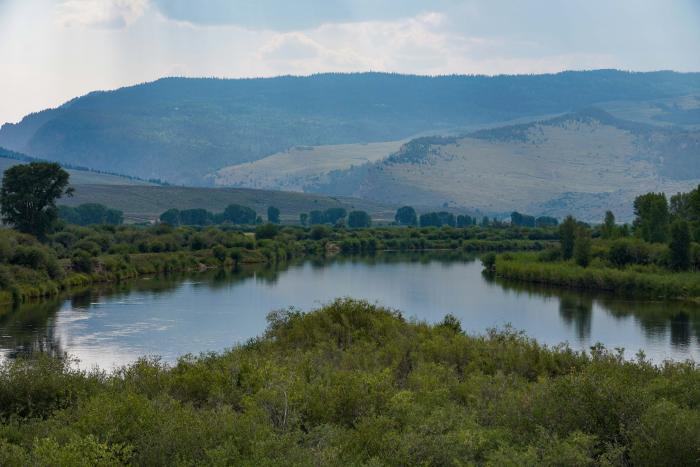
The Colorado River meanders through ranch land near Kremmling on Aug. 17, 2021. The river will see additional flows in late summer and fall as Denver Water sends additional water downstream. Photo credit: Denver Water.
The rising flows — an addition of more than 300 cubic feet per second (more on that later) sent from Wolford Mountain and Williams Fork reservoirs — serve as a good example of how Colorado’s intricate system of water rights can drive river flows higher when they might typically be lower as autumn settles in.
In this case, it works like this: A dry year created conditions that now require Denver Water to “pay back” water to the West Slope.
Why? Let’s stick with the easy version.
An agreement that emerged over 50 years of Byzantine legal fights allows Denver to move water from Dillon Reservoir in Summit County to the Front Range when it needs the water for its customers.
Dillon Reservoir stores water from the Blue River Basin in Summit County for Denver Water customers on the Front Range. Photo credit: Denver Water.
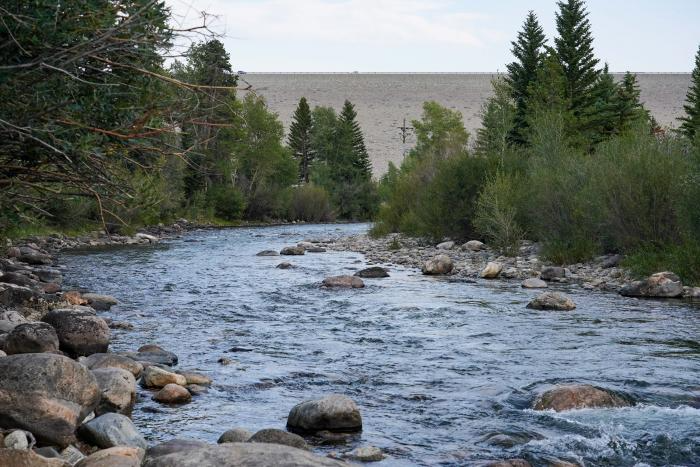
But — and this is a big “But” — if another big reservoir called Green Mountain (that’s the very long reservoir you drive past as you cruise Highway 9 between Silverthorne and Kremmling) — doesn’t fill up in the spring and summer, Denver Water has to make up the difference later in the year.
Green Mountain Reservoir is owned by the U.S. Bureau of Reclamation and located in Summit County north of Silverthorne along the Blue River. Photo credit: Denver Water.
Stay with us here. Take a look at the map that accompanies this story to help.
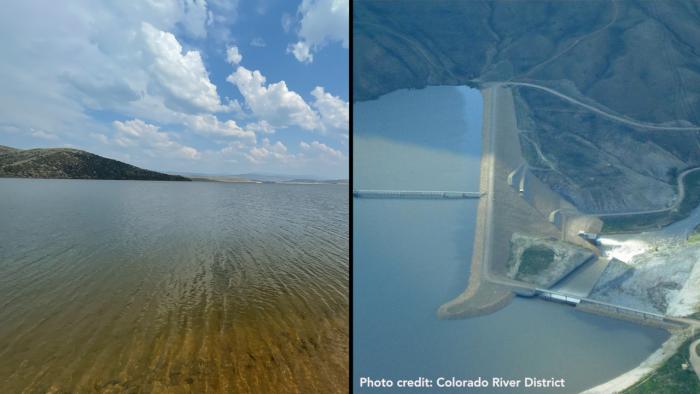
Dillon and Green Mountain Reservoirs are located along the Blue River, which is a tributary of the Colorado River. Water from Wolford Mountain and Williams Fork reservoirs eventually flows into the Colorado River via Muddy Creek and the Williams Fork River respectively. Image credit: Denver Water.
Years like this, when Denver Water has to refund water, are called “substitution” years. There have been big substitution years, when a lot of water is involved in the refund, in dry years such as 2002, 2004, 2012 and 2013.
This year is shaping up as a big one, too; one of the largest. In all, the utility expects to release about 37,600 acre-feet from Williams Fork and Wolford to make up what Green Mountain, a reservoir operated by federal Bureau of Reclamation, lacked this year.
That’s a lot of water — close to the capacity of Gross Reservoir, the big Denver Water reservoir in the foothills northwest of Denver. An acre-foot is roughly enough water to serve three or four households for a year.
Denver Water owns Williams Fork Reservoir (left) and stores water in Wolford Mountain Reservoir (right.) Denver Water uses the reservoirs to fulfill downstream water rights obligation. The water stored in these two reservoirs is not used for drinking water supplies in the Front Range. Photo credit: Denver Water and Colorado River Water Conservation District.
But wait, you say. Water from Williams Fork and Wolford won’t find its way to Green Mountain, since the Green Mountain Reservoir is on the Blue River and those two reservoirs send their water into the Colorado River, not the Blue.
(Also, water can’t flow upstream from the Colorado River into Green Mountain Reservoir. Take another look at the map in this story.)
That’s OK, as the point is to make up for flows in the Colorado River that would otherwise be augmented by releases from Green Mountain. In short, the releases keep the flows moving on the West Slope.
Now, back to those flows. Releases are expected to add an additional 400 cubic feet per second to the Colorado River in August, 320 cfs in September, and then decrease somewhat to an extra 200 cfs in the first two weeks of October.
The confluence of the Blue River (left) with the Colorado River (right), southwest of Kremmling. Muddy Creek, which carries water from Wolford Mountain Reservoir, flows into the Colorado River at this location as well. Photo credit: Denver Water.
How much water is that?
Quite a bit. If you think in terms of gallons (think of the gallon of milk at the grocery story), a cubic foot contains about 7.5 gallons. So 300 cubic feet per second means about 2,250 gallons of water per second added to the river flows. (Think about that many milk jugs floating by each second).
While it’s a lot of water to pay back — and it means Denver Water will need to draw down its supplies in Wolford and Williams Fork quite a bit — it could have been even more.
But a wet spring on the Front Range kept sprinklers off and demand low. Monsoons returned this year as well, boosting flows on both sides of the Continental Divide. All of that allowed Denver Water to reduce what it moved from Dillon Reservoir, through the Roberts Tunnel, to the Front Range.
Which, in turn, allowed a bit more water down the Blue River and into Green Mountain and reduced the “substitution” amount to be repaid.
The Blue River below Dillon Dam in Summit County on Aug. 16, 2021. Denver Water uses the dam to store and release water from the Blue River. Photo credit: Denver Water.
If you’ve stuck with us until now, we raise a toast to you, salute your interest in a puzzling topic, and hope that this boost in late season flows in the Colorado River brings a smile to all of us inspired by the beauty of a moving stream.
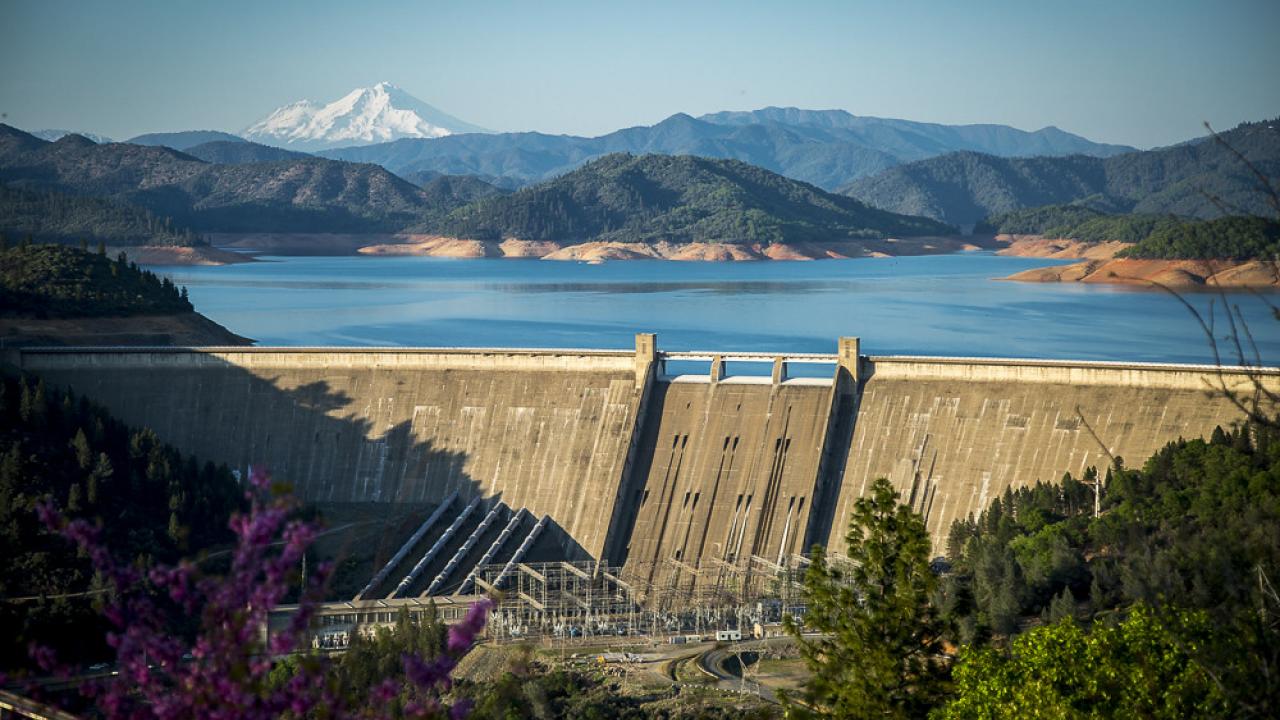
Shasta Dam, north of Redding in California, is the only dam in the state a UC Davis study identified as being capable of replicating natural cold-water patterns for aquatic species. (Ron Lute/cc BY-NC 2.0)
Knowing where cold water is likely to stay cold is critical for conservation. But “cold” is more than just a number on a thermometer. Dams do not adequately support cold-water ecosystems.
Dams poorly mimic the temperature patterns California streams require to support the state’s native salmon and trout — more than three-quarters of which risk extinction. Bold actions are needed to reverse extinction trends and protect cold-water streams that are resilient to climate warming, according to a study published in the journal PLOS ONE by the University of California, Davis.
The study helps identify where high-quality, cold-water habitat remains to help managers prioritize conservation efforts.
“It is no longer a good investment to put all our cold-water conservation eggs in a dam-regulated basket,” said lead author Ann Willis, a senior staff researcher at the UC Davis Center for Watershed Sciences and a fellow for the John Muir Institute of the Environment. “We need to consider places where the natural processes can occur again.”
Joe Proudman / UC Davis on the Little Shasta River, outside of Montague, Calif. on May 19, 2017.
The uncommon cold
Understanding where cold water is likely to stay cold is critical for conservation. But “cold” is more than just a number on a thermometer. The term represents the many factors that combine to create cold water capable of supporting aquatic ecosystems.
Water managers deliver cold water from reservoirs to streams to support aquatic life. But Willis said this assumes that all cold water is the same — akin to giving blood to another person without understanding their blood type and health status.
While previous studies have suggested that dams can be operated to achieve ideal temperatures, few tested that hypothesis against the temperature patterns aquatic ecosystems need.
The UC Davis study assessed stream temperature data from 77 sites in California to model and classify their “thermal regimes,” or annual temperature patterns. It found the state’s reservoirs do not adequately replicate natural thermal patterns, making them incapable of supporting cold-water species effectively.
“I’m an engineer; I thought we could operate ourselves into success, but the science doesn’t support that,” Willis said. “It’s not a question of whether we remove a dam, but which dam, and how we need to restructure how we manage water. Or we need to be willing to take responsibility to be the generation that says, ‘OK, we’re letting this ecosystem go extinct.’”
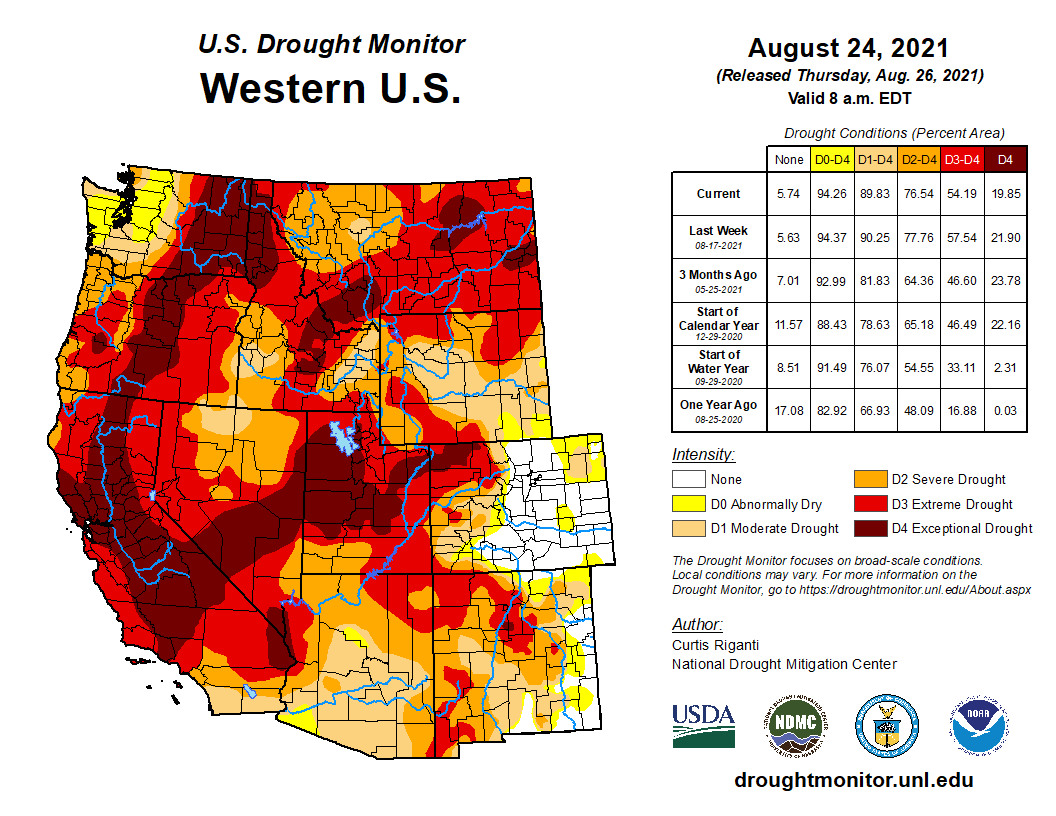
West Drought Monitor August 24, 2021.
What about the drought?
Drought often tempts people to double-down on hard-infrastructure solutions for water storage.
“We falsely equate dams with water security,” Willis said. “More storage does not mean more water. A giant, empty refrigerator doesn’t help you if you’re starving. The same is true for water.”
Of California’s 1,400 dams, only one very large and highly engineered dam — Shasta — stood out in the study as replicating natural cold-water patterns.
The study does not suggest removing all dams. However, considering removing “deadbeat dams” where there are critical ecosystems could help restore natural processes and support fish, people and biodiversity amid climate warming.
Mill Creek, a spring-fed creek that flows from the base of Mt. Lassen to the Sacramento Valley, is an important cold-water stream. (Ann Willis/UC Davis)
Cold comfort
Key cold-water conservation candidates include streams highly influenced by groundwater, such as in the Cascade Range, and places where water easily infiltrates the soil, such as Northern California’s Feather River.
“Classifying these streams and understanding their thermal regimes is an effective way to focus our time and money on the places most likely to make a difference,” Willis said.
The study’s co-authors include Ryan Peek and Andrew Rypel of the UC Davis Center for Watershed Sciences.
Funding for this research was provided by internal support from the UC Davis Center for Watershed Sciences and the John Muir Institute of the Environment.