This winterโ€™s [2022-2023] rain and snow wonโ€™t be enough to pull the West out of #drought — KUNC #snowpack #ColoradoRiver #COriver #aridification

Click the link to read the article on the KUNC website (Alex Hager). Here’s an excerpt:

โ€œEverybody is so eager to make an early call on this,โ€ said Brad Udall, a water and climate researcher at Colorado State University. โ€œInvariably, you’ll get caught with your pants down if you think you know what’s going to happen.โ€

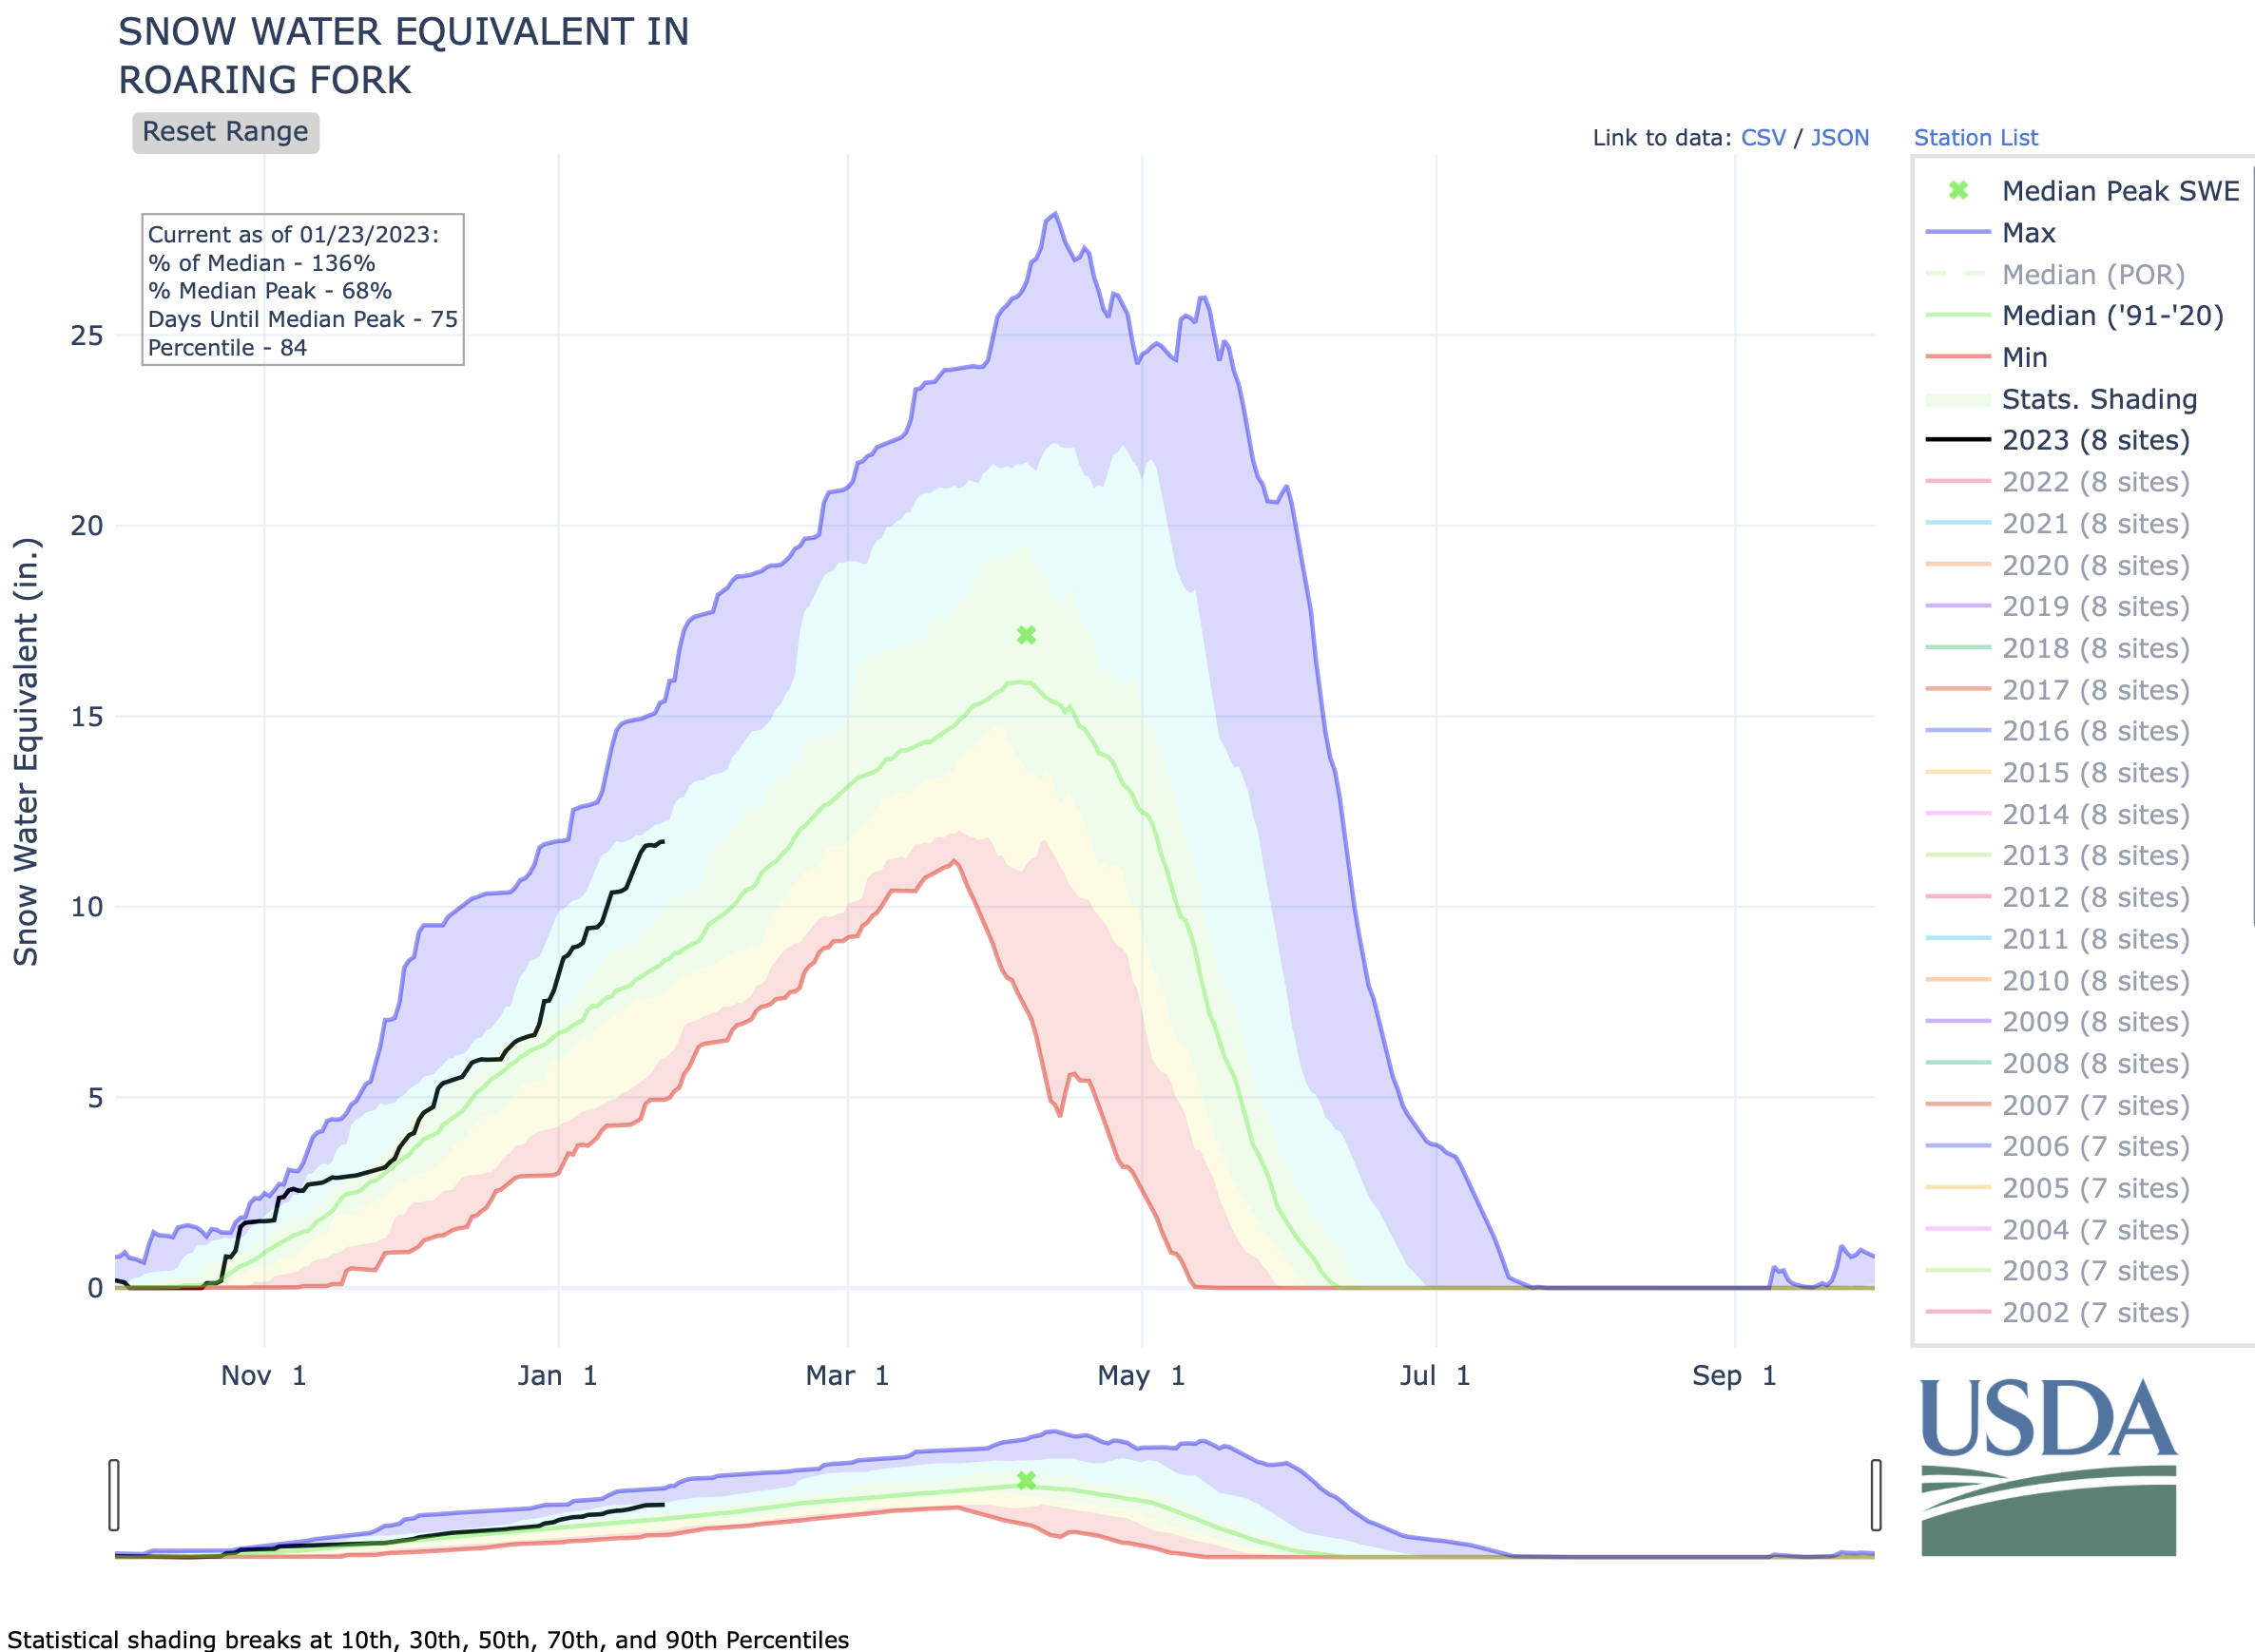
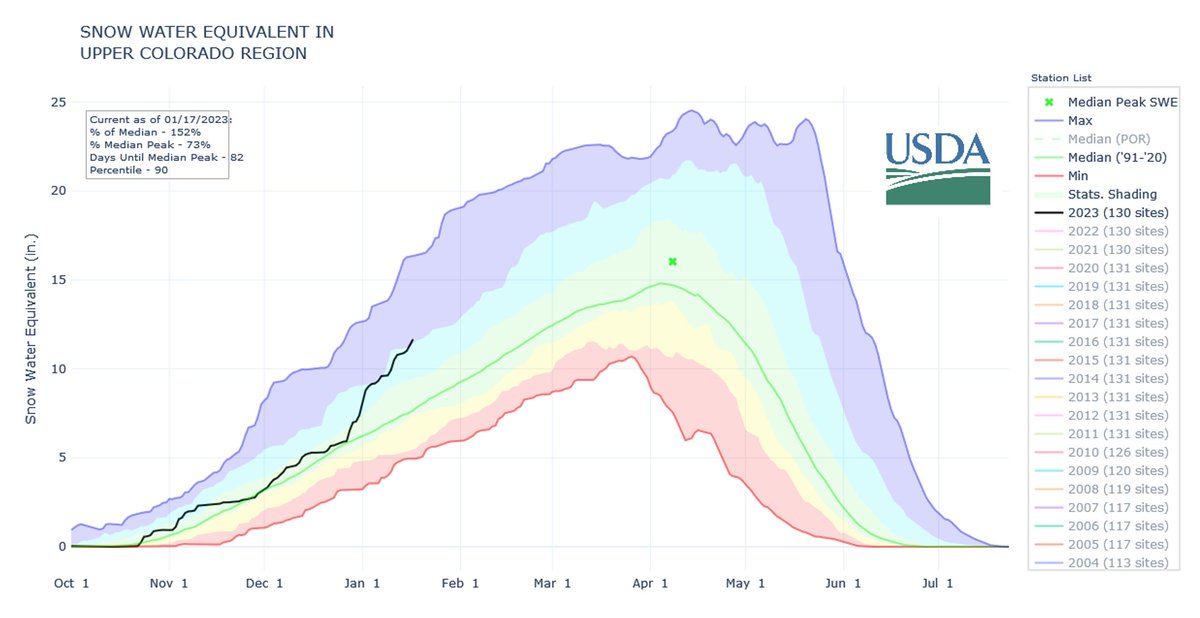
Meanwhile, mountain snow totals are off to a promising start. Around Snowmass, the snowpack is 130% above average for this time of the year. The Roaring Fork watershed, which includes Aspen and Snowmass, makes up only 0.5% of the landmass in the Colorado River basin but provides about 10% of its water. In other nearby mountain ranges, snow totals are between 140% and 160% above average. Even if those numbers persist until spring, the severity of the Colorado Riverโ€™s drought means many more years of heavy snow are needed to make a serious dent.

โ€œIt’s great to see a big snowpack,โ€ Udall said. โ€œWe would need five or six years at 150% snowpack to refill these reservoirs. And that is extremely unlikely.โ€

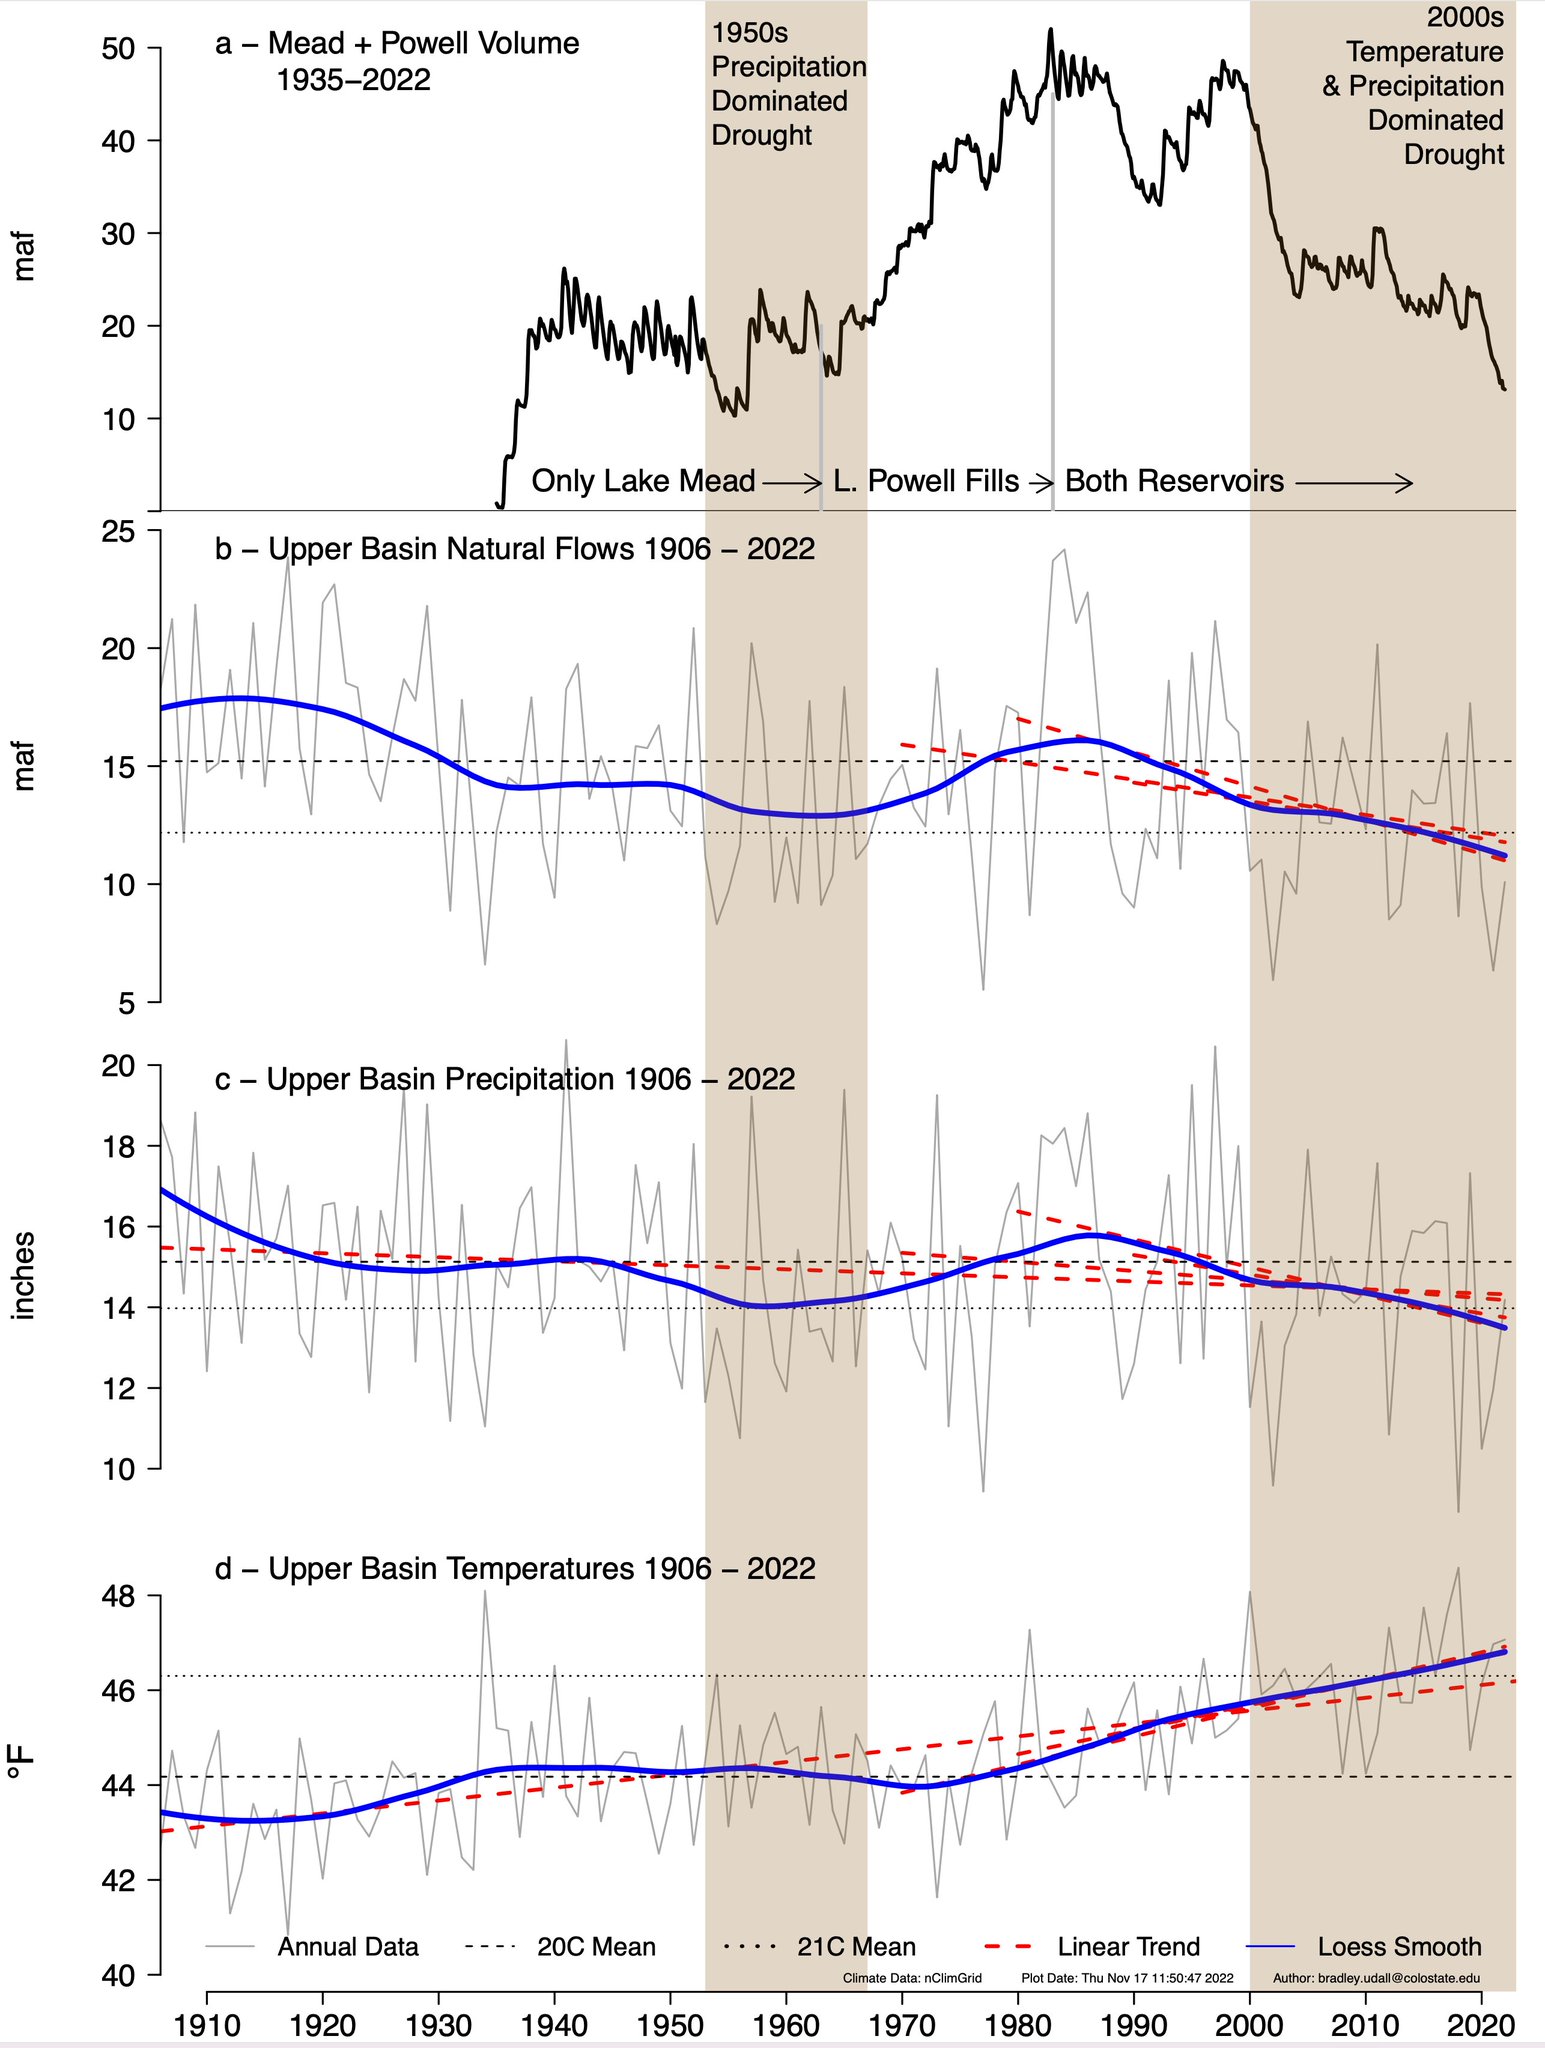
A string of wet years is unlikely because of rising temperatures driven by climate change, Udall said. Since 1970, temperatures in the Colorado River Basin have gone up by three degrees Fahrenheit. Those higher temperatures have already caused a 15% dropoff in streamflows across the region…Warming has driven aย raft of worrying environmental changesย across the region. In recent years, scientists have sounded the alarm about soils drying out. The ground has become parched andย soaks up snowmeltย before the water has a chance to reach the places where people divert and collect it. Already, Udall said, winters with 90% of average snowpack have led to springtimes with only 50% runoff because thirsty soil acts like a sponge.

Updated Colorado River 4-Panel plot thru Water Year 2022 showing reservoirs, flows, temperatures and precipitation. All trends are in the wrong direction. Since original 2017 plot, conditions have deteriorated significantly. Brad Udall via Twitter: https://twitter.com/bradudall/status/1593316262041436160

Three New Projects to Protect #Water Supplies for Over a Million Coloradans — #Colorado State Forest Service

Click the link to read the release on the Colorado State Forest Service website:

There is a critical connection between clean drinking water and forests. For 80 percent of Coloradans, their water starts in the stateโ€™s forests before making its way downstream to their taps.

Given this connection, it is important for Colorado to protect its forested watersheds from the ever-present threat of wildfire to ensure residents and communities have water for drinking, agriculture and other uses. The Colorado Legislature recognizes this need and passed House Bill 22-1379 during the 2022 legislative session to fund projects that reduce wildfire fuels around high-priority watersheds and water infrastructure.

Today, the Colorado State Forest Service announces three projects funded through HB22-1379 that will reduce the risk wildfire poses to water supplies for more than a million Coloradans.

โ€œWe are excited to put these funds provided by the legislature to work in high-priority areas where an uncharacteristic wildfire could significantly impact water supplies and infrastructure,โ€ said Weston Toll, watershed program specialist at the CSFS. โ€œAll three projects connect to prior fuels reduction work completed by the CSFS and our partners, so we can make an impact on a large scale in our forests.โ€

The CSFS received $3 million through HB22-1379 to fund forest management in critical watersheds and has allocated $1 million each to three projects in these locations:

Staunton State Park, Colorado. CSFS Photo.

Staunton State Park, Park and Jefferson counties

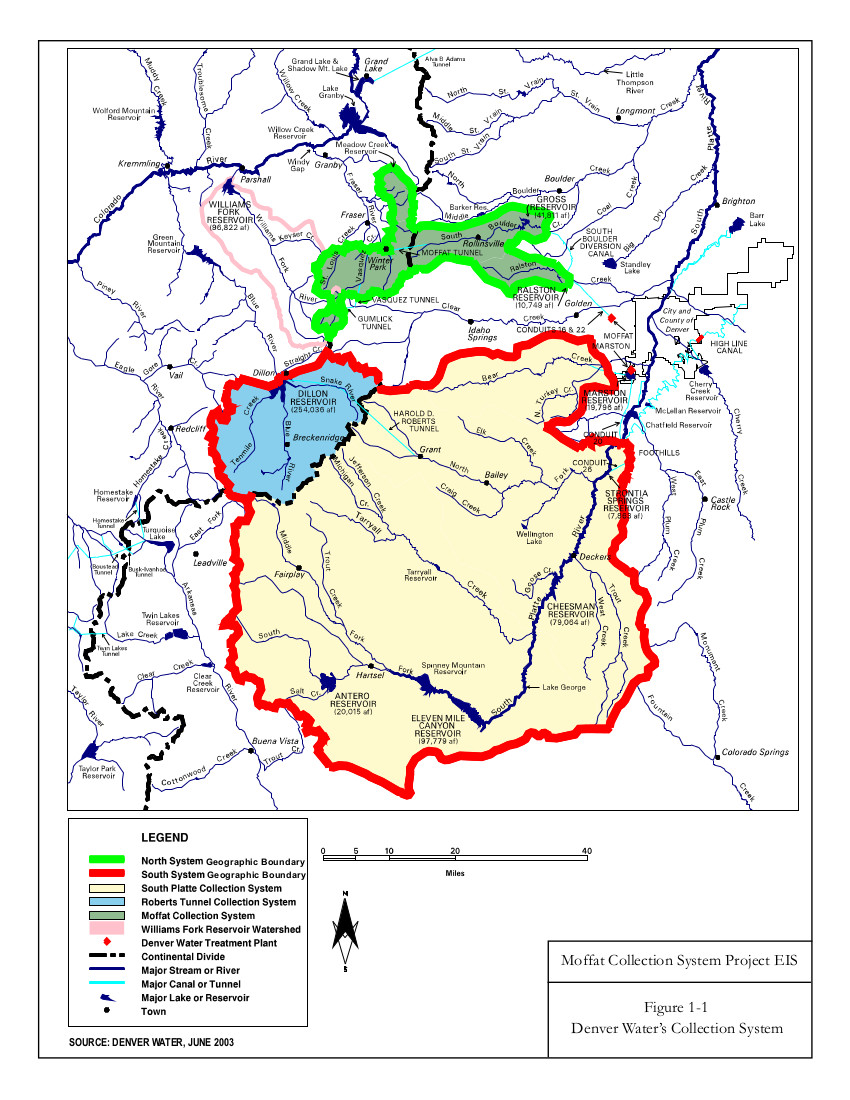
The project in Staunton State Park will build upon more than 800 acres of prior fuels treatments to reduce the impact a wildfire could have to water resources, communities, outdoor recreation areas and wildlife habitat. Creeks running through the park feed into the North Fork South Platte River, which flows into Strontia Springs Reservoir. Eighty percent of Denver Waterโ€™s water supply moves through Strontia Springs Reservoir.

This area, about 6 miles west of Conifer, is noted as a priority for action in assessments by the CSFS, Denver Water, Upper South Platte Partnership, Elk Creek Fire Protection District and in local Community Wildfire Protection Plans. It is also in a focus area for the Rocky Mountain Restoration Initiative.

โ€œThis project will allow us to get into areas of the park we havenโ€™t been able to treat yet,โ€ said Staunton State Park Manager Zach Taylor, โ€œto reduce the risk of a wildfire spreading from the park to adjacent neighborhoods. The project also reduces wildfire risk to creeks in the park and the entirety of the drainage.โ€

Taylor said that the park has worked alongside neighbors in the area, including private landowners and the U.S. Forest Service, to address wildfire fuels since the park was acquired in the 1980s.

โ€œStaunton State Park lies between all of these communities,โ€ he said. โ€œThis project could set up the park for the next 5 to 10 years in helping us meet our goals for fuels reduction.โ€

Teller County, Colorado. CSFS photo.

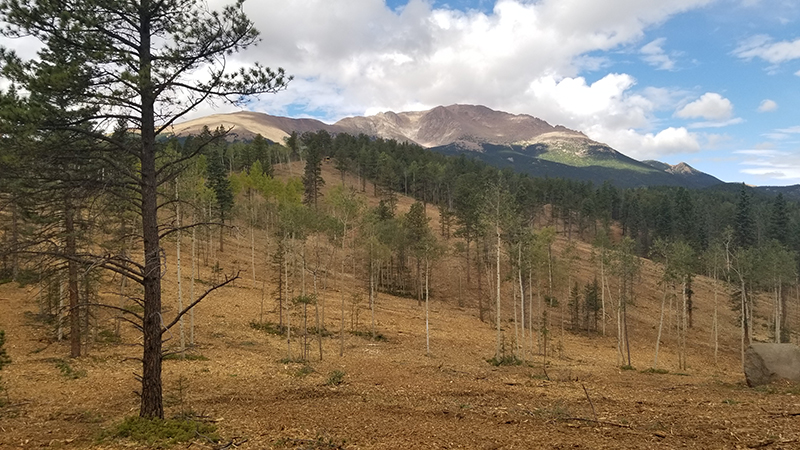
North Slope of Pikes Peak, Teller County

The project on the North Slope of Pikes Peak will help protect essential drinking water and water infrastructure for the City of Colorado Springs. Reservoirs on the North Slope provide about 15 percent of the cityโ€™s drinking water supply. Work there will add to more than 3,500 acres of prior fuels treatments on Colorado Springs Utilitiesโ€™ municipal lands and fill an important gap in treated areas around North Catamount Reservoir and the headwaters of North Catamount Creek. It will also help protect infrastructure that conveys water from the utilityโ€™s Blue River collection system to the reservoir.

The Pikes Peak Watershed is noted as a high priority area in plans by the CSFS, U.S. Forest Service and Colorado Springs Utilities. It is also in a focus area for the Rocky Mountain Restoration Initiative.

โ€œColorado Springs Utilitiesโ€™ 34-year-long partnership with the Colorado State Forest Service has enabled many beneficial forest management activities that reduce the risks and impacts of wildfire in and adjacent to our watersheds,โ€ said Jeremy Taylor, forest program manager with Colorado Springs Utilities. โ€œThrough the Pikes Peak Good Neighbor Authority (GNA), weโ€™ve expanded this collaboration to include the U.S. Forest Service for cross-boundary work, and weโ€™re now embarking on the Big Blue project on the North Slope of Pikes Peak. Itโ€™s a valued partnership that prioritizes working together to improve forest health and protect our water resources, public lands and neighboring private lands.โ€

Sheep Mountain, Grand County, Colorado. CSFS Photo.

Fraser Valley, Grand County

The project in the Fraser Valley will lower the risk of wildfire to water supplies for Denver and the towns of Fraser and Winter Park by reducing fuels on U.S. Forest Service, Denver Water and private lands. It connects to several prior treatment areas to establish a connected, large-scale fuel break that could allow firefighters to engage a wildfire in the event of a fire. During the Williamโ€™s Fork Fire in 2020, the project area was identified as where a wildfire could spread into the densely populated Fraser Valley.

The Grand County Wildfire Council identified the project area as a high priority through planning efforts by the CSFS, USFS, Bureau of Land Management, Denver Water, Grand County and local fire departments.

โ€œThese projects are critical for watershed health and source water protection for Denver Water and our 1.5 million customers. Healthy forests equal healthy watersheds,โ€ said Christina Burri, watershed scientist with Denver Water. โ€œDenver Water is so grateful for the partnerships and collaboration that make these projects possible.โ€

The CSFS expects work on these projects to begin in 2023 and will monitor the project work in future years to evaluate its impact and efficacy. All three projects allow the CSFS and its partners to achieve goals and enact strategies identified in the 2020 Colorado Forest Action Plan and are in areas identified as priorities in the plan.

โ€œGovernor Polis and the Colorado legislature have made tremendous investments to protect our watersheds from the increasing threat of wildfires and the Colorado State Forest Service is at the forefront in moving these projects forwardโ€, said Dan Gibbs, executive director of the Colorado Department of Natural Resources. โ€œThe three projects announced today build on existing efforts to increase resiliency and make impactful investments in key watersheds to create healthier forests and reduce the threat of future wildfires.โ€

โ€œThank you to the Colorado Legislature for making the $3 million available for this important work and to our many partners for working alongside the Colorado State Forest Service on these projects,โ€ Toll said. โ€œTogether, we are making a landscape-level impact and leveraging our collective resources toward the goal of lowering wildfire risk to water supplies and protecting one of our stateโ€™s most precious resources.โ€

The San Juan Mountains receive 52 inches of snow, schools close — The #PagosaSprings Sun #snowpack #SanJuanRiver #ColoradoRiver #COriver #ardification (January 22, 2023)

Click the link to read the article on the Pagosa Springs Sun website (Josh Pike). Here’s an excerpt:

Heavy snows came to Pagosa Country this week, causing Archuleta School District to call snow days on Jan. 17 and 18, among other disruptions. Sites in Archuleta County received between 22.4 and 35.6 inches of snow in the storms be- tween Saturday Jan. 11 and Jan. 18, according to the Community Collaborative Rain Hail and Snow Network website. Snowfall totals varied throughout the county, with the highest amount reported near Village Lake. A report from Wolf Creek Ski Area indicates that Wolf Creek had received 16 inches of snow in the previous 24 hours and 52 inches from the latest storm as of approxi- mately 6 a.m. Jan. 18, bringing the midway snow depth to 106 inches and the year-to-date snowfall total to 219 inches.

According to the U.S. Depart- ment of Agriculture National Water and Climate Centerโ€™s snowpack report, the Wolf Creek summit, at 11,000 feet of elevation, had 22.2 inches of snow water equivalent as of 11 a.m. on Wednesday, Jan. 18.

The Wolf Creek summit was at 131 percent of the Jan. 18 snowpack median.

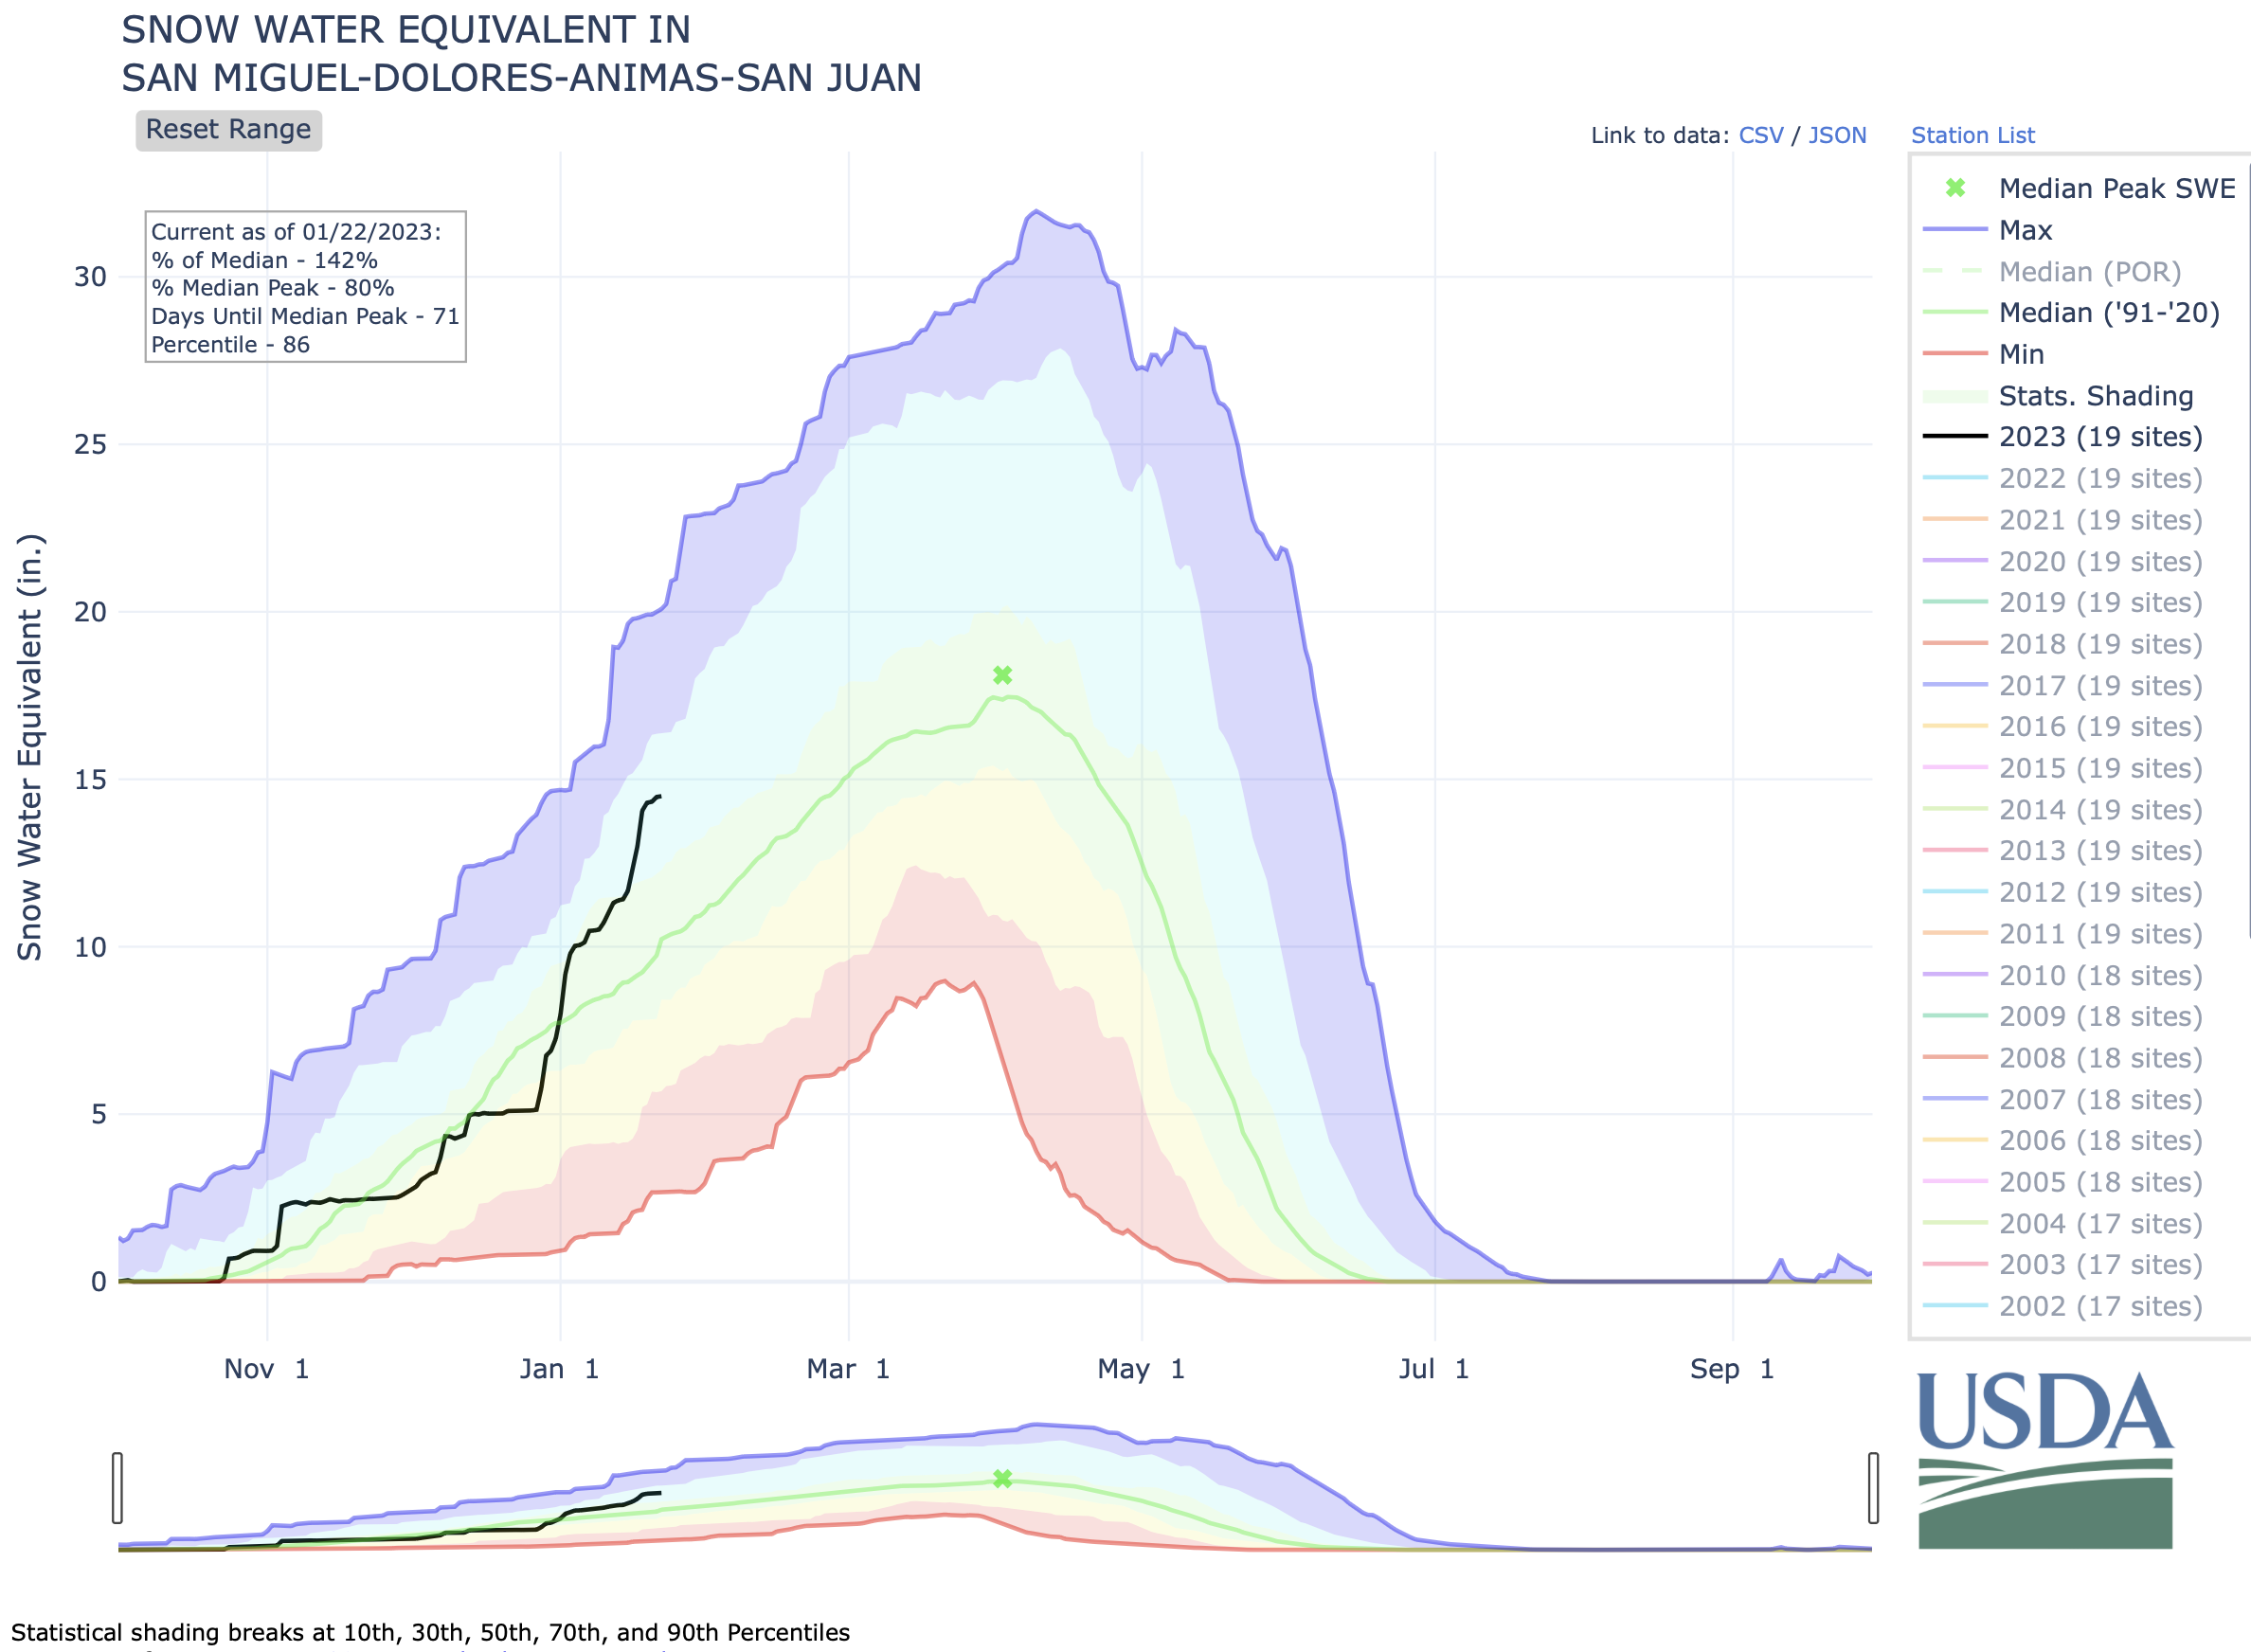
The San Miguel, Dolores, Animas and San Juan river basins were at 152 percent of the Jan. 18 median in terms of snowpack.

85 News Stories Were Written About #Denverโ€™s Record-Breaking December Cold Snap, Only 4 Mentioned #ClimateChange — The #Colorado Times Recorder #ActOnClimate

Click the link to read the article which originally appeared on the Colorado Times Recorder website (Sean Price):

On Dec. 21, 2022, the temperature at Denver International Airport dropped 37ยฐ F (from 42ยฐ to 5ยฐ) in one hour, the largest recorded hourly drop in Denver in the National Weather Serviceโ€™stracking history.

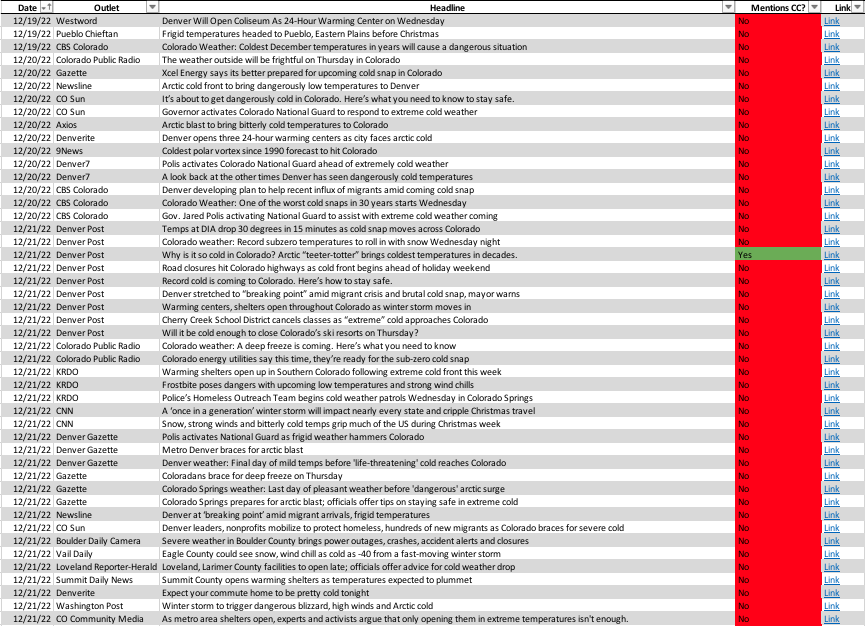
A Colorado Times Recorder analysis of 85 news articles written about the record-breaking cold snap in Denver and surrounding areas found only four that mentioned climate change.

This is in spite of the fact that climatologists say such temperature dives are consistent with unusual weather patterns that are expected as part of a warming climate.

Click here to access the above spreadsheet, which includes links to the articles mentioned.

Our analysis reviewed articles written by local, statewide, and national publications that referenced the cold snap in Denver, even if the articles were not exclusively focused on the event. For example, an article in the Washington Post headlined โ€œWinter storm to trigger dangerous blizzard, high winds and Arctic cold,โ€ published on Dec. 21, served as a national roundup for many of the various extreme cold events in the U.S., but specifically mentioned Denverโ€™s unusual cold rush. For that reason, we included articles like that from national outlets in our analysis. The Washington Post story did not mention climate change or global warming.

Of the four stories about the cold snap that reference climate change, three were published by the Denver Post. The other story was published by Axios and written by climate and energy reporter Andrew Freedman. The Axios story, headlined โ€œโ€™Historicโ€™ winter storm and Arctic blast sweep across the U.S.โ€ discussed the storm from a national perspective but did discuss the Denver cold snap as well as global warmingโ€™s impact on extreme weather.

The three Denver Post stories were written by reporters Bruce Finley and Sam Tabachnik, respectively, and were published between Dec. 21 and 22. Finley wrote two of the articles.

The Colorado Times Recorder asked Tabachnik why he decided to include a discussion on climate changeโ€™s effect on extreme weather events in his story.

โ€œI think itโ€™s important for reporters to mention climate change when they write about extreme weather to give readers the context that these events are more likely to occur as the planet warms,โ€ Tabachnik said. โ€œThis is not a โ€˜both sidesโ€™ topic.โ€

In one of those stories, National Weather Service meteorologist Russell Danielson explained to the Denver Post that unusually warm air near the North Pole pushed cold air south towards Denver, which contributed to the cold snap along with other factors such as high-level wind.

โ€œWhen you dislodge that cold air, it has to go somewhere,โ€ Danielson told the Post in a December interview. โ€œIt is a teeter-totter. โ€ฆ It is quite amazing at the moment โ€” definitely an anomalous pattern. With climate change, we do expect more weather extremes. They are one thing we can expect more of going forward.โ€

Extreme weather events have increased in recent years across the globe, mostly due to climate change caused by carbon pollution from humans โ€” though scientists point out that itโ€™s not possible to conclude that a single weather event, like an extreme cold snap, is caused by climate change. A report from the environmental advocacy group EarthJustice discussed research that found that while rising global temperatures are decreasing the length of winters, they are increasing the severity of winter storms.

Dec. 21โ€™s cold snap ranks as one of the most severe in Colorado history. DIA plunged to -24ยฐ F at one point, just 18 hours after being 51ยฐ F. That 75ยฐ temperature swing is a state record over that amount of time. One Twitter user who took a video of the visible cold front coming into Denver claimed that where he was, the temperature dropped 30ยฐ F in just over five minutes.

Several articles from Colorado media outlets focused on issues migrants and members of the homeless population in the state faced during the cold snap, including providing information on warming shelters in the area. Studies have found that climate change disproportionally affects marginalized communities, the homeless, and citizens of the global south.

This question โ€” asking how journalists should cover extreme weather events in relation to climate change โ€” is not a new one in Colorado.

In 2020, Corey Hutchins, Colorado College journalism instructor and author of the Inside the News in Colorado newsletter, wrote about how Colorado media outlets covered that yearโ€™s devastating wildfire season. Specifically, Hutchins interviewed journalists who explained the difficult position they are placed in: how to break news about an emergency (Colorado wildfires) while also placing said emergency in a broader context (how global warming contributes to harsher wildfire seasons in Colorado).

The Colorado Times Recorder asked Angie Chuang, a former reporter and current journalism professor at the University of Colorado Boulder about this dynamic.

โ€œWhile I canโ€™t speak for all journalists and organizations, I think itโ€™s safe to say that most U.S.-based mainstream organizations donโ€™t find the fact that climate change is affecting or causing extreme weather events controversial,โ€ Chuang said. โ€œThe impact is real, and the human costs are as well. However, as specific events are breaking, there usually isnโ€™t real-time information about the degree to which scientists, meteorologists, etc., can discern exactly how much a storm, cold snap, disaster, etc., is due to climate change vs. other factors. In the absence of that information, some reporters may opt to not mention that larger context.โ€

Chuang also explained her resistance to extreme weather coverage that reduces climate change as something that caused a specific event, as well as her view that journalists try to not frame the issue as whether or not they mention climate change in an article (as we did in our media analysis).

โ€œIโ€™d suggest that journalists not frame the issue as mentioning climate change vs. not mentioning climate change because the dichotomy relies on some determination that may be difficult to make on deadline about the root causes of the severity of the weather event,โ€ Chuang explained. โ€œAlso, if we make โ€˜mention climate changeโ€™ the default practice, then we risk just that โ€” the issue is reduced to a mention, the news equivalent of a hashtag, without examining deeper issues. Instead, Iโ€™d suggest climate change as an essential piece of contextual reporting all reporters covering weather events should consider and fully investigate โ€” if not on deadline, then in follow-up stories.โ€

Chuang had a suggestion for how journalists can handle the balancing act of covering a breaking news event with ensuring the climate change aspect is not ignored.

โ€œBeyond mentions, Iโ€™d urge journalists to look at climate change as a broader phenomenon that continues to exist and affect people and the environment whether or not a single event is โ€˜due toโ€™ it,โ€ Chuang said. โ€œSo if we look at a cold snap, the contextual reporting should address, โ€˜as temperature extremes likely become more common, who will likely be most impacted?โ€™ (Spoiler alert: People with the fewest resources, who are already vulnerable.) The question of whether the event is due to climate change likely should be reported in a more in-depth way that looks at extremes over time and their impact over time, rather than focusing on a single event. That ongoing reporting, ideally, can be referenced during breaking news events, but should allow journalists to provide more information than a simple mention.โ€

Covering Climate Now, which partners with over 500 news outlets worldwide, published an in-depth explainer for journalists and newsrooms to improve their climate crisis coverage. It contains tips on how to better incorporate climate change into their coverage of extreme weather events.

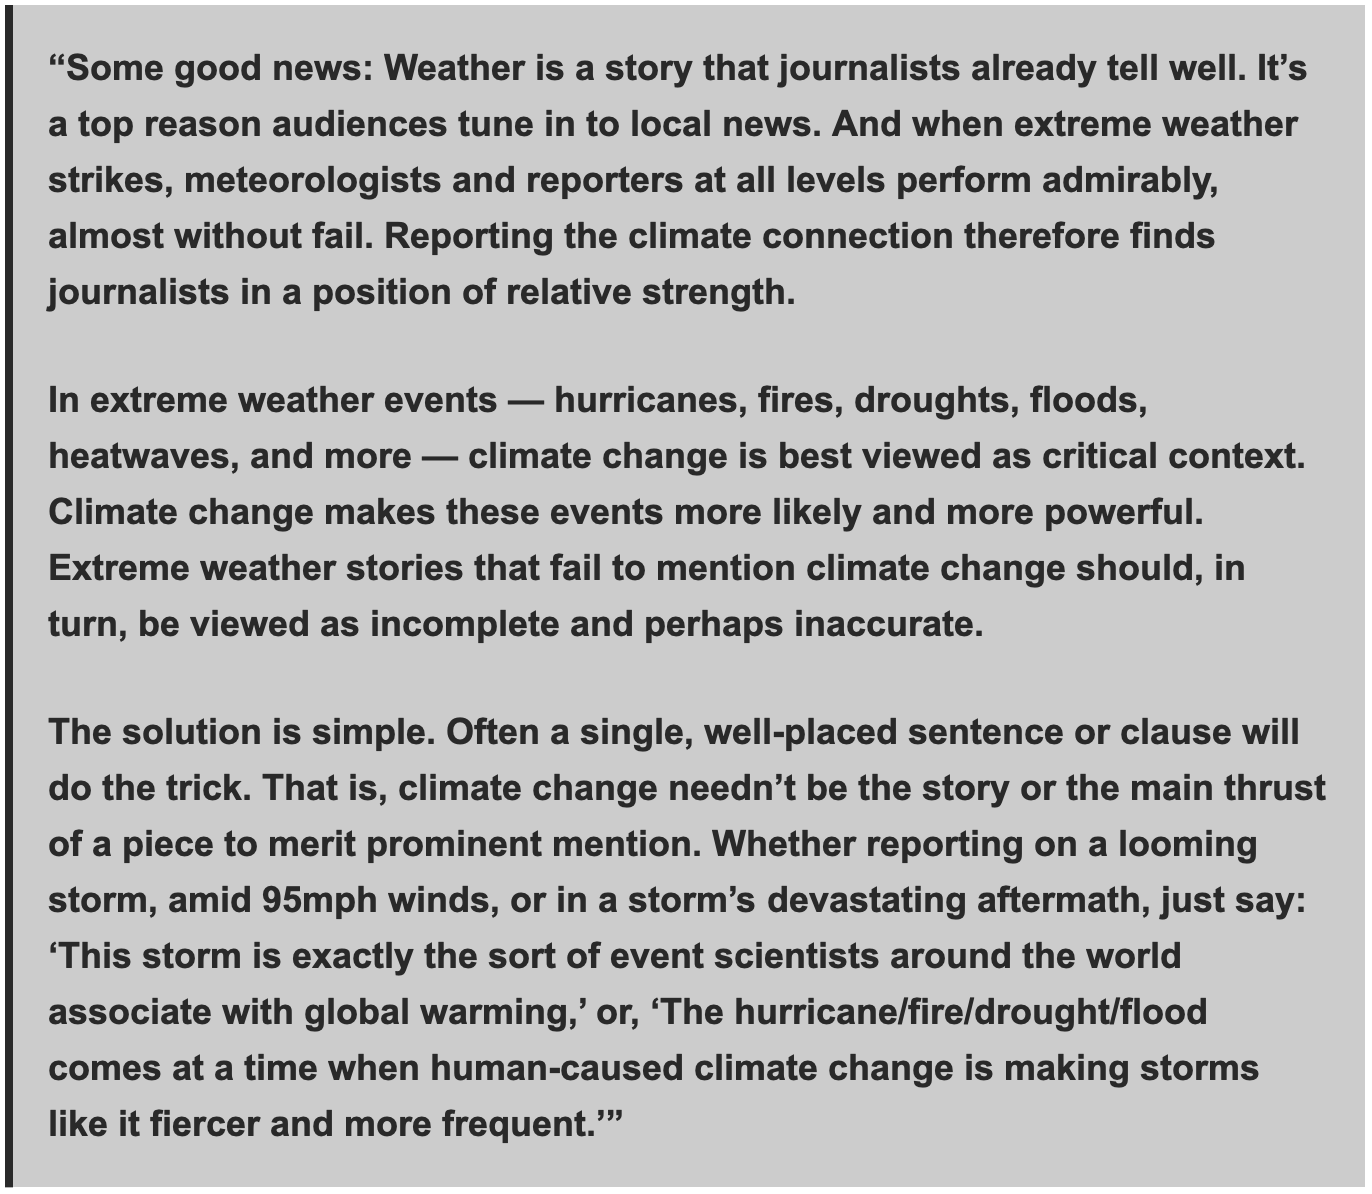
The explainer states that โ€œextreme weather stories that fail to mention climate change should, in turn, be viewed as incomplete and perhaps inaccurate.โ€

From the explainer:

National Public Radio and Nieman Reports have also published handy guides for journalists when covering the climate crisis.

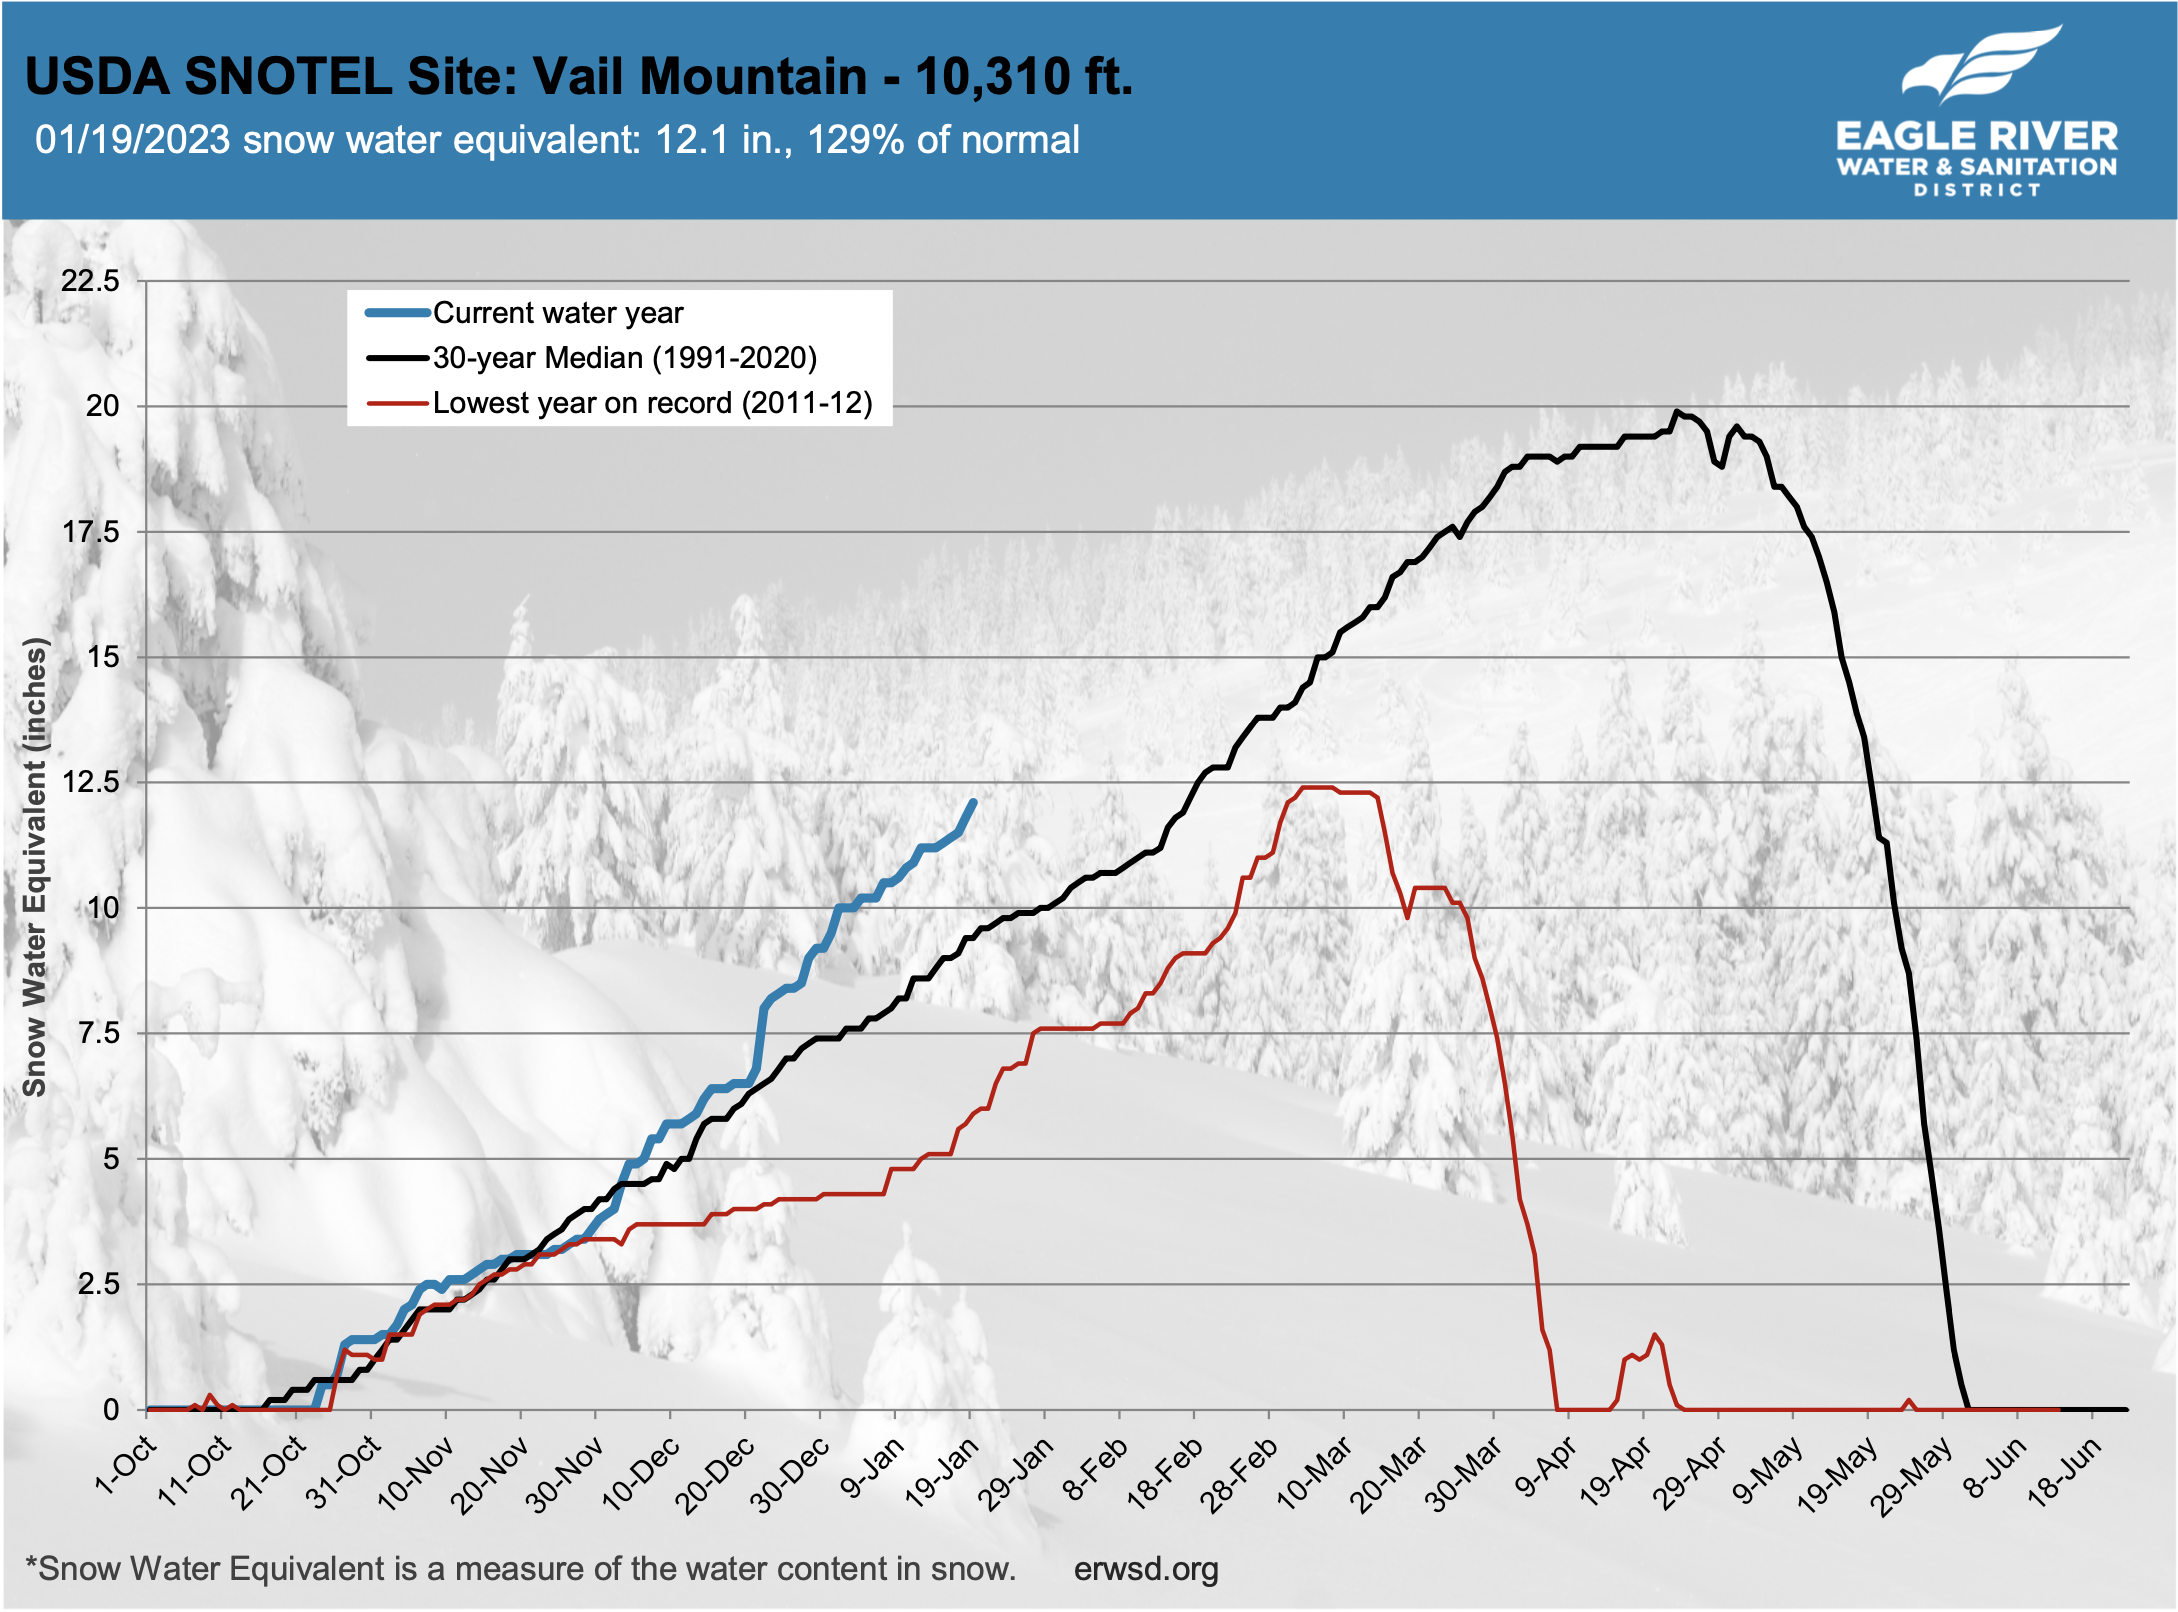
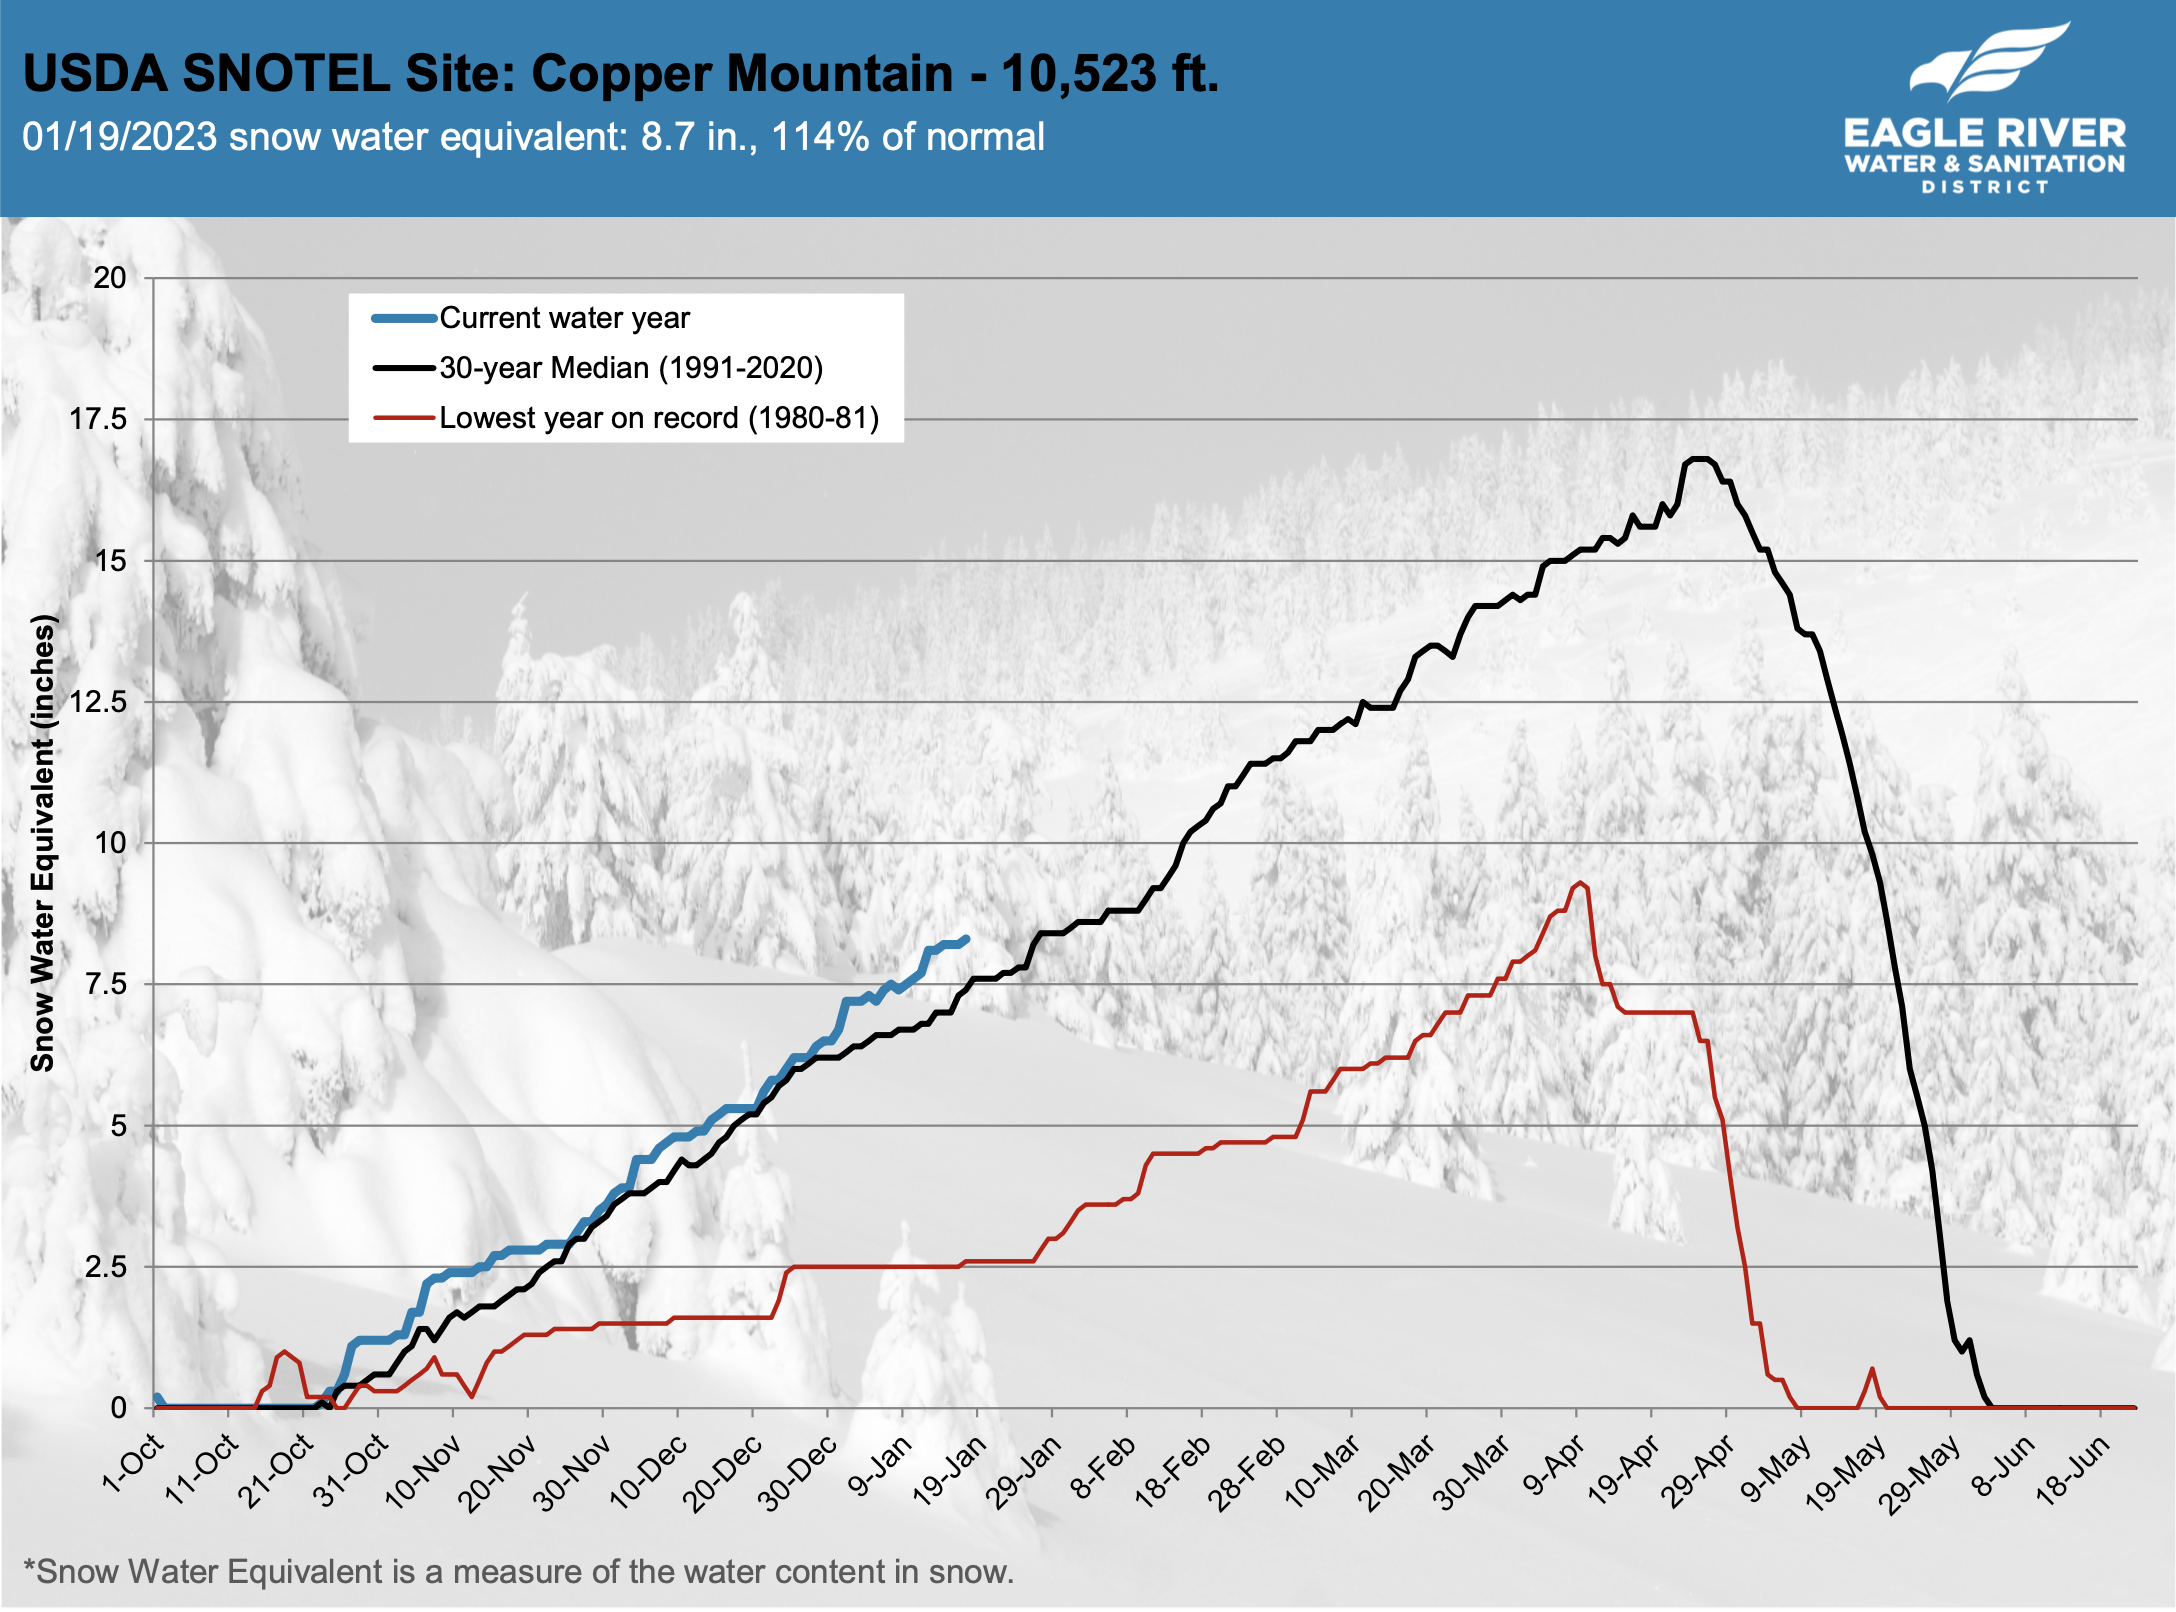
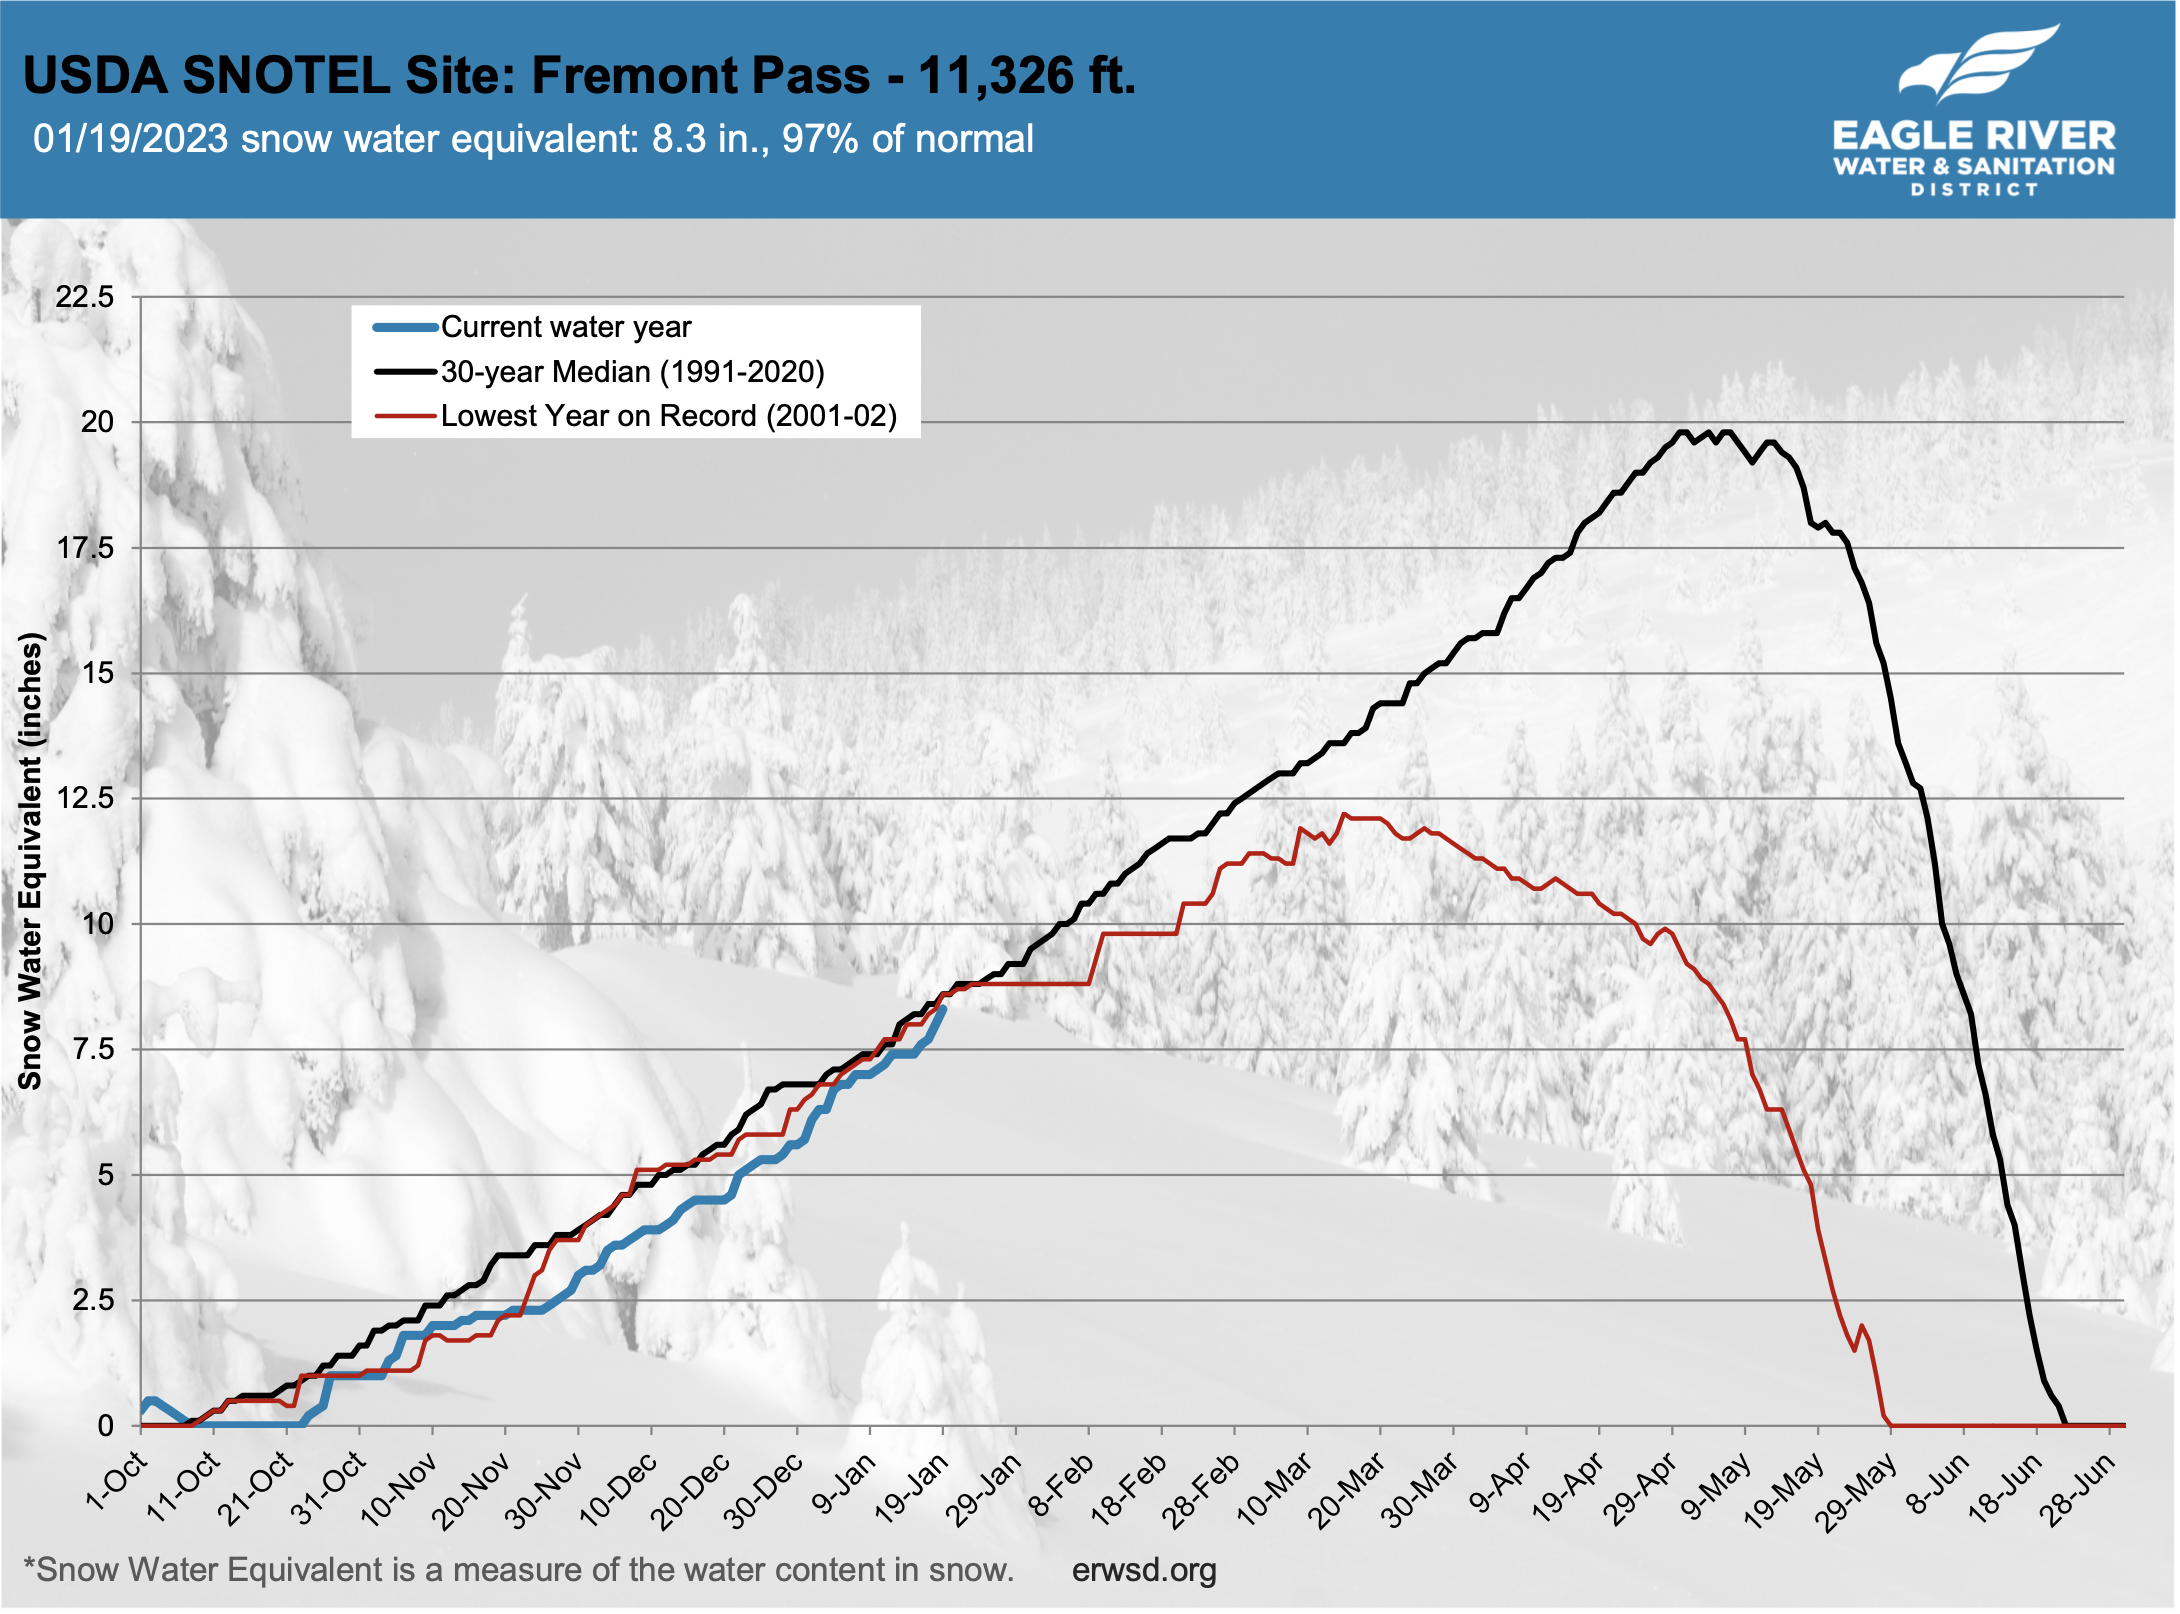
Loving the SWE trend this season! — #EagleRiver #Water @VailCOwater #snowpack (January 21, 2023)

Click the link to view the graphs on the Eagle River Water website.

Winter storm cancelled classes, helped improve #snowpack outlook for #Colorado — Colorado State University (January 21, 2023)

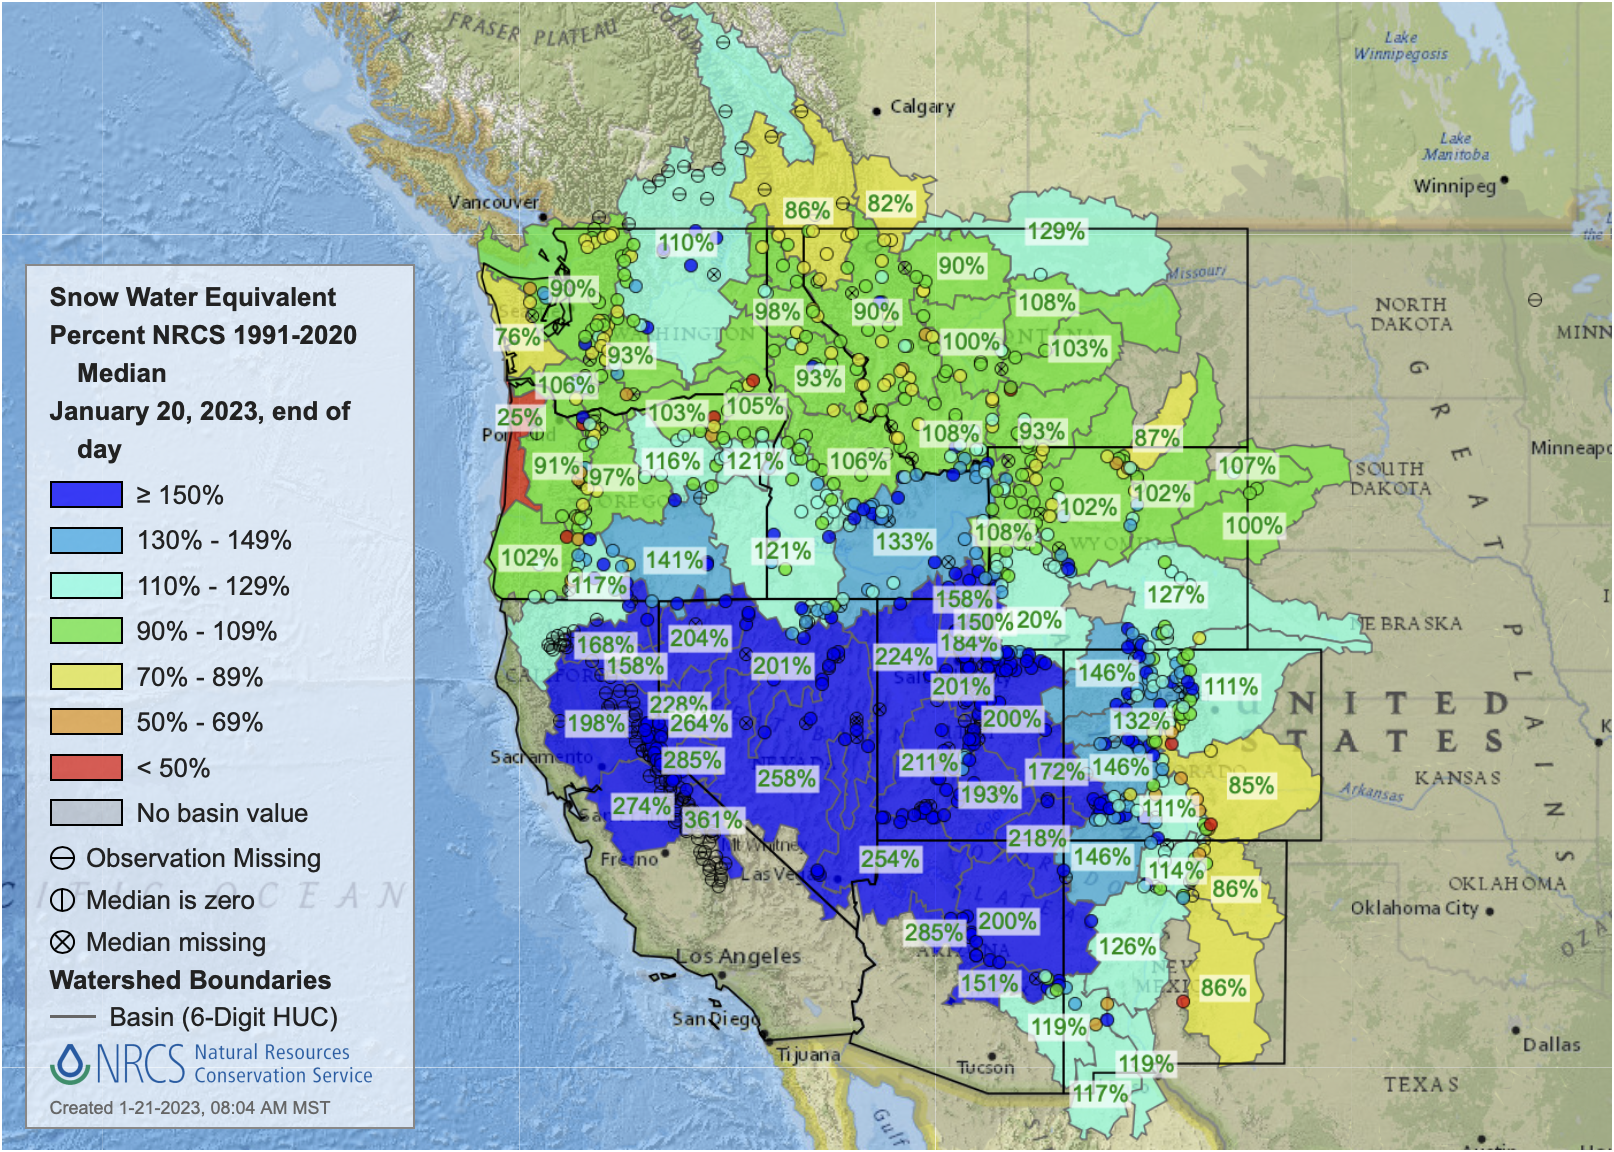
West snowpack basin-filled map January 20, 2023 via the NRCS.

Click the link to read the article on the Colorado State University website (Anne Manning):

Becky Bolinger, assistant state climatologist and a drought specialist at CSU, contextualized what this storm did for anticipated snowpack this year, and how this January has compared to previous ones on record (it depends where you look).

SOURCE: What has this latest winter storm meant for snowpack for Colorado and the subsequent drought outlook?

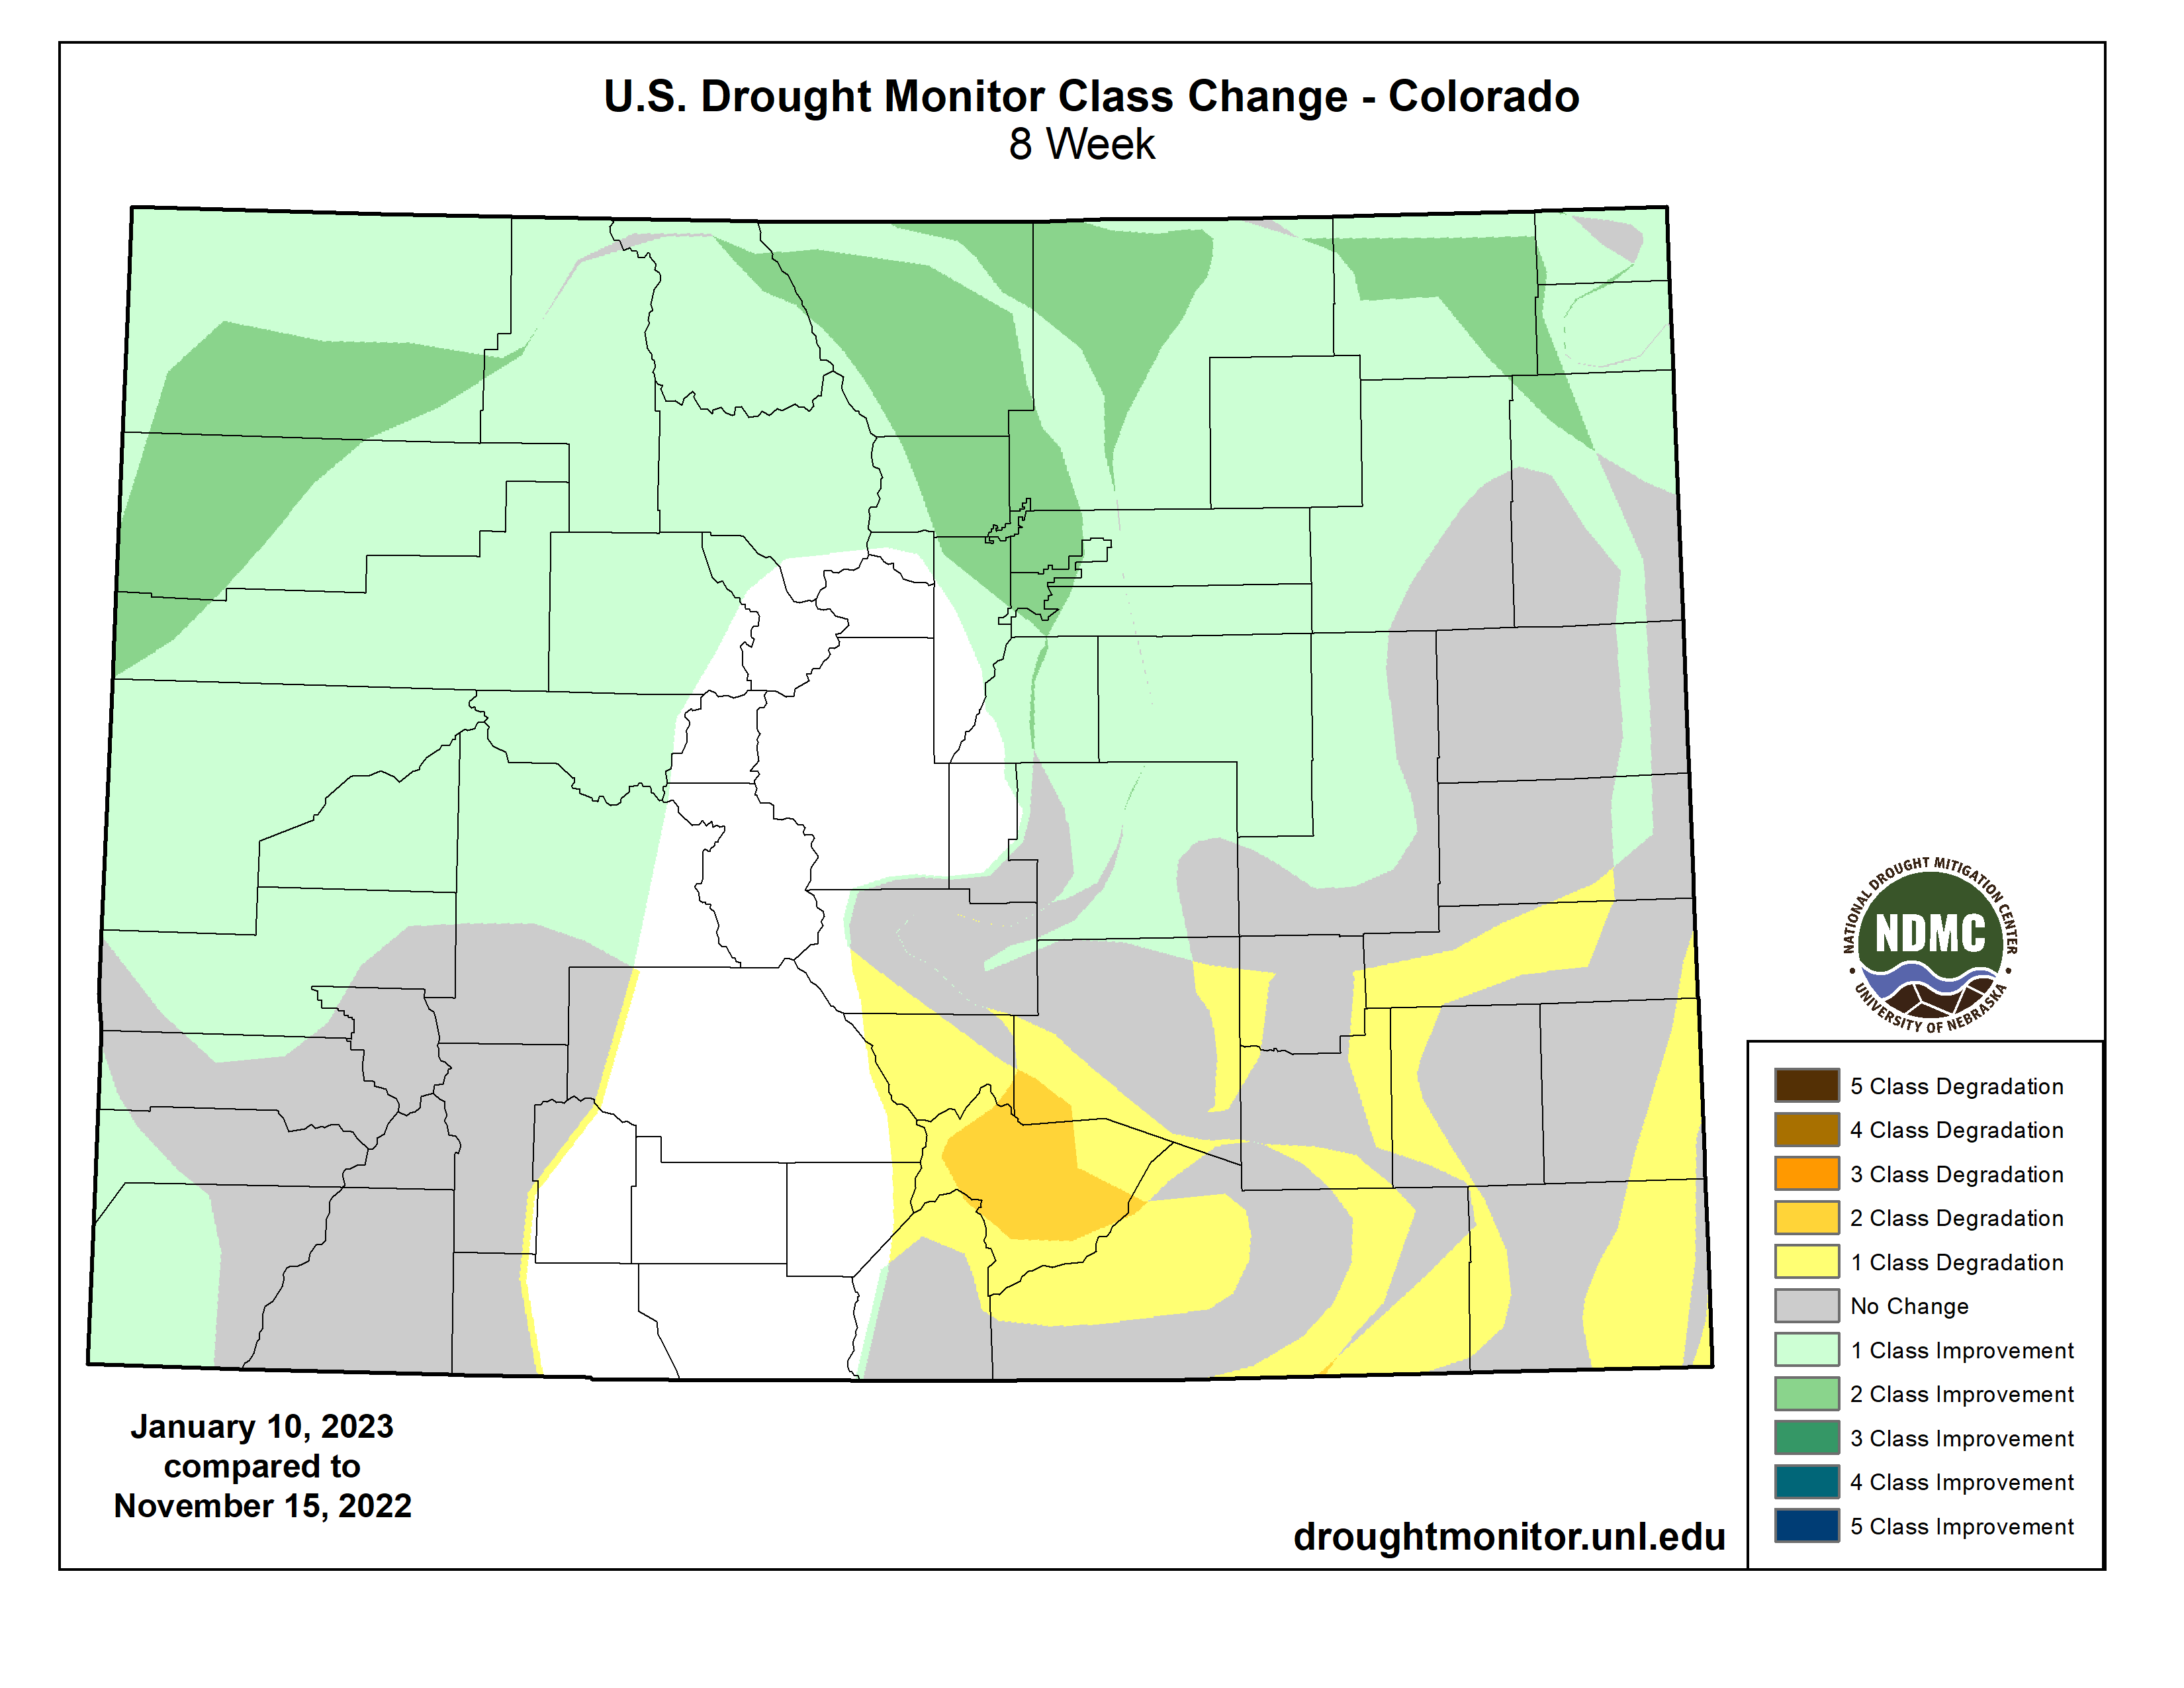
Bolinger:ย Thanks to an active storm pattern throughout December and January, our statewide snowpack is currently (as of Jan. 18) at 134% of average. With the latest storm numbers still coming in, that number is likely to go up. Statewide, it is very likely that peak snowpack, which usually occurs in early April, will be near or above average. This is great news. Because of this consistent storm activity, we have seen improvements in drought conditions over our Colorado mountains for theย past two months.

This latest storm has been very beneficial, particularly for our northern Front Range communities and northeast Colorado. Itโ€™s likely we will see improvement in the drought depiction for parts of northeast Colorado over the next week.

Unfortunately, southeast Colorado has been missing out on a lot of events lately, and this latest storm was no exception. Snowpack for the Arkansas basin is currently at 84% of average. It is the only basin below average at this time. The lower elevations of southeast Colorado have seen developing drought conditions over the past few months, with very dry conditions dominating.

SOURCE: Was the heaviness/wetness of the snow that we got anything to write home about?

Bolinger: While some snow totals may be less than some anticipated, this was still a great accumulating event. And the snow was a lot wetter than Coloradans might be used to. Definitely not common for January. Colorado is known for a dry and powdery snow ยญโ€“ great for skiing on โ€“ especially during the winter months. A general rule-of-thumb meteorologists use is a 10-to-1 ratio โ€“ for every 10 inches of snow, youโ€™ll get 1 inch of liquid. But for Colorado, especially near the middle of the snow season (December-February), that ratio tends to be higher. Getting into those warmer spring months of March and April, we expect that ratio to be a bit more representative.

SOURCE: Has this January been unusually snowy compared with previous years on record?

Bolinger:ย It depends on where in the state you look. For our higher elevations, January is a big time for snow. But for our lower elevations, January tends to be aย lower snow total month, taking a back seat behind November, December, February and March. While this storm was hyped, many of our lower elevations havenโ€™t had a lot of snowy days this January. In Fort Collins for example, our average snowfall from Jan. 1-17 is 3.5 inches โ€” and before this storm, we were below average at 2.1 inches. So, this storm will bump us up above average, but itโ€™s not anything spectacular. In northeast Colorado though, there are locations that have seen 10 inches this January so far, when their normal for the entire month is around 4 inches.

It turns out this was one of the biggest January snows for Denver in 30 years. So, while January as a whole hasnโ€™t been incredibly snowy, this storm still stands out.

Spring heat waves drive record western United States snow melt in 2021ย — Environmental Research Letters #ActOnClimate

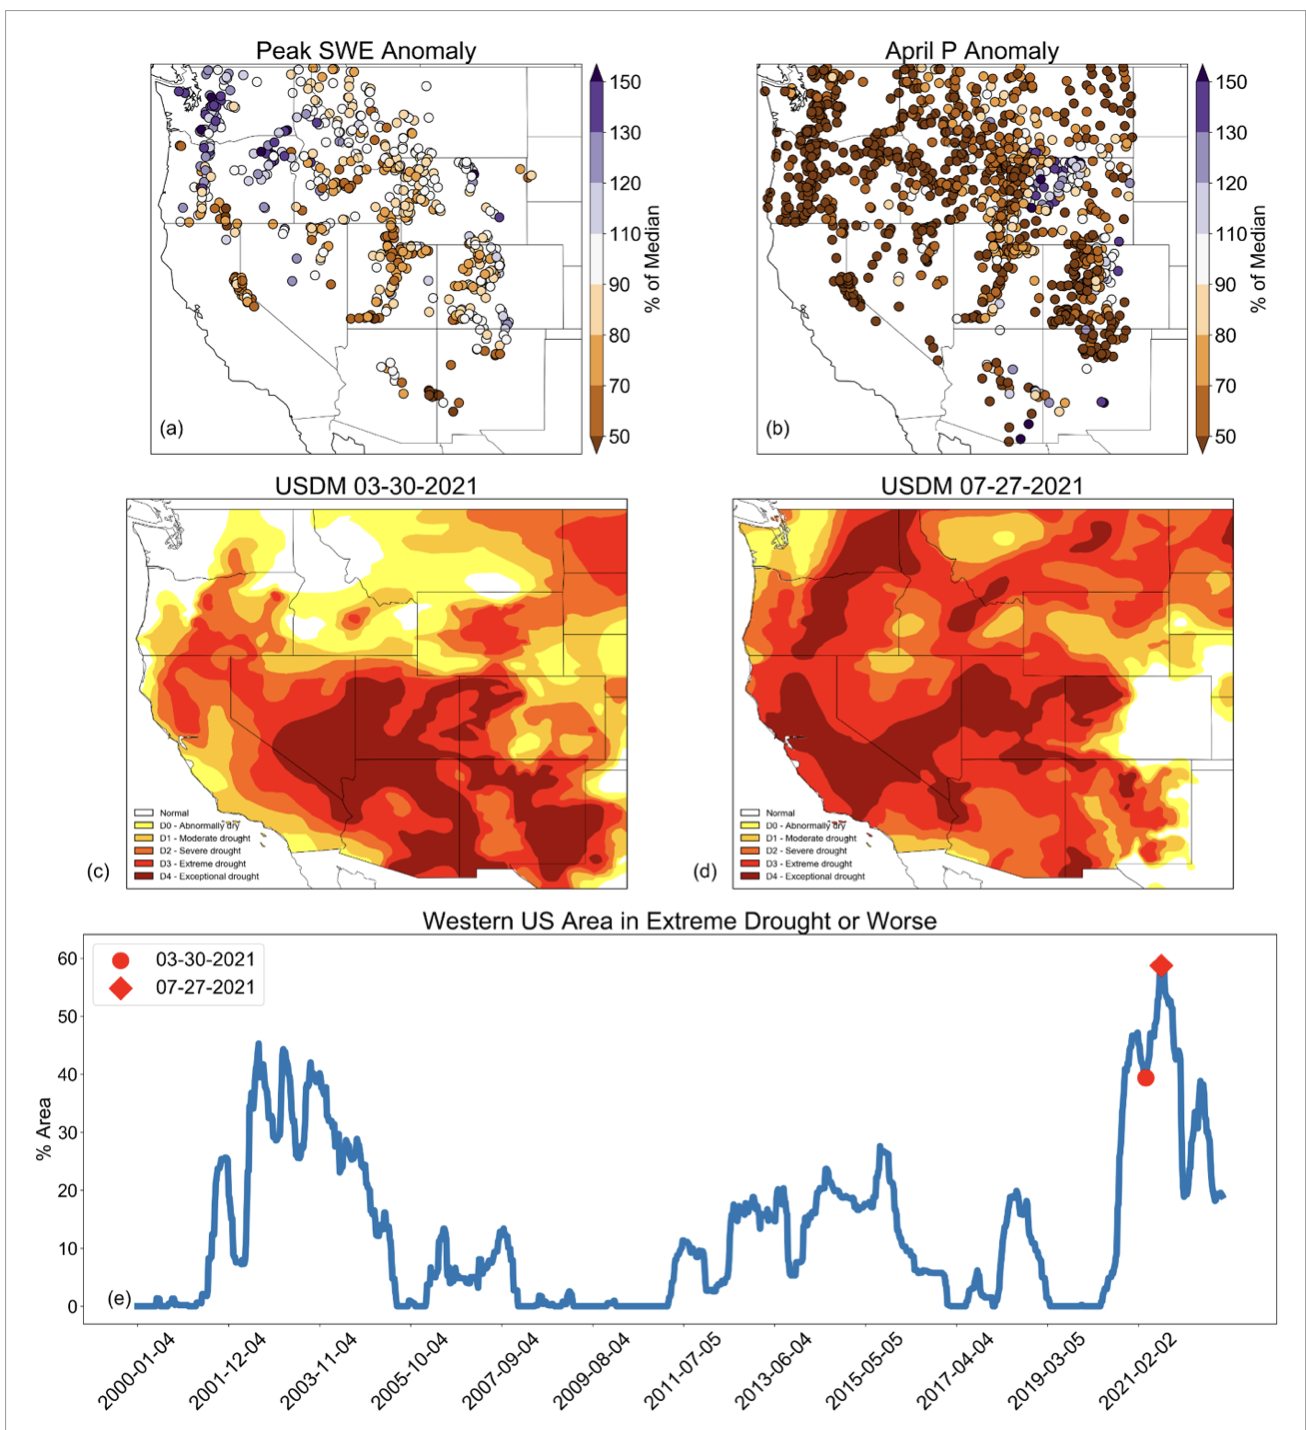
Figure 1. Western US peak SWE and precipitation anomalies, and US Drought Monitor maps and timeseries. (a) Percent of 1991โ€“2020 median peak SWE in 2021 at SNOTEL stations. (b) Percent of 1991โ€“2020 median precipitation in April 2021 at SNOTEL and Applied Climate Information System (ACIS) stations, (c) US Drought Monitor on 30 March 2021, (d) US Drought Monitor on 27 July 2021, (e) weekly timeseries of western US percent area in extreme drought or worse based on the US Drought Monitor. Timeseries data generated by https://droughtmonitor.unl.edu/.

Click the link to read the article on the IOP website (Daniel J McEvoy and Benjamin J Hatchett). Here’s the abstract:

Throughout the western US snow melted at an alarming rate in April 2021 and by May 1, hydrologic conditions were severely degraded with declining summer water supply forecasts compared to earlier in the winter. The objectives of this study are to (a) quantify the magnitude and climatological context of observed melt rates of snow water equivalent (SWE) and (b) underpin the hydrometeorological drivers during April 2021 based on atmospheric reanalysis and gridded meteorological data. Peak SWE indicated snow drought conditions were widespread (41% of stations between 5th and 20th percentile) but not necessarily extreme (only 9% of stations less than 5th percentile). Here, using observations from the Snow Telemetry (SNOTEL) network we found record 7 day snow melt rates (median of โˆ’99 mm; ยฑone standard deviation of 61 mm) occurred at 24% of SNOTEL sites and in all 11 Western states. Strong upper atmospheric ridging that began initially in the north Pacific with eastward propagation by mid-April to the Pacific Northwest Coast led to near-surface conditions across the western US conducive to rapid snow loss. One heat wave occurred inland across the Rockies the first week of April and then later in April, a second heat wave impacted the Cascades and northern California. We find that ripening of the snowpack by both record high surface solar radiation and air temperatures were factors in driving the rapid snow melt. Equatorial Pacific sea surface temperatures and the La Niรฑa pattern that peaked in winter along with an eastward propagating and intensifying Maddenโ€“Julian Oscillation were likely responsible for driving the placement, strength, and progression of the north Pacific Ridge. This study documents the role of two extreme spring ‘sunny heat wave’ events on snowpack, and the cascading drought impacts which are anticipated to become more frequent in a warming world.

New lab at @CSUSpur will use 6 types of water to test innovative treatment solutions — #Colorado State University

OWSI CSU Spur Hydro-WaterTAP diagram 1222, based on an initial graphic by hord, coplan, and macht and revised by the Walter Scott, Jr. College of Engineering, Colorado State University.

Click the link to read the release on the Colorado State University website (Allison Sylte):

In a building dedicated to all things water is a first-of-its-kind lab dedicated to developing innovative ways to clean and reuse humanityโ€™s most precious resource. 

The Water Technology Acceleration Platform (Water TAP) lab is housed in the newly opened Hydro building on the CSU Spur campus. Here, a team of researchers led by CSU Civil and Environmental Engineering Professor Sybil Sharvelle will test a variety of water treatment technologies on six different sources.

Itโ€™s part of a variety of programming inside Hydro by the One Water Solutions Institute.  

The labโ€™s indoor and outdoor spaces wonโ€™t be fully operational until later this spring, but Sharvelle sat down with SOURCE to offer a glimpse of what will happen at Water TAP in the coming months.

SOURCE: What are the six types of water sources that will be used at the lab? 

Sharvelle: Those sources are stormwater, graywater, roof runoff, wastewater, river water and water that is actually trucked in from a variety of different sources, which could encompass everything from hydrofracking waste to agricultural runoff to various industrial sources. 

Hydro is the only building nationally โ€“ and maybe internationally โ€“ that has access to this many types of water. This is truly a unique facility, and something that weโ€™ve envisioned for a decade. 

The space has been designed to accommodate systems that process nearly 1,000 gallons per day of each source of water. 

What happens after all this water gets to the lab? 

We have tanks where the water is stored, and can pump it through a variety of different treatment systems. Those systems could include physical and chemical-based systems (e.g., membrane filtrations or ultraviolet treatment) as well as nature-based solutions. We can even test constructed wetlands that actually have plants incorporated in a growth media. 

Whatโ€™s a constructed wetland? 

These are a lot like actual wetlands, where weโ€™ll dig out a space for the water in the form of ponds where we grow plants that can be very effective for treatment. 

For example, storm runoff from from Hydroโ€™s roof could be collected and diverted into these ponds, and later used for irrigation. 

The backyard of the Hydro facility will actually have multiple flexible plots where we can test nature-based solutions. 

Itโ€™s also unique in that the facility is on the edge of the South Platte River, and we have the ability to test and treat water directly from this source. 

Letโ€™s take a bigger picture look at the research that is happening at Water TAP. What types of problems is this trying to solve? 

We are trying to make use of local water sources so we can reduce the demand on imported and freshwater sources, like the Colorado River. 

Weโ€™re figuring out ways to leave water in the environment and instead make use of water sources like stormwater, graywater and roof runoff โ€“ all of which are readily available in urban areas. 

Of course, different water has different applications, and water used for flushing toilets doesnโ€™t need to undergo the same treatment as water thatโ€™s used for drinking. 

The whole purpose of the lab is to enable the testing of technology to move technology development  and policy forward. 

Multiple #AtmosphericRiver events have pumped copious amounts of moisture to the Great Basin which now has a basin-wide #snowpack that is 206% of normal with many #SNOTEL sites reporting their highest snowpack on record (to date) — #Colorado Basin River Forecast Center @nwscbrfc (January 21, 2023)

National Park Foundation awards $26,800 to Cache la Poudre River National Heritage Area for youth education — The #Greeley Tribune #PoudreRiver

Cache la Poudre River from South Trail via Wikimedia Foundation.

Click the link to read the article on The Greeley Tribune website (Trevor Reid). Here’s an excerpt:

More than 3,500 students are expected to get out of the classroom and into the Cache la Poudre River National Heritage Area after the area received a grant from the National Park Foundation.

The foundation, the nonprofit partner of the National Park Service, awarded a $26,800 Open OutDoors for Kids grant to the national heritage area as part of the foundationโ€™s Youth Engagement and Education Initiative.

The funding will support the heritage areaโ€™s Learning in Our Watershed program, providing scholarships to public, charter, home and online schools for field trips to locations throughout the heritage area. Scholarships are available for all grades, but fourth-grade classrooms from Title I schools receive priority.

On-site field trips for the program include the Poudre Learning Center, the Environmental Learning Center, Centennial Village Museum, the Fort Collins Museum of Discovery, the Windsor History Museum and Study Outdoors Learn Outdoors. Learning in Our Watershed has initiatives for learners of all ages.

Turning the tables: reporters covering the #ColoradoRiver explain their challenges to Colorado River water users โ€” Arizona Water News #COriver #aridification #CRWUA2022

Turning the tables: reporters covering the Colorado River explain their challenges to Colorado River water users

Turning the tables: reporters covering the Colorado River explain their challenges to Colorado River water users โ€” Arizona Water News

Authorities scramble to entice paid, volunteer #water savings: Upper #ColoradoRiver Basin officials will accept โ€˜incompleteโ€™ applications to jump-start participation in water #conservation program this spring — @WyoFile #COriver #aridification

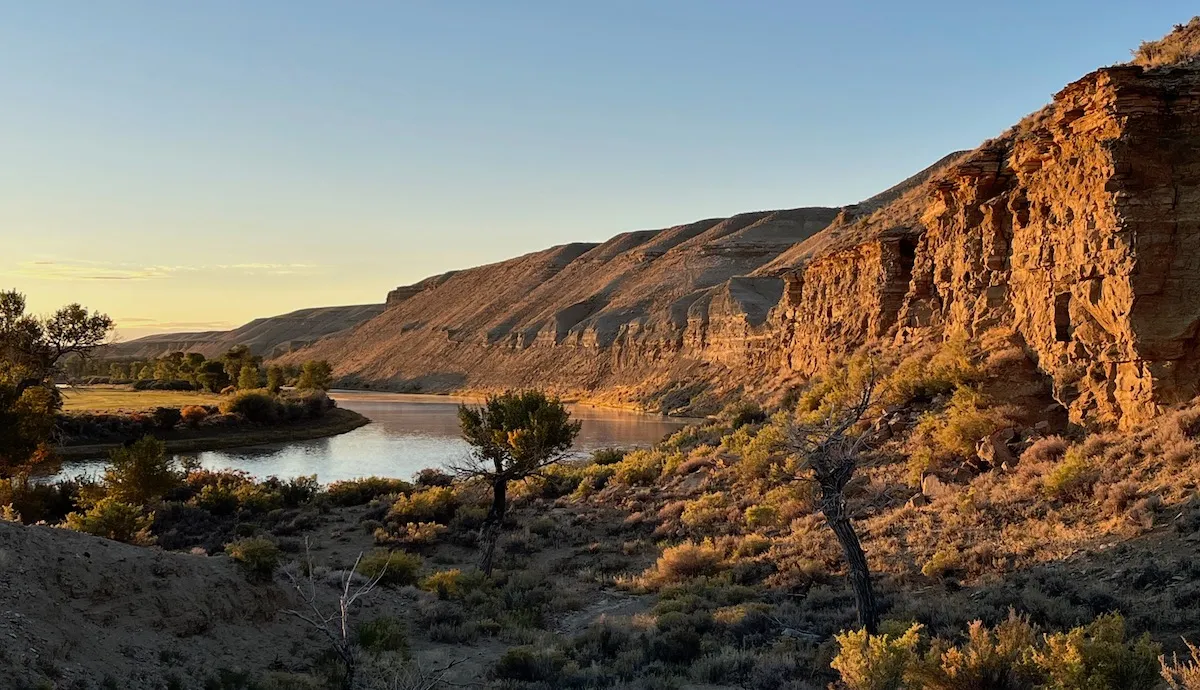
he Green River meanders past irrigated ag land north of the town of Green River Sept. 27, 2022. (Dustin Bleizeffer/WyoFile)

Click the link to read the article on the WyoFile website (Dustin Bleizeffer):

Upper Colorado River Basin states, including Wyoming, are looking for agricultural irrigators, municipalities and other water users interested in a volunteer program that pays them to leave water in streams flowing to the troubled Colorado River.

But with just two weeks left to enroll in the System Conservation Pilot Program, water users still have myriad questions regarding eligibility, how water savings are measured and what participation in the program might mean to their operations. 

Given the short timeframe, the Upper Colorado River Commission, and the Wyoming State Engineerโ€™s Office, which oversees the program in Wyoming, are urging interested water users to submit project proposals by the Feb. 1 deadline, even if theyโ€™re unsure whether their water savings plans qualify.

โ€œWe can still take incomplete applications by Feb. 1, and weโ€™ll work with you to complete those, finalize them and get you into the system,โ€ UCRC Deputy Director Sara Larsen said during a public question-and-answer webinar Wednesday.

The UCRC staff, along with state-level water officials, will verify qualifications and otherwise help applicants complete their proposals โ€” post-submission, if necessary โ€” in order to enroll as many participants as possible, according to the commission.

Successful applicants for the 2023 program will be notified by the end of February.

Water conservation rush

The SCPP is one of five short-term strategies that Upper Colorado River Basin states โ€” Wyoming, Colorado, Utah and New Mexico โ€” have offered to help meet a challenge by federal officials to conserve 2 million to 4 million acre-feet of water in the over-taxed system this year.

Theย UCRCย announced a call for SCPP proposals Dec. 14 with a filing deadline of Feb. 1.

Lake Powell, just upstream from Glen Canyon Dam. At the time of this photo, in May 2021, Lake Powell was 34% full. (Ted Wood/The Water Desk)

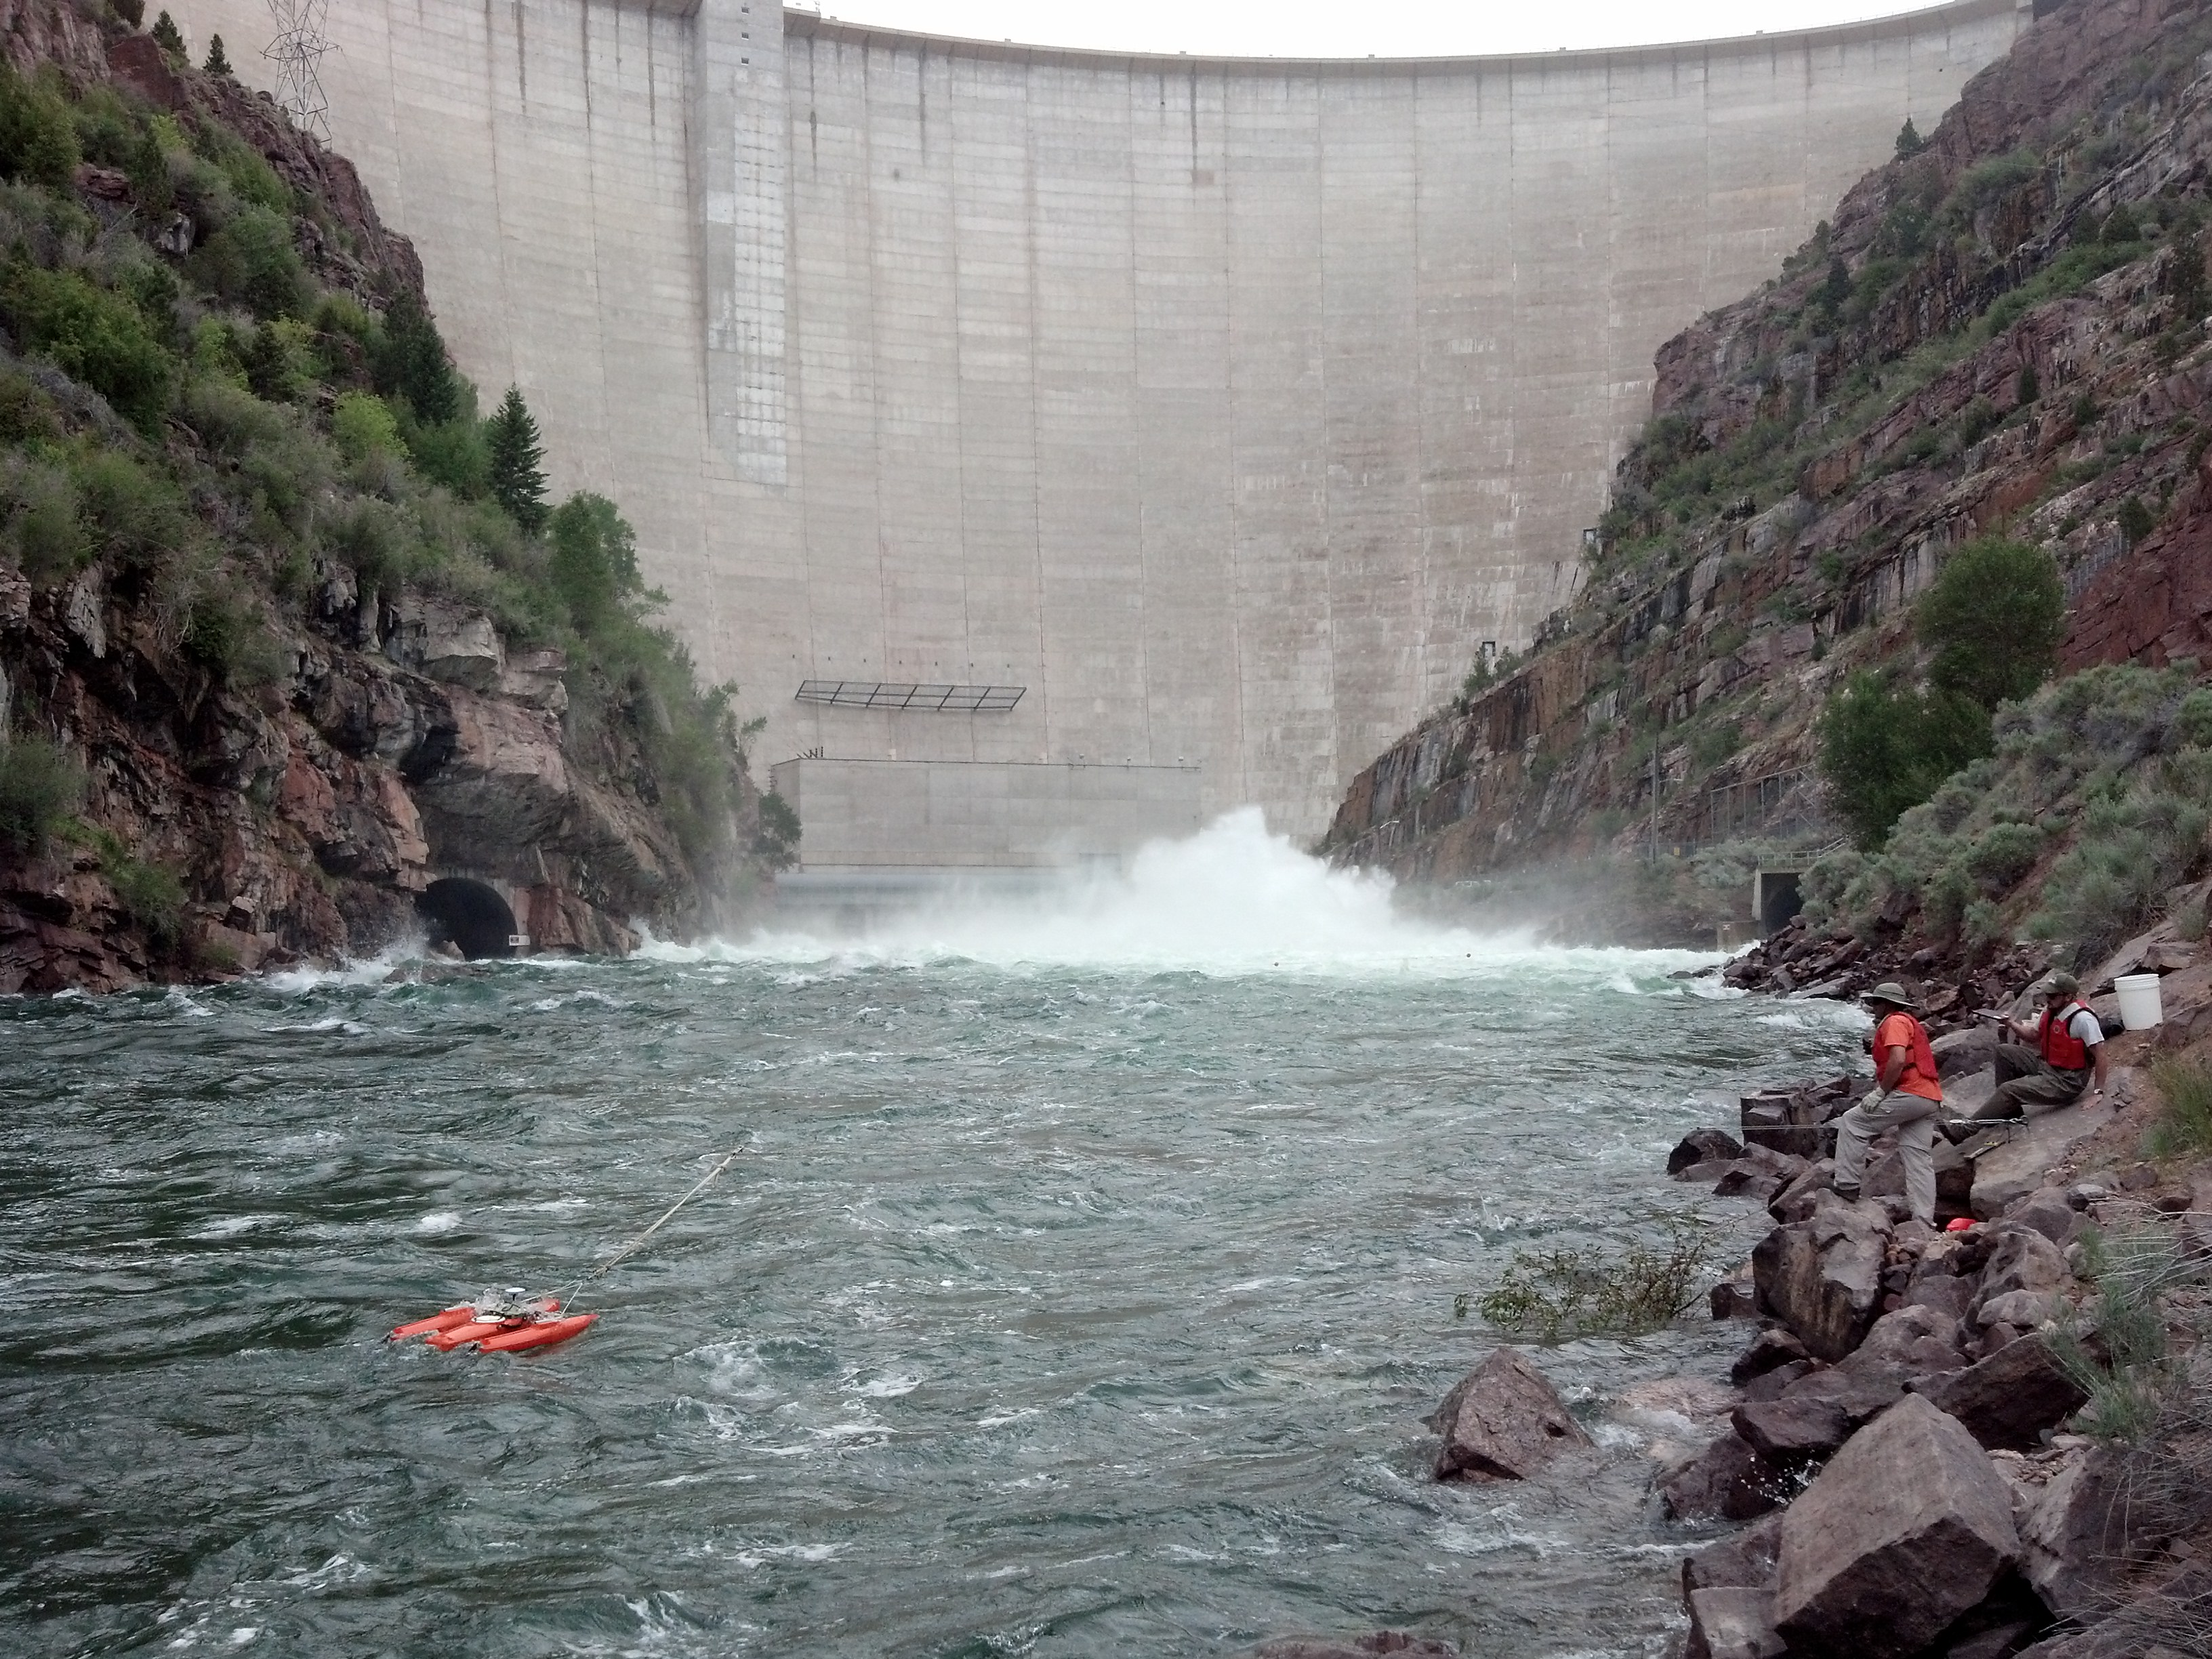
The quick turn-around stems from intensifying drought conditions that helped drain Lake Powell and Lake Mead โ€” the two largest reservoirs on the Colorado River โ€” to historic lows this past summer, threatening water availability for some 40 million people who depend on the river. Interior Department Assistant Secretary for Water and Science Tanya Trujillo announced drought response actions in May intended to maintain hydropower generation at Powell and Mead, which included taking extra releases from Flaming Gorge Reservoir on the Wyoming-Utah border.

โ€œMore needs to be done as the system reaches critically low water levels,โ€ Trujillo testified before the U.S. Senate Committee on Energy and Natural Resources in June. โ€œThe system is at a tipping point.โ€

Though Wyoming and its upper basin partners didnโ€™t commit specific water-saving volumes in response to the Interior Departmentโ€™s call for conserving 2 million to 4 million acre-feet of water this year, the UCRC put forth aย 5-point plan. The SCPP is the first to be implemented.

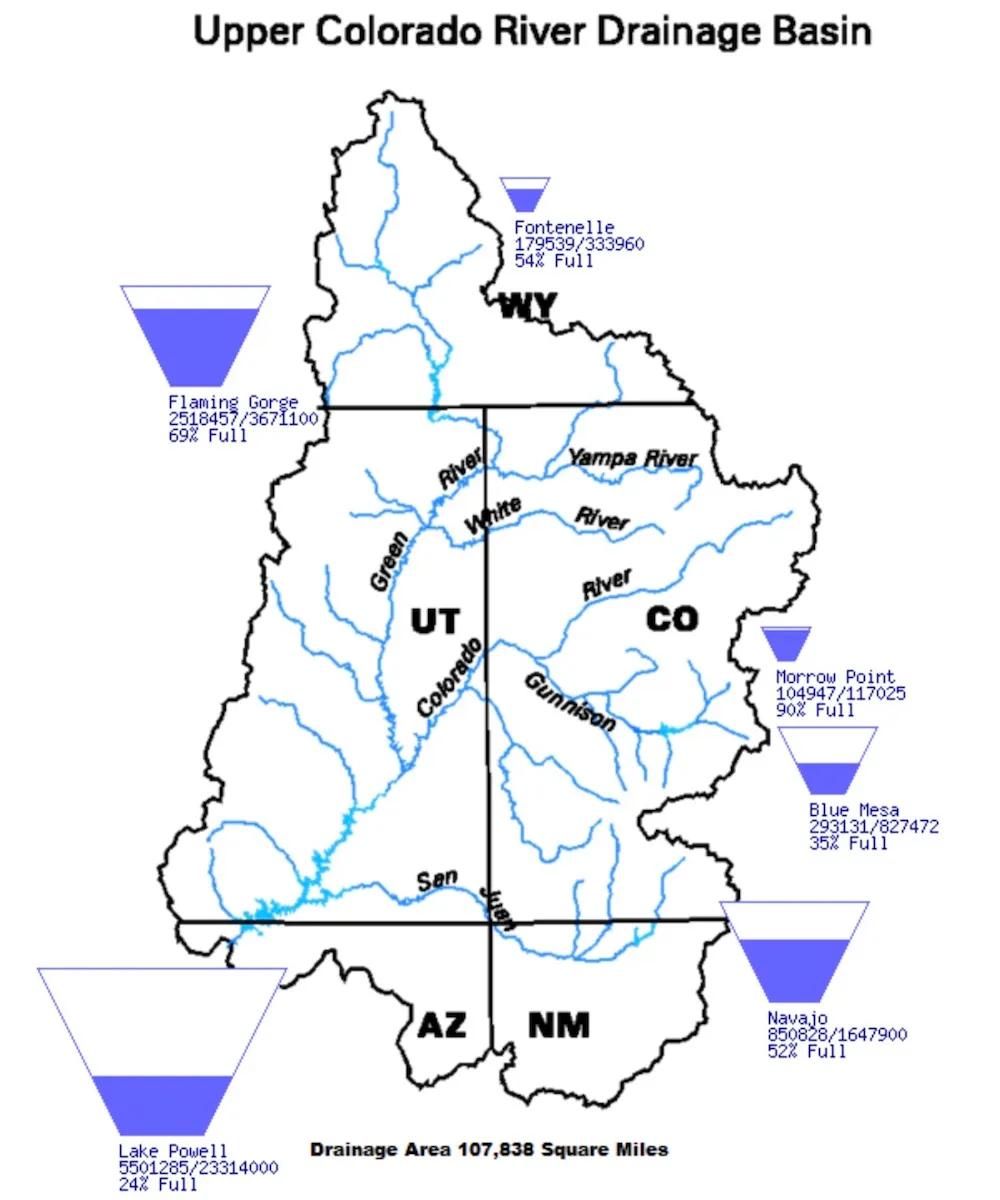
This diagram shows water levels among major reservoirs in the Upper Colorado River Basin as of Jan. 17, 2023. (Bureau of Reclamation)

โ€œUpper [Colorado River Basin] states have made no commitment with regard to the number of [SCPP] projects or target volumes or anything other than adapting to the interest from willing partners among water users and tribes in the upper basin,โ€ UCRC Executive Director Chuck Collum said during the Wednesday webinar.

Addressing the short turn-around for SCPP proposals, applications donโ€™t โ€œhave to be perfect,โ€ Collum said. โ€œBut it needs to be in the hopper [by Feb. 1] so we can work with you to refine it.โ€

The UCRC and Wyoming State Engineerโ€™s Office, however, are not beginning from square one. Wyoming enrolled a couple dozen water users in the programโ€™s initial iteration from 2015 through 2018, and found exponential interest among irrigators โ€” particularly in the upper reaches of the Green River and its tributaries, according to state officials.

Yampa River Basin via Wikimedia.

How it works

To qualify for the SPCC in Wyoming, a water user must have a valid water right within the Little Snake or Green River basins and demonstrate that that right has been exercised in recent years, according to state officials. Participants are credited only for voluntary reductions of โ€œconsumptive use,โ€ which is described as Colorado River-bound water โ€œthat can be estimated or measured,โ€ย according to the UCRC.

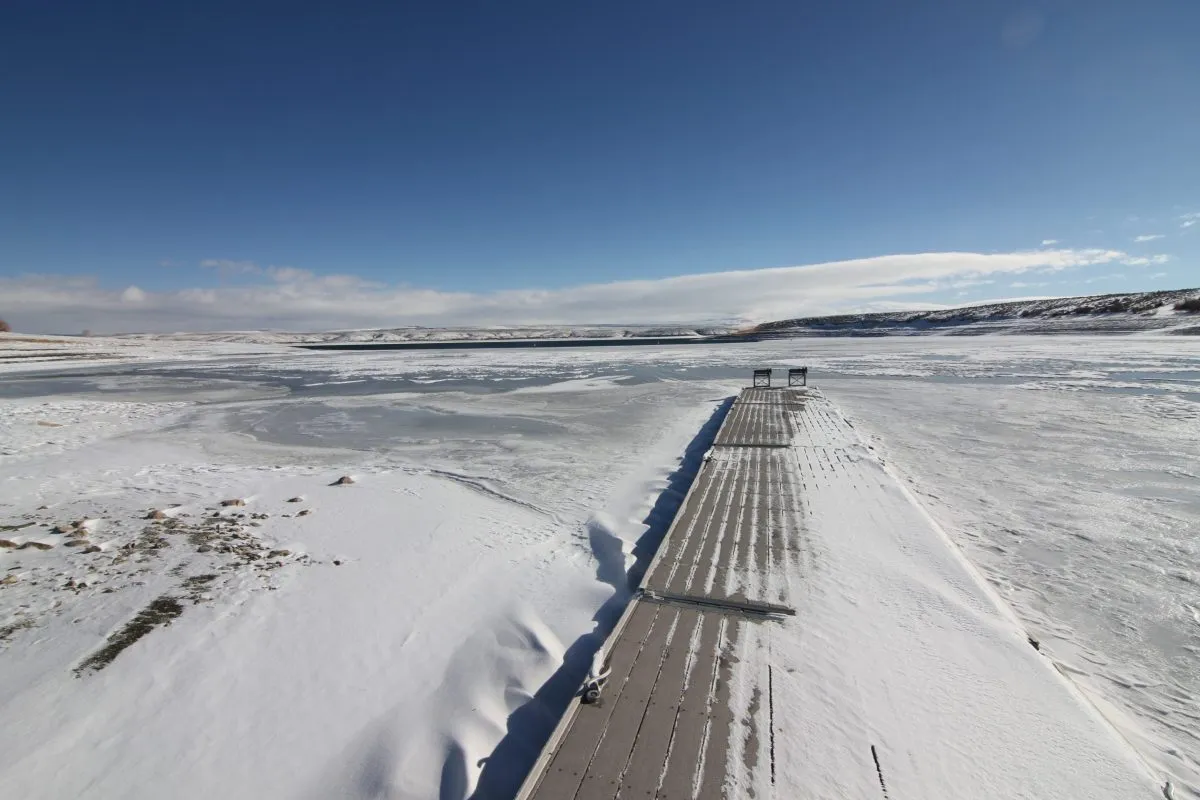
Flaming Gorge Reservoir, which receives water draining off 15,000 square miles of western Wyoming, was more than 30 feet below its maximum height in this December 2022 image. (Mike Koshmrl/WyoFile)

In the case of industrial and municipal water users, consumptive use is generally measured by determining how much water is diverted and not returned to the river system. Water reuse and recycling may qualify, however, according to the UCRC. For agricultural irrigation operations, consumptive use, generally, is measured by determining how much diverted water is consumed by crops. 

For example, an irrigator might divert 10 acre-feet of water but 2 acre-feet returns to the system. Water officials would credit the irrigator for volumes of water allowed to flow downstream that would otherwise normally have been consumed.

For now, the UCRC envisions a โ€œfixed termโ€ compensation of $150 per acre-foot of water under the SCPP in 2023, although it may consider higher rates based on circumstances, according to the agencyโ€™s request for proposals. The UCRC secured $125 million from the Inflation Reduction Act to support the program โ€” an amount that water officials say is more than enough to cover payments and expenses in 2023.

In the first iteration of the SCPP โ€” from 2015 through 2018 โ€” a total 23,886 acre-feet of water was conserved among 26 projects in Wyoming, according to aย reportย by the upper basin commission. It paid water users a total $4,079,233 โ€” about $171 per-acre foot.

Priority for SCPP proposals in 2023 will be given to โ€œprojects that are likely to mitigate impacts of the ongoing drought,โ€ larger volumes of water to be conserved and the ability to verify water savings, according to the request for proposals.

Further details about how the program works in Wyoming and what qualifies can be found on the Colorado River Working Groupโ€™sย website.

Ansel Adams The Tetons and the Snake River (1942) Grand Teton National Park, Wyoming. National Archives and Records Administration, Records of the National Park Service. (79-AAG-1). By Ansel Adams – This tag does not indicate the copyright status of the attached work. A normal copyright tag is still required. See Commons:Licensing., Public Domain, https://commons.wikimedia.org/w/index.php?curid=118192

#ColoradoRiver Storage Project — Reclamation #COriver

Colorado River Storage Project map. Credit: Reclmation

Click the link to read the article on the Reclamation website:

The 1956 Colorado River Storage Project Act has had a significant impact on the development and management of water in the Upper Colorado River Basin. The 1956 act authorized construction of the Colorado River Storage Project (CRSP) which allowed for comprehensive development of the water resources of the Upper Basin states (Colorado, New Mexico, Utah, and Wyoming) by providing for long-term regulatory storage of water for purposes including, regulating the Colorado River, storing water for beneficial use, allowing Upper Basin States to utilize their Colorado River Compact apportionments, providing for the reclamation of arid lands, control of floods and generation of hydroelectric power. The Colorado River Storage Project is one of the most complex and extensive river resource developments in the world.

There are four initial storage units built as part of the CRSP:

and a number participating projects (16 of which have been completed or are in process of completion). The purposes of the CRSP identified in the 1956 act include regulating the flow of the Colorado River, storing water for beneficial consumptive use, providing for reclamation of arid and semi-arid lands, providing flood control, and generating hydropower. The CRSP also provides for recreation and improves conditions for fish and wildlife.

During the 1960’s and 1970’s, public concern over the environment resulted in new federal environmental laws. The enactment of the 1969 National Environmental Policy Act, the 1973 Endangered Species Act, and the 1992 Grand Canyon Protection Act outlined new requirements for the protection and enhancement of fish, wildlife, and the environment. Administration of these laws has modified the operation of CRSP facilities. 

The dams of the CRSP main storage units have a combined live storage capacity of 30.6 million acre-feet and power generation capabilities to provide over five billion kilowatt-hours of energy annually. Glen Canyon Dam is the largest of the CRSP facilities and is the key unit for controlling water releases to the Lower Basin. In 1970, the Criteria for Coordinated Long-Range Operation of Colorado River Reservoirs (Operating Criteria) was established to provide for the coordinated operation of reservoirs in the Upper and Lower basins and set conditions for water releases from Lake Powell and Lake Mead. In accordance with the Operating Criteria, an objective release of 8.23 million acre-feet per year is targeted for downstream delivery.

The multipurpose CRSP has not only been integral to the development of the arid West, it has also played a vital sustaining role through extended periods of drought. The many benefits provided by the CRSP are essential to life in the West today.

John Fielder: Iโ€™m donating my lifeโ€™s work to inspire conservation in Colorado: Thousands of photographs will be available through History #Colorado — The #Denver Post

Click the link to read the guest column on The Denver Post website (John Fielder). Here’s an excerpt:

For 40 years, I have worked as a nature photographer and publisher to promote the protection of ranches, open spaces, and wildlands in Colorado and beyond. Humanity will not survive without the preservation of biodiversity on Earth, and I have been honored to use my photography to influence people and legislation to protect our natural and rural environments. I am humbled that these photos have spurred the passage of the 1992 Great Outdoors Colorado Trust Fund Initiative (GOCO) and Congressโ€™s Colorado Wilderness Act of 1993 among other land protection projects across this state that I love.

Iย have decided to donate my lifeโ€™s work of photography to you, the people of Colorado. As our stateโ€™s historical preservation arm, History Colorado will beย the repository of this collectionย of more than 5,000 photos distilled from 200,000 made since 1973. Their digitization and exhibition development is made possible by a grant from the Telluray Foundation.

Study finds complexity to climate changes underway at 9,500 feet in #Colorado — @BigPivots #ActOnClimate #KeepItInTheGround

Broad-tailed hummingbird visits flowers of the dwarf larkspur. Photo courtesy of David Inouye

Click the link to read the article on the Big Pivots website (Allen Best):

Changing climates have started disrupting schedules of almost everything everywhere. As temperatures rise, spring snow in the Rocky Mountains melts earlier. How has this changed the dance between birds and bees, flowers and the trees?

Plenty, according to a new study of research conducted in Colorado during the last half-century, and in far more complex ways than you might think.

Published by the Proceedings of the Royal Society B, a scientific journal of papers in life sciences, the study examined the voluminous evidence accumulated by 15 scientists since 1975 at the Rocky Mountain Biological Laboratory near Crested Butte. The scientists have studied plants, insects, and birds in the outdoor laboratory amid the forest and meadows at an elevation of about 9,500 feet.

Gothic mountain shrouded in clouds behind several cabins. Site of the Surface Atmosphere Integrated Field Laboratory. Gothic, Colorado, USA. By Charlie DeTar – Own workby uploader, CC BY-SA 3.0, https://commons.wikimedia.org/w/index.php?curid=4795644

RMBL, pronounced โ€œrumble,โ€ also has a continuous record of temperature and other weather data beginning in 1975. Average summer temperatures at the lab, which is headquartered at the old mining hamlet of Gothic, have increased 0.4 degrees C each decade. Those in autumn rose 0.2 degrees per decade.

Something similar is happening with snowmelt. The date of bare ground has arrived an average of 2.4 days earlier per decade. With this earlier snowmelt, first spring activity advanced significantly across all the species examined except migratory birds. This makes sense because bird migration is determined by cues along their travel from winter grounds farther to the south and not solely by conditions in their breeding grounds in the Gunnison River Basin.

The study found that this shifting climate has not had uniform effects on the plants, insects, and birds that have been studied since Gerald Ford was president. Some interactions, such as those between particular wildflowers and pollinators, may no longer occur. Hummingbirds may no longer arrive while glaciers lilies are in bloom, for example. And, taking cues from the shifting climate, new species may be entering into the mix in different ways.

Rebecca M. Prather, one of four lead authors of the study, compares what has been observed at RMBL to the dining schedule of two people who had habitually gotten together for lunch at a restaurant for a long time. Suppose one of the patrons had a disruption, causing the person to cancel their noon get-togethers. The second person might take up with others, and the one with the disruption might instead arrive in evening.

In the natural world, the warming climate is changing the timing of interactions โ€” or causing missed dates.

Prather explains that a specific flower can rely on a specific pollinator. And if the flower starts flowering before the insect arrivesโ€”well, the flower may not be able to reproduce, because it needs that insect to help it accomplish that task.

The study also emphasized the importance of examining which cues are driving a speciesโ€™ entire distribution of seasonal activity. For example, first date of flowering by a wildflower may not be a good predictor of its peak flowering.

The study yielded some surprises, said Prather, a post-doctoral researcher at Florida State Universityโ€™s Department of Biological Science who first studied the effects of changing climate on prairie ecosystems in Oklahoma.

Before the data collection began in 2021, she says, researchers assumed the earlier snowmelt in spring and the accompanying warmer temperatures mattered almost entirely in determining how the birds, insects, and plants interact. They do matter, but the study instead found that other things were also at play. For example, precipitation and temperatures from up to 18 months before can alter interactions among actors in the natural world.

โ€œWhile we didnโ€™t test the mechanisms for why climate in both short and longer time frames matters, we do know that cues can accumulate over time and interact with an organismโ€™s physiological demands,โ€ Prather explains.

โ€œExtended lag times may be more common at high altitudes or latitudes because there is a shorter growing season, or time for organisms to obtain and store energy. An example that we use in the paper is that alpine bistort pre-forms its leaves and inflorescences four years prior to blooming.โ€

The study was not focused on quantity, such as the number of bees or flowering lilies, but only the timing of their interactions โ€“ and, on the flip side, non-interactions.

Scarlet gilia, blue flax, and other wildflowers make for a happy midsummer setting at the Rocky Mountain Biological Laboratory near Crested Butte. Photo courtesy of David Inouye

David Inouye, another of the studyโ€™s authors, began spending his summers at Gothic in 1971 studying bumblebees, flies, and hummingbirds, as well as their interactions with the plants that can, in extremely warm years, such as was the case in 2022, flower in the high mountain meadows into October.

Now living in semi-retirement in Paonia after a teaching career at the University of Maryland, Inouye similarly stresses the greater complexity of interactions that the study found. โ€œIndividual species do not all respond in the same way,โ€ he says.

For example, migrating hummingbirds might arrive after the flowers, blooming earlier than before, have disappeared.  Bumblebees wintering underground might also have jostled timings relative to their vegetative hosts.

โ€œThis points to a more complicated picture than we assumed at first,โ€ he says. โ€œIt makes it more complicated, but also more interesting. It also points to the need for detailed long-term studies, to tease apart these interactions.โ€

Why might somebody in Boulder or Durango care about this?

โ€œA lot of people, no matter where they live, have an appreciation for nature and a curiosity about how nature works and curiosity about how things are changing due to climate change,โ€ he says.

โ€œAnybody who spends time outdoors and has done that for a decade or more has a personal understanding that nature is changing. And I think they will also have an appreciation for learning some of the details about how it is changing that we have gained from decades-long studies like ours and with a variety of species.โ€

Ian Billick, executive director of RMBL, said the study demonstrates how the laboratory is uniquely positioned to provide a systems-level understanding of how ecosystems around the world will respond to a changing climate.

In terms of climate, the labโ€™s 45 years of data is but a glimpse. Other records go back much further, especially when considering ice cores and coral reefs.

โ€œBut from an organismal perspective, this is the gold standard,โ€ he explains. โ€œThere are very few organismal studies that go back 50 years.โ€

Billick also emphasizes the importance of the study at two levels. If not the first such study, it nonetheless provides a โ€œpowerful example of how we can start to integrate across individual studies to develop and better predict how species will respond to climate change.โ€

Second, he says, this study will help climate scientists broaden their understanding of what lies ahead. Todayโ€™s climate change models focus on atmospheric conditions. They must also include earth-system models. In other words, they must incorporate what is happening on the groundโ€”and underground, tooโ€”and the interaction with the atmosphere.

โ€œOrganisms are a huge driver of carbon cycles, and there are strong feedback loops between organisms and carbon/climate,โ€ Billick explains. โ€œWeโ€™ve made a lot of progress on climate models abstracting away the organismal component, but bringing biology back into those models will be very important to reducing uncertainty.โ€

This paper, while not focused on climate models predicting the future, โ€œis a step in harnessing that complexity in the service of more predictive earth-system models,โ€ he says.

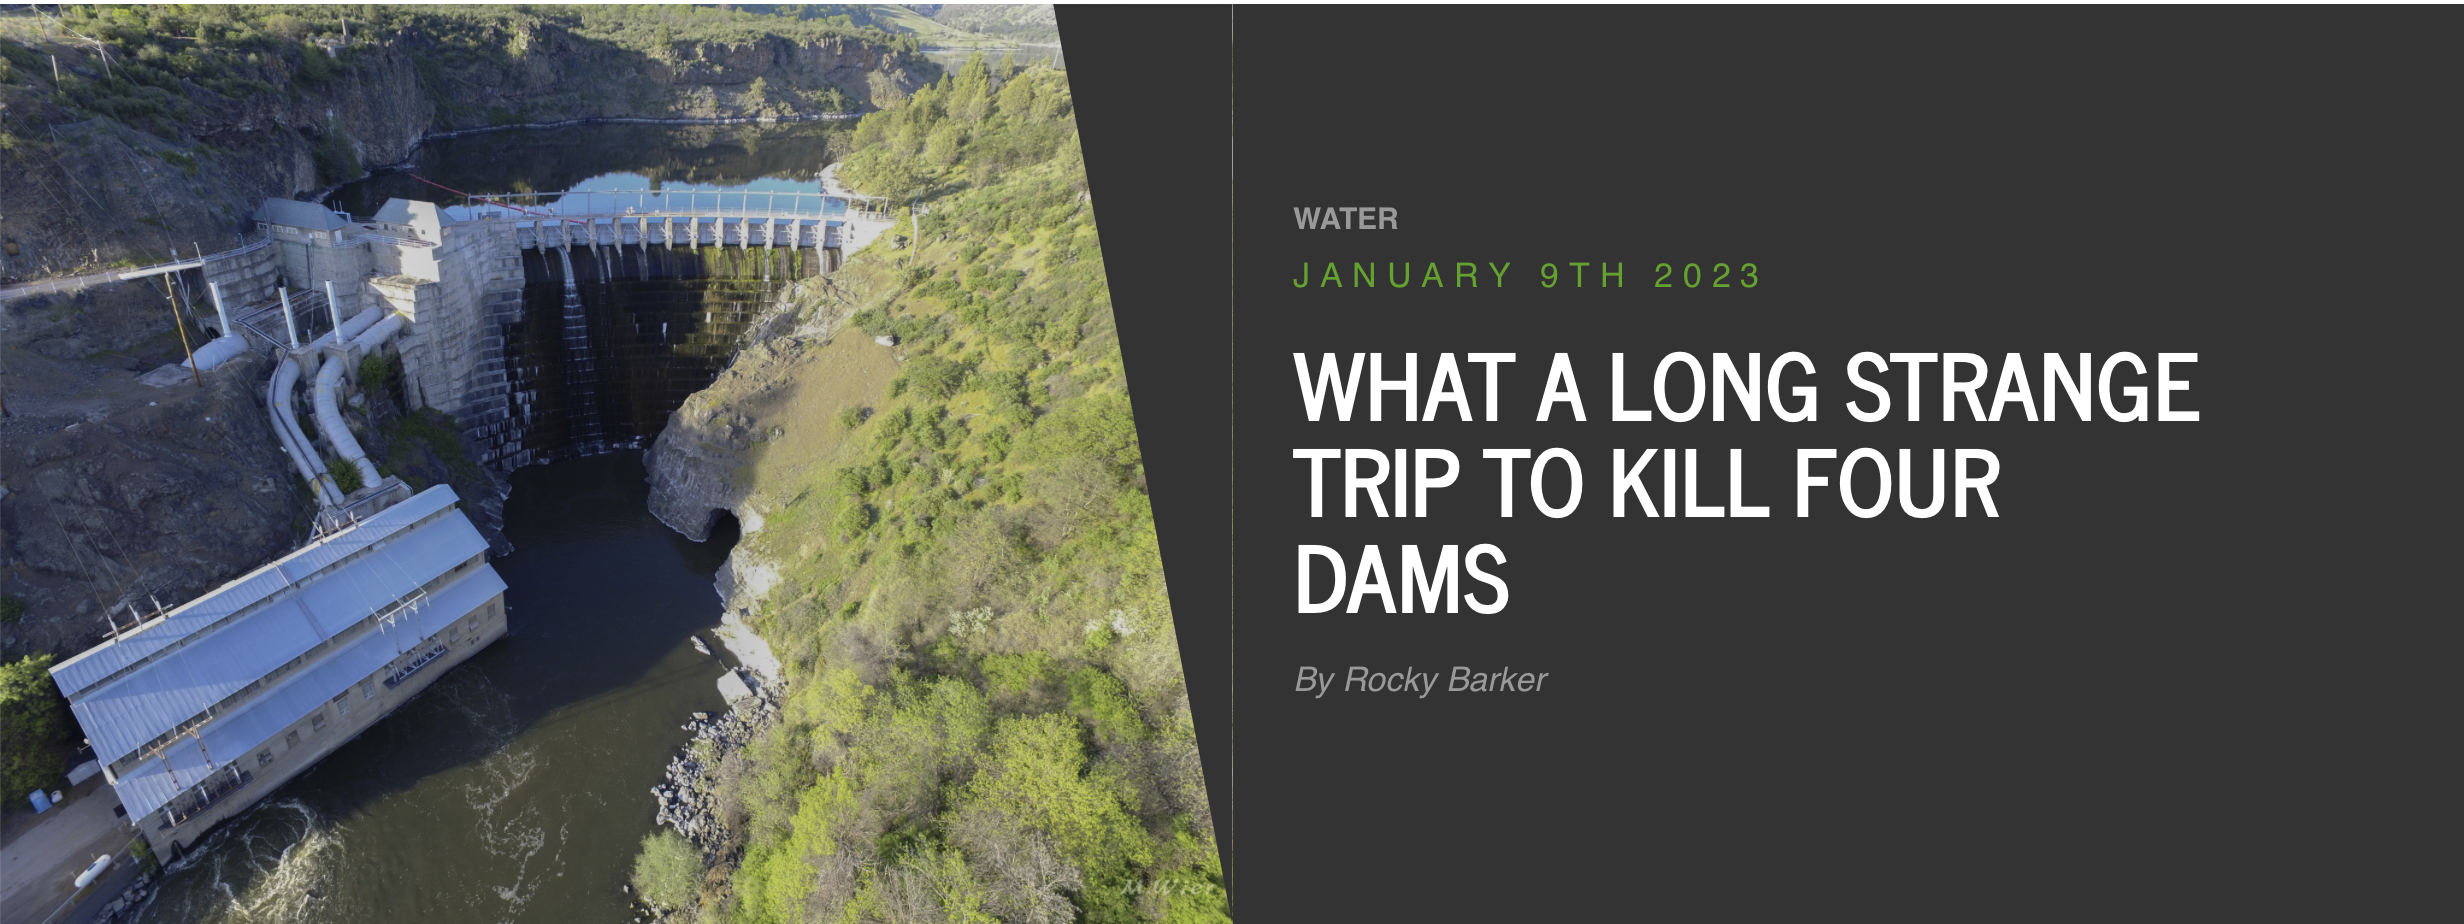
What a long strange trip to kill four dams — Writers on the Range #KlamathRiver

Click the link to read the article on the Writers on the Range website (Rocky Barker):

Finally, after a 50-year effort, four massive dams on the Klamath River in northern California and Oregon will start coming down this July.

For the Yurok, Karuk, Hoopa, Shasta and Klamath tribes living along this river since time immemorial, thereโ€™s much to celebrate. They have long fought for the lives of the salmon that are harmed by these dams, and for their right to fish for them.

Even PacifiCorp, which marketed the electricity of the four hydroelectric-producing dams, will also have something to cheer about. PacifiCorp, which is owned by billionaire Warren Buffett, wonโ€™t have pricey fish ladders to install and its share of the cost of dam removal has been passed to ratepayers in both states.

Environmentalists are also hailing this latest victory for river-renewal, based on the Electric Consumers Protection Act of 1986. The law ordered operators of most federal dams to provide passages for fish so they could swim upstream to spawn.

For California and Oregon officials, along with farmers and others who had reached an agreement as far back in 2008, the dam removals signal that this long and emotional fight is finally over. And why has there been a settlement after all this time? A short answer is the growing reality of the Westโ€™s increasing aridity.

In 2001, yet another dry year in the upper Klamath, farmers woke up to find their headgates for irrigation water locked. It was done to preserve flows for endangered salmon, but for outraged farmers it meant their crops were ruined and they lost anywhere from $27 million to $47 million. Death threats followed, along with shootings and even a farmersโ€™ cavalry charge.

The newly elected Bush administration reacted by making sure the farmers got their water, though this triggered one of the largest salmon die-offs in history. The Klamath Tribes were infuriated.

The Federal Energy Regulatory Commission started tackling the issue in 2007 by ordering PacifiCorp to install fish ladders on its four, fish-killing dams. After electric rates soared 1,000%, that left everybody mad and set the stage for a deal.

In a turnaround for the Bush administration, a pact was almost reached in 2008, when Interior Secretary Dirk Kempthorne, who had stubbornly opposed breaching dams, persuaded Oregon Democratic Gov. Ted Kulongoski and Republican California Gov. Arnold Schwarzenegger to reach an agreement.

The deal had something for everyone: The Klamath Tribes, with senior water rights, subordinated those rights for a large grant to purchase land. The federal government paid half the cost of removing the dams, and the state of California paid the other half.

Then a stumbling block intruded: Powerful Republicans opposed dam removal and the legislation that would have put the agreement into effect.

But negotiations continued, this time without the federal government picking up any of the costs. As 2022 ended, California Gov. Gavin Newsom joined Oregon Gov. Kate Brown, PacifiCorp, the Tribes and others to celebrate the Federal Energy Regulatory Commissionโ€™s approval of the dams coming down.

When they hold the big celebration this summer as the dams crumple, I hope people remember the courageous role of former Interior Secretary Kempthorne, who broke the impasse over the dams back in 2008.

When the very first American dam was destroyed, in 1999, I was in Augusta, Maine, to help celebrate. After the Edwards Dam was breached, the Kennebec River ran free for the first time since the novelist Nathaniel Hawthorne walked its banks 160 years before. On the south side of the river stood residents whose ancestors worked in the mills the dam had powered. Many were crying. It reminded me that change is never easy.

Elwha River. By Elwhajeff at English Wikipedia, CC BY-SA 3.0, https://commons.wikimedia.org/w/index.php?curid=9740555

And in 2012, I celebrated with others when the first of two dams on western Washingtonโ€™s Elwha River was breached. In both places, and as is true for most of the 1,200 dams that have been removed since then, rivers have quickly returned to life.

I look forward to seeing that same amazing burst of renewal after the four lower Snake River dams finally come down.

Rocky Barker is a contributor to Writers on the Range,ย writersontherange.org, an independent nonprofit dedicated to spurring lively conversation about the West. He is a longtime reporter about the Northwest.

Klamath River Basin. Map credit: American Rivers

#Colorado nonprofit among winners of #ColoradoRiver scarcity challenge — @WaterEdCO #COriver #aridification

Water users are urgently trying to keep Lake Powell on the Utah-Arizona border from dropping to a point where Glen Canyon Dam can no longer generate electricity. (Source: Bureau of Reclamation)

Click the link to read the article on the Water Education Colorado website (Jerd Smith):

A Colorado nonprofit is one of three winners of the national Colorado River Basin Water Scarcity Challenge, a philanthropic initiative to spur creative solutions to water shortages in the crisis-ridden, seven-state Colorado River system.

The Denver-based Colorado Water Trust will spend the next year working with Quantified Ventures developing new models for securing funds and identifying valuable water rights that can be used to help restore riparian areas, aid streams and maintain agricultural water uses.

Founded in 2002, the Colorado Water Trust partners with existing entities, such as the Colorado Water Conservation Board, as well as environmental and farm groups, to acquire or lease water rights, keeping that water in the streams to stretch the amount of water available for fish and the environment, irrigators and industry even during dry times.

Quantified Ventures is a finance and consulting company that specializes in developing sustainable solutions to environmental problems.

Across the American West, water users, government agencies, regulators and environmental groups are scrambling to find ways to save the river. Crippled by a megadrought thought to be the worst in 1,200 years, and shifts in climate that are reducing the mountain snows on which it relies, the river system is on the brink of collapse.

The Colorado River Basin Scarcity Challenge is funded by a $500,000 donation from the  Gates Family Foundation and the Walton Family Foundation, according to Quantified Ventures spokesman Matt Lindsay. [Editorโ€™s note: Fresh Water News is an initiative of Water Education Colorado which receives support from the Gates and Walton foundations.] Winners were announced Jan. 12.

โ€œThe Colorado River is facing an unprecedented crisis that requires innovative thinking and investment at an equally historic scale,โ€ said Morgan Snyder, in a prepared statement. Snyder is senior program officer for the Walton Family Foundation Environment Program. โ€œProjects like these that move past outdated systems and instead find new ways to conserve, adapt, and become more resilient are essential to ensure a sustainable water supply for the millions who depend on the river.โ€

Kate Ryan, a senior attorney at the Colorado Water Trust, said winning the scarcity challenge will help her organization develop new relationships in the finance world and find ways to move more quickly in an arena in which deals can take years to finalize, allowing the water trust to accomplish more.

โ€œThis will allow us to become more nimble and potentially to meet new investors,โ€ Ryan said. โ€œWe will also be looking at strategies for using water for additional sources of revenue, such as remarketing it downstream in a way that is complementary to our project partners. It will also help us recoup investment and turn that into operating revenue, or for funding new acquisitions or leases of water.โ€

The Tucson, Arizona-based Watershed Management Group is another winner. The Watershed Management Group will work with Quantified Ventures to develop new โ€œgreenโ€ infrastructure to improve the health of Tucsonโ€™s groundwater system, among other projects, with the goal of using less Colorado River water, according to Watershed Management Groupโ€™s Catlow Shipek.

โ€œOur goal is to build hydro local resilience to reduce our dependence on Colorado River supplies,โ€ Shipek said. โ€œThe idea is how do we restore our watershed but not at the expense of another watershed.โ€

The third winner, Ndrip, will use Quantified Ventures to evaluate how to increase the scale of its drip irrigation systems on tribal lands throughout the Colorado River Basin. Unlike other drip irrigation systems, Ndrip uses existing water distribution systems on farms and is gravity-based. These features help offset the high capital costs of more traditional drip irrigation systems, according to Ndripโ€™s website.

Ndrip, which has offices in Australia, Israel, South Africa and the U.S., could not be reached for comment.

Each of the scarcity challenge winners will spend roughly the next year with Quantified Ventures developing new solutions that will help improve the sustainability of the Colorado River system.

Jerd Smith is editor of Fresh Water News. She can be reached at 720-398-6474, via email at jerd@wateredco.org or @jerd_smith.

On July 7, 2020, we closed our headgate that takes water from the Little Cimarron for irrigation. The water in the above photo will now bypass our headgate and return to the river. Photo via the Colorado Water Trust.

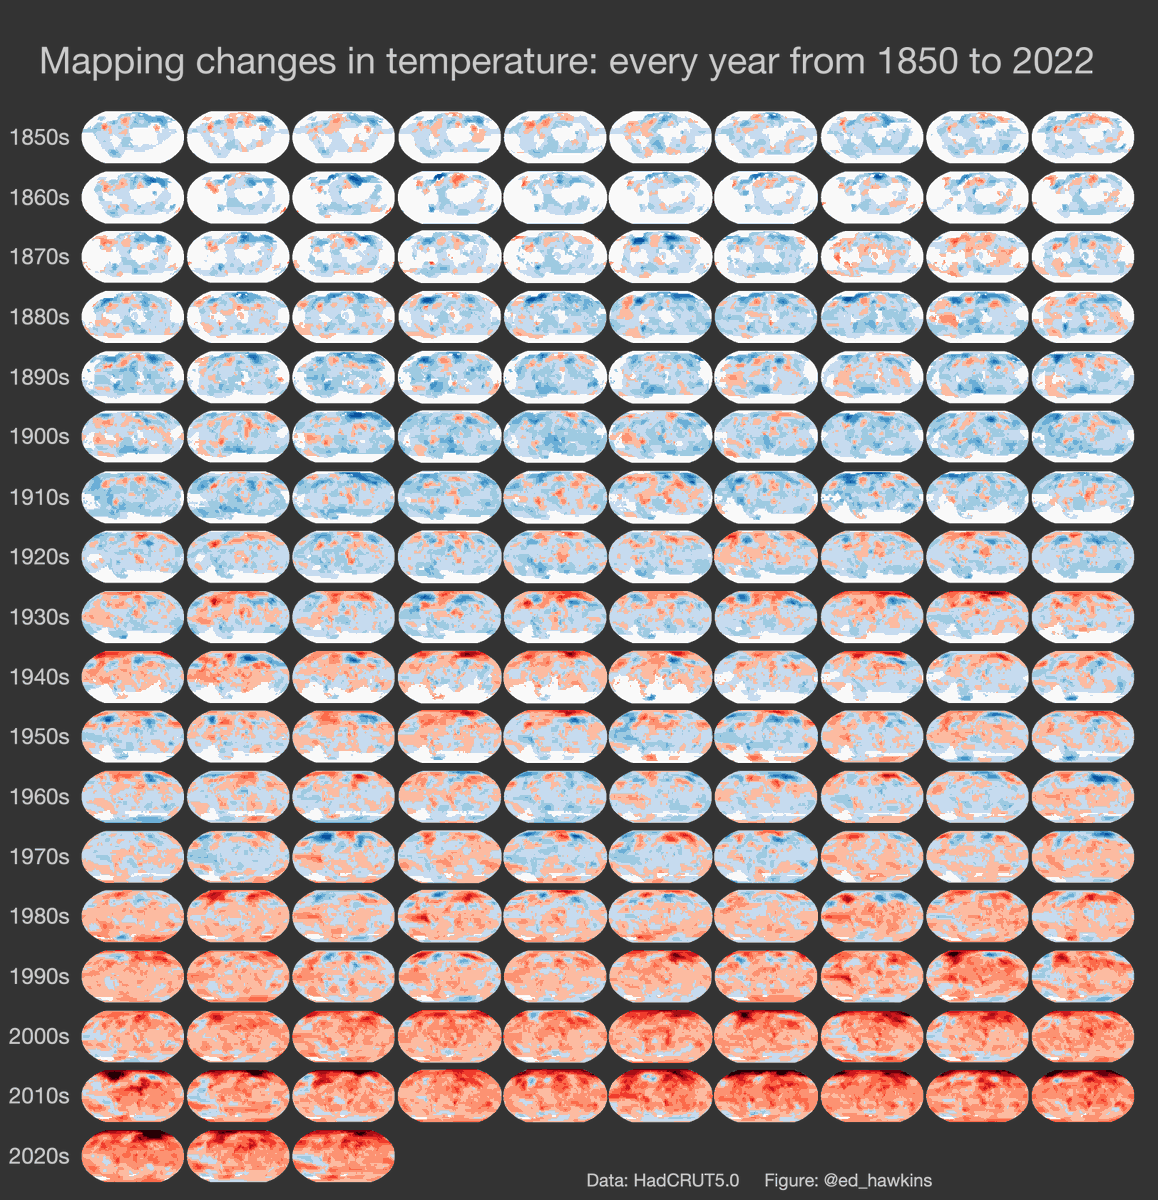
Changes are emerging across the #climate system. Everywhere we look, the climate is changing rapidly — @Ed_Hawkins #ActOnClimate #KeepItInTheGround

Rate of recent changes is unprecedented in at least 2000 years for many climate metrics. These changes are not natural; they are primarily caused by the burning of fossil fuels.

Scientists studying #water supply focus on weeks following peak #snowpack: April forecasts may no longer be reliable benchmark — @AspenJournalism

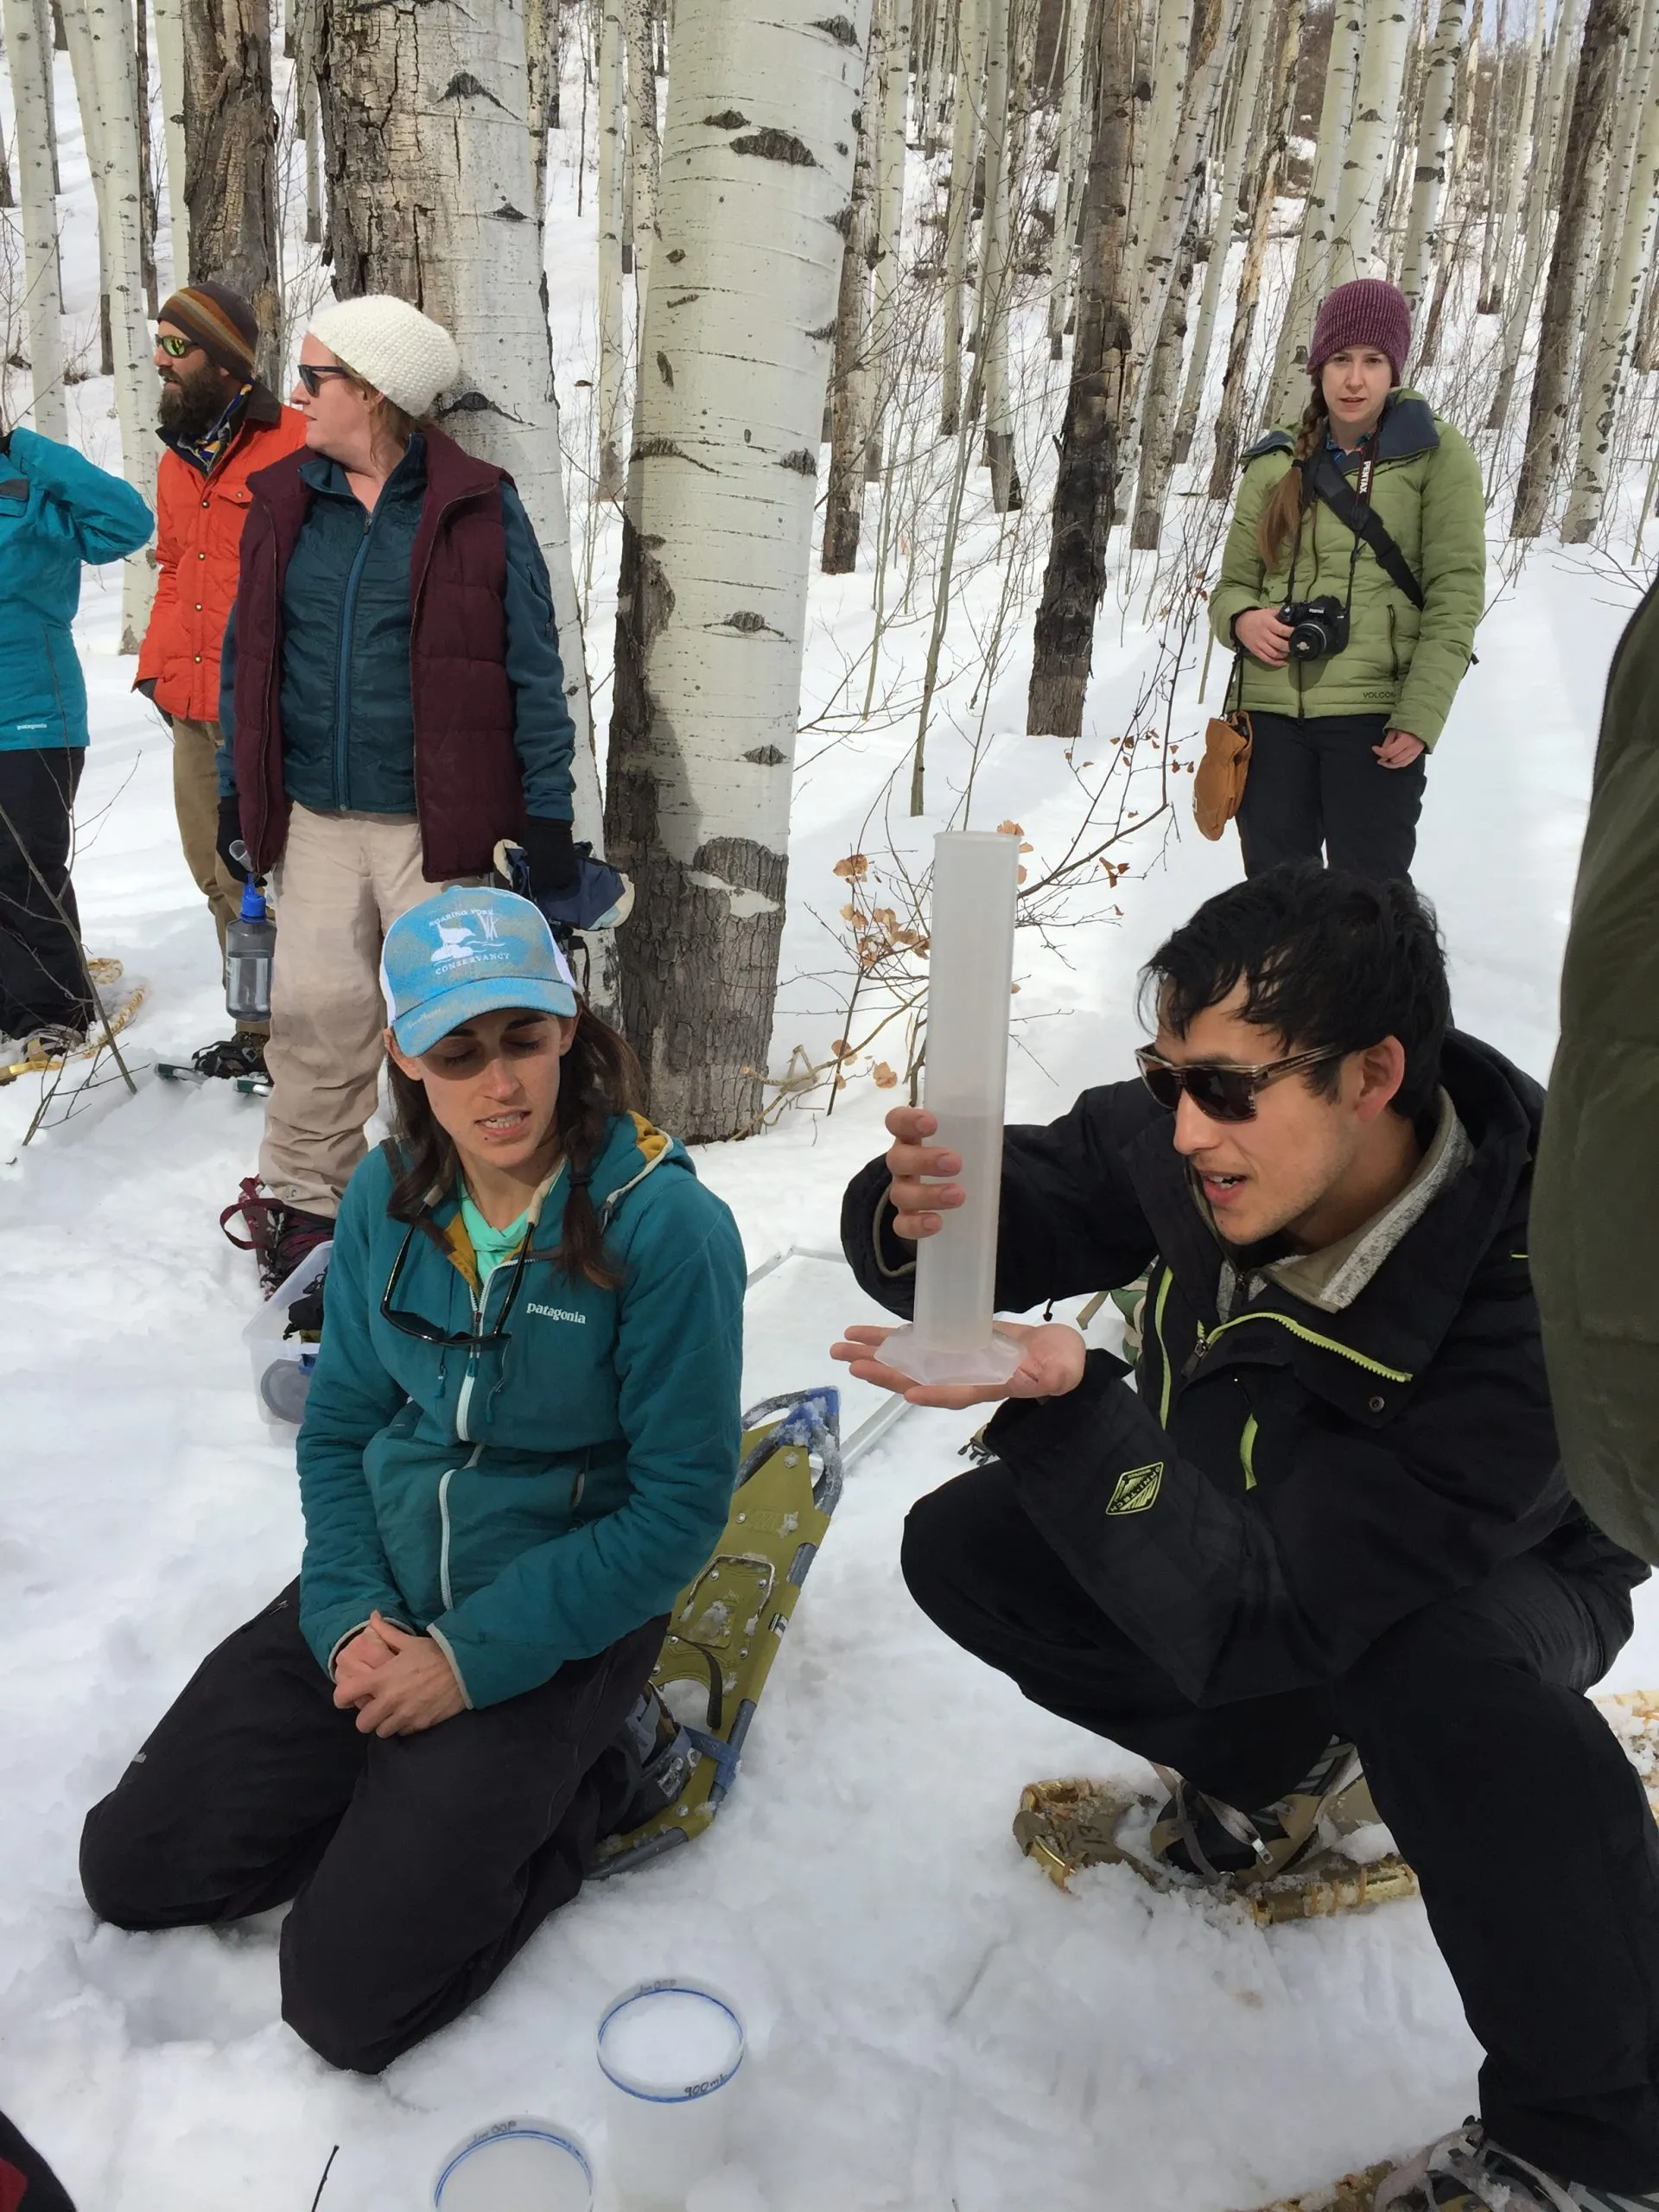
Volunteers learn how to measure how much water is contained in the snowpack, known as snow-water equivalent (SWE) at the SNOTEL site at the top of McClure Pass in March 2018. Water managers are gaining a better understanding that what happens in the weeks after peak snowpack in the spring can have an outsize influence on the yearโ€™s water supply. CREDIT: HEATHER SACKETT/ASPEN JOURNALISM

Click the link to read the article on the Aspen Journalism website (Heather Sackett):

Water managers in the Colorado River basin are gaining a better understanding that what happens in the weeks after peak snowpack โ€” not just how much snow accumulated over the winter โ€” can have an outsize influence on the yearโ€™s water supply.

Water year 2021 was historically bad, with an upper basin snowpack that peaked around 90% of average but translated to only 36% of average runoff into Lake Powell, according to the U.S. Bureau of Reclamation. It was the second-worst runoff on record after 2002. One of the culprits was exceptionally thirsty soils from 2020โ€™s hot and dry summer and fall, which soaked up snowmelt before runoff made it to streams. But those dry soils are only part of the story.

A new paper from the Desert Research Institute, a nonprofit science arm of the Nevada university system, found that heat waves in April 2021 drove record snowmelt rates at about 25% of snow-telemetry (SNOTEL) sites looked at across the West. SNOTEL is a network of remote sensing stations throughout the Westโ€™s mountainous watersheds that collect weather and snowpack information.

A heat wave that was concentrated over the Rocky Mountains on April 1-7 contributed toย record snowmelt at 74 stations, including areas that feed the Colorado River.

A few different agencies release monthly water-supply forecasts for April through July, including the National Resource Conservation Service, the Bureau of Reclamation and the Colorado Basin River Forecast Center. The April forecast is the first prediction of how streamflows will shape up for the year.

But according to the paper, in 2021, โ€œrates of snowmelt throughout April were alarming and quickly worsened summer runoff outlooks which underscores that 1 April may no longer be a reliable benchmark for western water supply.โ€

The paper did not quantify what exactly the record melt speed meant for water supply, but paper author and associate research professor of climatology Dan McEvoy said it definitely contributed to the poor inflow into the nationโ€™s second-largest reservoir in 2021. It also shows there are many more factors relevant to predicting the water supply than just how much water is in the snowpack, a metric known as snow-water equivalent (SWE), which is measured by SNOTEL sites.

โ€œThere was a combination of things that was contributing to this really low runoff in places like the Colorado River basin,โ€ McEvoy said.

Some of these other factors include very little April precipitation and warm nighttime temperatures, which didnโ€™t allow the snowpack to get into the daily freeze-thaw cycle thatโ€™s common in the spring. Persistent high pressure kept skies clear and sunny, which meant that more of the snowpack sublimated, evaporating instead of turning into liquid.

โ€œWhen itโ€™s sunnier and warmer, you can lose some of that water directly to the atmosphere,โ€ McEvoy said. โ€œIt doesnโ€™t even get to melt and go into the runoff.โ€

These rapid melting events could also help set up prime conditions for wildfires, he said, something he wants to continue studying.

โ€œWhen you have the snow disappear earlier thereโ€™s more time with the ground exposed, which contributes to drying out the vegetation in the spring and summer and an earlier onset to wildfire season,โ€ McEvoy said.

After peak snowpack

Climatologists at Colorado State University are working on a similar study that looks at how factors such as precipitation after peak snowpack affect spring runoff. Their findings underscore how important the conditions of the six to eight weeks after peak snowpack are for predicting streamflows.

โ€œOne of the things we found that was crystal clear from the study was that one of the major sources of water-supply forecast error is what happens after peak snowpack,โ€ said Peter Bennett Goble, a climatologist at CSU who is working on the study. โ€œJust knowing how much uncertainty is still out there on April 1 or even April 15 probably allows water managers to be a little more cautious, maybe hold a little bit more back, especially if it looks like itโ€™s going to be an early runoff.โ€

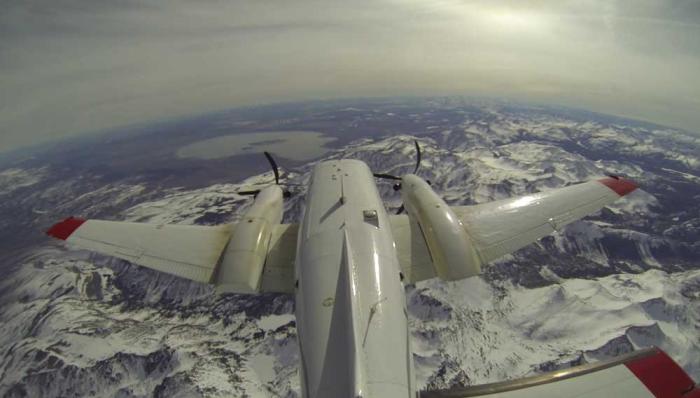
Predicting whether reservoirs will fill โ€” and therefore how much water to release to make room for the inflow โ€” can be tricky. Some municipal water providers use the Colorado Airborne Snow Measurement Program โ€” with its lidar-equipped planes โ€” to more accurately measure snowpack. For example, Denver Water has used CASM to see how much snow is in the headwaters of the Blue River basin, which feeds Dillon Reservoir, its largest storage bucket.

But aside from this technology, which is expensive and not yet available everywhere, water managers rely heavily on data from the SNOTEL sites to make streamflow forecasts. This method has limitations, providing just a snapshot of conditions at one location.

These limitations can be seen in recent yearsโ€™ forecasts for Ruedi Reservoir, on the Fryingpan River. Initial forecasts in April 2021 projected Ruedi could probably fill to its entire 102,373-acre-foot capacity, but the reservoir ended up only about 80% full that year. In 2020, each of the three main forecasting agencies also overpredicted Ruedi inflow for the months of April, May and June. (An acre-foot covers 1 acre to a depth of 1 foot.)

Tim Miller, a hydrologist with the U.S. Bureau of Reclamation who manages operations at Ruedi, said his models predicted a 2021 Ruedi inflow of 111,000 acre-feet, but only 77,000 acre-feet actually flowed in. That the models are based on historical SNOTEL data from past decades is a drawback as climate change progresses, but itโ€™s the best we have, Miller said.

โ€œIt makes the assumption that what we have seen in the past is what we will see in the future, which is a really poor assumption when youโ€™re in the middle of a change in the climate,โ€ Miller said. โ€œWe will probably see events like we havenโ€™t seen in the future and we are using what weโ€™ve seen to predict them.โ€

Dave Kanzer, director of science and interstate matters for the Glenwood Springs-based Colorado River Water Conservation District, said people often look for a single explanation when streamflows donโ€™t match predictions. The River District owns and operates Wolford Mountain Reservoir, near Kremmling, and stores water in Ruedi Reservoir. But there is often a whole host of compounding factors that water managers will have to begin weighing more heavily as the climate warms.

โ€œItโ€™s not just about soil moisture, itโ€™s not just about solar radiation, itโ€™s not just about temperatures, itโ€™s not just about the winds โ€” itโ€™s everything,โ€ Kanzer said. โ€œIn some cases, like 2021, you get what some people like to call the perfect storm.โ€

Aspen Journalism covers water and rivers in collaboration with The Aspen Times.

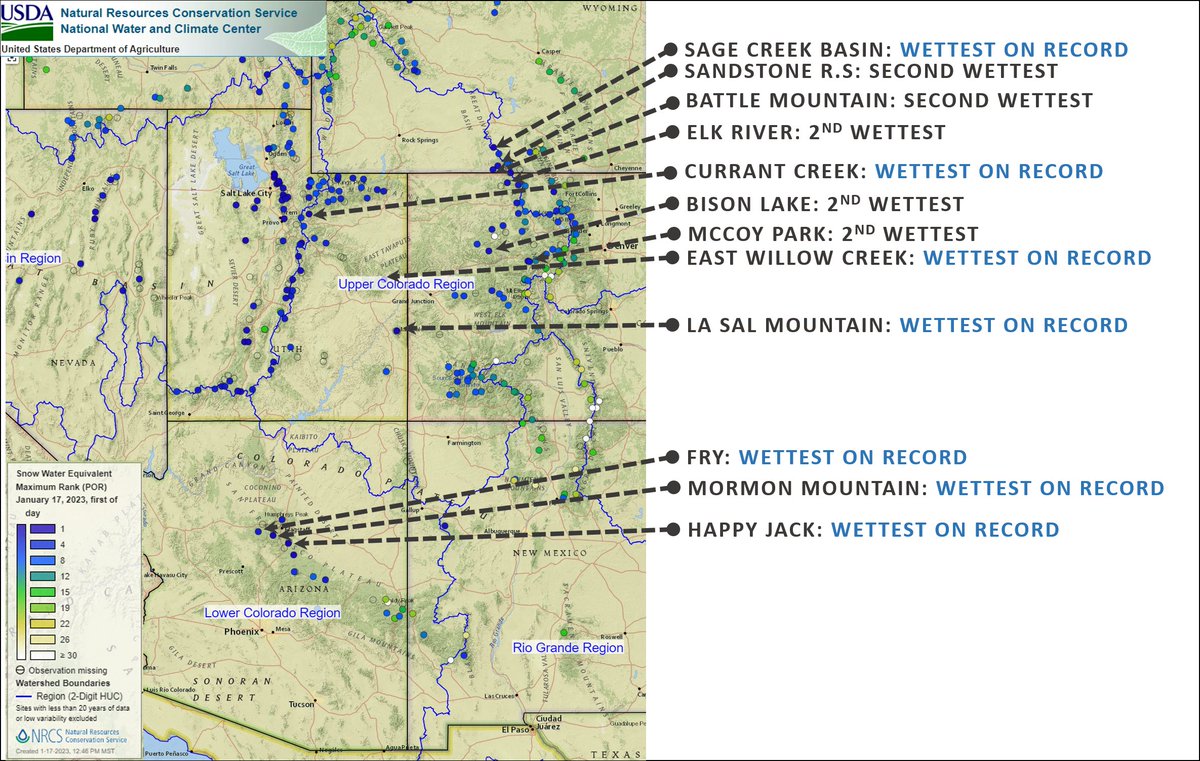
Recent precipitation and a persistent active weather pattern have led to conditions that are the wettest (or among the wettest) on record — @nwscbrfc #ColoradoRiver #COriver #aridification #snowpack (January 20, 2023)

If conditions hold through winter, we can expect above-average streamflow forecasts throughout the Colorado River Basin.

Want to solve #ClimateChange? This #California farm kingdom holds a key — The Los Angeles Times #ColoradoRiver #COriver #aridification

Southern California’s Imperial Valley. Ted Wood/The Water Desk

Click the link to read the article on The Los Angeles Times website (Sammy Roth). Here’s an excerpt:

…welcome to the Imperial Valley. Wedged in Californiaโ€™s southeastern corner, itโ€™s one of the most important places youโ€™ve probably never been. To one side of [Ralph] Strahmโ€™s farm is the Sonoran Desert at its most stark, where creosote-studded washes give way to glimmering sand dunes and craggy mountain peaks. To the other side is an astonishingly productive agricultural empire. Nearly half a million acres of lush green fields sprawl into the distance, popping out lettuce, sugar beets, onions, cattle feed and more…

But keeping the vegetable aisle stocked comes at a cost. Imperial County farm barons use more Colorado River water than the rest of California combined. And as the planet heats up, thereโ€™s less and less water to go around…

Clean energy advocates see Imperial as an ideal place for solar farms and battery projects that can help solve the American Westโ€™s energy and water crises. The land is flat; the sunlight, abundant. The Colorado River desperately needs relief. And Imperial is one of Californiaโ€™s poorest counties, its agriculture-heavy economy practically crying out for diversification and higher-paying jobs But resistance to change runs deep, particularly among the few hundred families who own all the farmland. Agriculture is the only way of life many of them have known, and theyโ€™re raring to defend it. Their ancestors settled here a century ago, staking an early claim to the Colorado and carving canals to carry its riches through the desert. Again and again, theyโ€™ve faced pressure to sell water to coastal cities. Theyโ€™re ready to pounce on anything that smells like a water grab. And to some of them, solar power smells like a water grab…

Lurking beneath these battles are urgent questions with no easy answers: What is the landโ€™s best use? Who gets to decide? And how do we balance water conservation, food production and clean power generation in an era of climate emergency?

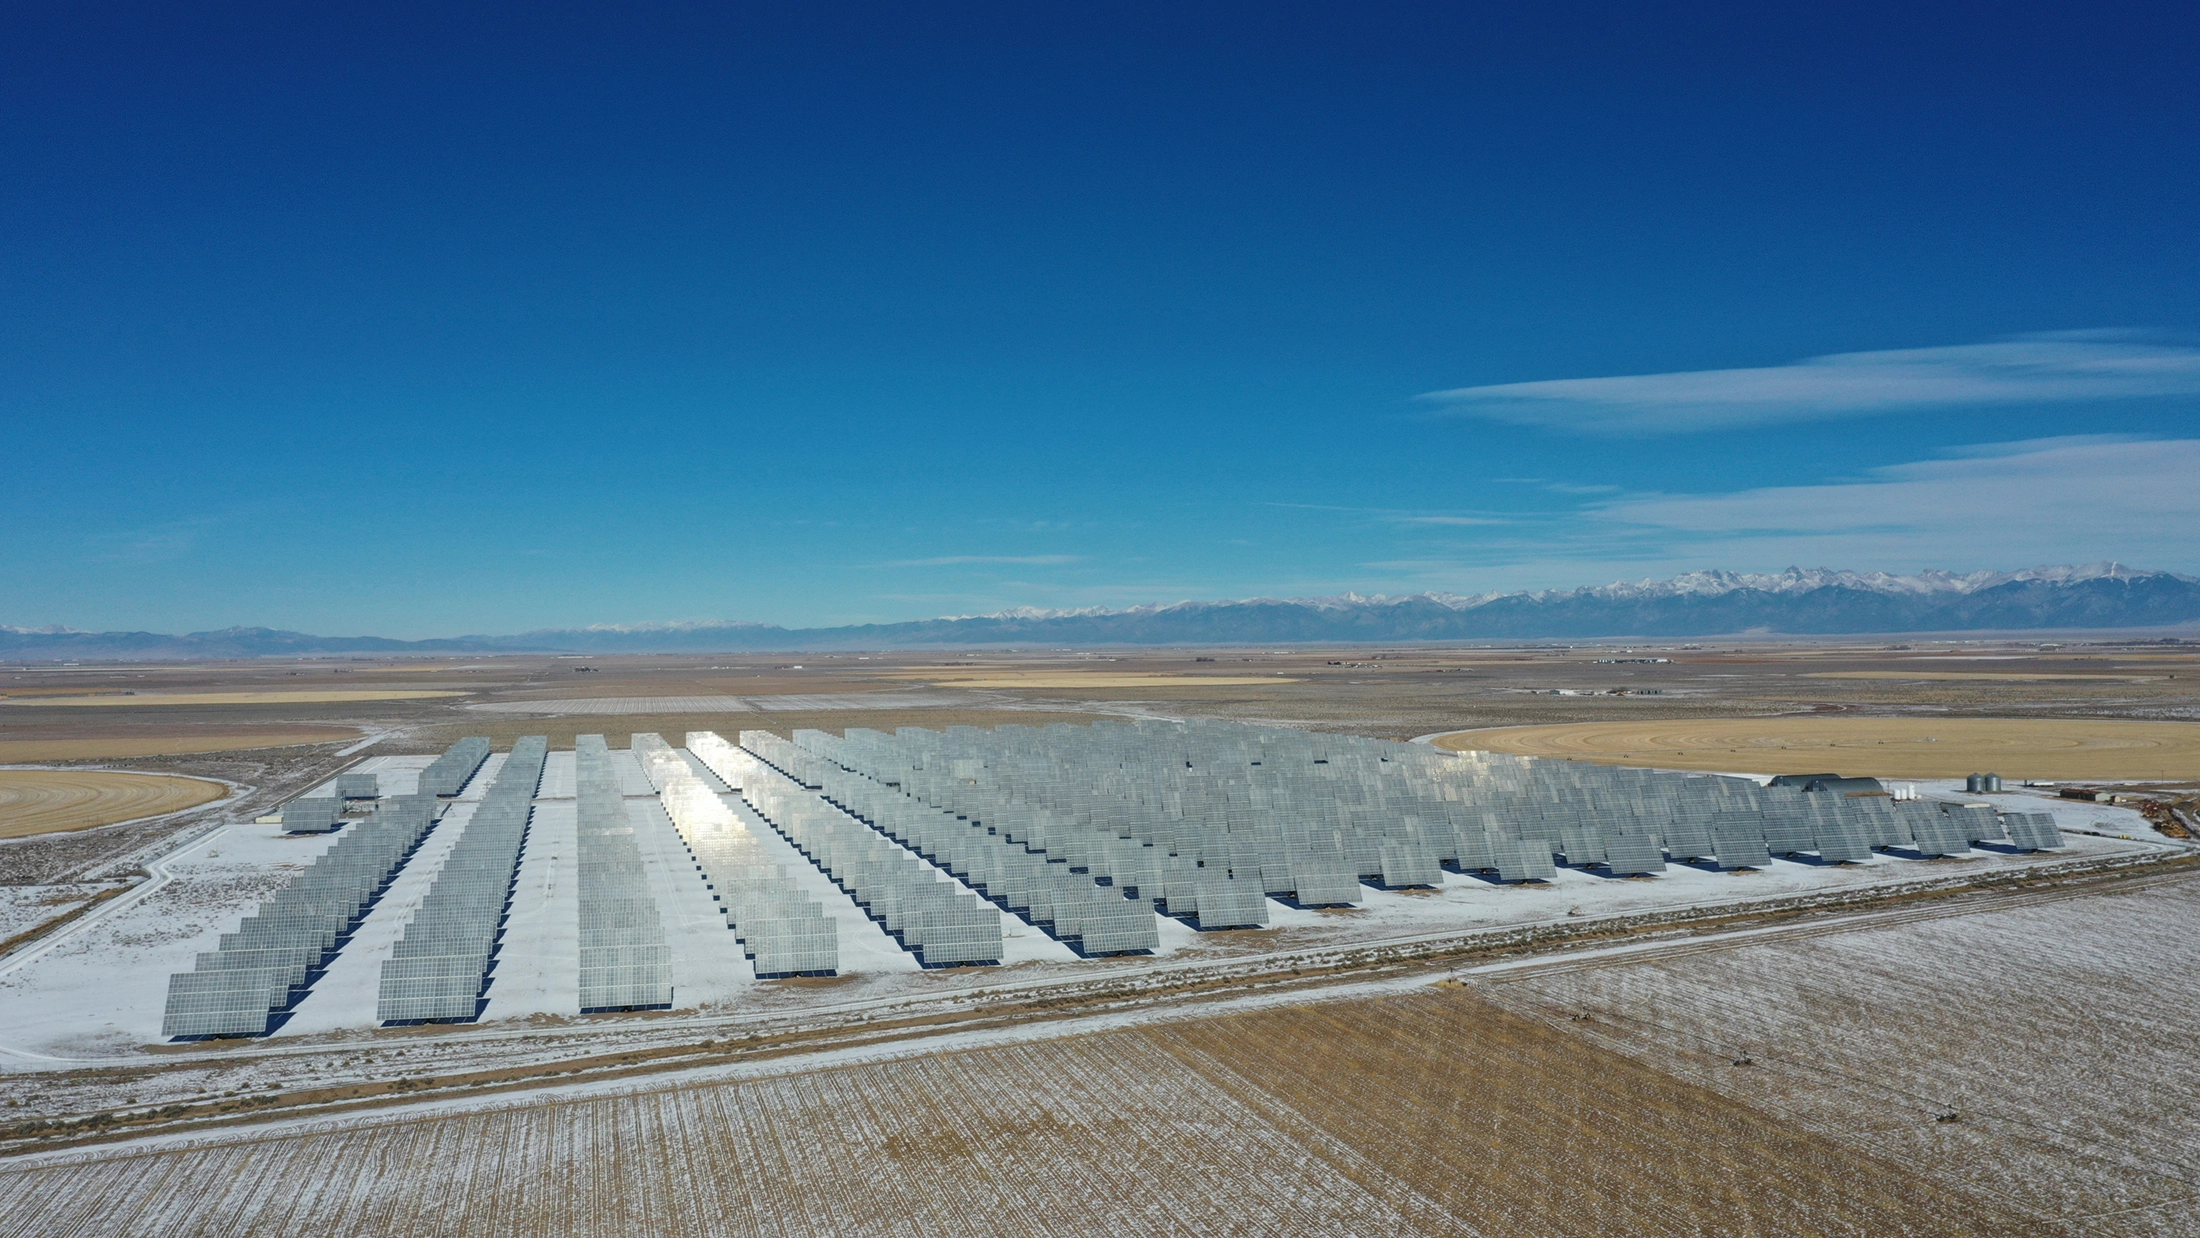
A solar farm off CO 17 in Alamosa County. The San Luis Valley produces 10 percent more power per solar panel than anywhere else in the state due to its base elevation of 7,500 feet and more days of sun than the Front Range and anywhere else in Colorado. Photo by Owen Woods via The Alamosa Citizen

#Snowpack levels in major Summit County river basin reach 121% above 30 year median (January 20, 2023) thanks to recent storm systems — The Summit Daily #BlueRiver #ColoradoRiver #COriver

Click the link to read the article on the Summit Daily website (Cody Jones). Here’s an excerpt:

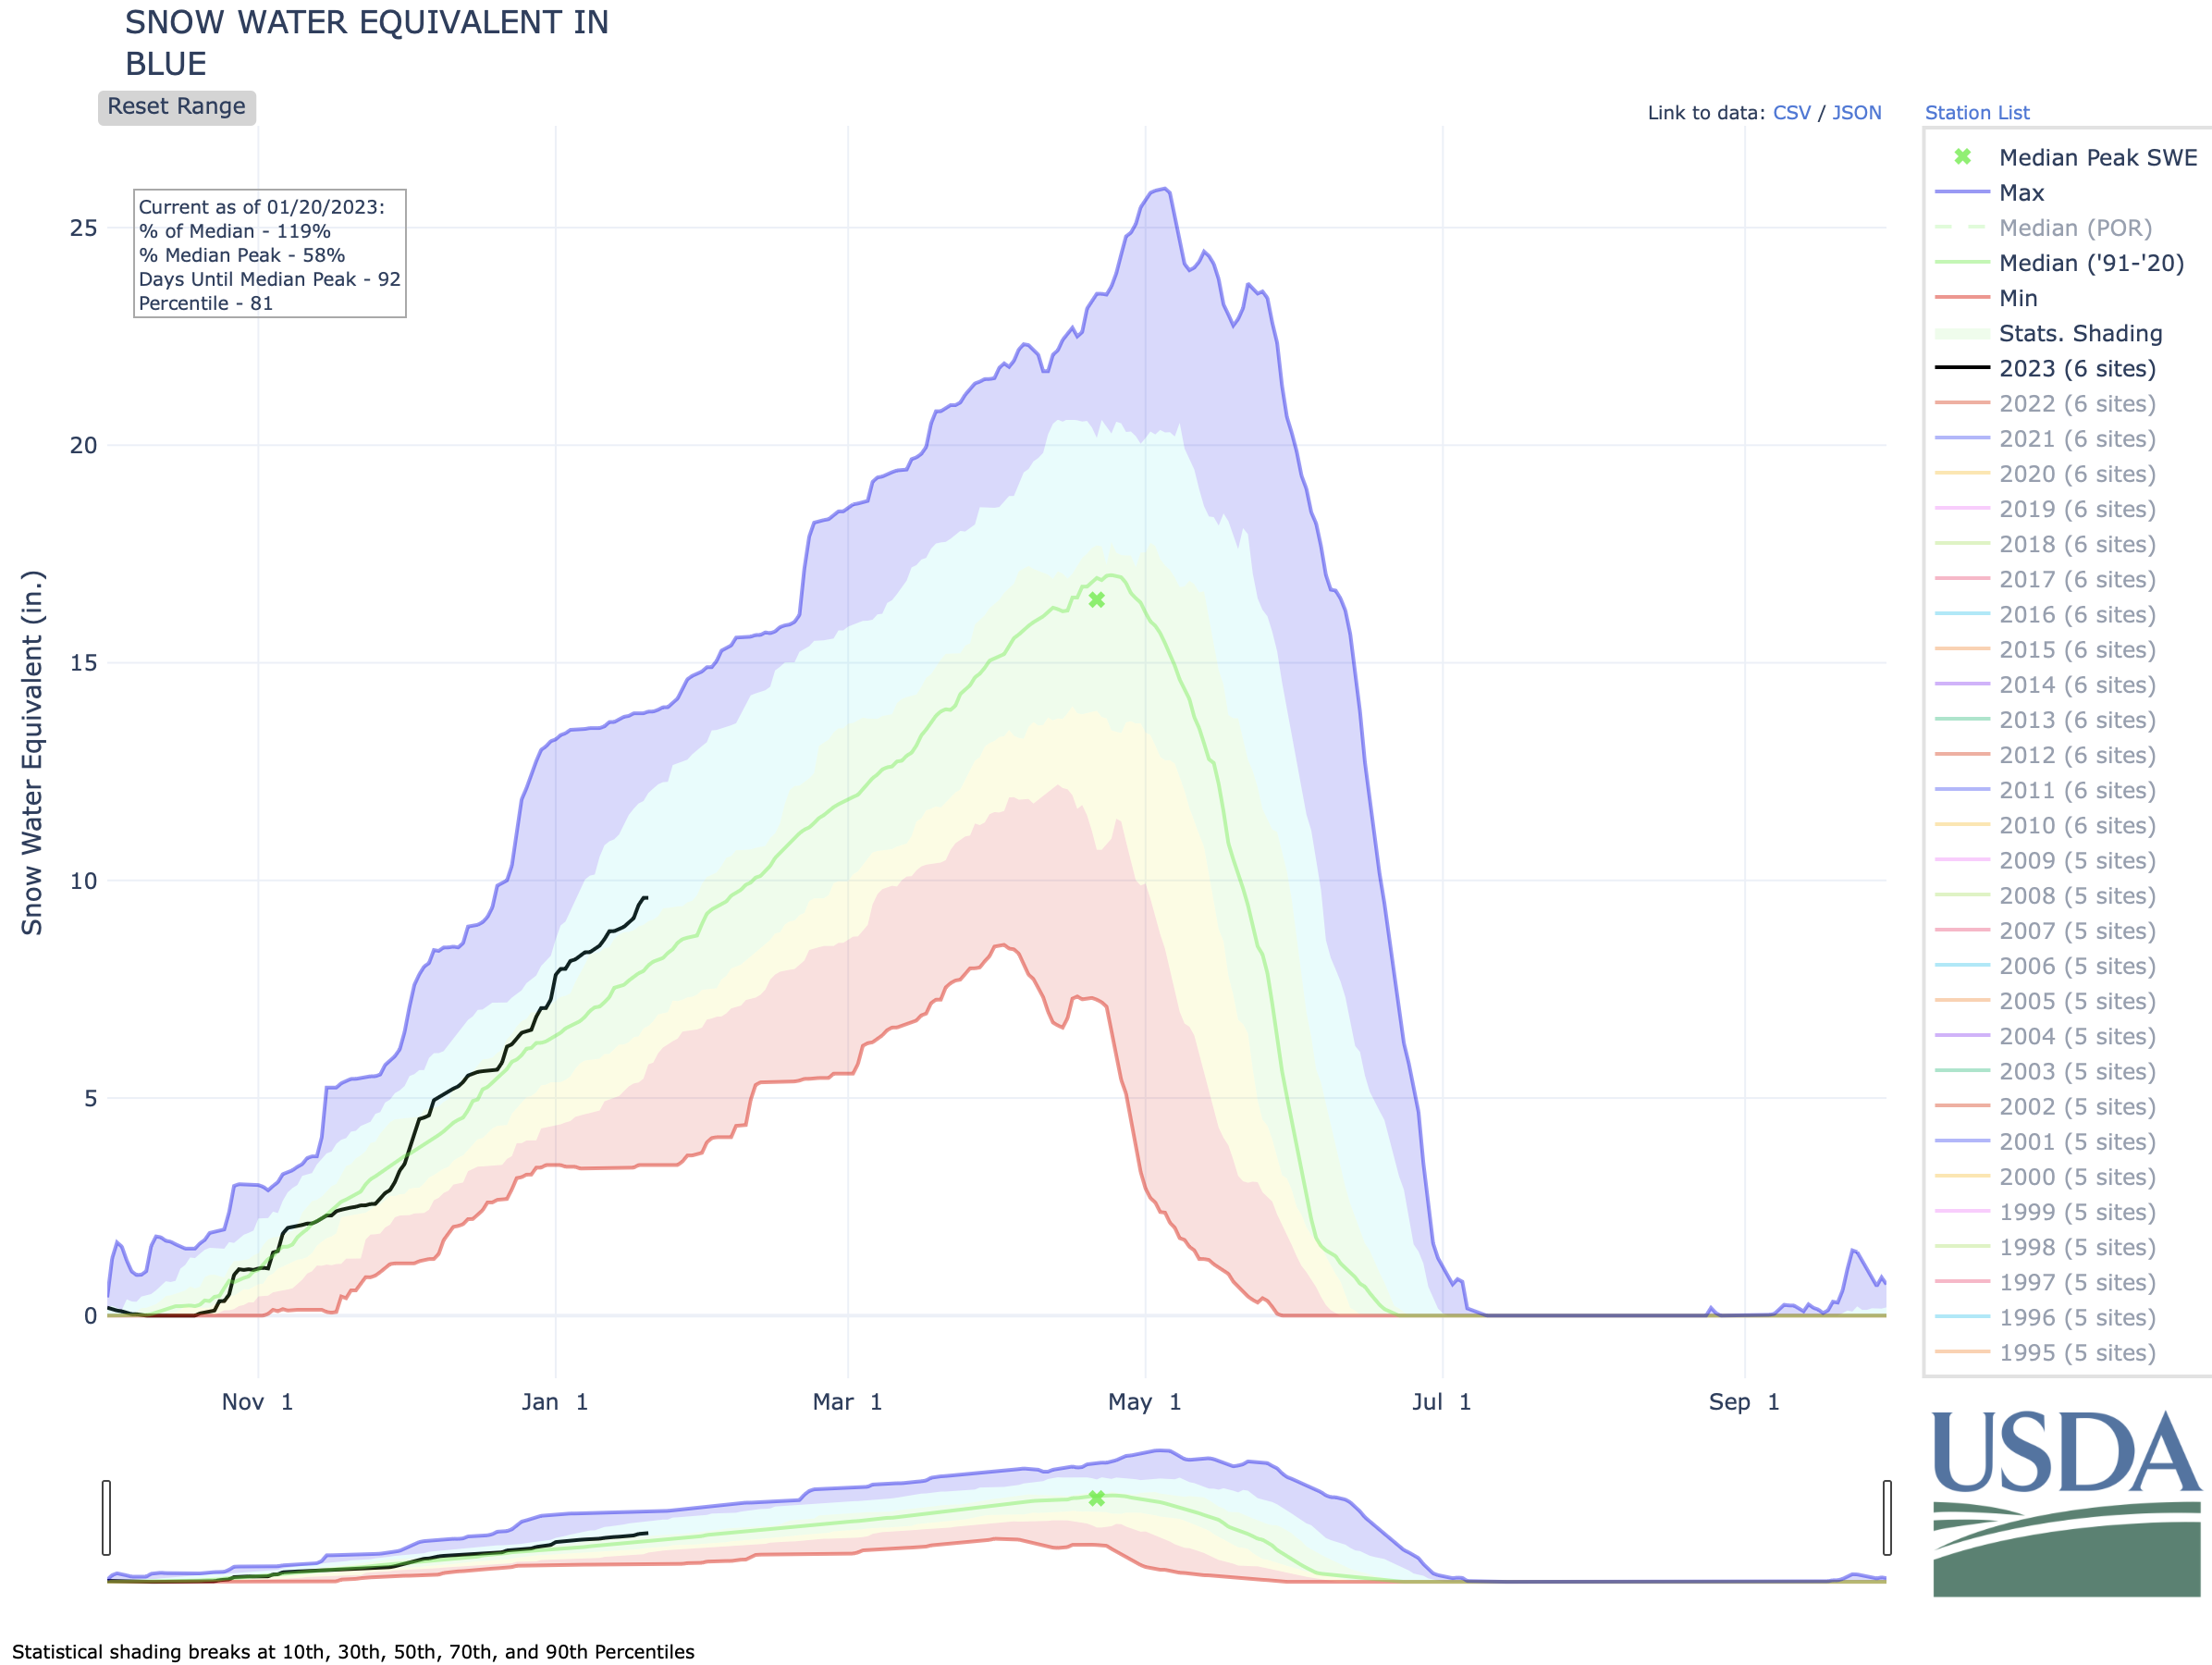
According to the National Weather Service, the last winter storm frontย  โ€” which hit Summit County from the evening of Tuesday, Jan. 17, to Wednesday afternoon โ€”ย  brought anywhere from 3 to 7 inches of fresh snow, though local ski resorts reported higher totals at their high-elevation snow stakes…The new snow helped to further push the Blue River Basinโ€™s snowpack in the right direction to aid summer runoff and water levels…According to data from theย National Resources Conservation Service,ย the Blue River Basinโ€™s snowpack and snow water equivalent is currently reading at 9.6 inches as of Thursday, Jan. 19. This weekโ€™s snowfall boosted the snowpack from 9.4 inches on Wednesday and 8.9 inches from the beginning of the week on Sunday, Jan. 15…Currently the snowpack in the Blue River Basin is at 121% of the 30-year median and 58% of the median peak.

West snowpack basin-filled map January 19, 2023 via the NRCS.

Biden-Harris Administration Launches New Efforts to Address the Wildfire Crisis — USDA

The Hayman Fire is the stateโ€™s largest recorded wildfire. Smoke from the massive blaze could be seen and smelled across the state. Photo credit to Nathan Bobbin, Flickr Creative Commons.

Click the link to read the article on the USDA website:

Today, Agriculture Secretary Tom Vilsack announced expanded efforts to reduce wildfire risk across the western U.S. These investments, made possible through President Bidenโ€™s landmark Bipartisan Infrastructure Law (BIL) and the Inflation Reduction Act (IRA), will directly protect at-risk communities and critical infrastructure across 11 additional landscapes in Arizona, California, Idaho, Nevada, Oregon, Utah and Washington.

โ€œIt is no longer a matter of if a wildfire will threaten many western communities in these landscapes, it is a matter of when,โ€ said Secretary Vilsack. โ€œThe need to invest more and to move quickly is apparent. This is a crisis and President Biden is treating it as one. Todayโ€™s announcement will bring more than $490 million to 11 key landscapes across the western United States, and will be used to restore our national forests, including the restoration of resilient old-growth forest conditions.โ€

The Forest Service announced their original 10 landscape project areas last year as part of the agencyโ€™s broader strategy to protect communities, critical infrastructure and forest resources from catastrophic wildfire. Combined with these initial landscape investments, the additional efforts being announced today represent a total USDA investment of $930 million across 45 million acres.

This work spans 134 of the 250 high-risk โ€œfireshedsโ€ identified in the Wildfire Crisis Strategy and will mitigate wildfire risk to around 200 communities in the western U.S. Firesheds are areas where wildfire is likely to pose the greatest risk to communities and resources.

The landscapes for these additional investments were selected based on the potential for wildfire to affect nearby communities and buildings, with a focus on protecting underserved communities, critical infrastructure, public water sources and Tribal lands. USDA also considered more than 3,000 comments from 11 roundtable meetings held in the first half of 2022, which included partners, industry, Tribes and other stakeholders.

โ€œWe are building on the investments announced last year and by expanding the Forest Service effort to cover 21 landscapes where communities, critical infrastructure and our natural resources are most in need of protection from the growing threat of wildfires,โ€ said USDA Undersecretary for Natural Resources and the Environment (NRE), Dr. Homer Wilkes. โ€œThis is part of our agency wide focus to reduce wildfire risk across the country. We will use every tool we have to address this crisis and make your communities safer.โ€

Secretary Vilsack is also directing the Forest Service to use and prioritize a suite of provisions authorized in the Bipartisan Infrastructure Law to more quickly apply targeted treatments to the high-risk firesheds identified in the Wildfire Crisis Strategy, while opening up additional opportunities to pursue science-based reforestation, restoration of old growth forests and recovery of other areas impacted by wildfire.

These treatments are required to be ecologically appropriate, maximize the retention of large trees, protect old growth, and to consider possible effects on historically underserved communities and Tribes. Treatments are also to be carried out collaboratively alongside participating communities and partners.

โ€œDoing this work in the right place, at the right time, and at the right scale, combined with the use of emergency authorities, will accelerate our planning, consultation, contracting, hiring and project work to reduce wildfire risk and improve forest health and resilience,โ€ said Forest Service Chief Randy Moore. โ€œCollaboration with Tribes, communities and partners will remain a priority, and we will continue to use the best available science when carrying out this important work.โ€

Background: The Forest Service Wildfire Crisis Strategy

This announcement comes on the anniversary of the launch of the Forest Serviceโ€™s Wildfire Crisis Strategy, which debuted Jan. 18, 2022. A few months later, the agency introduced the initial 10 fire-prone landscapes that are now funded for the next five years through Bipartisan Infrastructure Law funds. In addition, President Bidenโ€™s Inflation Reduction Act will commit $1.8 billion to hazardous fuels reduction projects on national forests and grasslands.

Since releasing its Wildfire Crisis Strategy one year ago, the Forest Service and its partners have used the best available science and data to identify the highest risk landscapes for treatment projects. The Forest Service found that around 80% of the wildfire risk to communities is concentrated in less than 10% of firesheds. These targeted investments focus on firesheds of the highest risk, where projects are ready to begin or to expand.

The 10-year strategy calls for treating up to 20 million acres on national forests and grasslands and up to 30 million acres on other federal, state, Tribal, private and family lands to assure our forests are more resilient to wildfire and other effects of climate change, safer for communities, and remain key refuges for plants, fish and wildlife.

Over the past 20 years, many states have had record catastrophic wildfires, devastating communities, lives and livelihoods, and causing billions of dollars in damage. More than 10 million acres โ€“ more than twice the size of New Jersey โ€“ burned each year across the U.S. in 2020, 2017 and 2015.

The Wildfire Crisis Strategy builds on current work by leveraging congressional authorities and partnerships to support the departmentโ€™s work to mitigate wildfire risk, and restores forest health over the next decade. In addition to State Forest Action Plans, the strategy also aligns with the Collaborative Forest Landscape Restoration Program, Tribal Forest Protection Act, Good Neighbor Authority, Joint Chiefsโ€™ Landscape Restoration Partnership and Shared Stewardship agreements.

In June 2022, USDA released the Secretaryโ€™s Memorandum on Climate Resilience and Carbon Stewardship of Americaโ€™s National Forests and Grasslands. The Secretaryโ€™s memo builds on previous actions on climate change, equity, and forest resilience, and provides more specific and time-bound actions to integrate into agency programs. The Forest Service used the guidance in the Secretaryโ€™s memo to better inform the selection criteria for projects under the Wildfire Crisis Strategy, including equity, source water protection, community infrastructure and wildlife corridors. Recognizing that insects, disease, and wildfire are among the most significant threats to mature and old growth forests, in alignment with the Biden-Harris Administration, the Forest Service will be targeting hazardous fuels reduction projects to address these threats to promote the protection and restoration of mature or old-growth forests.

USDA touches the lives of all Americans each day in so many positive ways. Under the Biden-Harris Administration, USDA is transforming Americaโ€™s food system with a greater focus on more resilient local and regional food production, promoting competition and fairer markets for all producers, ensuring access to safe, healthy and nutritious food in all communities, building new markets and streams of income for farmers and producers using climate-smart food and forestry practices, making historic investments in infrastructure and clean energy capabilities in rural America, and committing to equity across the Department by removing systemic barriers and building a workforce more representative of America. To learn more, visit www.usda.gov.

The Spring Predictability Barrier: weโ€™d rather be on Spring Break — NOAA

Click the link to read the article on the NOAA website (Michelle L’Heureux):

Itโ€™s that time of year again when ENSO forecasters stare at the latest analysis and model forecasts and shake their heads in frustration. Why?  Weโ€™re in the heart of the so-called โ€œSpring Predictability Barrier,โ€ which is when the models have a harder time making accurate forecasts. Itโ€™s like trying to predict the next episode of Mad Men based on the tiny amount of detail given in the โ€œas seen on the next episodeโ€ clips. As we know from Tomโ€™s posts on verification (here, here, here), there are many ways to measure the accuracy, or skill, of seasonal climate predictions. Here, we will focus on just one measure (1), but there are other ways to gauge the spring barrier.

What is the Spring Barrier?

Is the Spring Barrier like a brick wall? In other words, do we smack right into it and cannot see or predict anything beyond it? No, not really. It is more like a lull or a valley in ENSO forecasting accuracy. After the spring (or the autumn for our friends in the Southern Hemisphere), the ability of the models to predict becomes increasingly better. Keep in mind that, in general, the skill of the models get better the closer you get to the period of time you are predicting. If you want to know whether it is going to rain, you are usually better off using a prediction the day before than you are a week out. The same is true in seasonal climate outlooks. However, during the spring, even making an ENSO forecast for the coming summer is pretty difficult.

April 2015 is almost over, and so how useful have the model forecasts been if we want to predict ENSO for the May-June-July (MJJ) season (2)? As you will see, the Spring Barrier is the climate forecasterโ€™s equivalent of mayhem. In a perfectly predictable world, we would be able to predict 100% of ENSO variability.ย  But statistical models (3) barely register a pulse, describing almost none of the fluctuations in ENSO during the MJJ season. State-of-the-art dynamical model (4) donโ€™t fare much better, only accurately predicting about less than a third (33%) of ENSO variability in the MJJ season. So, even for the closest period coming up, ENSO forecasters canโ€™t say a lot about it!

The skill (or forecasting ability) of model runs based on February, March, and April observations to predict the May-July (MJJ) average value in the Niรฑo-3.4 SST region (ENSO). Results shown here are an average correlation coefficient from each of the 20 models between 2002-2011 (data used from Barnston et al, 2012). Percent Explained Variance (%) is calculated by squaring the correlation coefficient and multiplying by 100 (see footnote #1). Models that explain all ENSO variability would equal 100%, while explaining none of the ENSO variance would equal 0%. Graphic by Fiona Martin based on data from NOAA CPC and IRI.

Now letโ€™s shift our attention to making an ENSO prediction for the coming winter season (for the November-January seasonal average). How useful are the models? Well, if youโ€™re running a model using October data as input, then youโ€™re in pretty good shape as you can expect close to 90% of the winter ENSO fluctuations to be predicted. In terms of lead time, thatโ€™s the same horizon as a forecast made in April for May-June-July (MJJ), and yet there is a huge difference in forecasting ability (5).

The skill (or forecasting ability) of model runs based on February-October observations to predict the November-January (NDJ) average value in the Niรฑo-3.4 SST region (ENSO). Results shown here are an average correlation coefficient from each of the 20 models between 2002-2011 (data used from Barnston et al, 2012). Percent Explained Variance (%) is calculated by squaring the correlation coefficient and multiplying by 100 (see footnote #1). Models that explain all ENSO variability would equal 100%, while explaining none of the ENSO variance would equal 0%. Graphic by Fiona Martin based on data from NOAA CPC and IRI.

However, hope slowly grows as we emerge from the spring. In particular, models run based on May data are getting close to explaining half of the coming winter variability, which isnโ€™t shabby. 

But, still, predictions are still far from assured. Using July and August data, about three-quarters of the winter ENSO fluctuations are predicted by the models. So while forecast โ€œsurprisesโ€ are becoming less frequent, they still lurk around.

Overcoming the Spring Barrier?

So, why is the accuracy of the models so bleak during the spring? Is there reason to believe that more model development will improve upon the low skill we see during the spring? While there are many ideas on why the spring barrier exists, there are no definitive culprits (Webster and Yang, 1992, Webster, 1995, Torrence and Webster, 1998, McPhaden, 2003, Duan and Wei, 2013). 

One of the reasons that the spring barrier is said to exist is because spring is a transitional time of year for ENSO (in our parlance,ย signals are low and noise is high). The spring is when ENSO is shifting aroundโ€” often El Niรฑo/La Niรฑa events are decaying after their winter peak, sometimes passing through Neutral, before sometimes leading to El Niรฑo/La Niรฑa later on in the year. It is harder to predict the start or end of an event than to predict an event that is already occurring. There is also weaker coupling between the ocean-atmosphere in the spring due to a reduction in the average, or climatological,ย SST gradientsย in the tropical Pacific Ocean. However, for various reasons, these factors donโ€™t fully explain why we see lower skill (6).

Seasonal allergies… the real cause of the Spring predictability barrier. Illustration by Emily Greenhalgh, NOAA Climate.gov.

One โ€œclueโ€ for the barrier lies in the fact the dynamical models perform better compared to the statistical models during the spring (see figure above: the blue bars are larger than the green bars). In fact, just during the last decade, dynamical models have slightly edged statistical models in their overall ENSO forecast ability because of their improvement during the spring (Barnston et al., 2012). During the other seasons, running a statistical or dynamical model gives you about the same amount of ENSO forecast skill. 

What is special about dynamical models during the spring? One of the attributes of dynamical models is that they are run more frequently using the most recent observed data as input. Many statistical models are built on monthly or seasonal (3-month) average data, so by comparison, are receiving inputs that are relatively older.  Dynamical models also ingest a lot more observations (such as the subsurface ocean) using complex data assimilation schemes. These qualities may allow dynamical models to โ€œseeโ€ better and potentially lock onto potentially important changes that occur during the spring. But keep in mind this increased skill is relative to the statistical models– the dynamical model skill is still low overall.    

As Eric Guilyardi wrote inย his blog postย last week, there is room to improve models by better understanding their errors and improving the assimilation of observational data. Potentially, with more research and development, we will see the models become more skillful during the spring. Until then, ENSO forecasters would rather be on spring break.

Footnotes:

(1) As a first step, we calculate the โ€œcorrelation coefficientโ€ or the Pearsonโ€™s correlation coefficient. We also introduced this concept in Tonyโ€™s blog post discussing the ENSO skill over the past couple of years. The correlation coefficient ranges between 0 (no skill) and -1/+1 (perfect skill). However, in the figures above, we put it in terms of โ€œexplained variance,โ€ by squaring the coefficient and multiplying by 100. Explained variance can range from 0% to 100%. 0% means that the models describe none of the variability of the ENSO index (the wiggles or ups and downs in the time series). 100% means that the models predict all of the fluctuations in the ENSO. So, ideally, want to see 100% variance explained even though that will never happen because our world is not perfectly predictable. 

(2) We use data gathered during a 10-year period of operational model runs, which are presented on the IRI/CPC plume of Niรฑo-3.4 SST index predictions (Barnston et al., 2012). Un-gated copy is available here. 

(3) Statistical models: computer models that predict how current conditions are likely to change by applying statistics to historical conditions. Physical equations of the ocean and atmosphere are not used. These models can be run on a small desktop computer.

(4) Dynamical models: computer models that predict various oceanic, atmospheric, and land parameters by solving physical equations that use current โ€œinitialโ€ conditions as input. State-of-the-art dynamical models must be run on high-performance supercomputers.

(5) Because of the limited length of the operational model runs, we expect that the 95% level of significance isnโ€™t achieved until the explained variance is greater than ~45% (based on 9 degrees of freedom and using the sampling theory of correlations). Therefore, there is a fair chance that values not reaching that threshold may be randomly achieved and therefore are not particularly meaningful. 

(6) In the opinion of the author and some of her colleagues, there is a bit of a chicken-egg problem by arguing that lower skill of the models is due to the transitional nature of ENSO or the low signal-to-noise ratio in the spring. Low predictability and low signal-to-noise go hand-in-hand.  One does not cause the other. Also, the fact that the climatological SST gradient is at a minimum during the spring doesnโ€™t clearly explain why ENSO — which is a departure from climatology (or anomaly) — would also be impacted (and the opposite should be true in the autumn when the SST gradient is maximized– yet ENSO peaks during the winter). 

References:

Anthony G. Barnston, Michael K. Tippett, Michelle L. L’Heureux, Shuhua Li, and David G. DeWitt, 2012: Skill of Real-Time Seasonal ENSO Model Predictions during 2002โ€“11: Is Our Capability Increasing?. Bull. Amer. Meteor. Soc., 93, 631โ€“651.

Duan, W. and Wei, C. (2013), The โ€˜spring predictability barrierโ€™ for ENSO predictions and its possible mechanism: results from a fully coupled model. Int. J. Climatol., 33: 1280โ€“1292. doi: 10.1002/joc.3513

McPhaden, M. J. (2003), Tropical Pacific Ocean heat content variations and ENSO persistence barriers, Geophys. Res. Lett., 30, 1480, doi:10.1029/2003GL016872, 9.

Torrence, C. and P. J. Webster, 1998: The Annual Cycle of Persistence in the El Niรฑo-Southern Oscillation. Q. J. Roy. Met. Soc., 124, 1985-2004.

Webster, P. J. , 1995: The annual cycle and the predictability of the tropical coupled ocean-atmosphere system. Meteor. Atmos. Phys., 56, 33-55.

Webster, P. J. and S. Yang, 1992: Monsoon and ENSO: Selectively Interactive Systems. Quart. J. Roy. Meteor. Soc., 118, 877-926.

#GunnisonRiver, #TaylorRiver earn Gold Medal trout fishery status — #Colorado Parks & Wildlife

A rainbow trout is pictured during survey work of the Taylor River below Taylor Park Reservoir. (Jerry Neal/CPW photos taken from video)

Click the link to read the release on the Colorado Parks & Wildlife website (John Livingston):

Years of consideration and conservation work all led to a golden moment for two pristine rivers in central Colorado.

During its meeting Jan. 18 in Colorado Springs, the Colorado Parks and Wildlife Commission welcomed the Gunnison and Taylor Rivers as the newest Gold Medal trout fisheries in the state. CPWโ€™s Gold Medal Program showcases the most elite fisheries throughout the state.

The stretches nominated and approved include 20 miles of the Taylor River below Taylor Park Reservoir and 12.5 miles of the Gunnison River starting west of the town of Gunnison at Twin Bridges extending up to the town of Almont.

โ€œIโ€™m pretty excited to be able to announce these two waters into our Gold Medal Program,โ€ said CPW Assistant Aquatic Section Manager Josh Nehring. โ€œItโ€™s an achievement that came about by a lot of work by a lot of people over a number of decades. Itโ€™s amazing to see the quality of fisheries that we have here.โ€

Fisheries in Colorado may be designated by CPW as โ€œGold Medalโ€ if they meet two qualifying criteria. The standard is 60 pounds of fish per acre along with at least 12 quality trout of 14 inches or greater per acre.

With the addition of the Gunnison and Taylor Rivers, Colorado now boasts 19 Gold Medal sections on 13 rivers that total roughly 362 miles. The state also has three lakes that have earned Gold Medal designation.

While the Gunnison and Taylor are newly-designated Gold Medal streams, CPW aquatic biologists believe the rivers have produced Gold Medal quality trout fishing since the 1990s. 

CPW Aquatic Biologist Dan Brauch said that while the rivers had met the biological criteria for designation for decades, it was important to ensure the streams provided long-lasting fish habitat for all life stages of trout.

โ€œSignificant work went into maintaining conditions on the Gunnison and Taylor Rivers to allow those fisheries to continue to persist,โ€ Brauch said. โ€œWe have sampled the rivers quite a few times in the last 10 years, and we continued to see good numbers of quality-size trout and abundant trout.

โ€œThe Gunnison and Taylor Rivers really represent a successful conservation story with lots of partners that have made this fishery what it is today.โ€

CPW surveys streams regularly through the process of electrofishing. Fish are collected, weighed, measured and returned to the water. Data collected through these surveys provides invaluable data for CPW to assess the health of a fishery and to determine waters worthy of Gold Medal nomination.

โ€œIt does take quite a bit of work to get fisheries to this standpoint,โ€ said Nehring, who grew up in neighboring Montrose and has enjoyed fishing the two rivers since he was a child. โ€œJust the habitat that goes into it, the monitoring of the fisheries, making sure our regulations are appropriate and we arenโ€™t getting too many fish harvested. There are a lot of things that go into making sure the system is healthy.โ€

Brauch and Nehring thanked a multitude of public and private partners that have come together throughout time to support the Gunnison and Taylor fisheries as work has been done to improve and protect trout habitat through the Gold Medal stretches.

While celebrating the conservation success story that has led to Gold Medal status for the rivers, CPW Area Wildlife Manager Brandon Diamond encouraged anglers to help protect these resources for generations to come.

โ€œItโ€™s extremely important right now for all water users and conservation-minded people, including anglers, to view these incredible resources through a stewardship lens,โ€ Diamond said. โ€œAnd I strongly encourage all of us to evaluate how we can contribute to the long-term conservation of these waters and how we fit in as stewards of the land and river resources.

โ€œThe Gold Medal designation is certainly something we are locally proud of. The Gunnison Valley has always been very supportive of wildlife conservation values, and we hope to continue that relationship moving forward.โ€

R.I.P. David Crosby: “Eight Miles High”

David Crosby performing. By Christopher Michel – Crosby, Stills & Nash!, CC BY 2.0, https://commons.wikimedia.org/w/index.php?curid=24809958

Click the link to read the obituary on the Rolling Stone website (Jon Dolan). Here’s an excerpt:

Croz was inducted into the Rock and Roll Hall of Fame as a member of both the Byrds and Crosby, Stills, and Nash

Crosby was a founding member of the Byrds, playing guitar and contributing harmony vocals to many of their most enduring songs, including โ€œEight Miles High,โ€ โ€œSo You Want to Be a Rock โ€˜nโ€™ Roll Starโ€ and โ€œTurn! Turn! Turn!โ€ Shortly after being forced out of the group due to personality conflicts with frontman Roger McGuinn, he formed the supergroup Crosby, Stills, and Nash with Buffalo Springfieldโ€™s Stephen Stills and Graham Nash of the Hollies. The trio โ€“ which became a quartet in 1969 when Neil Young joined their ranks โ€“ played a major role in the development of folk-rock, country-rock and the emergent โ€œCalifornia soundโ€ that dominated rock radio throughout the mid-Seventies. Croz wrote many of their most beloved tunes, including โ€œAlmost Cut My Hair,โ€ โ€œLong Time Goneโ€ and โ€œDeja Vu.โ€

[…]

โ€œDavid was fearless in life and in music” — Graham Nash

[…]

In 1964, he joined a band called the Jet Set, consisting of Roger McGuinn and Gene Clark. They changed their name to the Beefeaters, and then the Byrds. Crosbyโ€™s gorgeous harmonizing, heard on hits like the Bob Dylan cover โ€œMr. Tambourine Manโ€ and โ€œTurn! Turn! Turn!,โ€ was an essential component in the Byrdsโ€™ folk-rock sound…Crosby and Stephen Stills, who had recently disbanded Buffalo Springfield, began writing songs together in 1968. They were soon joined by Nash, who had just quit the Hollies, and the trio performed together for the first time at the L.A. home of Cass Elliot of the Mamas and the Papas. Their self-titled 1969 debut was a hit, producing the classic single โ€œSuite: Judy Blues Eyes,โ€ about Judy Collins…Adding Neil Young later that year, the quartet played their second gig at Woodstock, in front of nearly 500,000 people, announcing the arrival of one of rockโ€™s first โ€” and greatest โ€” supergroups.

The latest seasonal outlooks through April 30, 2023 are hot off the presses from the #Climate Prediction Center

#Drought news January 19, 2023: Heavy precipitation helped erase areas of abnormal dryness in parts of #WA, #OR, W. #WY, W. #Colorado, #AZ and #NM

Click on a thumbnail graphic to view a gallery of drought data from the US Drought Monitor website.

Click the link to go to the US Drought Monitor website Here’s an excerpt:

This Week’s Drought Summary

An atmospheric river brought heavy rain and high-elevation snow across part of the West, leading to drought improvements in California, the Pacific Northwest, the northern Rockies and the Great Basin. A band of heavy rainfall, combined with severe weather, impacted the Southeast, leading to areas of drought improvement in Georgia. Meanwhile, persistent dryness led to the expansion of drought in the Carolinas. Drought in the High Plains remains largely unchanged; much of the excess moisture is tied up in snowpack and its effects on soil moisture and groundwater recharge remain to be seen. Drought expanded across parts of the South where short-term moisture deficits on top of longer-term drought continue to build…

High Plains

Much of the High Plains remained in a holding pattern last week. Areas that received abundant snowfall over the Water Year are slow to make improvements due to the long-term nature of drought in the region. Until spring melt shows verified evidence of soil moisture and groundwater recharge, it will be difficult to tell how much effect snow has had on drought conditions. Severe (D2) drought improved in eastern North Dakota, which has received 16 to 20 inches of snow this season. No areas deteriorated significantly, except for areas of abnormal dryness (D0) in South Dakota and Colorado…

Colorado Drought Monitor one week change map ending January 17, 2023.

West

The long-term drought continues across California, the Great Basin and parts of the Pacific Northwest. However, a barrage of atmospheric river events โ€“ streams of moisture in the atmosphere that transport water vapor from the tropics โ€“ has reduced the drought intensity over the past few weeks. In California, 1-category improvements were made along the Northern Coast, around the Delta and along the South Coast region. While precipitation over much of the state was over 300% of normal over the previous 2 weeks (2 to 12.5 inches, depending on location), deficits have been years in the making. While this last round of rain has helped return smaller reservoirs to the historical averages, many of the larger reservoirs still remain below the historical average for this time of year. Historically, long-term drought is interrupted by a period of abnormally wet weather. However, itโ€™s too early to tell if the wet weather is enough to end the drought. Many other parts of the West also saw improvements to drought and abnormally dry areas. In Oregon, 1-category improvements were made to extreme (D3) and severe (D2) drought in the southeast and near Klamath County based on above-average snow water equivalent and improvements to long-term indicators such as 6- to 24-month precipitation and shallow groundwater. In Idaho, severe (D2) and moderate (D1) drought improved where precipitation deficits over the past 12 months and streamflows show improvement. In Utah, areas of D3 and D2 improved based on precipitation in excess of 300% of normal (3 to 10 inches, depending on location) over the last 30 days and its resulting effect on streamflows, soil moisture, and groundwater. Heavy precipitation helped erase areas of abnormal dryness in parts of Washington, Oregon, western Wyoming, western Colorado, Arizona and New Mexico. The only places in the West seeing an expansion of drought were Oregon and Colorado. In Oregon, D1 was introduced in the south Willamette Valley and central Oregon Cascades and D1 and D2 expanded in the north-central part of the state. These expansions were in response to below-normal water-year-to date precipitation on top of longer-term deficits and groundwater impacts…

South

Much of Oklahoma and Texas missed out on this weekโ€™s precipitation events, resulting in the expansion of drought. In Oklahoma, temperatures averaged 10 to 13 degrees above normal over the previous 2 weeks while precipitation has been less than 50% of normal over the past 4 months. Extreme (D3) drought expanded in response to well-below-normal (10th percentile or lower) measurements of streamflow, groundwater and soil moisture conditions. Texas also saw a swath of degradations from the north-central region to South Texas where short-term moisture deficits, on top of longer-term drought, have continued to build, and streamflow, soil moisture and groundwater levels range from below (10th to 24th percentile) to well below normal (10th percentile or lower). In the eastern part of the region, last weekโ€™s rainfall erased lingering areas of abnormal dryness…

Looking Ahead

The National Weather Service Weather Prediction Center forecast for the remainder of the week (valid January 18 โ€“ January 20) calls for a winter storm to bring freezing rain and snowfall to the High Plains and Upper Midwest. To the southeast, showers and thunderstorms are expected with localized areas of heavy rainfall. Chances will increase for a wintry mix of snow, sleet and freezing rain along the East Coast as the storm system moves into the northeast on Thursday. Much of the southern U.S. can expect unseasonably warm temperatures. Meanwhile, another storm system is expected to move southeastward through the Pacific Northwest into the Northern Rockies, the Great Basin, California and the Desert Southwest, bringing rain and snow at lower elevations and heavier mountain snow. Moving into next week (valid January 21 โ€“ January 25), the forecast calls for a storm system to track from the central Plains to the Northeast, bringing strong winds and wintry weather to the northern regions and rain to the south. At 8 โ€“ 14 days, the Climate Prediction Center Outlook (valid January 25 โ€“ January 31) calls for below-normal temperatures over most of the country except for the Northeast, Southeast and Alaska. The Northeast can expect near-normal temperatures, while the Southeast and Alaska have the greatest probability of warmer-than-normal temperatures. Most of the U.S. can expect near- to slightly above-normal precipitation. Only the Pacific Northwest and northern Minnesota have increased odds for below-normal precipitation.

US Drought Monitor one week change map ending January 17, 2023.

Interior Assistant Secretary Trujillo Highlights Bipartisan Infrastructure Law #Drought Resilience Investments in #Colorado: $5 million investment in Prairie Waters Projects to expand water supplies in #Aurora #SouthPlatteRiver

Click the link to read the article on the Department of Interior website:

Assistant Secretary for Water and Science Tanya Trujillo wrapped up a multi-day visit to Colorado today, where she highlighted investments from President Bidenโ€™s Bipartisan Infrastructure Law and Inflation Reduction Act in drought resilience.

The Bipartisan Infrastructure Law allocatesย $8.3 billionย for Bureau of Reclamation water infrastructure projects over the next five years to advance drought resilience and expand access to clean water for families, farmers, and wildlife. The investment will repair aging water delivery systems, secure dams, complete rural water projects, protect aquatic ecosystems and fulfill Indian Water Rights Settlements. The Inflation Reduction Act is investing another $4 billion to address the worsening crisis. Combined these two initiatives represent the largest investments in climate resilience in the nationโ€™s history and provide a once-in-a-generation opportunity for the work of the Interior Department.

UV pretreatment Peter D. Binney Purification Facility.

Today [January 13, 2023] , she joined Congressman Jason Crow, Colorado Department of Agriculture Commissioner Kate Greenberg, and Aurora Mayor Mike Coffman to tour the Binney Water Treatment facility in Aurora to celebrate a recent $5 million investment from the Bipartisan Infrastructure Law that will allow the city to expand the Prairie Waters Project (PWP), securing more clean, reliable water. The funding is part ofย $84 millionย announced last month from the Bipartisan Infrastructure Law to advance innovative drought resilience efforts.

The City of Aurora constructed the PWP after the severe drought in 2002 to improve drought resiliency. The project is an innovative potable reuse system, which captures and treats river water to provide up to 10 million gallons of clean water to Aurora residents per day. With Bipartisan Infrastructure Law funding, the City will expand the PWP by constructing a second radial well and pump station and increasing the overall water recovery capacity by 4,500 acre-feet annually.

On Thursday, Assistant Secretary Trujillo spoke at the Four States Irrigation Council Annual Meeting to highlight how investments from both laws will support western communities. While in Colorado, Assistant Secretary Trujillo also visited with staff at the U.S. Geological Surveyโ€™s (USGS) Fort Collins Science Center and at the Denver Federal Center in Lakewood, Colorado. The Bipartisan Infrastructure Law provides $510.7 million over the next five year to advance scientific innovation through integrated mapping of critical minerals that power many household appliances and clean energy technologies and through a $167 million investment for the USGS Energy and Minerals Research Facility in Golden, Colorado.

Assessing the seasonal evolution of snow depth spatial variability and scaling in complex mountain terrain — USGS #snowpack

View of the Bridger Range looking south from the summit of Sacagawea Peak. By Rperry99 at the English-language Wikipedia, CC BY-SA 3.0, https://commons.wikimedia.org/w/index.php?curid=31376982

Click the link to access the article on the USGS website (Northern Rocky Mountain Science Center):

Dynamic natural processes govern snow distribution in mountainous environments throughout the world. Interactions between these different processes create spatially variable patterns of snow depth across a landscape. Variations in accumulation and redistribution occur at a variety of spatial scales, which are well established for moderate mountain terrain. However, spatial patterns of snow depth variability in steep, complex mountain terrain have not been fully explored due to insufficient spatial resolutions of snow depth measurement. Recent advances in uncrewed aerial systems (UASs) and structure from motion (SfM) photogrammetry provide an opportunity to map spatially continuous snow depths at high resolutions in these environments. Using UASs and SfM photogrammetry, we produced 11 snow depth maps at a steep couloir site in the Bridger Range of Montana, USA, during the 2019โ€“2020 winter. We quantified the spatial scales of snow depth variability in this complex mountain terrain at a variety of resolutions over 2 orders of magnitude (0.02 to 20โ€‰m) and time steps (4 to 58โ€‰d) using variogram analysis in a high-performance computing environment. We found that spatial resolutions greater than 0.5โ€‰m do not capture the complete patterns of snow depth spatial variability within complex mountain terrain and that snow depths are autocorrelated within horizontal distances of 15โ€‰m at our study site. The results of this research have the potential to reduce uncertainty currently associated with snowpack and snow water resource analysis by documenting and quantifying snow depth variability and snowpack evolution on relatively inaccessible slopes in complex terrain at high spatial and temporal resolutions.

#Arizona city cuts off a neighborhoodโ€™s #water supply amid #drought — The Washington Post #ColoradoRiver #COriver #aridification

Rio Verde Foothills. Photo credit: VRBO

Click the link to read the article on The Washington Post website (Joshua Partlow). Here’s an excerpt:

Some living here amid the cactus and creosote bushes see themselves as the first domino to fall as theย Colorado Riverย tips further into crisis. On Jan. 1, the city of Scottsdale, which gets the majority of its water from the Colorado River, cut off Rio Verde Foothills from the municipal water supply that it has relied on for decades. The result is a disorienting and frightening lack of certainty about how residents will find enough water as their tanks run down in coming weeks, with a bitter political feud impacting possible solutions.

The cityโ€™s decision โ€” and the failure to find a dependable alternative โ€” has forced water haulers like [John] Hornewer to scour distant towns for any available gallons. About a quarter of the homes in Rio Verde Foothills, a checkerboard of one-acre lots linked by dirt roads in an unincorporated part of Maricopa County, rely on water from a municipal pipe hauled by trucks. Since the cutoff, their water prices have nearly tripled. The others have wells, though many of these haveย gone dryย as the water table has fallen by hundreds of feet in some places after years of drought [ed. and over pumping]…

This grim [Colorado River] forecast prompted Scottsdale to warn Rio Verde Foothills more than a year ago that their water supply would be cut off. City officials stressed their priority was to their own residents and cast Rio Verde Foothills as a boomtown of irresponsible development, fed by noisy water trucks rumbling over city streets. โ€œThe city cannot be responsible for the water needs of a separate community especially given its unlimited and unregulated growth,โ€ the city managerโ€™s office wrote in December…Scottsdale Mayor David Ortega was unmoved when his Rio Verde Foothills neighbors cried foul.

โ€œThere is no Santa Claus,โ€ he said in aย statementย last month. โ€œThe megadrought tells us all โ€” water is not a compassion game.โ€

For the past several years, some residents have sought to form their own water district that would allow the community to buy water from elsewhere in the state and import what they need, more than 100 acre-feet of water per year. Another group prefers enlisting a Canadian private utility company, Epcor, to supply the community, as it does with neighboring areas. But political disputes have so far foiled both approaches. The water district plan โ€” which supporters say would give them long-term access to a reliable source of water โ€” was rejected in August by the Maricopa County supervisors. The supervisor for the area, Thomas Galvin, said he opposed adding a new layer of government to a community that prizes its freedom, particularly one run by neighbors with the authority to condemn property to build infrastructure. [Thomas] Galvin preferred Epcor, a utility that, if approved, would be regulated by the Arizona Corporation Commission.

Key takeaways from the omnibus spending package: Whatโ€™s in it for rivers? — @AmericanRivers

The Rappahannock River | Virginia. Photo credit: American Rivers

Click the link to read the article on the American Rivers website (Jaime Sigaran):

On December 20, 2022 appropriators released the highly anticipated fiscal year 2023 omnibus spending package which includes modest environmental and conservation funding increases.

In the remaining days of 2022, weโ€™re happy to share some important wins for rivers โ€“ including funding for critical clean water and river restoration programs, as well as new Wild and Scenic River designations. While thereโ€™s much to be thankful for, the bill still has a number of shortcomings. In this blog, we break down the funding and policy highlights. 

On December 20, appropriators released the highly anticipated fiscal year 2023 omnibus spending package which includes modest environmental and conservation funding increases. Overall, the bill would fund the government at $1.7 trillion for most of 2023 โ€“ $858 billion toward defense and $772.5 billion in domestic spending.  

The omnibus spending bill funds federal agencies such as the Environmental Protection Agency (EPA) and Department of Interior (DOI). The EPA received a $576 million increase from current levels to support the agencyโ€™s science, environmental, and enforcement work. The bill also includes $14.7 billion for DOI programs, an increase of $574 million above fiscal year 2022. 

These funding increases support river restoration and river health goals across the country.  

Key Takeaways From The Omnibus Spending Package:ย 

  • General increases to EPA, DOI, and National Oceanic and Atmospheric Administration 
  • Additional supplemental funding for National Park Service to restore 500 of the 3,000 staff positions that have been lost over the past decade 
  • $40 billion for disaster recovery and drought 
  • $600 million to address water issues in Jackson, Mississippi. 
  • $682 million for EPAโ€™s geographic program including $92 million for Chesapeake Bay Program and $368 million for the Great Lakes Restoration Initiative 
  • $1.67 billion for EPAโ€™s Clean and Drinking Water State Revolving Funds 
  • $50 million for EPAโ€™s Sewer Overflow & Stormwater Reuse Municipal Grant program 
  • $65 million for Bureau of Reclamationโ€™s WaterSMART grants 

KEY RIVER BUDGET PRIORITIES & PERFORMANCE: 

AgencyProgramFY 23 Rec. from 
American Rivers
Omnibus Spending bill 12/20/22About the Program
EPAReducing Lead in Drinking Water$100M$25MReduces the concentration of lead in drinking water.
EPASewer Overflow and Stormwater Reuse Municipal Grants Program $280M$50M Manages combined sewer overflows, sanitary sewer overflows, and stormwater flows. 
USBRDam Safety Program $200M $210.2M Ensures Reclamation dams do not present unreasonable risk
USBRKlamath Project $25M $34.8M Provides funding to improve water supplies in the Klamath River Basin. 
USBRLower CO Operations Program $45M $46.8M Implements the Drought Contingency Plan and the Lower Colorado Multi-species Conservation Program. 
USBRYakima River Basin Water Enhancement Project $30M $50.3M Enhances streamflows and fish passage for anadromous fish in the Yakima River Basin. 
CorpsUpper MS River Restoration $55M $55M Ensures the viability and vitality of Upper Mississippi River fish and wildlife. 
CorpsEngineering with Nature $12.5M $20M Aligns natural and engineering processes to deliver economic, environmental, and social benefits 
FEMAFloodplain Mgmt. & Mapping $200M $206M Improves floodplain management, develops flood hazard zone maps, and educates on the risk of floods 
FEMANational Dam Safety Program $92M $9.65M Reduces the risks to human life, property, and the environment from dam related hazards. 

Policy Wins for Wild and Scenic Rivers, Western Waterย 

In addition to the funding noted above, American Rivers is very pleased to share that key provisions supporting river restoration are advancing. We applaud the hard work championed by Senators Richard Shelby (R-AL) and Patrick Leahy (D-VT) and many others on the Hill to make this omnibus spending bill a bipartisan effort. Though we are disheartened that we didnโ€™t get to see the bipartisan, bicameral public lands and water package, we can celebrate two new Wild and Scenic River designations: the York River in Maine and Housatonic River in Connecticut. Together these bills would designate more than 70 river miles. Two Wild and Scenic River studies from Florida were also added.ย 

Upper Mississippi River, IA. Photo credit: American Rivers

Several western water bills made it into the omnibus spending bill which will improve drought resilience, boost water supply, and support wetland conservation. For example, the Colorado River Basin Conservation Act (S. 4579/H.R. 9173) would allow DOI to continue to partner with Upper and Lower Basin states alike, to keep more water in the Colorado River and its reservoirs, by incentivizing voluntary water conservation projects at the user level.  

Shortcomings in the Omnibus Spending Bill 

The omnibus spending bill falls short of meeting bold river health goals that are grounded in advancing scientific efforts, supporting enforcement, and directing growth in river communities that could have benefited from additional funding. While we noticed gains in WaterSMART, Dam Safety Program, Yakima, and Klamath Projects under Bureau of Reclamation, American Rivers noted less than optimal funding levels for the Central Valley Project Restoration Fund in California and the Columbia and Snake River Salmon Recovery Project in the Pacific Northwest.ย 

Ansel Adams The Tetons and the Snake River (1942) Grand Teton National Park, Wyoming. National Archives and Records Administration, Records of the National Park Service. (79-AAG-1). By Ansel Adams – This tag does not indicate the copyright status of the attached work. A normal copyright tag is still required. See Commons:Licensing., Public Domain, https://commons.wikimedia.org/w/index.php?curid=118192

The Army Corps of Engineers programs such as Engineering with Nature, Floodplain Management Services, Sustainable Rivers Program, and the Upper Mississippi River Restoration programs did not suffer significant cuts. Nor did NOAA programs specifically Pacific Coastal Salmon Recovery Fund. However, we acknowledge small reductions in funding to the Flood Hazard Mapping and Risk Analysis Program (RiskMAP). 

Another item American Rivers noticed is large money carve outs for โ€œCommunity Project Funding Itemsโ€ also known as earmarks. When taken out of the Clean Water and Drinking Water State Revolving Fund (SRFs) capitalization grants, it leaves the EPA programs with less than half of what these programs received in Fiscal Year 2021. The long-term viability of the SRFs is in question and American Rivers will work hard to ensure its success in future years so high-priority projects are not delayed or increase the risk to public health and the environment. 

Weโ€™re disappointed the sweeping omnibus legislation did not boost more funding to protection, restoration, and enhancement of fish and wildlife, but are hopeful that the focus in drought resilience in the Southwest, water infrastructure in Jackson, Mississippi, as well as modest increases to Corps, DOI, NOAA and EPA programs will continue to place a focus on water quality and quantity.

The snow gods are giving the #ColoradoRiver and all of us in the basin a little breathing room this water year — @LukasClimate #COriver #aridification (January 17, 2023)

Upper Basin now at >150% of the median SWE for mid-January, and almost 75% of the peak SWE–about three months ahead of the typical peak.

Being in the know about the mountain snow: Tracking the snowflakes critical to the spring runoff and water supply for 1.5 million people — @DenverWater #FraserRiver #BlueRiver #SouthPlatteRiver #ColoradoRiver #COriver

Click the link to read the article on the Denver Water website (Jay Adams):

When it comes to supplying water to 1.5 million people, the spring runoff is the most important time of the year for Denver Water. 

Thatโ€™s why having good information about the snowpack is critical. Mountain snow is Denver Waterโ€™s primary source of water for its customers.

When the snow that piles up in the mountains over the winter starts to melt, the water flows into rivers and streams that fill storage reservoirs. The spring runoff typically starts at the end of April and wraps up in late June or early July.

But the work to count the snowflakes starts long before that.ย 

โ€œWe keep track of the snowpack through measurements on the ground, from the sky and from automated sensors,โ€ said Nathan Elder, water supply manager at Denver Water. โ€œWe monitor the snow all winter because it constitutes the majority of our water supply and has major impacts on how we operate.โ€

In 2022, theย snowpack peakedย below average in the areas where Denver Water catches the snowmelt. A below-average snowpack affects the amount of water available to capture and store in the spring.

Denver Water’s collection system via the USACE EIS

“We would like to completely fill our reservoir system every runoff season,” said Elder. “In the years when we don’t hit that mark, it makes following the utility’s annual summer watering rules even more critical for the Denver metro area.”  

Watering two days a week should be enough for most landscapes for most of the summer. (Only water a third day, if needed, during periods of extreme heat or dryness.)

Following the summer watering rules will help keep reservoir levels higher, in case next winter’s snowpack is below average.ย 

The Fraser River south of Winter Park on April 29, 2022. The snowpack in the areas where Denver Water captures snowmelt peaked below average for the 2021-2022 winter season. Photo credit: Denver Water.

The snowpack data, reservoir forecasts and customer water use are some of the key factors used to determine if Denver Water might need to impose additional watering restrictions beyond the regular summer watering rules, which run from May 1 through Oct. 1.

Hereโ€™s a closer look at the primary ways Denver Waterโ€™s planning team keeps track of Coloradoโ€™s snowpack. 


Spread the word, forward this story. Did you get this from a friend? Sign up here for Denver Waterโ€™s free, weekly TAP email.


On the ground

Four times a year from January through April, Denver Water crews strap on boots and snowshoes and sometimes ride snowcats to trek into the forest to measure the snow in Grand, Park and Summit counties, the primary areas where the utility collects its water supply for customers in metro Denver.

Each journey follows a specific, predetermined route called a snow course.

Each snow course has 10 designated stops where workers jab a hollow tube into the snow to capture and weigh a sample of the snowpack.ย 

At each stop, the crew conducts a four-step process:

  • Collect a sample by dropping the pole into the snow until it hits the ground.
  • Measure the depth of snow in the tube.
  • Get the weight of the snow by weighing the snow-filled tube and subtracting the weight of the empty tube.
  • Calculate the density of the snow using the depth and weight measurements. 

Using these measurements, crews calculate the snow water equivalent, or SWE, to determine the water content. 

For example, if 10 inches of snow has a density of 10%, the snow water equivalent โ€” the amount of water left behind if those 10 inches of snow melted โ€” is 1 inch of water.ย 

Rob Krueger, facility supervisor for Denver Water, uses a specially designed hollow tube to collect a snow sample near Berthoud Pass. Photo credit: Denver Water.

Denver Water shares the data collected on each snow course with the National Resources Conservation Service, or NRCS. Denver Water is one of 15 agencies that sends people out to collect snow data at 95 locations across Colorado in partnership with the NRCS.

The information helps the agency develop water supply forecasts and monitor snowpack trends over time. 

The NRCSโ€™s forecasts are used by water provides, dam operators, farmers, ranchers, recreationists and communities to make important decisions about their water supply.

Denver Waterโ€™s Rob Krueger (left) and Adam Clark work out of the utilityโ€™s Moffat Collection System office in Winter Park. Here they are weighing a snow sample to calculate how much water it contains. Photo credit: Denver Water.

Silent sentries

Along with data collected by hand, Denver Water uses information from snow telemetry sites, or SNOTEL, sites during the winter. 

SNOTELs, basically automated backcountry weather stations, were first installed in the 1970s and are operated by the NRCS. The federal agency currently has more than 900 SNOTEL sites collecting data in remote, high-elevation mountain watersheds across the western U.S.

At each site, a bladder about the size of a queen-sized waterbed and filled with antifreeze monitors and reports the weight of the snow falling on it, providing information about the water content frozen in the snow. SNOTEL sites send data multiple times per day, although some sensors report hourly.

Denver Water uses information from 13 SNOTELs located in its 4,000 square miles of watershed.ย 

A SNOTEL site on Berthoud Pass in Grand County captures snow measurements throughout the winter. The National Resources Conservation Service manages the SNOTEL sites, which transmit information daily. There are over 900 automated SNOTEL sites across the western U.S. Photo credit: Denver Water.

From the air

Starting in 2019, Denver Water began getting data about the snowpack from the air, usingย Airborne Snow Observatoryย planes stuffed with high-tech equipment flying over the snow-covered mountains.ย 

The plane uses beams of light to measure the depth of the snow fields below and capture reflections from the frozen surface. The equipment pings the snowโ€™s surface at up to 10 locations every square meter, and powerful computers crunch reams of data.

The flights provide an assessment of the amount of water frozen in place in the snow across hundreds of square miles that is more accurate than anything Denver Water has ever had before. 

โ€œThe data we get from the Airborne Snow Observatory flights quantifies all of the snowpack in river basin below, rather than trying to build a picture of the snowpack in basin using just a few selected point measurements we get from the SNOTELs and the snow courses,โ€ said Nathan Elder, Denver Waterโ€™s manager of water supply. โ€œImagine trying to watch a high-definition TV that only has 10 of its thousands of pixels working; you just donโ€™t get the whole picture.โ€

And in the face of increasingly variable weather patterns related to climate change, having better information and more accurate forecasts of the seasonal runoff will be more important in the future, he said.

The view from an Airborne Snow Observatory plane as it flies over a mountainous region to capture data on the snowpack. Photo credit: Airborne Snow Observatories Inc.

Putting it all together 

Elderโ€™s planning team uses data from the snow-measuring methods and combines it with other data such as soil conditions and weather forecasts to determine how much water the winter snowpack will send into Denver Waterโ€™s reservoirs. 

โ€œHaving people hike into the forests to measure the snow by hand is very important for water planners because they give us the โ€˜boots-on-the-groundโ€™ information we use to verify the data we get from the machines in the SNOTELs and the Airborne Snow Observatory flights,โ€ Elder said. 

The forecasts โ€” in turn โ€” help determine how Denver Water will manage the water stored in its reservoirs to meet customer demands in the city and determine if additional water restrictions are needed. 

The water supply forecasts are also used to provide information to communities, businesses and other water managers about flooding concerns, water levels for boating on reservoirs, maximizing water rights and how to manage water supplies to benefit the environment.

โ€œManaging water is a very complex business,โ€ Elder said. โ€œThe more information and data we can get, the better decisions we can make.โ€

โ€œWe are not going to be afraid to litigateโ€ to protect #Coloradoโ€™s water rights: Attorney General Phil Weiser said era of lower basin states over-consuming #ColoradoRiver โ€œis overโ€ — The #Denver Post #COriver #aridification

Lees Ferry streamgage and cableway on the Colorado River, Arizona. The point where the upper and lower Colorado River basins divide the river. (Public domain.)

Click the link to read the article on The Denver Post website (Nick Caltrain). Here’s an excerpt:

Coloradoโ€™s attorney general is seeking toย reinforce his officeโ€™s water-focused legal team so it could be prepared for upcoming fights over the Colorado River. Attorney General Phil Weiser, who was just re-elected to a second term, said his office needs to be prepared for litigation or negotiation with other stakeholders to defend Coloradoโ€™s water rights. Heโ€™s not asking for an overhaul of the office โ€” his ask to the Joint Budget Committee is for two new positions, and water and natural resources make up an overall small percentage of his officeโ€™s total budget โ€” but he noted that โ€œthe challenges with water are heating up.โ€

โ€œThe era of the lower basin states taking as much water as they wanted โ€” up to 10 million acre-feet when theyโ€™re only entitled 7.5 โ€” is over,โ€ Weiser said recently…

Ideas on bolstering the water supply โ€” or at least not drinking too deep from it โ€” vary. Weiser said his focus is on protecting the stateโ€™s share. Lawmakers have said water will be a โ€œcenterpieceโ€ of this legislative session. House Speaker Julie McCluskie, a Democrat from Dillon, has also singled out lower basin states for overusing their allotment. Weiser noted the strain on the reservoirs and the pressure that puts on water users up and down the river. Navigating the legal rapids will require negotiation or litigation, he said.

โ€œWeโ€™ve got to be prepared for either way,โ€ Weiser told reporters after his investiture ceremony Thursday. โ€œWe are not going to be afraid to litigate and protect our rights, and as we can find collaborative solutions, weโ€™ll work hard to do that.โ€

[…]

If lawmakers approve the request this spring for more water specialists, it would bring the departmentโ€™s total staff working on interstate water issues to 11, including eight attorneys, according toย budget documents. The internal team has already won legal victories against other states and the federal government, as well as saved the state money on outside experts, according to the proposal.

Mapping changes in temperature: every year from 1850 to 2022 — @Ed_Hawkins

Changes in temperature 1850 to 2022. Credit: Ed Hawkins

Climate change from 1880-2022 — @ScottDuncanWXClimate change from 1880-2022 —

In the Amazon, Indigenous and Locally Controlled Land Stores Carbon, but the Rest of the Rainforest Emits Greenhouse Gases — Inside #Climate News #ActOnClimate

Adapted from File:South America (orthographic projection).svg by User:Luan, (CC-BY 3.0) and File:Amazon biome outline map.svg by User:Aymatth2 (CC-BY-SA 4.0). By CactiStaccingCrane – Own work, CC BY-SA 4.0, https://commons.wikimedia.org/w/index.php?curid=122066796

Click the link to read the article on the Inside Climate News website (ย Bob Berwyn and Katie Surma):

Forests managed by Indigenous peoples and other local communities in the Amazon region draw vast amounts of planet-warming carbon dioxide out of the atmosphere while the rest of the rainforest has become a net source of the greenhouse gas, a new report has found. 

The discrepancy results from differences in deforestation rates between the two types of land. 

The study from the World Resources Institute, a nonprofit global research organization focused on solving environmental challenges, adds to a growing body of evidence showing that land held by Native peoples and other local communities around the world has better environmental outcomes than government and privately owned land.

The WRI study, published on Jan. 6, marks the first time researchers have quantified the forest carbon benefits of Indigenous territories and land stewarded by local communities in the Amazon region, which spans Bolivia, Brazil, Colombia, Ecuador, French Guiana, Guyana, Peru, Suriname and Venezuela.ย 

From 2001 to 2021, forested areas in the Amazon managed by Indigenous communities removed about 340 million more metric tons of carbon from the air each year than they emitted, an amount equivalent to the annual carbon emissions of the states of California and Massachusetts combined. Land managed by other local communities had similar outcomes, researchers found.

Impact of deforestation on natural habitat of trees. By Daniele Gidsicki – https://www.flickr.com/photos/dgidsicki/1469098242, CC BY 2.0, https://commons.wikimedia.org/w/index.php?curid=76979668

All other forested land in the Amazon region was a net source of carbon over the same time period because of high rates of forest loss.

While the main contributors to planetary warming are greenhouse gases released from the burning of fossil fuels, forests can also become a source of carbon dioxide emissions. Trees store carbon dioxide within their leaves, branches, trunks and roots. When they are destroyed through fires or clear-cutting, once-sequestered carbon is released into the atmosphere. In the Amazon region, drivers of deforestation include development from industrial agriculture, cattle ranches, mining, oil extraction and other activities, both legal and illegal.

The WRI reportโ€™s findings add an exclamation point to the evidence that Indigenous peoples and local communities are a major force in preserving the Amazon rainforest amid the rapid deforestation on land held privately or by governments.

According to Peter Veit, a co-author of the report and the director of WRIโ€™s Land and Resource Rights Initiative, about 17 to 18 percent of the Amazon has been deforested in the last 50 years. Scientists estimate that once those levels get to 20 to 25 percent, the rainforest will hit an irreversible tipping point from which the region will transform into grasslands and savannah. The change would result in the release of an estimatedย 123ย billion tons of carbon into the atmosphere, kill off thousands of plant and animal species and wipe out hundreds of distinct human cultures tied to the rainforest.

โ€œWe are very close to that tipping point,โ€ Veit said. 

The WRI report comes as land not just in the Amazon region but throughout the world is under increasing pressure for food production, resource extraction and other demands linked to human population growth. 

About half of Earthโ€™s land is stewarded by Indigenous and other local communities. Many of those groups have insecure land tenure, making them vulnerable to land theft, appropriation and related violence. Each year, about 200 land defenders, including many Indigenous people, are killed, although that estimate is widely considered an undercount. 

Veit suggests that governments can support Indigenous and local communities in protecting their territories by integrating their efforts into national climate plans, giving them secure title to their land and increasing direct funding to those communities. 

โ€œWeโ€™re showing one of many reasons that forests controlled by Indigenous peoples should be valued,โ€ said David Gibbs, a researcher at Global Forest Watch and a co-author of the report. The research, he said, โ€œadds to the list of reasons that we already have to help protect those communities.โ€ย 

The Benefits of Local and Indigenous Control

In general, Indigenous peoples and local communities manage their land in a sustainable way based on customs and cultural values that are intertwined with the forest. 

โ€œFor Indigenous people and other communities, their land is a primary source of food, medicine, fuelwood and construction materials, as well as employment, income, welfare, security, culture and spirituality,โ€ the report notes. 

That interdependence with intact forests creates an incentive for communities to sustainably manage their lands, Veit says. 

If left alone, most of those communities would continue to live as they have for hundreds of years. But they are increasingly under threat from outside pressures like legal and illegal mining, logging and agriculture, he said. 

While all forest in the Amazon region both stores and emits carbon, Indigenous lands capture more carbon than they emit each year when the entirety of that flux is considered. Veit and Gibbs said their analysis identified which Indigenous territories have higher carbon emissions and found that those communities may face greater pressures from resource extraction.

In Brazil, home to the greatest portion of the Amazon rainforest, the Indigenous communities in forests with the greatest carbon emissions are located in the countryโ€™s southeast, an area known as the โ€œarc of deforestation.โ€ In Peru, Indigenous lands that were net sources of carbon were located in regions dominated by gold mining. 

Of all the ways that governments can help communities defend their forestland from incursions that could increase the carbon emissions, Veit said that providing them with secure land title is the most important. 

In Brazil, the demarcation and formal titling of Indigenous peoplesโ€™ land stopped under former President Jair Bolsonaroโ€™s administration, which held power from 2019 to 2022. Bolsonaro also defunded governmental agencies tasked with enforcing the rights of Indigenous peoples. Over the course of his presidency, deforestation rates in the country surged.

While obtaining legal title to land is important, the type of legal title communities obtain also makes a difference in their ability to defend their land from incursions by resource extraction and agricultural interests.

In most Amazonian countries, national governments reserve ownership of material that lies below the surface of the land, making it easier for them to grant companies licenses for mining and other extractive activities. 

โ€œWhen you get security of land, you donโ€™t get security like we do in the United States of all subsurface rights,โ€ Veit said. โ€œYour rights in the Amazon extend 10 inches below the surface and thatโ€™s it.โ€ 

Veit has done research comparing the legal authority granted to extractive companies through means such as mining concessions with the legal rights given to landowners like Indigenous communities. 

โ€œThey donโ€™t compare,โ€ he said. โ€œThe natural resource rights holders have tremendous power to go onto and use land.โ€ Human rights experts have advocated for communitiesโ€™ gaining greater control over their territories and a right of refusal when governments and businesses seek to engage in resource extraction on or near their land. 

โ€œMany governments around the world still view themselves as the best holders of common property rights to resources,โ€ Veit said. โ€œItโ€™s ridiculous. Thereโ€™s a real mistrust that communities can manage these important resources despite the evidence that shows that they can.โ€ 

Amazon Emissions in Flux

The WRI report is based in part on a 2021 study in the journal Nature Climate Change that offers one of the best estimates of how much carbon dioxide was emitted by forests and how much they removed from the atmosphere globally in the last 20 years. The paper concluded that, during the 2001 to 2019 study period, forests sequestered about twice as much as they emitted each yearโ€”storing about 7.6 billion metric tons per year, or 1.5 times more than the United States emits annually.

The Amazon is a big part of that global equation, but the international team of authors acknowledged in their opening paragraphs how challenging the measurements are at global and regional scales. Emissions and absorption can take place simultaneously within regions, depending on when and where the forests are disturbed and managed, they wrote. 

The carbon fluxes, as scientists call them, also have high seasonal variability, and itโ€™s not easy to distinguish between natural fluctuations and those caused by disturbances like fires and logging. All of that makes it hard to reproduce them in global climate models, although measuring them accurately is โ€œincreasingly important for climate policy,โ€ the paper noted.

The scientists found that during the study period, forests in the Brazilian Amazon were a net source of .22 gigatons of carbon dioxide emissions per year but that the forests spanning all nine countries of the greater Amazon River basin (526 million hectares) were a net carbon sink, taking up .10 gigatons of carbon dioxide. By contrast, they noted, the net sink in forests of Africaโ€™s Congo River basin (298 million hectares) was approximately six times stronger than in the Amazon basin.

The main reason is the far lower rate of human disturbance in the Congo River forests, Gibbs said. 
Dismantling the walls to wildlife posed by highways — @BigPivots

Highway 160 wildlife crossing 15 miles west of Pagosa Springs. Photo credit: Allen Best

Click the link to read the article on the Big Pivots website (Allen Best):

$5 million in projects an important step in reimagining Coloradoโ€™s highways to accommodate wildlife

Although never a big-game hunter, I have killed three deer in Colorado and likely gave a bull elk a terrific headache. Thatโ€™s not to mention my carnage among rabbits and other smaller critters.

Cars were my weapon, not guns.

Driving at dusk or into the darkened night will inevitably produce close brushes with wildlife, large and small, on many roads and highways. Even daylight has its dangers.

Colorado is now redefining that risky, ragged edge between wildlife habitat and the high-speed travel that we take for granted. State legislators delivered a message last year when appropriating $5 million for wildlife connectivity involving highways in high-priority areas.

In late December, state agencies identified seven locations where that money will be spent. They range from Interstate 25 south of Colorado Springs to Highway 13 north of Craig near where it enters Wyoming. New fencing and radar technology will be installed. Highway 550 north of Ridgway will get an underpass.

The pot wasnโ€™t deep enough to produce overpasses such as two that cross Highway 9 between Silverthorne and Kremmling or one between Pagosa Springs and Durango. But $750,000 as allocated to design work for crossings of I-25 near Raton Pass with a like amount for design of an I-70 crossing near Vail Pass.

In this and other ways, Colorado can better vie for a slice of the $350 million allocated by Congress in the 2021 Infrastructure Investment and Jobs Act for improved wildlife connectivity.

This is on top of the overpass of I-25 planned for the segment between Castle Rock and Monument to complement the four underpasses installed in the widening project of recent years.

We are pivoting in how we regard roads and wildlife habitat. We have long been driven to protect human lives and our property by reducing collisions. Our perspectives have broadened. Human safety still matters, but so do the lives of critters.

Before, says Tony Cady, a planning and environmental manager for the Colorado Department of Transportation, highway safety for people was the highest priority โ€”and conservation for wildlife a distant second. โ€œNow weโ€™re seeing much more of a wedding or marriage of those tow values, safety and conservation.โ€

A 2016 study of western Colorado identified highest-priority road segments in red. A 2022 study showed even more road segments in eastern Colorado owing at least partly to higher traffic volumes. See study here.

Biologists in the 1990s began emphasizing highways as home wreckers. Expanding road networks, they said, was creating islands of wildlife habitat. Fragmented habitat leads to reduced gene pools and, at the extreme, to the threat of extinction of species in some areas, called extirpation.

I-70 became the marquee for this. Wildlife biologists began calling it the โ€œBerlin Wall to Wildlife.โ€ The aptness of that phrase was vividly illustrated in 1999 when a transplanted lynx released just months before tried to cross I-70 near Vail Pass. It was smacked dead.

With that graphic image in mind, wildlife biologists held an international competition in 2011 involving I-70. The goal, at least partially realized, was to discover less costly materials and designs.

Coloradoโ€™s pace has quickened since a 2014 study documenting the decline of Western Slope mule deer populations. Also helpful was creation of the Colorado Wildlife and Transportation Alliance, a consortium of the stateโ€™s transportation and wildlife agencies along with federal land agencies and non-profit wildlife groups.

In 2019 an incoming Gov. Polis issued an executive order to state agencies directing them to work together to solve road ecology problems.

Two wildlife overpasses along with underpasses and fencing north of Silverthorne completed in 2017 have been valuable examples. Studies showed a 90% reduction in collisions.

โ€œAn 80% to 90% reduction right off the bat is pretty typical for these structures,โ€ says Cady

Beginning in 2016 for the western half of the state, data have been crunched to delineate the stateโ€™s 5% highest priority road segments. These data may give Colorado a leg up on access to federal funds.

The two studies found 48 high-priority segments in western Colorado and 90 in eastern Colorado, reports Michelle Cowardin, a wildlife biologist for Colorado Parks and Wildlife. The Craig and Meeker areas have lots of high priority roads, but so is much of I-76 between Fort Morgan to Julesburg.

Eastern Colorado had even more high-priority road segments than the Western Colorado. See more here.

Some jurisdictions are diving deeper. Eagle County has completed a study of wildlife connectivity, and Pitkin County has secured funding for a first-step study that will identify highest-priority locations in the Roaring Fork and Crystal River valleys.

These new studies attest to a shift in public attitudes and a shift within the state agencies. Cady says that highway engineers still think about human safety first, but there has also been a shift.

โ€œI think the mindset has shifted in the last four or five years. We are not having to justify the inclusion of wildlife components in projects. Itโ€™s more understood that these are necessary components.โ€

To be clear, remediation in Colorado is mostly done as part of road projects. The work on Highway 160 between Pagosa and Durango, for example, came in at $11 million, of which only $3.5 million went to the overpass and also an underpass as well as other measures with wildlife in mind.

Projects also tend to have multiple funding sources. For example, the Southern Ute Tribe provided $1.5 million for that project near Pagosa. The project on Highway 9 in Middle Park included $4 million from a local rancher.

Rob Ament of Montana State Universityโ€™s Western Transportation Institute says wildlife connectivity is becoming institutionalized in how we think about transportation corridors. Instead of motivated solely to minimize risk to humans, thereโ€™s growing appreciation of the needs of wildlife, too.

Thereโ€™s solely motivation an extravagance, he says, crossings are becoming a cost of doing business.

This is happening internationally, too. โ€œMy world is just exploding,โ€ he said while reciting crossings for elephants in Bangladesh, tigers in Thailand and work for other species in Argentina, Nepal, and Mongolia.

Coyote Gulch’s Leaf August 2017 about to be towed to Denver after collision with a deer.

Aspinall Unit Operations Meeting January 19, 2023 #GunnisonRiver #ColoradoRiver #COriver #aridification

Blue Mesa Reservoir is the largest storage facility in Colorado in the Upper Colorado River system. Prolonged drought and downriver demand is shrinking the reservoir. Credit: Tom Wood, Water Desk

From email from Reclamation (Erik Knight):

The next Aspinall Operations meeting is scheduled for this Thursday, January 19th, start time 1:00pm

The meeting will be open to in-person attendance at the Western Colorado Area Office in Grand Junction.

445 West Gunnison Ave

Grand Junction, CO

The meeting will also be available to attend virtually via Microsoft Teams.  Please click on this link to attend the meeting virtually.

This link should open in any smartphone, tablet, or computer browser, and does not require a Microsoft account.

The meeting agenda with handouts will be emailed out prior to the meeting.

For any questions please email or call at the number below.

Erik Knight

970-248-0629

WCAO-GJ

Update of the forecasted Powell inflows chart. Past 2+ weeks has been very good for the Upper Basin. Jan 1st: @nwscbrfc forecast called for 105% of average inflows. Jan 17th forecast: 125% of average — @LukasClimate #ColoradoRiver #COriver #aridification

Long way to go, but really low Colorado River flows are off the table.

Variable streamflow response to forest disturbance in the western United States — USFS

Disturbances that do not remove the entire canopy, such as this beetle-caused tree mortality, tend to result in decreased rather than increased water yield.

Click the link to read the article on the USFS website (Sara A. Goeking and David Tarboton):

Forest disturbance is expected to lead to increased streamflow โ€“ but in very dry watersheds, the opposite is often true.

Forest disturbance is typically expected to lead to increased runoff – and therefore more water available for aquatic ecosystems and people – because loss of forest vegetation results in less water being taken up and transpired by plants. However, recent studies in the western U.S. have found no change or even decreased streamflow following forest disturbance due to drought and insect epidemics.

We investigated streamflow response to forest cover change using hydrologic, climatic, and forest data for 159 watersheds in the western U.S. during 2000โ€“2019. Forest change and disturbance were quantified in terms of net tree growth (total growth volume minus mortality volume) and mean annual mortality rates, respectively, from the U.S. Forest Service’s Forest Inventory and Analysis database. Annual streamflow was analyzed using multiple methods to understand the contributions of precipitation, temperature, aridity, and tree mortality.

Many watersheds exhibited decreased annual streamflow even as forest cover decreased. This decreased streamflow was not attributable to precipitation and temperature changes in many disturbed watersheds, yet streamflow change was not consistently related to disturbance, suggesting drivers other than disturbance, precipitation, and temperature.

Multiple regression analysis indicated that although change in streamflow is significantly related to tree mortality, the direction of this effect depends on aridity. Specifically, forest disturbances in wet, energy-limited watersheds (i.e., where annual precipitation exceeds potential evapotranspiration [PET]) tended to increase streamflow, while post-disturbance streamflow more frequently decreased in dry, water-limited watersheds (where the PET to precipitation ratio exceeds 2.35).

Effect of tree mortality and aridity on change in annual streamflow (ฮ”Q) for 2000โ€“2009 vs. 2010โ€“2019, based on 159 watersheds. PET=potential evapotranspiration; P=precipitation.

Key Findings

  • While streamflow often increased following forest disturbance, it decreased in some watersheds.
  • The direction of streamflow response to forest disturbance (increase vs. decrease) is dependent on aridity.
  • Tree mortality during 2000-2019 was highest in arid watersheds โ€“ the same watersheds where disturbance tends to result in decreased streamflow.
  • Forest disturbances in wet, energy-limited watersheds tended to increase streamflow, while post-disturbance streamflow more frequently decreased in dry, water-limited watersheds.

Other Resources

Disturbance effects on water yield in western coniferous forests

Using Forest Inventory & Analysis data for broad-scale assessments of vegetation effects on water resources

Featured Publications

Variable streamflow response to forest disturbance in the western US: A large-sample hydrology approach

Goeking, Sara A. ; Tarboton, David G. , 2022

Leery of open forum, #water group struggles to inform public: #Wyomingโ€™s #ColoradoRiver Working Group serves as a conduit between water users and state engineerโ€™s office — WyoFile #GreenRiver #COriver #aridification

Members of the public packed the Sublette County Public Library in Pinedale Sept. 27, 2022 for a water meeting organized by the Wyoming State Engineer’s Office. (Dustin Bleizeffer/WyoFile)

Members of a working group created by Gov. Mark Gordon to โ€œdisseminate informationโ€ and โ€œact as a sounding board for the public and stakeholdersโ€ regarding Colorado River Compact issues reported Monday mounting public frustration about access to information. 

The Colorado River Working Group, formed in 2021, essentially acts as a consulting body and communications conduit between water users in the Green River and Little Snake River basins and the State Engineerโ€™s Office. 

At a meeting of the group on Monday members said constituents are confused. Members also reported fielding complaints from stakeholders who canโ€™t get the information they need to stay abreast of the fast-moving and complex topic that stands to impact water users in the state.

At the same meeting, State Engineer Brandon Gebhart insisted the body isnโ€™t subject to the stateโ€™s open meetings laws and said heโ€™s hesitant to take questions from the public during working group meetings. Though Mondayโ€™s meeting was open to the public โ€” as were six previous meetings โ€” none have been live-streamed or otherwise made available to anyone not in attendance, according to the engineerโ€™s office.

Thatโ€™s by design, according to Gebhart. 

โ€œIโ€™m a little concerned that if we start one of these [live-streamed presentations] that we wouldnโ€™t get through any of the topics before the questions start coming in,โ€ Gebhart told working group members. In a follow-up with WyoFile Tuesday, Gebhart added, โ€œMy general concern about doing public webinars is being unable to get through the numerous and complex topics we need to cover if we get slowed down by multiple public questions.โ€

Chris Brown of the Wyoming Attorney Generalโ€™s Office discusses the implications of the Colorado River Compact with water users in Pinedale Sept. 27, 2022. (Dustin Bleizeffer/WyoFile)

The working groupโ€™s meetings are intended to hash out information and discuss how to disseminate it with water users, Gebhart said. The groupโ€™s outreach is primarily done directly between the groupโ€™s members and their constituents.

Though there was no formal call for public comments or questions at the Monday meeting, members of the working group, SEO and the attorney generalโ€™s office did field some questions from members of the public in attendance.

Under pressure

The main topic of discussion Monday was how the SEO is scrambling to entice eligible water users to take part in a conservation program that pays them to voluntarily leave water in streams that flow to the Colorado River. 

Explaining the program and eligibility requirements to myriad water users is complicated, particularly as many in the ag community are leery of government-sponsored programs aimed at reducing water use, according to the SEO. A tight timeframe makes the effort more challenging. The Upper Colorado River Commissionannounced a call for System Conservation Pilot Program proposals Dec. 14 with a filing deadline of Feb. 1.

The SEO, which is overseeing the program in Wyoming, is eager to enroll as many participants as possible, according to the agency. The state and its upper basin partners need to demonstrate progress in cultivating various voluntary water conservation efforts to build a case against the potential for mandated cuts under the Colorado River Compact or federal intervention. The agency is relying on members of the working group to help field questions and explain the potential benefits of the program. But so far, confusion reigns, members indicated.

Rep. Albert Sommers irrigates his ranch near Pinedale from where he trails cattle to Union Pass, seen on the horizon (Angus M. Thuermer Jr./WyoFile)

โ€œConservation districts โ€” they really donโ€™t know enough about whatโ€™s going on and they canโ€™t ask enough questions,โ€ Rep. Albert Sommers (R-Pinedale), a member of the working group, told fellow members. โ€œThere just needs to be more formal outreach in the country.โ€

Industrial water users in southwest Wyoming โ€” trona mines, natural gas processors and electrical power utilities โ€” โ€œare yearning for information,โ€ working group member Aaron Reichel of Genesis-Alkali said.

Sen. Larry Hicks (R-Baggs), also a member of the working group, said โ€œthereโ€™s a lot of concerns with this System Conservation Pilot Project.โ€ Concerns include โ€œthe timeframe to get [information], who to contact, whoโ€™s going to answer these questions to put together an application, whatโ€™s eligible โ€” all those questions. Iโ€™m just getting inundated with this stuff because of the timeframe of this.โ€

Working group structure

Gordon, anticipating the need to protect the interests of Wyoming water users from the impacts of the Colorado River crisis, formed the Colorado River Working Group in 2021 and appointed eight members. The group includes two representatives for municipal water users, one for agriculture, one for environmental interests, two for industrial water users and two legislators โ€” Sen. Hicks and Rep. Sommers.

Gordon โ€œtasked members with helping to more broadly disseminate information about key Colorado/Green/Little Snake River Basin issues to interested stakeholders, and for members to provide insights as Wyoming navigates important river issues,โ€ Gebhart told WyoFile via email, adding that the SEO relies on the working group to enhance its own public outreach efforts.

In forming the group, Gordon agreed to the SEOโ€™s suggestion that it not be subject to the stateโ€™s open meeting laws, according to Gebhart, though the group has decided to mostly adhere to open meetings standards so far. 

Gordonโ€™s office didnโ€™t directly answer what justifies the working groupโ€™s exemption from the stateโ€™s open meetings laws. As a gubernatorial appointed group convened by a state agency to address issues with a critical public resource the body would appear at a glance to be obligated to operate transparently โ€” but such quasi-governmental groups can and do exist, according to Bruce Moats, a Wyoming attorney who specializes in First Amendment and Wyoming media law.

โ€œThe group appears to exist in a kind of a gray area,โ€ Moats said. โ€œThe question is, why is it necessary to have the option to close meetings [to the public] when you have exemptions under the public meetings law that allow for that. Just why?โ€ 
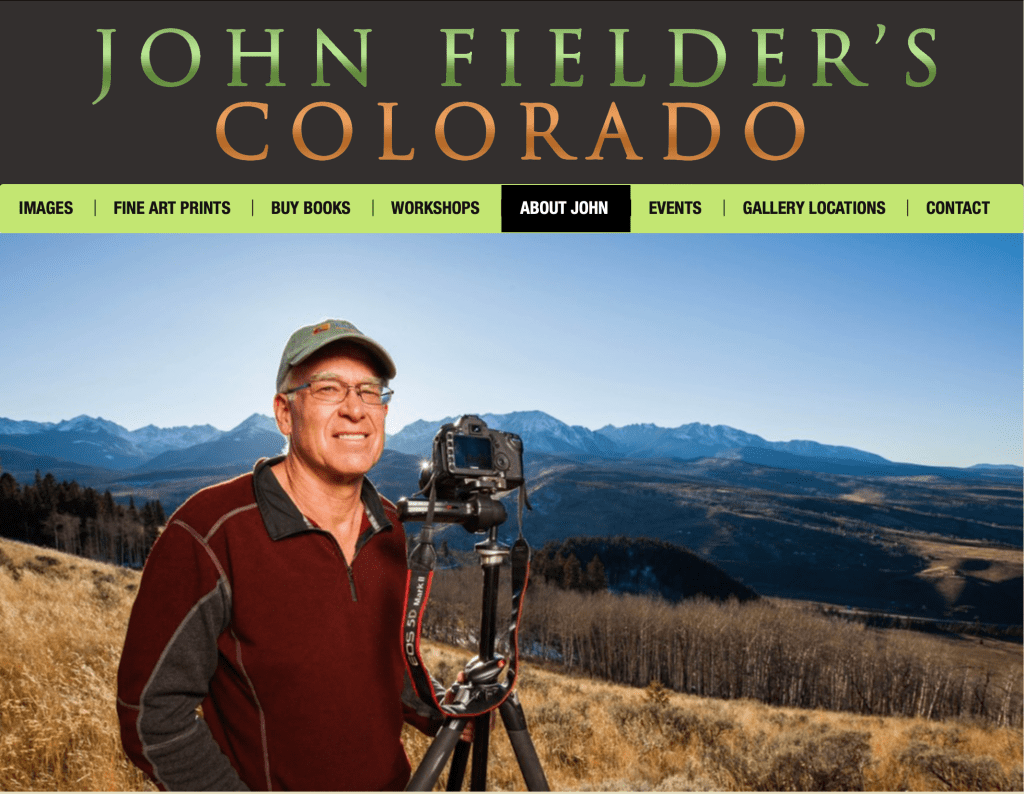
At the urging of group members Monday, Gebhart agreed to consider hosting a webinar that provides members of the public the chance to ask questions about Colorado River issues and the SEOโ€™s efforts to enroll water users in the SCPP.

โ€œWe are not trying to limit information getting to the public,โ€ Gebhart told WyoFile. โ€œUltimately, our goal is to get more, and accurate, information to those potentially affected by the current situation.โ€

Wyoming rivers map via Geology.com

Aridification/Saturation Watch — @Land_Desk #snowpack (January 17, 2023)

West snowpack basin-filled map January 17, 2023 via the NRCS.

We just did the snowpack data aย couple weeks ago, so Iโ€™m not going to do it again. But holy relentless train of atmospheric rivers is there ever a lot of moisture falling from the sky. Look at these rainfall totals! Still, itโ€™s interesting that of those nine precipitation totals, only three set new 16-day records. Yes, this is some wacky weather, but itโ€™s not unprecedented, yet.

Judging from snowpack levels across the West, it would appear that each successive range of mountains wrings a little less moisture out of the clouds than the previous one. So California is getting buried, Utah is having one powder day after another, and Colorado is looking pretty darned good.

Pretty good in northern Colorado, too, but surprisingly not way ahead of last year at this time. This is for Rabbit Ears Pass:

And all of this new snow on top of that stuff that fell back in October and November and then rotted =ย avalanche danger. So be careful out there.

One change could save Oak Creek โ€˜millionsโ€™ at Sheriff Reservoir; Earthquake potential reveals new risk — Steamboat Pilot & Today

Photo credit: Medicine Bow National Forest

Click the link to read the article on the Steamboat Pilot & Today website (Dylan Anderson):

Oak Creek could save โ€œmillionsโ€ off the projected $14 million price tag for fixes at Sheriff Reservoir after updated engineering on the project showed the townโ€™s water source needs a much smaller spillway than originally thought. While the town previously believed the new spillway needed to be 300 feet wide, the updated work shows it only needs to be about 60 feet wide, according Steve Jamieson, an engineer with W. W. Wheeler that has been consulting for the town on the project. That is still twice the size of the existing spillway…

The recent work resulted from a Comprehensive Dam Safety Evaluation, which looked at ways the dam could fail during normal loading, flood loading and earthquake loading. The highest risk found was due to a gate failure, something that Jamieson said isnโ€™t surprising as the town works to replace the original head gate on the nearly 70-year-old dam. Oak Creek has gone through a bid process for this work twice, butย each effort failedย to find a contractor the town could afford. A gate failure wouldnโ€™t lead to loss of life, the analysis showed, but it would compromise the townโ€™s water source, making the impact significant. The new risk identified is called a โ€œliquefaction failure,โ€ and it is related of the areaโ€™s seismic activity. While noticeable earthquakes are not common in Routt County, they are not unheard of. Since 2000, Routt County has seen approximately two-dozen earthquakes, with the largest being a 3.5 magnitude event about 10 miles northwest of Oak Creek in 2011, according to theย U.S. Geological Survey.

The latest #Drought Monitor update shows improvement across most of the area compared to a year ago. However, more precipitation is needed to erase multiple years of drought conditions across the #ColoradoRiver basin. #utwx #cowx #azwx — Colorado Basin RFC

State legislators look to create a commission for #Wyoming’s stake in the #ColoradoRiver — Wyoming Public Radio #COriver #aridification

Green River Basin

Click the link to read the news brief on the Wyoming Public Radio website (Will Walkey). Here’s an excerpt:

The Wyoming State Legislature begins its lawmaking session this week. One bill, called the โ€œColorado River Authority of Wyoming Act,โ€ would create a board and commissioner to manage Wyomingโ€™s water in the Colorado River Basin. The systemย drains about 17 percentย of the Cowboy Stateโ€™s land area and is critical for agriculture, energy development and residential use in cities. The entire Colorado River Basinย is currently under stressย due to drought conditions and human development in the Southwest. The bill, sponsored by Rep. Albert Sommers (R-Pinedale) and Sen. Larry Hicks (R-Baggs) is similar to those previously passed inย severalย other statesย that depend on the Colorado River.

โ€œWe feel it’s very important to have those people that are actually going to be affected that live in the Colorado River Basin [to] have an opportunity to participate in these policy-level decisions thatโ€™s going to affect your everyday life,โ€ Hicks said.

The commission would include nine members, including five representatives from the Green River Basin appointed by commissioners in Sublette, Sweetwater, Lincoln and Uinta counties. Plus, one appointee from the Little Snake River Basin recommended by commissioners in Carbon County, as well as the state engineer, the governor or a designee and an at-large member. The authority would meet once a year and would include an official commissioner appointed by the governor who could represent Wyoming in negotiations with other states in theย Colorado River Compact, a seven-state agreement that allocates river resources. However, any changes to water rights would still need to be approved by the state legislature, governor and relevant federal authorities.

#Water leaders to lawmakers: No โ€˜silver bulletโ€™ in #Arizonaโ€™s water crisis — The Arizona Mirror

The 1980 Arizona Groundwater Code recognized the need to aggressively manage the stateโ€™s finite groundwater resources to support the growing economy. Areas with heavy reliance on mined groundwater were identified and designated as Active Management Areas (AMAs). The five AMAs (Prescott, Phoenix, Pinal, Tucson, and Santa Cruz) are subject to regulation pursuant to the Groundwater Code. Each AMA carries out its programs in a manner consistent with these goals while considering and incorporating the unique character of each AMA and its water users. Credit: ADWR

Click the link to read the article on The Arizona Mirror website (Jerod MacDonald-Evoy):

The day after Gov. Katie Hobbs delivered her first State of the State, outlining plans to address the stateโ€™s growing water crisis, the heads of the stateโ€™s water agencies stood before lawmakers to deliver an at times grim reality of the stateโ€™s water future. 

โ€œI do not believe that any of the (Active Management Areas) are at a safe-yield,โ€ Tom Buschatzke, director of the Arizona Department of Water Resources, told the House Natural Resources, Energy and Water Committee on Jan. 10. 

Active Management Areas, generally referred to as AMAs, were created in 1980 in an effort to help the state manage its groundwater resources as the state continued to grow. Only the AMA in Tucson is near a safe-yield, meaning the amount of water withdrawn is balanced with the amount recharging it, but Buschatzke said that Tucson has reached that by storing large amounts of Colorado River water delivered by Central Arizona Project. 

Approximatelyย 82% of Arizonaโ€™s populationย resides within the stateโ€™s five AMAs.ย 

But Buschatzke did not see it as a failure, and instead focused on telling the committee that solutions will need to be explored and that, in the future, more and more groundwater will begin to be pumped by municipalities across the state. 

โ€œIt is not a failure in my mind in any way shape or form,โ€ Buschatzke said, adding that the state needs to find more renewable water supplies, look to find ways to move water from one state to another or even from other sources outside the state. 

โ€œThere is no silver bullet,โ€ Buschatzke said. โ€œBut I think we have to embrace the success we have.โ€ 
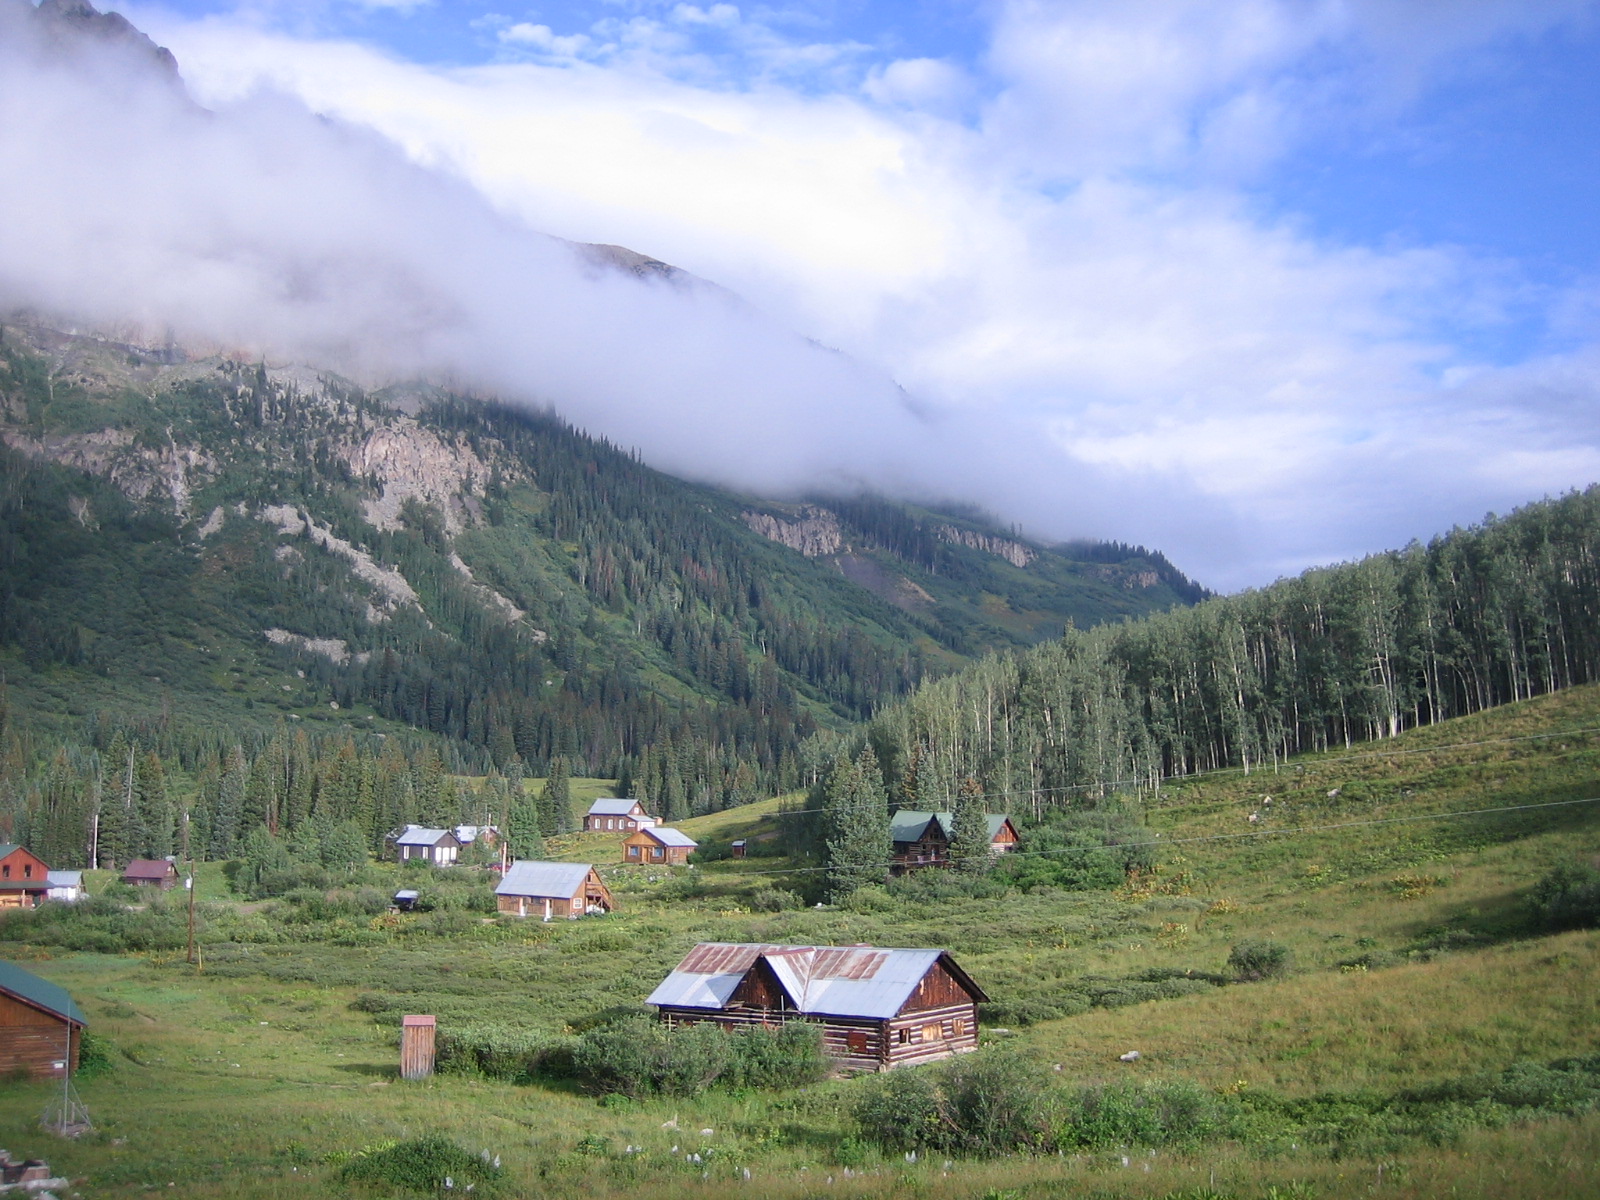
The hearing also comes after Hobbs released an ADWR report showing areas in the West Valley cannot support planned development. Hobbs has accused former Gov. Doug Ducey of directing the agency to keep the report secret. 

Lawmakers didnโ€™t directly reference or ask about the report, but questions about development and its impact on water became a hot-button issue during the hearing. 

Rep. Barbara Parker, R-Mesa, asked Buschatzke if he would be willing to help the legislature โ€œeducateโ€ the public that agriculture uses more water than development. ADWR estimates from 2019 provided to the committee showed that agriculture made up for approximately 72% of water use, municipal 22% and industrial around 6%. 

โ€œThey always want to be down on a builder,โ€ Parker said, additionally asking Buschatzke if he thought Hobbsโ€™ speech unfairly targeted homebuilders. 

Buschatzke said that mandatory conservation requirements on farmers in AMAs have been efficient and have given them an advantage over California farmers. Both stateโ€™s farmers have been hit dramatically by the drought and recent cuts in Colorado River water. Arizona is facing a 21% cut in Colorado River allocation this year because of the drought and an alarming decrease of water in Lake Powell.

โ€œWe have done great things in this state โ€” and there is more we can do and there is more we will have to do,โ€ he said, adding that Hobbsโ€™ new Water Policy Council will hopefully address some of these issues. 

Rep. Stacey Travers, D-Phoenix, asked Buschatzke if the state should close a loophole that allows developers to get around a state law that says that every new home must have a 100-year supply of water by declaring the homes are being built as rental properties. Buschatzke deflected, and said such a policy change would be up to the governor. 

โ€œPerhaps that is an issue to be further discussed by Governor Hobbsโ€™ water council,โ€ he said. 
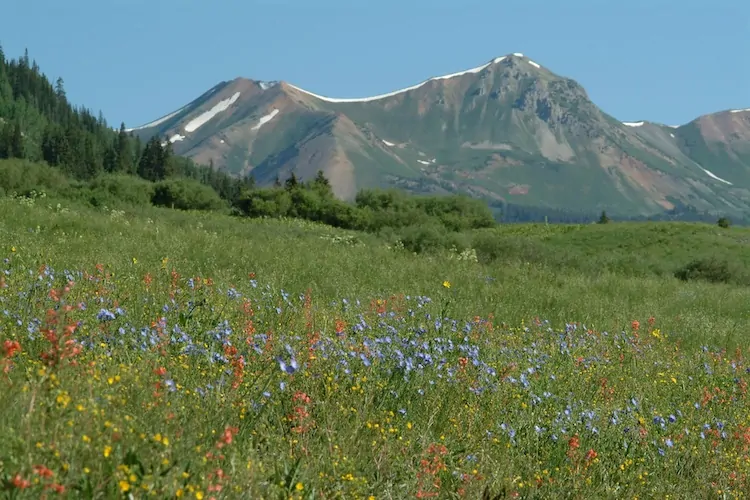
Lawmakers also heard from Central Arizona Projectโ€™s newly appointed general manager, Brenda Burman, who spoke to lawmakers on her third full day on the job. 

CAP oversees the 336-mile aqueduct that runs from Lake Havasu to Tucson, delivering Colorado River water to Maricopa and Pima counties. 

Burman reiterated what Buschatzke said, telling lawmakers that new solutions are needed to get water to more people and in a renewable way. She also mentioned the impacts of climate change on the stateโ€™s water supply, pointing out that water that in the past would have made its way into the Colorado River is now being absorbed into drier soil due to the prolonged drought. 

Both Buschatzke and Burman were asked by Rep. Oscar De Los Santos, D-Laveen, if they believed that climate change had impacted Arizonaโ€™s water supply and if they believed human activity had created climate change. Both agreed that climate change was impacting our water, but neither answered if they believed that human beings were the cause. 

Studies have definitively shown that climate change is occurring and human beings are contributing to it. 

โ€œIโ€™m no climatologist and Iโ€™m no expert in this,โ€ Parker said shortly after De Los Santos had asked Burman about climate change. โ€œI want to channel my inner Hohokam Indian. Iโ€™m an Arizona native, and I wish we could have that crystal ball and predict that everything was, you know, climate change. I donโ€™t know if the Hohokam didnโ€™t have fossil fuel problems in the past, but they went through a serious drought in the past, as we know, and they disappeared as an agricultural community.โ€

Parker then asked what CAP was doing to prepare for another โ€œcurveballโ€ from โ€œMother Nature.โ€ 

Burman explained that CAP has been storing water from times when the state experiences excessive rains, and noted that the Hohokam lived during a time of very dry years followed by very wet years. The state is currently in its 27th consecutive year of drought.

The hearing marked the beginning of what will likely be a long session for one of the two committees that will hear a slew of bills related to a key part of Hobbsโ€™ agenda in the coming months. Lawmakers were amicable to the Hobbs appointees, stating they looked forward to working with them in the future. 

โ€œWe need to work together, and I think we have come a long way,โ€ Republican Chairwoman Gail Griffin said at the end of the hearing.

Snow #Drought Current Conditions and Impacts in the West — NIDIS #snowpack (January 16, 2023)

Click the link to read the update on the NIDIS website:

Key Points:

  • A continuous barrage of atmospheric rivers have made landfall in central and northern California, spreading copious amounts of mountain snowfall in the Sierra Nevada, Great Basin, and parts of the Upper Colorado River Basin.
  • Snow water equivalent (SWE) is currently at 200% to over 300% of normal for much of this region, with record high SWE for this time of year at a number of SNOTEL sites in the Sierra Nevada.
  • There are still small areas of snow drought in isolated regions, including the Sangre De Cristo Mountains, straddling the New Mexico-Colorado border. 
  • The northern Rockies is another region to keep an eye on, with many locations at near-to-slightly below normal SWE in northern Idaho, western Montana, and northern Wyoming.ย 

The big story at the moment is the abundance of snow, not the lack of snow, across a large swath of the West. An almost continuous barrage of atmospheric rivers, beginning in the last few days of December, have made landfall in central and northern California, spreading copious amounts of precipitation (including mountain snowfall) in the Sierra Nevada, Great Basin, and parts of the Upper Colorado River Basin. These storms have been largely beneficial for drought improvements, but excessive rainfall has caused major flooding in parts of California. Snow water equivalent (SWE) is currently at 200% to over 300% of normal for much of this region, with record high SWE for this time of year at a number of SNOTEL sites in the Sierra Nevada. Even more encouraging is that many locations, especially at higher elevations, have already exceeded water year peak SWE values that typically occur from mid-March to mid-April. One example is Mammoth Pass, California, in the eastern Sierra Nevada, which currently has 37.4 inches of SWE, 314% of median for the date, and 104% of median water year peak.ย 

All that said, there is still a small spatial extent of snow drought in isolated regions. The Sangre De Cristo Mountains, straddling the New Mexicoโ€“Colorado border, is one of those regions. SWE at most SNOTEL sites in the Sangre De Cristo Mountains is in the range of about 40%โ€“70% of normal. This area has been in the southeast of the storm track with minor impacts but not nearly the amounts of snow that have fallen further north and west. The snowpack in southeastern Arizona and southwestern New Mexico in the Gila Mountains has improved substantially since mid-December. The northern Rockies is another region to keep an eye on, with many locations at slightly below normal SWE (75%โ€“90%) and a number of locations in northern Idaho, western Montana, and northern Wyoming in the 15thโ€“30th percentile.

In Alaska, where observations are limited, most SNOTEL sites indicate that SWE is near normal to above normal, with very limited snow drought. An interesting pattern that set up in early December brought heavy snowfall to the Anchorage area but much less snow a short distance to the southeast around Turnagain Pass. SWE at the Anchorage Hillside SNOTEL site is currently 157% of normal SWE, whereas SWE at Mt. Aleyska, less than 50 miles away, is at just 71% of normal SWE. Snowpack is also below normal along the south side of the Alaska Range with very little snowfall since mid-December.

Stations with SWE Below the 30th Percentile

Snow water equivalent (SWE) percentiles for locations in the western U.S. at or below the 30th percentile as of January 9, 2023. Stations above the 30th percentile* are shown with a black โ€œxโ€. Only SNOTEL and other Cooperative Snow Sensor stations with at least 20 years of data were used. Stations where the median SWE value for the date is zero are not shown. Data Source: USDA Natural Resources Conservation Service.

Snow Water Equivalent Percent of Water Year Peak

Snow Telemetry (SNOTEL) snow water equivalent (SWE) values as a percentage of the USDA Natural Resources Conservation Service (NRCS) 1991โ€“2020 median water year peak. Only stations with at least 20 years of data are included in the station averages. This map is valid as of January 9, 2023. For an interactive version of this map, please visit NRCS.

Daily SWE at Mammoth Pass, California

Daily snow water equivalent (SWE values) at the Mammoth Pass, California Cooperative site. Values for the 2023 water year through January 9, 2023 are shown in blue, and the NRCS 1991โ€“2020 median is shown in red. The January 9 value has already exceeded the water year peak median that occurs around April 1. Data are from the NRCS.
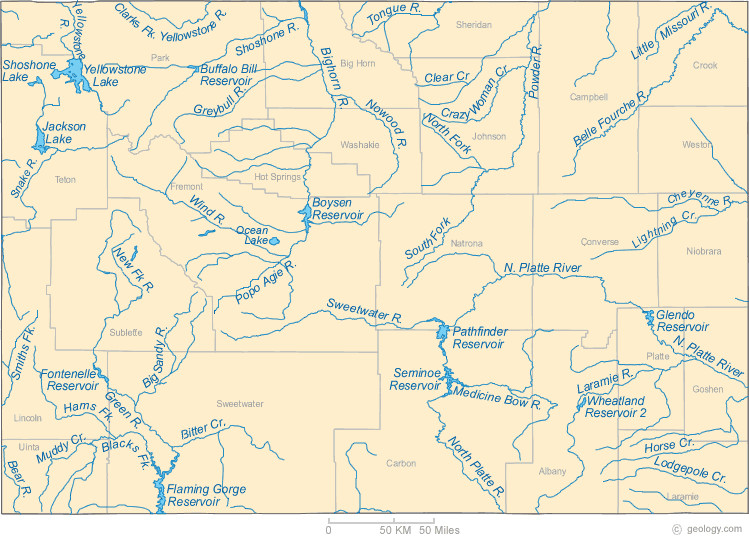
* Quantifying snow drought values is an ongoing research effort. Here we have used the 30th percentile as a starting point based on partner expertise and research. Get more information on the current definition of snow drought here. 

For More Information, Please Contact:

Daniel McEvoy
Western Regional Climate Center
Daniel.McEvoy@dri.edu

Amanda Sheffield
NOAA/NIDIS California-Nevada Regional Drought Information Coordinator
Amanda.Sheffield@noaa.gov

Britt Parker
NOAA/NIDIS Pacific Northwest Regional Drought Information Coordinator
Britt.Parker@noaa.gov