Click the link to read the article on the Sibley’s Rivers website (George Sibley):
August 29, 2024
An Apology: Our service that sends these posts hs malfunctioned; this one sat in limbo for the past two weeks. I hope we have things back to where we can again get it to you every 3-4 weeks. – George
In the last post here, with the Colorado River’s Upper and Lower Basins in stalemate over how to distribute the suffering after the 2026 expiration of the Interim Guidelines, I suggested we use the time to do what we’ve all been saying we need to do, but find it hard to do: ‘think outside the box.’ The ‘box’ in this case being the Colorado River Compact. We can go back to Monday-morning-quarterbacking the rivermeisters as they try to figure out how to drag the Compact, its misbegotten two-basin division and its Marley’s-chain Law of the River into the 21st century. But for the moment – let’s just indulge in imagining river scenarios that might actually reflect Colorado River realities in the 21st century.
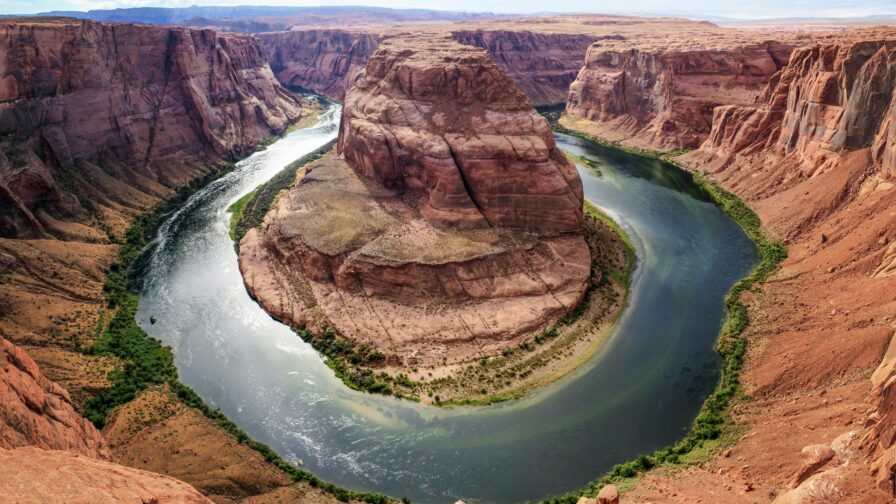
In the last post (click if you need a review) I sketched out the nature of the ‘desert river,’ which is what the Colorado River is. Rivers flowing through deserts only exist at all because of mountains or other highlands that force air moving through (as in ‘prevailing westerlies’) to rise, cool, and condense whatever water vapor it is carrying into precipitation, rain or snow, that falls on the mountains and eventually flows downhill because that’s what liquid water does, eventually coalescing into a river. In this case, it flows out into deserts which by definition are arid regions with a paucity of precipitation and a powerful propensity for turning liquid water back into vapor. Once the desert river is in its desert, it begins to disappear because it gets so little recharge from precipitation beyond its mountain origins, and gives up its water to riparian life, to evaporation, to groundwater. We can say with some accuracy that it is the nature of a desert river to gradually disappear into its deserts – as liquid water, anyway.
The Colorado River is a true desert river; the mountains and highland plateaus surrounding the natural basin produce 85-90 percent of the river’s total water supply, according to the Western Water Assessment study of the ‘state of the river science.’ Now it almost entirely disappears in the deserts of the Southwest – the high ‘cold deserts’ of the Colorado Plateau and Southern Rockies piedmont, and the subtropical Sonora and Mojave Deserts below the plateau canyons. This is mostly due to human uses now; we remember with nostalgia that the Colorado River flowed naturally into the Gulf of California, but that was mostly during its snowmelt flood season; by late fall and through the winter there were probably many years when it did not make it through the delta jungle to the Gulf at all.
The Compact experience should make us all leery of dividing a river into basins. But the way a desert river works suggests a natural division into two parts – as opposed to a two-basin political division, using state boundaries that have no relevance to down-on-the-ground geography. The natural division is a water-production region, in the highlands where the majority of the precipitation falls and the river forms its tributaries; and a water-consumption region, in the deserts where that produced water gradually disappears – especially now that humans are spreading it much farther than nature ever intended.

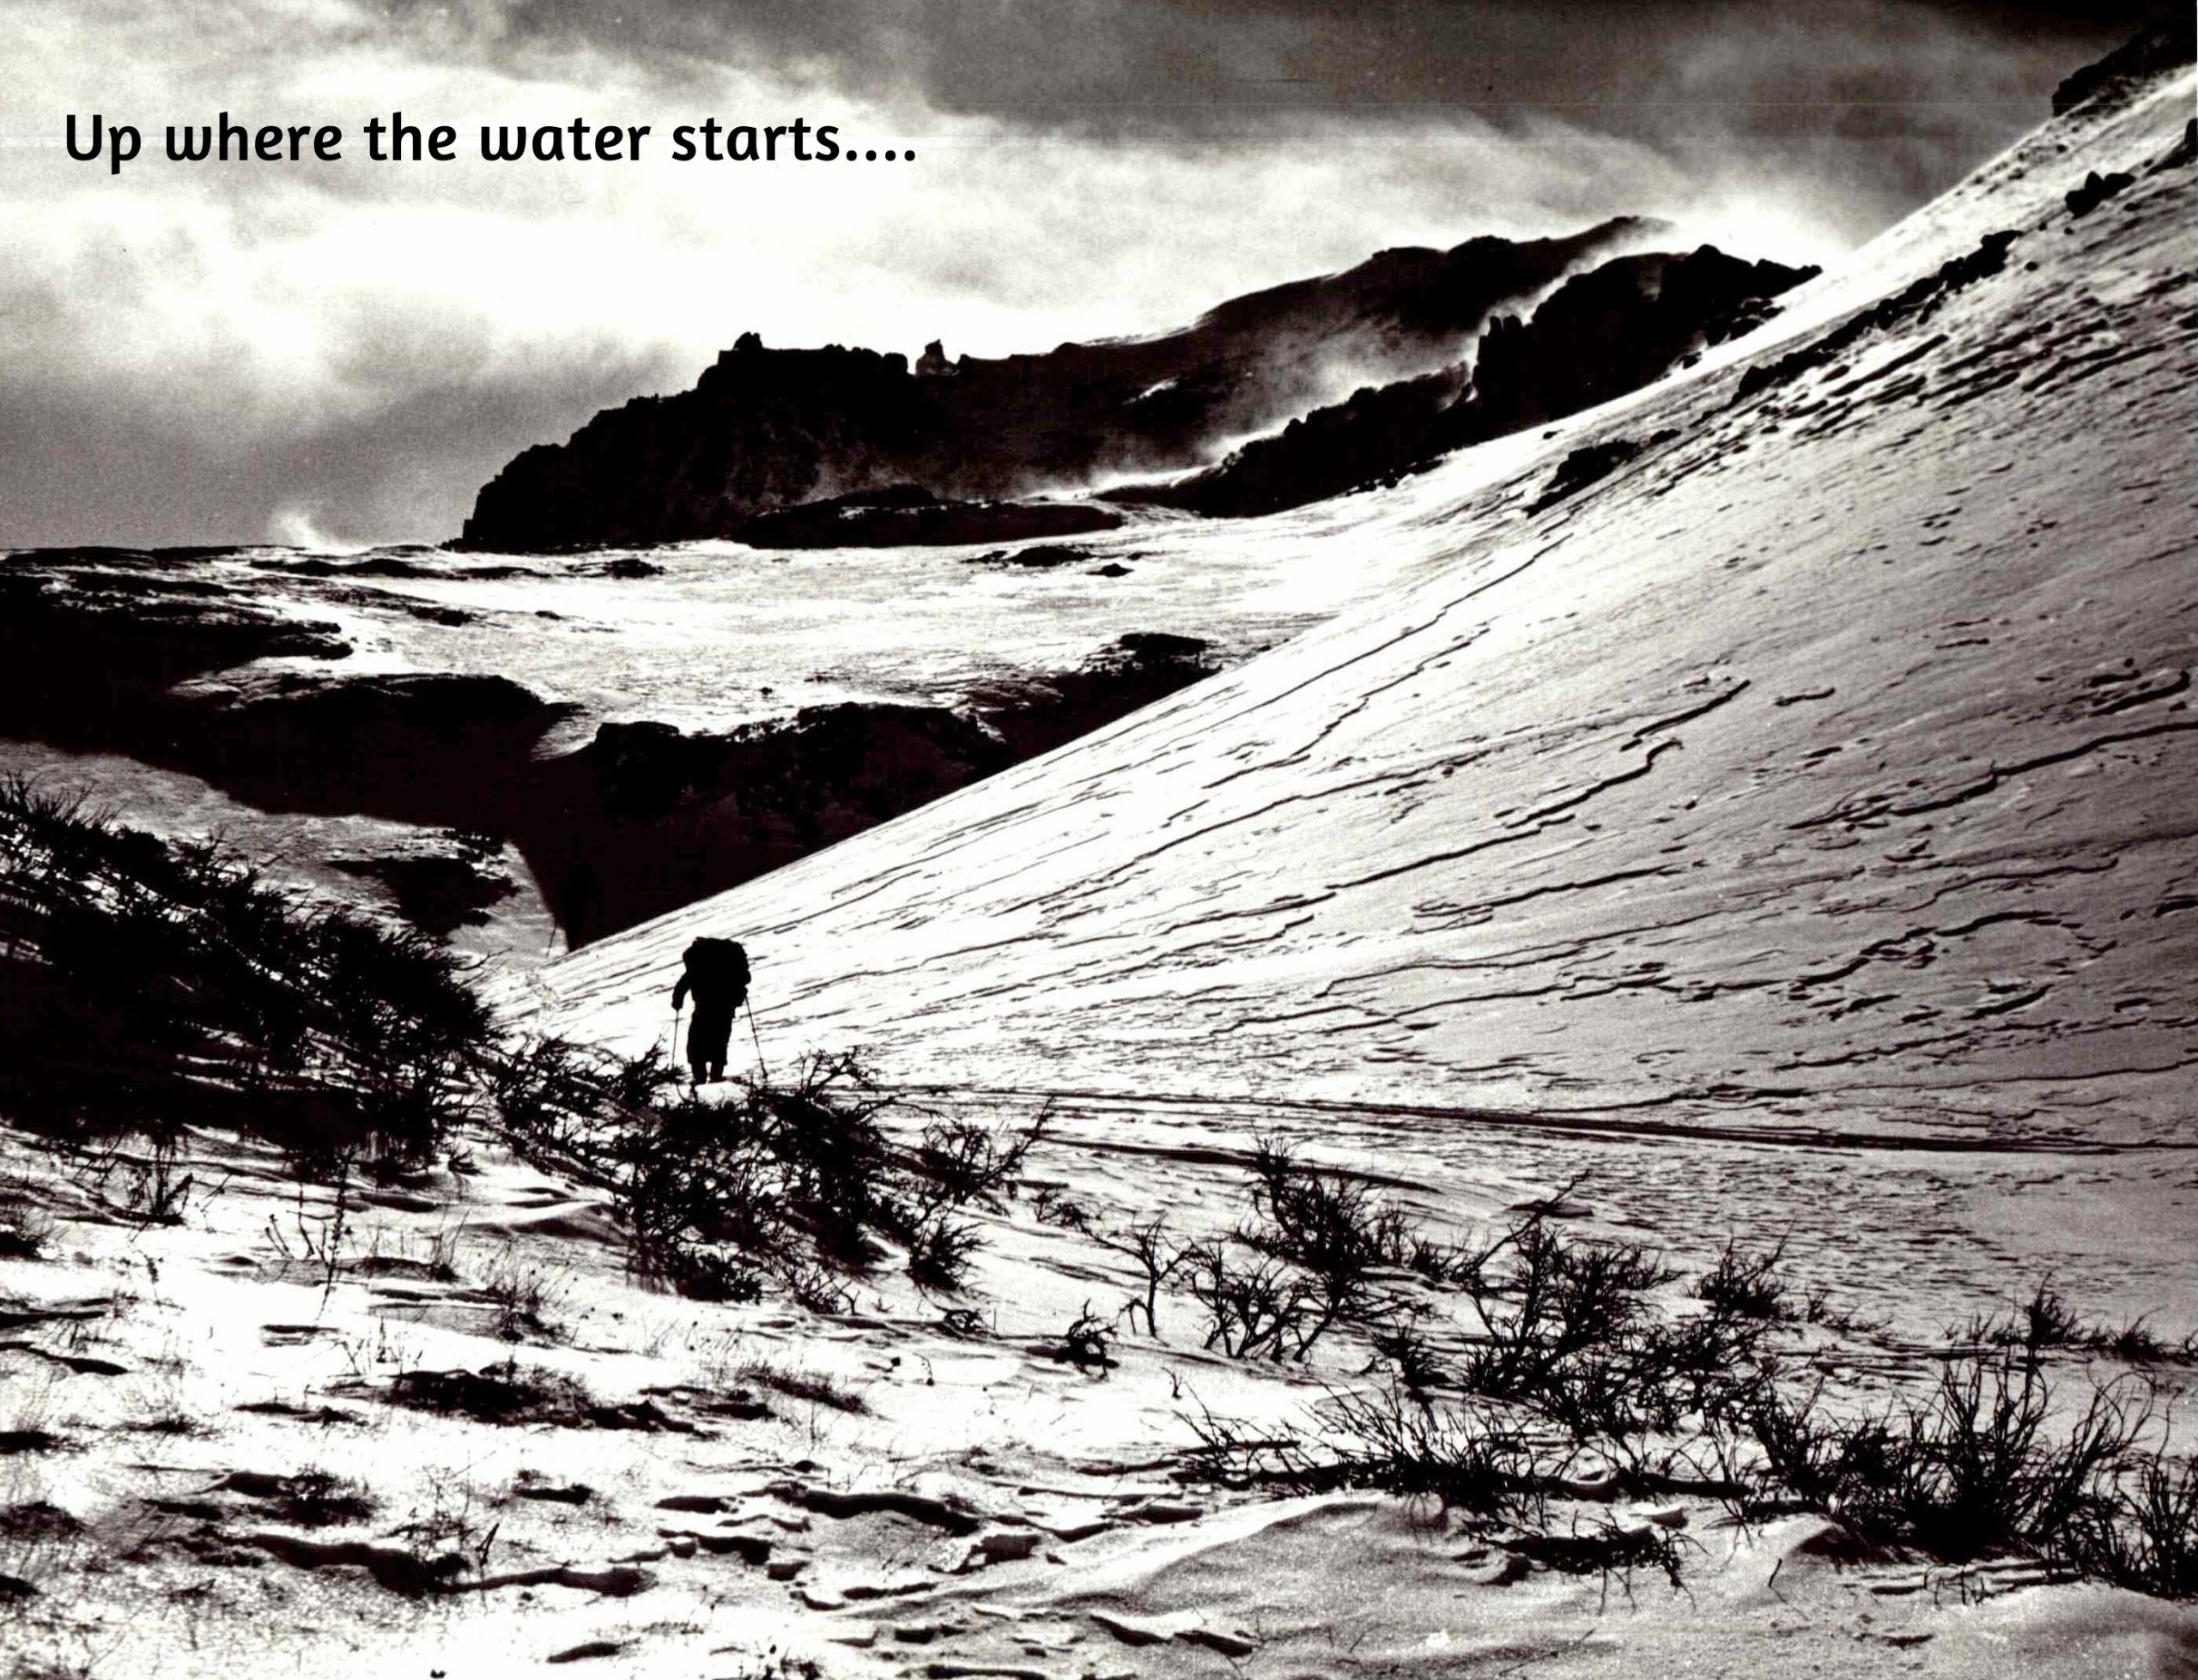
Today, we’ll go to the headwaters, to explore the river’s ‘water-production’ region. The major water-production region for the Colorado River lies almost entirely above the 8,000-foot elevation, mostly on the west slopes of the Southern Rockies in Colorado and Wyoming, but also water from the Wind Rivers in Wyoming, and the east slopes of the Wasatch Range in Utah, and the high plateaus and mountains of eastern Arizona and western New Mexico that give Arizona the Gila River.
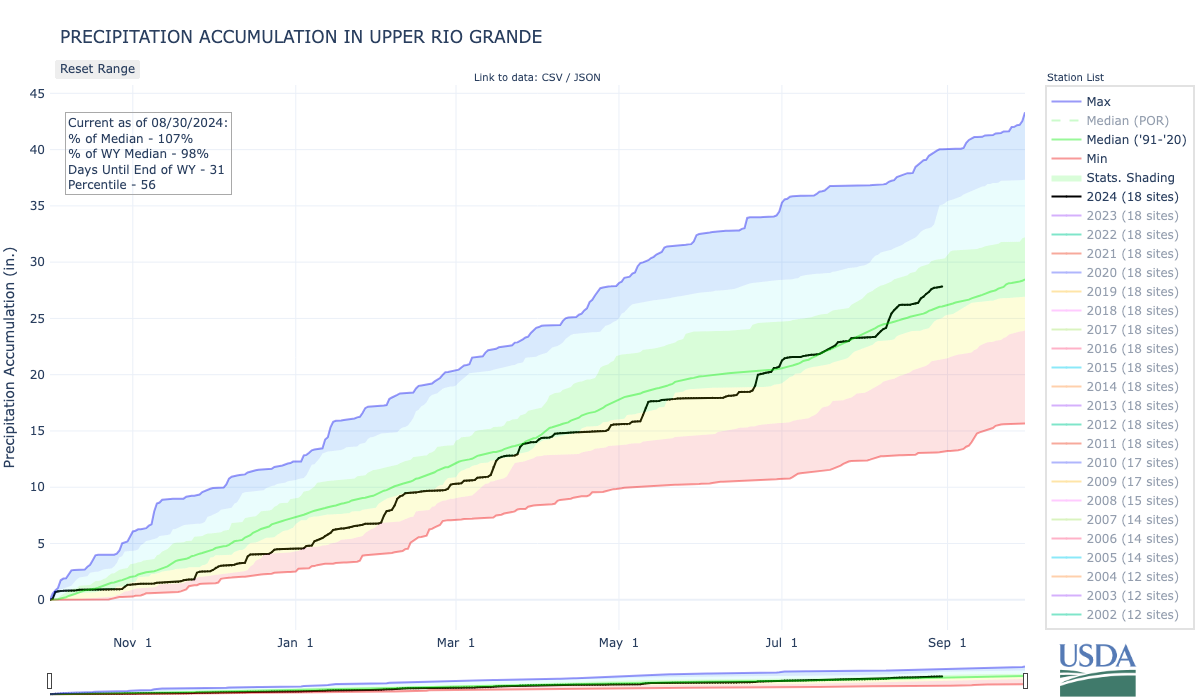
The Western Water Assessment graphic below basically shows the water-production region for the Colorado River (whose natural basin is the black line). ‘April 1 SWE’ is the ‘snow water equivalent on April 1,’ the amount of water in the snowpack that constitutes the majority of the river’s water. Late March to early April is generally presumed to be the time of the highest snowpack in the mountains and other highlands surrounding the upper reaches of the River, so a map of the ‘April 1 SWE’ is a passable map of the river’s water-production area. The blue areas (inside the black line) are less than 15 percent of the 245,000 square-mile River Basin, and as you can see, it is not a contiguous area – just the places that rise high enough to make the moving air give up to the highlands its moisture as rain or snow. Water management decisions throughout the Basin begin to be made on the basis of the April 1 SWE. (The gray lines, by the way, are watershed boundaries for different tributaries and divisions of the river, not the waterways themselves.)
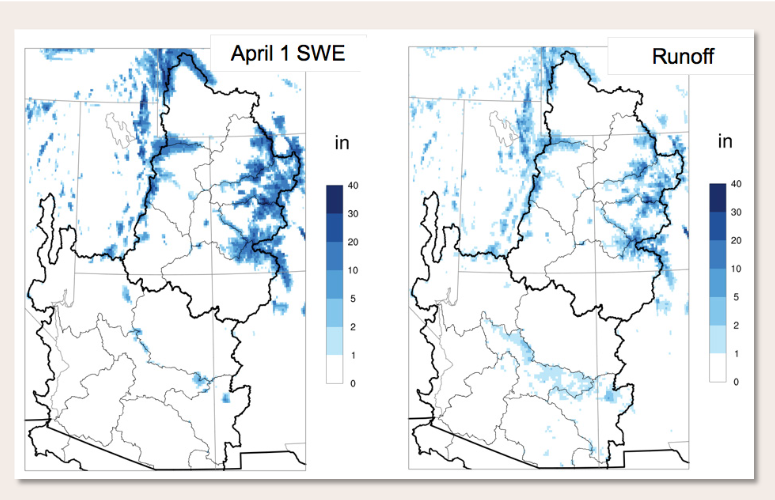
You’ll note that the adjacent averaged annual ‘Runoff’ map indicates that considerably less water flows out of the water-production region than the ‘April 1 SWE’ map shows. Scientists have found that the amount of water that actually makes it into the Colorado River is only a fraction of the water that falls in the river’s water-production region. The Western Water Assessment’s study of the ‘State of the Science’ on Colorado River climate and hydrology claims that on average around 170 million acre-feetof water falls on the Colorado River Basin annually, with the largest portion of that falling on the highlands of the water-production area – yet the river carries on average less than a tenth of that precipitation. What happens to the rest of it?
The short answer there is, the sun is what happens to it: the sun gives, and the sun takes away. The sun distills pure water vapor from the oceans, and the winds (also created by the sun) carry that vapor over the land areas, where begins the ‘dance’ I described in the last post, as water vapor gets pushed up against mountain slopes and condensed to precipitation which falls on the mountains as rain or snow – where the sun and winds quickly go to work on trying to transform it back to vapor.
This begins even in the depths of winter, in sub-freezing weather: the sun beating down on a ‘solid’ snowpack releases enough heat energy to turn the snow crystals directly to water vapor, without going through the liquid state – a process called sublimation. Sublimation happens when a snowpack is directly exposed to the sun; it also happens when the wind blows the snow around breaking down the ice crystals; and it happens when coniferous tree branches intercept and hold the falling snow or rain, which is vaporized off the branches by the sun. On a day of brilliant sun, fairly common in the water-production region, you can actually see ‘steam’ – water vapor – rising where snow sits on an exposed darker surface – rocks or branches. And all of this in temperatures below freezing.

A major study of the water-production area is underway in the Upper East River valley near Crested Butte, as part of a U.S. Energy Department ‘bedrock to upper atmosphere’ study of water and energy; it includes what is probably the most intensive study of sublimation ever assembled. The science team is mainly working on sun and wind sublimation in open areas; early results suggest that around 10 percent of a winter snowpack disappears through that form of sublimation. Losses from branch interception might be as large as that or larger. Guesstimates over the years suggest that as much as a third of the precipitation that falls might disappear through sublimation of ‘solid’ snow to water vapor through the course of a winter.
The snowpack is only ‘safe’ from sublimation where it gets some protection from the sun and wind. Snow that makes it down to the ground in forested areas – not intercepted by branches – is sheltered somewhat from the sun and wind. ‘Aspect’ (location on the mountain) is also important: snow on the north and east slopes of mountains may never see the direct sun all winter, although it will feel the wind.
Eventually winter turns to not-winter, and the accumulated snowpack begins to melt as the air generally warms (with sublimation also ratcheting up with heat). One of three things will happen to the resulting ‘snow water.’ Where slopes are steep or rocky or both, a lot of the water melting out will become runoff – water running off under the affluence of gravity: trickles run together and find their way into the stream flowing out of the watershed, streams meeting other streams in ever larger watersheds until rivers flow out of the mountains into the water-consumption region where they are quickly put to work by farmers and ranchers.
Back up to the melting edge, however – if it can, the water melting out of snow will not run off but will sink into the ground, the preferred alternative for the ‘life project’ on the planet (but not always for the human users). How much water runs off, and how much sinks in, depends on how fast the snow melts and how steep or rocky the slope.
The water that sinks in – groundwater – passes first into a soil area laced and spaced by the roots of all the plant life living on the surface, from little tundra miniatures to great trees. This is variously called the ‘vadose zone,’ the interflow, or most plainly, the unsaturated zone. The roots in the unsaturated zone will take up a lot of that water for their plants to use: some of it will go into the plant’s structure and systems, but most of it – as much as 95 percent of it – will be transpired by the plant: emitted into the atmosphere as water vapor, a kind of air-conditioning system that increases with higher temperatures.
For big old spruces in the subalpine forest, transpiration might be around 80 gallons a day on average (more on a warmer day); for lodgepole pine, maybe 40 gallons a day. That might not sound like lot, a mere 0.0002 of an acre-foot. But next time in the mountains, look at a forested slope across a valley, and try to estimate the number of trees there to the nearest thousand….
In addition, any time the flowing or standing water is exposed to the sun, the sun takes a cut through straight evaporation. Evaporation also increases with temperature. One of the East River project researchers, Dr. Rosemary Carroll, claims in a research paper that, in a typically dense montane forest, the total evapotranspiration (evaporation plus transpiration) can add up to equal the precipitation that fell on the forest.
So it becomes clear that the water produced in its mountains for the Colorado River is a ‘net’ figure – precipitation minus natural depletion from a) a winter of sublimation every day the sun shines, b) evaporation of water melted from snow when exposed to the sun, and c) transpiration by the forests of the water making its way underground.
But we have to then add back in the groundwater that makes its way down through the unsaturated zone to a saturated zone below most of the thirsty roots. The top of the saturated zone is called the water table, which rises and falls with the amount of water saoking into the ground. Water in both the unsaturated and saturated zones filters its way downslope pulled by gravity and pushed by more water coming in above.
Eventually it will makes its way to the bottom of the watershed where the stream flows; there, if the water table is higher than the stream level, the groundwater will feed into the stream. Scientists have figured out how to tell from a sample of stream water how much of it is runoff, and how much has come through the groundwater route; over a good water year with healthy water tables, the ratio of groundwater to runoff will be about 50-50, with runoff being greater during the spring flood season and groundwater dominating the fall and winter flows.
Carroll notes in the same paper that the journey of groundwater to the stream might be very leisurely; while some of it might make its way through the cobble found in many mountain valleys in a matter of days, water that sinks into cracks and interstices in more solid rock might not show up in the stream for a century – or never, unless someone drills into the rock and installs a pump.
In the final tally, about one-fifth of the precipitation that falls in the high headwaters emerges as water for the river. Another portion of it is in ‘longterm storage’ as groundwater in aquifers. But the rest, probably more than half of it, has gone back to the vaporous state of water. The sun giveth, and the sun taketh away.
The ‘Headwaters Challenge’ ought to be obvious. We can’t do a lot about what happens up in the alpine tundra – but are there management strategies for the forests we could employ that might cut down on the amount of water we lose to the sun there, increasing the net water production even a little to compensate for what we are losing to the warming climate? That’s the romantic exploration I’m on these days, reading a lot of scientific papers I only partially understand. I may or may not be ready to say anything about this in the next post – but I wanted to get the challenge in front of those who read this, to ask if any of you have any ideas….
Meanwhile – the apparent preference of the sun for water in the vaporous state should probably make us a little nervous. Obviously, the warmer it gets, the more water gets sublimated, evaporated and transpired – and we seem to be doing all we can to make the world warmer. Not a good survival strategy for species dependent on liquid water, even though we are convinced we cannot survive without the things whose byproducts make the world warmer…. That’s a bigger challenge facing us all.