Click on a thumbnail graphic to view a gallery of drought data from the US Drought Monitor website.
US Drought Monitor map July 6, 2021.
West Drought Monitor map July 6, 2021.
High Plains Drought Monitor map July 6, 2021.
Colorado Drought Monitor map July 6, 2021.
Click here to go to the US Drought Monitor website. Here’s an excerpt:
This Week’s Drought Summary
Another week of hot, dry weather in the Pacific Northwest, Northern Rockies, Northern Plains, and Upper Midwest led to the expansion of drought conditions. Meanwhile, monsoon thunderstorms brought wet weather to eastern New Mexico and West Texas resulted in large one-category improvements. Showers and thunderstorms associated with a slowly moving cold front helped improve conditions in the Great Lakes region and eastern U.S. Drought expanded in parts of the Mid-Atlantic that missed out on the heaviest rain…
Another hot, dry week across the northern tier of the region, coupled with isolated showers, brought a mix of degradations and improvements. Drought expanded in parts of Wyoming, North Dakota, South Dakota, and Nebraska that missed out on the heaviest rainfall. Soils remain dry with USDA reporting that 92% of South Dakota and 76% of North Dakota’s topsoil moisture is short to very short, leading to limited hay production and stunted crop growth. Land enrolled in the Conservation Program has been opened to haying and grazing in some areas and producers are needing to monitor toxicity levels in hay and water supplies. Drought conditions improved in parts of Wyoming and eastern Nebraska, as showers over the last two weeks helped erase rainfall deficits, improve streamflow, and replenish soil moisture. In North Dakota, rainfall is finally helping to chip away at the long-term drought that has plagued the state since fall of 2020…
Another week of hot, dry weather once again led to worsening drought conditions across the Northwest. Temperatures as high as 17 degrees above normal set more high temperature records across the region. The excess heat continued to increase evaporative demand, dry out soils and vegetation, and strain water resources. Many areas in the Northwest saw degradations and pacts across the region continue to build. In Oregon, where drought intensified and expanded across severe drought (D2) to exceptional drought (D4) levels, soil moisture, streamflow, and the SPEI (a drought monitoring indicator that includes the effects of precipitation and temperature) show conditions are among the driest going back to 1895. Dryland agriculture is suffering and fire risk has escalated. In Washington, abnormal dryness (D0) and moderate drought (D1) expanded. With nearly all of the state experiencing dryness or drought, the U.S. Department of Agriculture’s National Agricultural Statistics Service (USDA NASS) reports as of July 4 that 84% of the state’s topsoil moisture is short to very short, significantly impacting forage production. The data show that the state’s rangeland and pasture conditions are far worse this year when compared to all other years this century. In Idaho, which saw expansions in D1-D3 drought categories, the state drought monitoring team noted that the Big Lost River is almost out of storage and priority water use is limited to early 1884 priorities. The team also reported significant agricultural impacts to the state, including crop loss, a lack of forage, and animal deaths. Montana, which saw D1-D4 expansion, recorded less than 25% of normal precipitation in June, which is historically the highest precipitation month. Impacts include diminished forage production and infestations of grasshoppers. Much of the Southwest remained unchanged this week. Where precipitation fell, such as in Arizona, it generally wasn’t enough to improve impacts. In places where it didn’t, conditions already are at D4 or don’t yet warrant additional degradations. The only exception was eastern New Mexico, where heavy rains (about 3 to 8 inches) over the past six to 10 days began to make a dent in the long-term drought, while also contributing to flash floods in the area. According to the Albuquerque National Weather Service, water levels at Santa Rosa Lake have risen over a foot since July 1…
Substantial rain fell across much of the South again this week, leading to large areas of one-category improvements to remaining drought areas in Texas and Oklahoma, where rainfall deficits, soil moisture, and streamflow improved. A two-category improvement was made in far West Texas near El Paso, where more rainfall has been recorded in the last nine days than in the prior 15 months…
Looking Ahead
The National Weather Service Weather Prediction Center forecast for the remainder of the week (July 8 -13) shows tropical storm conditions and rainfall from Elsa will continue across parts of Florida and into the Southeast. Other areas expecting excessive rainfall include the Texas coast, Midwest, and Northeast. In the West, the hot weather will continue with daytime highs well into the 90s and lower 100s. Moving into next week, the Climate Prediction Center six-to-10 day outlook (valid July 13-17) favors above normal temperatures across much of Alaska, the West, northern Plains and Northeast. Below normal temperatures are most likely across the Southern Plains. Below normal precipitation is expected across Alaska, the Northwest, Northern Plains, and Florida while above normal precipitation is favored along a band stretching from the Southwest, across the Midwest, and into the Northeast.
US Drought Monitor one week change map ending July 6, 2021.
Just for grins here are early July US Drought Monitor maps for the past few years.
From RiversEdge West via The Grand Junction Daily Sentinel:
Tamarisk trees, those green bushy plants seen along waterways, have been turning brown across the county thanks to a special beetle used to control the invasive species.
Ben Bloodworth, Tamarisk Beetle Program coordinator with RiversEdge West, sent out a note Monday responding to social media posts from local people wondering why they were seeing so many browning tamarisk plants.
“These are tamarisk trees, or salt cedars, and the phenomenon is currently so pervasive here in the valley that folks are starting to wonder about it on social media,” Bloodworth said. “So, before you blame anyone for over-spraying, or the hot, dry air of June, let’s chat about the millions of little beetles that live in the valley with us.”
According to Bloodworth, tamarisk, which is native to Asia and the Mediterranean, became such an environmental and economic problem in the western United States that the U.S. Department of Agriculture (USDA) decided to research and release a biological control agent to address the issue.
“Biocontrols are natural ‘predators’ that feed on plants in their native ranges but are not found in the U.S.,” Bloodworth said. “In 1987 the USDA began a program to find natural enemies of tamarisk and see if they could live and feed on tamarisk in North America without feeding on anything else.”
Out of hundreds of candidate species, the tamarisk beetle was found to be the most successful. It was found to only feed on tamarisk and not any other species of plants. So the USDA began releasing it, including in Moab, Utah, in 2001. From there the beetle spread up the Colorado River to Mesa County.
“Since tamarisk beetles survive on tamarisk as their only food source, they were never intended to eliminate the invasive plant,” Bloodworth said. “Rather, they were released to help control the spread of the plant and reduce the amount that land managers must remove by other, more costly means.”
The small green beetles, when there is a large enough population, can defoliate a large amount of tamarisk in just a few weeks. Left behind are the orangish brown remains of the formerly green tamarisk.
“The populations ebb and flow with available tamarisk and some years we have almost no tamarisk beetles anywhere,” Bloodworth said. “As you may have noticed by all the brown tamarisk, this is not one of those years!”
Counterintuitively the brown, dead tamarisk is actually less of a fire danger than the green plant, Bloodworth said. It may initially, for a few weeks, be more susceptible to catching fire, but once it has dropped its leaves it is actually less of a fire risk, according to Bloodworth.
“The brown trees may not be pretty, but they do provide for opportunities to restore native vegetation alongside our rivers,” Bloodworth said.
2014 Tamarisk leaf beetle distribution map via the Tamarisk Coalition
This summer, a historic drought and its consequences are tearing communities apart and attracting outside attention to a water crisis years in the making. Competition over Klamath River water has always been intense, but now there is simply not enough, and all the stakeholders are suffering.
“Everybody depends on the water in the Klamath River for their livelihood. That’s the blood that ties us all together,” [Ben] DuVal said of the competing interests. “Nobody’s coming out ahead this year. Nobody’s winning.”
Those living the nightmare worry the extreme drought is a harbinger of global warming.
“The system is crashing … for people up and down the Klamath Basin,” said Frankie Myers, vice chairman of the Yurok Tribe, which is monitoring a massive fish kill on the river. “It’s heartbreaking.”
Twenty years ago, when water feeding the irrigation system was drastically reduced amid another drought, the crisis became a national rallying cry for the political right, and some protesters opened the main irrigation canal in violation of federal orders.
This time, many irrigators reject the presence of anti-government activists. Farmers who need federal assistance to stay afloat fear ties to the far right could hurt them.
Meanwhile, toxic algae is blooming in the basin’s main lake, and two national wildlife refuges critical to migratory birds are drying out. The conditions have exacerbated a water conflict that began more than a century ago.
Beginning in 1906, the federal government reengineered a complex system of lakes, wetlands and rivers in the 10 million-acre Klamath River Basin to create tens of thousands of acres of irrigated farmland.
The Klamath Reclamation Project draws its water from the 96-square-mile Upper Klamath Lake. But the lake is also home to suckerfish central to the Klamath Tribes’ culture and creation stories.
In 1988, the U.S. Fish and Wildlife Service listed two species of sucker fish as endangered. The federal government must keep the lake at a minimum depth to support the fish — but this year, amid exceptional drought, there was not enough water to do that and supply irrigators.
“Agriculture should be based on what’s sustainable. There’s too many people after too little water,” said Don Gentry, the Klamath Tribes chairman.
With the Klamath Tribes enforcing their senior water rights to help suckerfish, there is also no extra water for downriver salmon.
The Karuk Tribe last month declared a state of emergency, citing climate change and the worst hydrologic conditions in the Klamath River Basin in modern history. Karuk tribal citizen Aaron Troy Hockaday Sr. is a fourth-generation fisherman but says he hasn’t caught a fish in the river since the mid-1990s…
In most years, the tribes 200 miles to the southwest of the farmers, where the river reaches the ocean, ask the Bureau of Reclamation to release pulses of extra water from Upper Klamath Lake. The extra water mitigates outbreaks of a parasitic disease that proliferates when the river is low.
This year, the federal agency refused those requests.
Now, the parasite is killing thousands of juvenile salmon in the lower Klamath River, where the Karuk and Yurok tribes have coexisted with them for millennia. An average of 63 percent of fish caught last month in research traps near the river’s mouth were dead…
Near the river’s source, some of the farmers who are seeing their lives upended by the same drought say a guarantee of less water — but some water — each year would be better than the parched fields they have now. Some worry problems in the basin are being blamed on a way of life they also inherited.
Photo credit: Elisa Stone via the World Weather Attribution
Here’s the release from the World Weather Attribution:
During the last days of June 2021, Pacific northwest areas of the U.S. and Canada experienced temperatures never previously observed, with records broken in many places by several degrees Celsius.
Multiple cities in the U.S. states of Oregon and Washington and the western provinces of Canada recorded temperatures far above 40ºC (104 ºF), including setting a new all-time Canadian temperature record of 49.6ºC in the village of Lytton. Shortly after setting the record, Lytton was largely destroyed in a wildfire [1,2]. The exceptionally high temperatures led to spikes in sudden deaths, and sharp increases in hospital visits for heat-related illnesses and emergency calls [3,4,5]. Heatwaves are one of the deadliest natural hazards and this heatwave affected a population unaccustomed and unprepared for such extreme temperatures, for instance with most homes lacking air-conditioning [6]. Currently available mortality estimates of at least several hundred additional deaths are almost certainly an underestimate. The full extent of the impact of this exceptional heat on population health will not be known for several months.
Scientists from the US, Canada, the UK, the Netherlands, France, Germany and Switzerland collaborated to assess to what extent human-induced climate change made this heatwave hotter and more likely.
Using published peer-reviewed methods, we analysed how human-induced climate change affected the maximum temperatures in the region where most people have been affected by the heat (45–52 ºN, 119–123 ºW) including the cities of Seattle, Portland, and Vancouver (with well over 9 million people in their combined metropolitan areas).
Fiure 1: Station data anomalies of the 2021 event relative to the mean of the highest daily maximum temperature of the year in the time series. Note that some stations do not have data up to the peak of the heatwave yet and hence underestimate the event. Negative values certainly do not include the heatwave and have therefore been deleted. The black box shows the study region. Source: GHCN-D downloaded 4 July 2021.
Main findings
Based on observations and modeling, the occurrence of a heatwave with maximum daily temperatures (TXx) as observed in the area 45–52 ºN, 119–123 ºW, was virtually impossible without human-caused climate change.
The observed temperatures were so extreme that they lie far outside the range of historically observed temperatures. This makes it hard to quantify with confidence how rare the event was. In the most realistic statistical analysis the event is estimated to be about a 1 in 1000 year event in today’s climate.
There are two possible sources of this extreme jump in peak temperatures. The first is that this is a very low probability event, even in the current climate which already includes about 1.2°C of global warming — the statistical equivalent of really bad luck, albeit aggravated by climate change. The second option is that nonlinear interactions in the climate have substantially increased the probability of such extreme heat, much beyond the gradual increase in heat extremes that has been observed up to now. We need to investigate the second possibility further, although we note the climate models do not show it. All numbers below assume that the heatwave was a very low probability event that was not caused by new nonlinearities.
With this assumption and combining the results from the analysis of climate models and weather observations, an event, defined as daily maximum temperatures (TXx) in the heatwave region, as rare as 1 in a 1000 years would have been at least 150 times rarer without human-induced climate change.
Also, this heatwave was about 2°C hotter than it would have been if it had occurred at the beginning of the industrial revolution (when global mean temperatures were 1.2°C cooler than today).
Looking into the future, in a world with 2°C of global warming (0.8°C warmer than today which at current emission levels would be reached as early as the 2040s), this event would have been another degree hotter. An event like this – currently estimated to occur only once every 1000 years, would occur roughly every 5 to 10 years in that future world with 2°C of global warming.
In summary, an event such as the Pacific Northwest 2021 heatwave is still rare or extremely rare in today’s climate, yet would be virtually impossible without human-caused climate change. As warming continues, it will become a lot less rare.
Our results provide a strong warning: our rapidly warming climate is bringing us into uncharted territory that has significant consequences for health, well-being, and livelihoods. Adaptation and mitigation are urgently needed to prepare societies for a very different future. Adaptation measures need to be much more ambitious and take account of the rising risk of heatwaves around the world, including surprises such as this unexpected extreme. Deaths from extreme heat can be dramatically reduced with adequate preparedness action. Heat action plans that incorporate heatwave early warning systems can strengthen the resilience of cities and people. In addition, longer-term plans are needed to modify our built environments to be more adequate for the hotter climate that we already experience today and the additional warming that we expect in future. In addition, greenhouse gas mitigation goals should take into account the increasing risks associated with unprecedented climate conditions if warming would be allowed to continue.
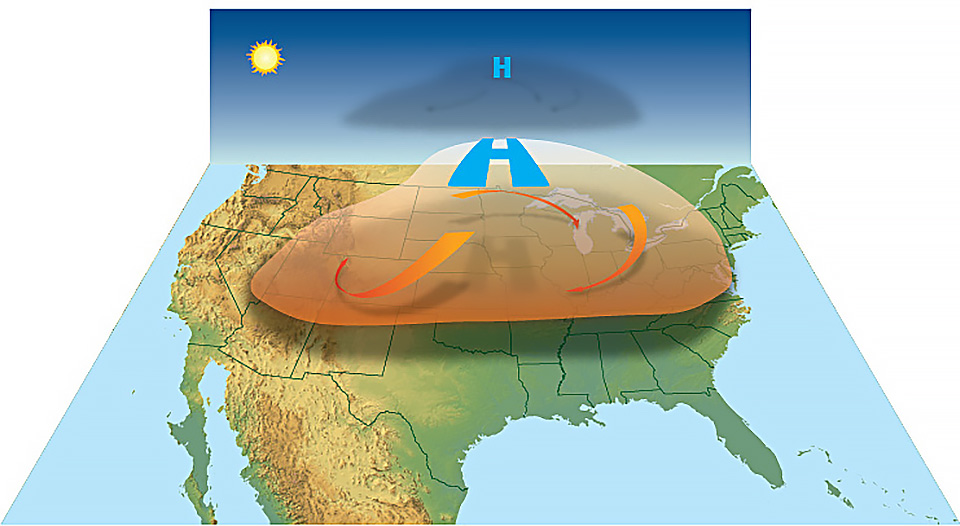
High-pressure circulation in the atmosphere acts like a dome or cap, trapping heat at the surface and favoring the formation of a heat wave. Graphic credit: NOAA
Background information
The heatwave considered in this study is linked to a slow-moving strong high pressure system, sometimes called Omega-blocking or “heat dome”, which brings descending and thus warm and dry air, as well clear skies, further heating the near-surface air. This high pressure system also reached record levels in terms of its strength, measured as the “thickness” of the lower part of the atmosphere, the so-called troposphere. The pressure values observed in the very strong blocking anticyclone are comparable to those observed in other parts of the world in recent heatwaves. The “Omega” blocking pattern is typically associated with heatwaves in this region. While the pressure system was record-breaking in its values, it was far less unusual compared to climatology than the associated extreme temperatures. Recent research suggests that climate change increases the chances for such stagnant high pressure systems in summer through weakening of the summer jet stream. As of yet, it is unclear if, and to what extent, such long-term dynamical changes play a role in this event.
An important feature of this extreme heatwave is that it occurred following a very dry spring over the Western U.S., so the absence of evaporative cooling could be an important factor in the exceptional temperatures observed. However, the northern part of the region impacted by this heatwave experienced wet anomalies in the weeks and months preceding the heat. Anticyclonic subsidence, and downslope winds were also present, and probably acted as additional heating factors. Overall, it is difficult at this stage to assess the extent to which these factors either in isolation or combined provide a good explanation of why the observed temperatures were so much higher than anything ever recorded in this part of the world. Hence, more research is needed to understand the processes as well as potential influence of human-caused climate change on them.
Here we provide a first estimate of the role of climate change on the extreme temperatures measured in the Pacific Northwest. We analyse the maximum daily temperatures as these are relevant to the impact of the event. While the minimum temperatures are also important for health impacts, we used only one index to keep the assessment straightforward. In this rapid study, we do not analyse the impact that human-caused climate change may have on specific aspects leading to the observed synoptic situation. We ask whether and to what extent human-caused climate change altered the likelihood and intensity of the analysed event. Specifically we analyse (1) how the likelihood of the yearly maximum temperature to be as high or higher than observed in June 2021 has changed and (2) how much less severe a heatwave with the same return period would have been in a world without human-caused climate change. It is important to highlight that, because the temperature records of June 2021 were very far outside all historical observations, determining the likelihood of this event in today’s climate is highly uncertain. All numbers shown assume that the heatwave was a very low probability event (about 1 in 1000 years) that was not caused by new nonlinearities. As in previous analyses, we only give a lower bound of the estimate of the influence of climate change on the change in probability of the event as the best estimate and upper bound are very ill-defined for extreme heat.
Based on this first rapid analysis, we cannot say whether this was a so-called “freak” event (with a return time on the order of 1 in 1000 years or more) that largely occurred by chance, or whether our changing climate altered conditions conducive to heatwaves in the Pacific Northwest, which would imply that “bad luck” played a smaller role and this type of event would be more frequent in our current climate.
In either case, the future will be characterized by more frequent, more severe, and longer heatwaves, highlighting the importance of significantly reducing our greenhouse gas emissions to reduce the amount of additional warming.
The latest heat-related death numbers are alarming, yet they are likely a severe undercount and the real toll will only become clear after mortality statistics are reviewed for the role of heat in exacerbating underlying conditions.
References
[1] World Meterological Organization: June ends with exceptional heat
[2] Global News: Scenes of destruction after wildfire destroys village of Lytton, B.C.
[3] Vancouver Sun: Heat wave linked to massive spike in sudden deaths across Lower Mainland
[4] Oregon Health Authority: Summer 2021 Oregon ESSENCE Hazard Report
[5] CNN: Historic Northwest heat wave linked to dozens of deaths and hundreds of emergency room visits
[6] New York Times: Air-Conditioning Was Once Taboo in Seattle. Not Anymore.
Here’s the release from Colorado Parks & Wildlife (Travis Duncan):
Due to extremely low flows and warm water temperatures, Colorado Parks and Wildlife is asking anglers to voluntarily avoid fishing on the Colorado River between Kremmling and Rifle.
Effective Wednesday, July 7, CPW is placing a full-day voluntary fishing closure on the Colorado River beginning at the Highway 9 bridge in Kremmling downstream to the Highway 13 bridge in Rifle. The voluntary closure will remain in effect until further notice, with a possibility of a mandatory emergency closure to all fishing if conditions worsen.
“We know that anglers care deeply about this fishery,” said CPW Aquatic Biologist Lori Martin. “We need their help to conserve this resource.”
Because of the ongoing drought, flows are down in the river. The USGS gauge on the Colorado River at Catamount Bridge typically measures between 1,500 and 2,000 cubic feet per second (cfs). The gauge has been measuring 600 – 700 cfs, about half what is historically expected there. The USGS gauge on the Colorado River near Dotsero is running at 1,250 cfs, down from an expected 3,000 – 4,000 cfs.
CPW’s aquatic biologists on the West Slope are concerned about critically high water temperatures and possible low dissolved oxygen. Some fish mortality has already been observed this summer. In addition to these issues, another factor unique to this year has been multiple mudslides and flash flood events resulting from last year’s fires. This has increased the sediment load in some river sections.
“With the high sediment load, the fish can’t find clear water,” said CPW Aquatic Biologist Kendall Bakich “They’ve got to sit through those conditions. And at nighttime, the temp isn’t coming down enough, so there’s no recovery for those fish right now. They’ve just got to hang on.”
These conditions aren’t just limited to the Colorado River.
“We’re likely looking at moving into a voluntary fishing closure on the Yampa River from the upstream boundary of the Chuck Lewis State Wildlife Area downstream to the west city limits of the town of Steamboat Springs,” said CPW Aquatic Biologist Bill Atkinson. “Water temps surpassed 75 degrees on Tuesday, so if it hits 75 degrees on Wednesday, the closure will be implemented.”
Biologists are also closely monitoring the Fraser and upper Colorado Rivers in Grand County, another area where temperatures are edging toward dangerous levels for trout.
Anglers should be aware that most of the major rivers on Colorado’s Western Slope are experiencing adverse conditions heading into the hottest days of summer. Follow the Leave No Trace Principle to “Know Before You Go” to the West Slope this summer and check out conditions related to mandatory and voluntary fishing closures: https://cpw.state.co.us/thingstodo/Pages/StatewideFishingConditions.aspx
Tips for anglers
CPW is encouraging trout anglers to consider fishing early in the day and in higher altitude lakes and streams as hot, dry conditions and reduced water levels increase stress to trout populations.
Heat, drought, and low water levels are contributing to elevated water temperatures in much of Colorado, depleting oxygen levels and leaving trout vulnerable. Trout are cold-water fish that function best in 50-60 degree waters. When temperatures exceed 70 degrees, they often stop feeding and become more susceptible to disease. Warm temperature and low water levels can also lead to algae blooms in rivers and reservoirs which cause oxygen levels to drop when algae die and decompose.
Anglers are asked to carefully consider the water and weather conditions when they go fishing for trout. If water seems too warm or fish appear lethargic, it would be best to leave the fish undisturbed. During mid-summer, try to fish early in the morning when the water is coolest.
“Get out early to avoid the higher water temperatures commonly seen in the afternoon and evening,” Martin said. “Anglers are also encouraged to seek out high-elevation trout lakes and streams, where water temperatures are more suitable and fishing doesn’t potentially add additional stress.”
Martin also urged anglers to add a hand-held thermometer to their fishing kits so they can test the waters they intend to fish.
“Anglers should monitor water temperatures and stop fishing when water temperatures start to approach 70 degrees,” she said. “If trout have difficulty recovering after being caught and are acting lethargic, it’s a good decision to call it quits for the day.”
Other suggestions include using heavier tippet and line to quickly reel in and release the fish, always wetting your hands before handling a fish, and to keep the fish submerged while unhooking and releasing it. Avoid taking the fish out of the water even for a quick photo in these conditions.
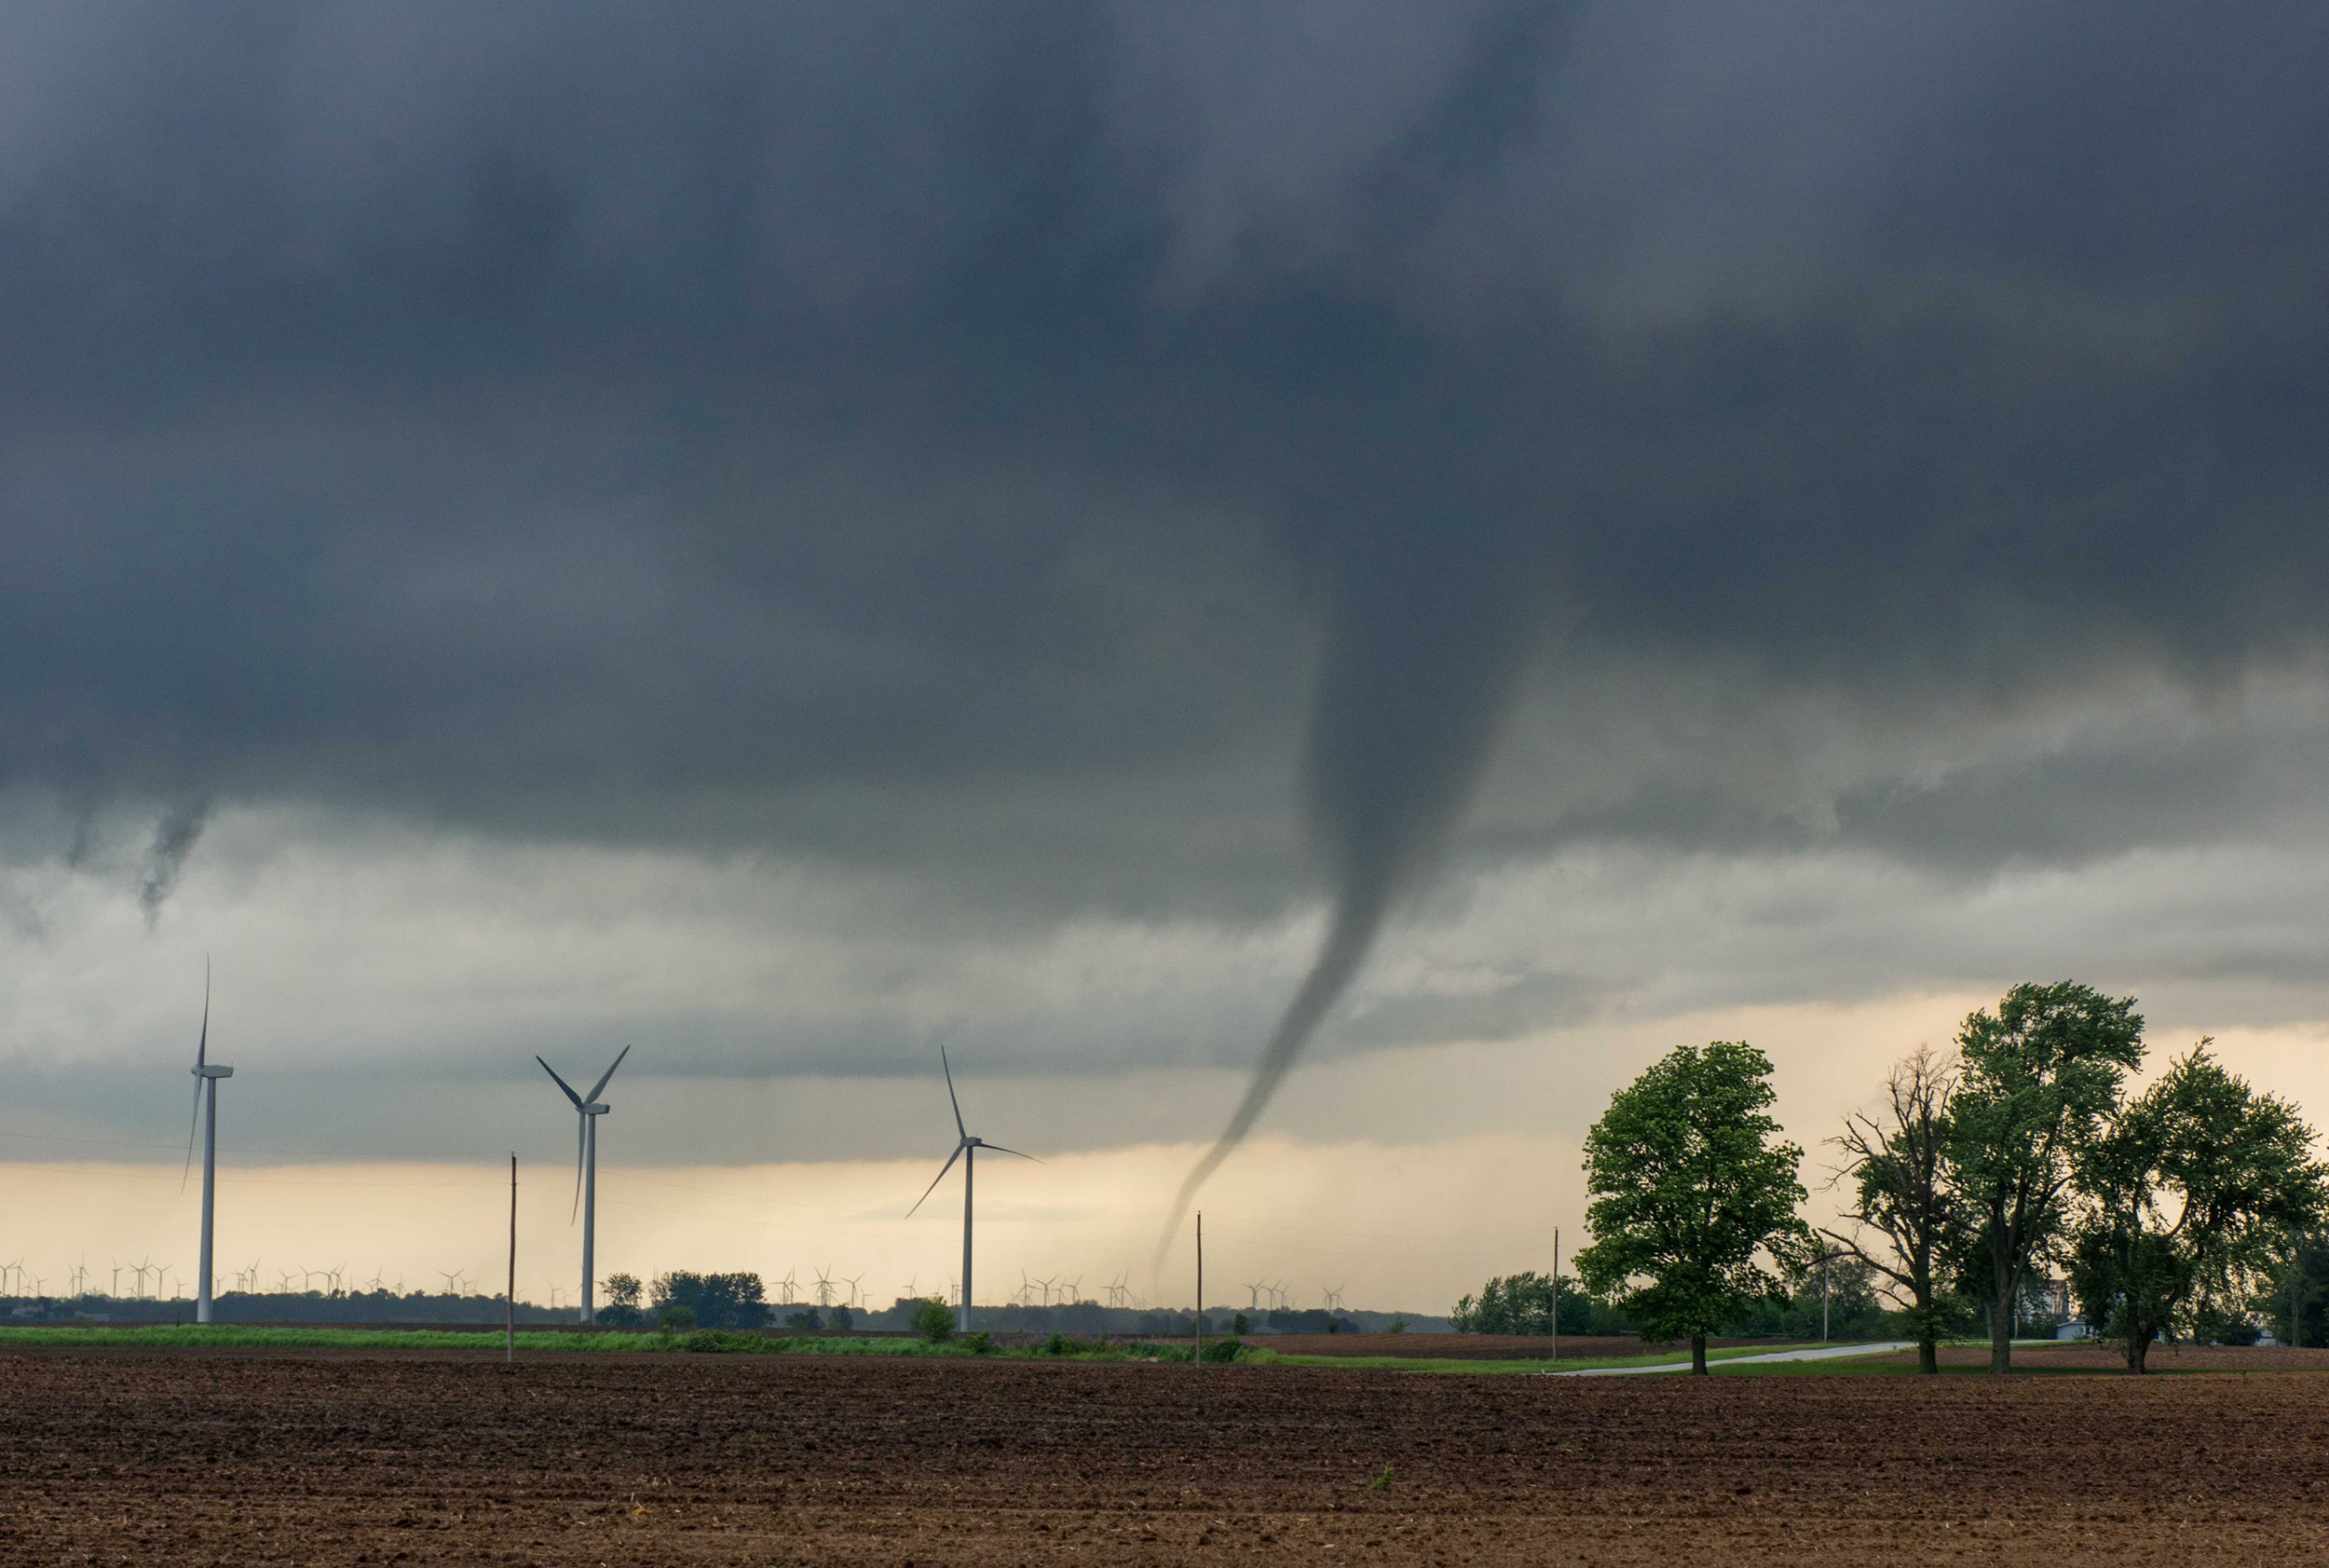
Dr. John Allen is an Assistant Professor of Meteorology in the Department of Earth and Atmospheric Sciences, Central Michigan University. Dr. Allen’s research focuses characterizing severe convective storms globally, and how these events that produce hailstorms and tornadoes are linked to climate change and variability from subseasonal to seasonal scales. In 2015 he and colleagues at Columbia developed an experimental seasonal tornado outlook, and he was a founding member of the experimental subseasonal Extended Range Tornado Activity Forecast group.
La Niña’s influence is linked to a higher frequency of tornadoes in the spring. However, although La Niña conditions were present through April, 2021, the year so far has recorded below-average tornado counts. Now that we are through the peak of the season, discussion among forecasters has turned toward deliberating over the low tornado frequency in what many predicted to be an active season (1).
What happened?
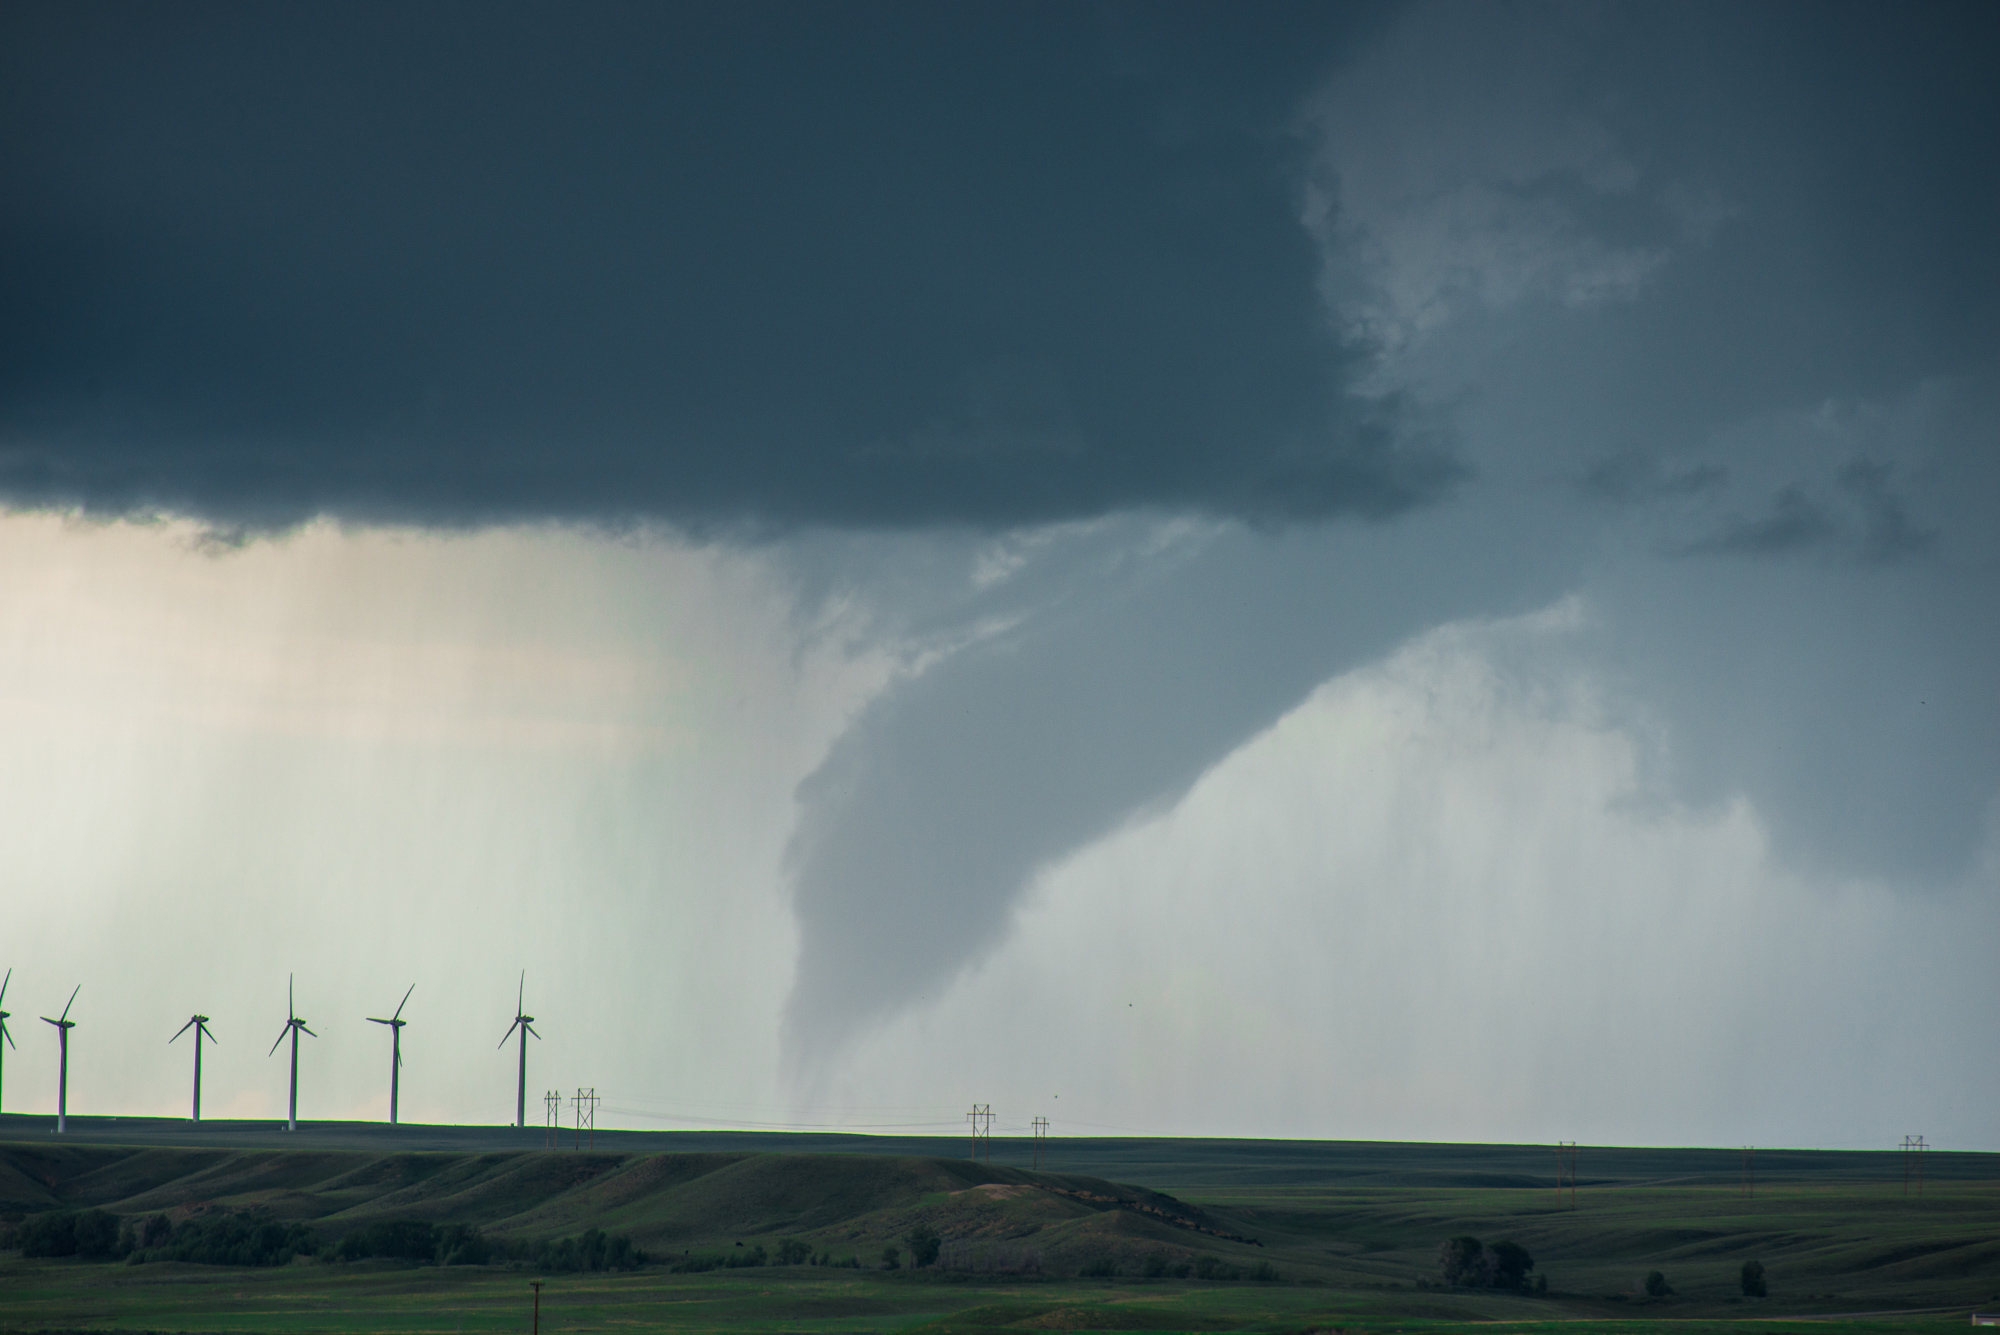
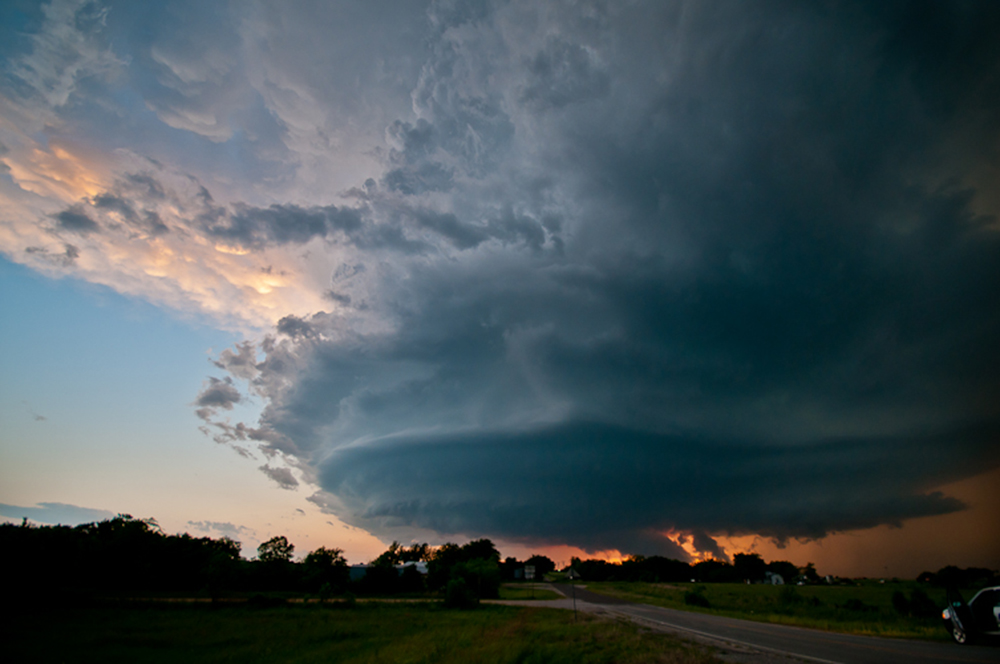
Photo by John Allen via NOAA.
To begin to address what happened in 2021, we need to go back to what these seasonal predictions are based on. While there are many contributing sources of tornado variability, there is a relationship between El Niño/Southern Oscillation (ENSO) and the frequency of tornadoes. Many people will remember that the last extremely active tornado year, 2011, was a strong La Niña year. A moderate La Niña was observed this past winter and was predicted to continue into the spring, leading to expectations and speculation in the media about a potentially active season. In this post, we consider the relevant factors and what this tells us about our capacity to predict seasonal tornado activity.
How ENSO and tornadoes are related
Connecting tornadoes to the larger climate system is a hard problem, as the frequency of tornadoes typically has large year-to-year variability. However, the idea of a connection between ENSO and severe thunderstorms and tornadoes is not new, with some of the most tornado-active years in history being associated with La Niña (Marzban and Schaefer 2001, Cook and Schaefer 2008). We also know that you don’t need ENSO to get a lot of tornadoes—a year when ENSO is neutral sees on average around 1,200 tornadoes across the United States, with the majority occurring in the March to June window.
In the past decade, we’ve made great advances in understanding what causes this year-to-year variability (2), thanks to extended computer simulations of past events, new high-quality datasets that can tell us about the favorable conditions for tornado development, and the development of longer records of tornado observations. Through this, we’ve been able to show that, generally, El Niño leads to fewer tornado events in the spring, while La Niña tends toward higher-than-normal frequency.
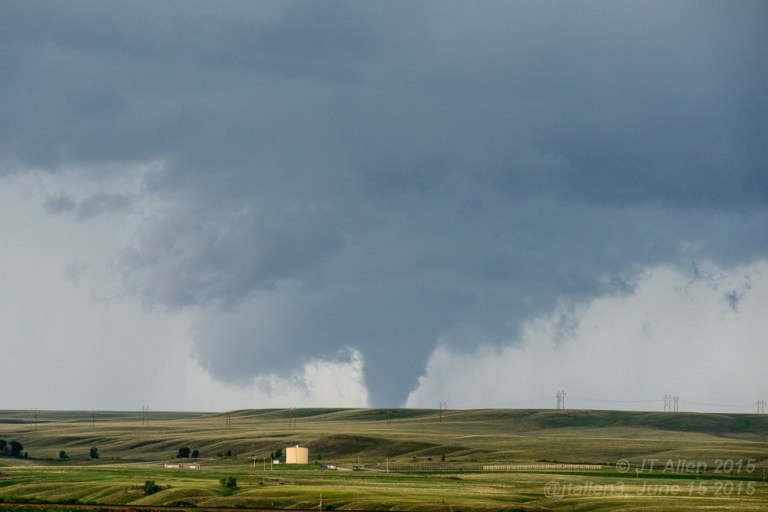
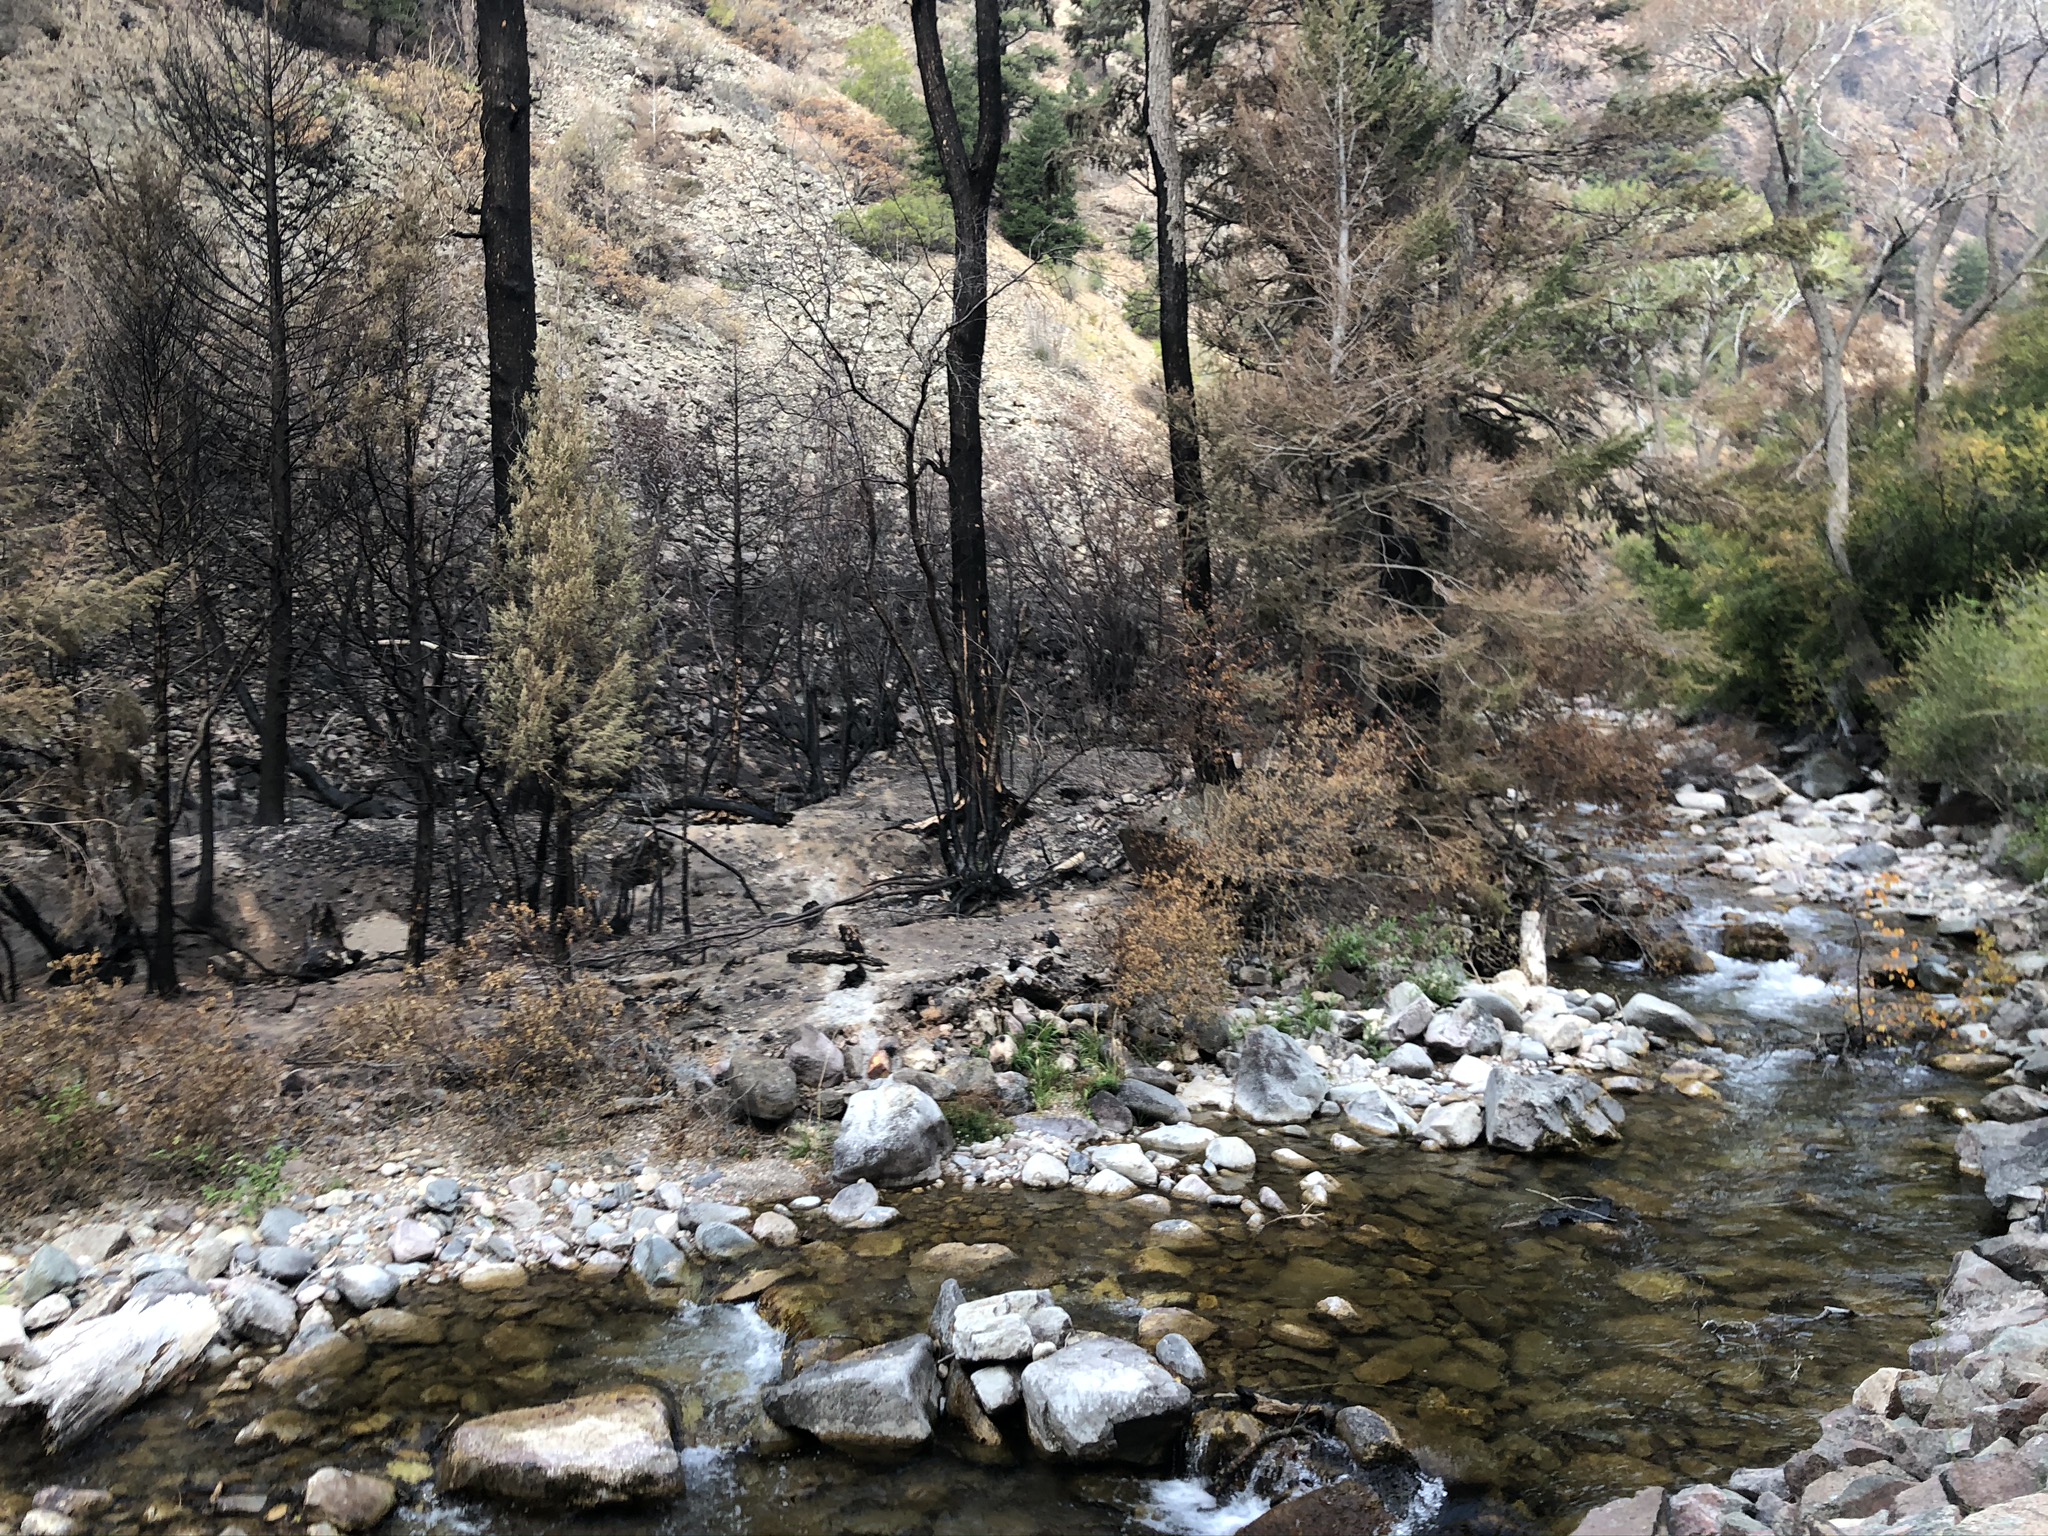
Photo by John Allen via NOAA.
During La Niña, the jet stream that drives much of our weather is somewhat weakened relative to neutral years, and the mid-latitude branch is diverted northward toward the Arctic over the western or central Pacific, and southward over northwestern North America. (Visit this post for details on how La Niña changes the jet stream.) This split path typically favors low-pressure systems developing east of the Rockies (Allen et al. 2015, Cook et al. 2017). It is this weather-climate “teleconnection” that most readily connects ENSO to tornado occurrence. The frequency of these low-pressure systems turns out to be key for bringing all the pieces together to produce tornado outbreaks, including wind shear (3), the fronts that initiate storms (Lagerquist et al. 2020), the moisture transport and the mid-level atmospheric instability that strengthen storms (Muñoz and Enfield 2011)
March-May values of a blend of tornado reports with a tornado environment index (TEI) for El Nino and La Nina years. Maps by climate.gov; data from C. Lepore and M. Tippett.
La Niña certainly does not always increase tornado likelihood. For example, a similar magnitude La Niña in 1989 was accompanied by a similar near- to below-average tornado season to 2021 so far. Like all climate influences on the weather scale, you can think of La Niña weighting the dice in favor tornado events, while on the flipside El Niño reduces the overall likelihood. In any one case, however, the specific atmospheric pattern on shorter timescales plays an important role (4).
Tornadoes in 2021
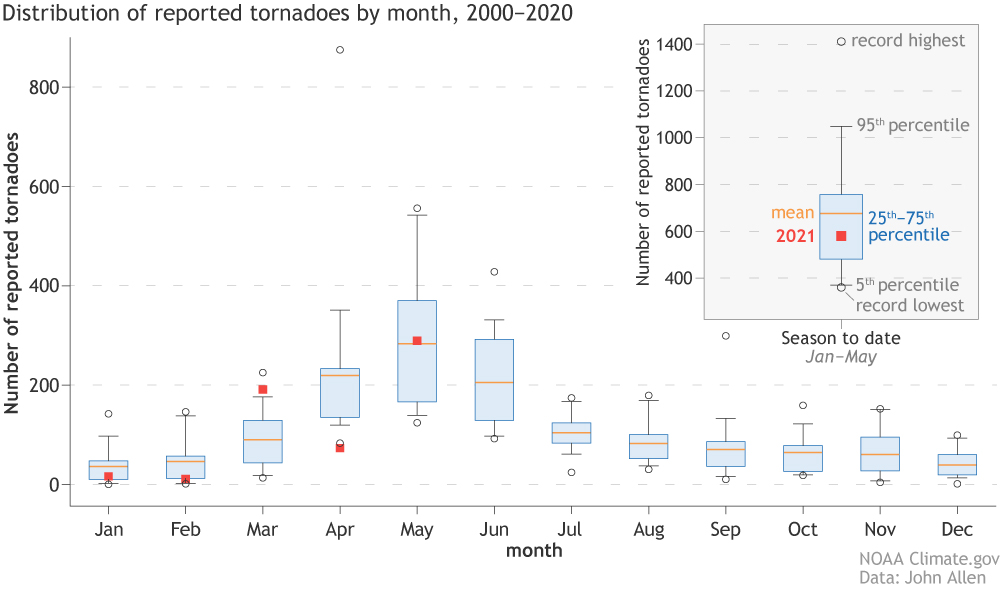
Tornado activity—and, more broadly, severe thunderstorm activity—for 2021 has been lower than average after a somewhat late start (5). Both January and February are fickle months for tornado frequency, so a slow start doesn’t tell us much about the season to come. Considering tornado frequency against the historical record of the last 2 decades, March 2021 was an outlier and considerably above average, April 2021 was equally a below-average outlier, and May 2021 was near average.
5th-95th percentile box-and-whisker distributions of Storm Prediction Center monthly tornado reports for the period 2000-2020 as compared to the value for 2021 (red square). Orange horizontal line corresponds to the dataset mean. Outliers are indicated by the unfilled circles. Inset: January 1 to May 31 2021 season-to-date comparison. Climate.gov figure based on original from John Allen. Correction 7/1/21: The original version of this graphic mislabeled the range of values shown by the blue boxes. The boxes show values in the 25th-75th percentile, not the 5th-95th percentile.
Despite being relatively quiet, for the season to date there was a preliminary total of 580 tornadoes reported through May 31st, less than the 2000–2020 average of 676.These events caused 13 fatalities. Also, despite the below-average tornado count in April, there were still some significant financial losses from severe weather. These resulted from hail events impacting major urban centers, and for 2021 the US is again on track to exceed $10 billion insured losses to severe storms.
The vast majority of tornadoes in 2021 accumulated over just a few days in March and one particularly active period in May. This is fairly typical, as tornado outbreaks—clusters of tornadoes—and consecutive days with tornadoes are certainly not unusual (Tippett et al. 2016, Trapp 2014). March saw tornadoes on 16 days, with concentrated periods on March 13th, 17th, and the 25th–27th. April had no real large accumulation of tornadoes on any single day, while May had tornadoes on all but 5 days, with large events between the 2nd to the 4th and on the 26th, and 18 days in June with no widespread events and low numbers of tornado reports (6).
The most recent story to grab the headlines has been the surprise that, through the middle of June 2021, we did not record an EF3 tornado for the first time since reliable records began in the 1950s (though this changed on June 20th). However, this is somewhat unsurprising, as without the volume of higher tornado frequency days, the probability of stronger tornadoes is also lower. This statistic can also be misleading – tornado damage is only rated if the tornado hits a structure well-built enough to withstand it. With shorter tornado path lengths, and fewer tornadoes, the likelihood of a storm crossing paths with structures or other damage indicators decreases. This is further compounded by tornadoes rarely occurring in their usual regions where damage is more likely.
Photo by John Allen via NOAA.
Putting it All Together: La Niña 2020–21
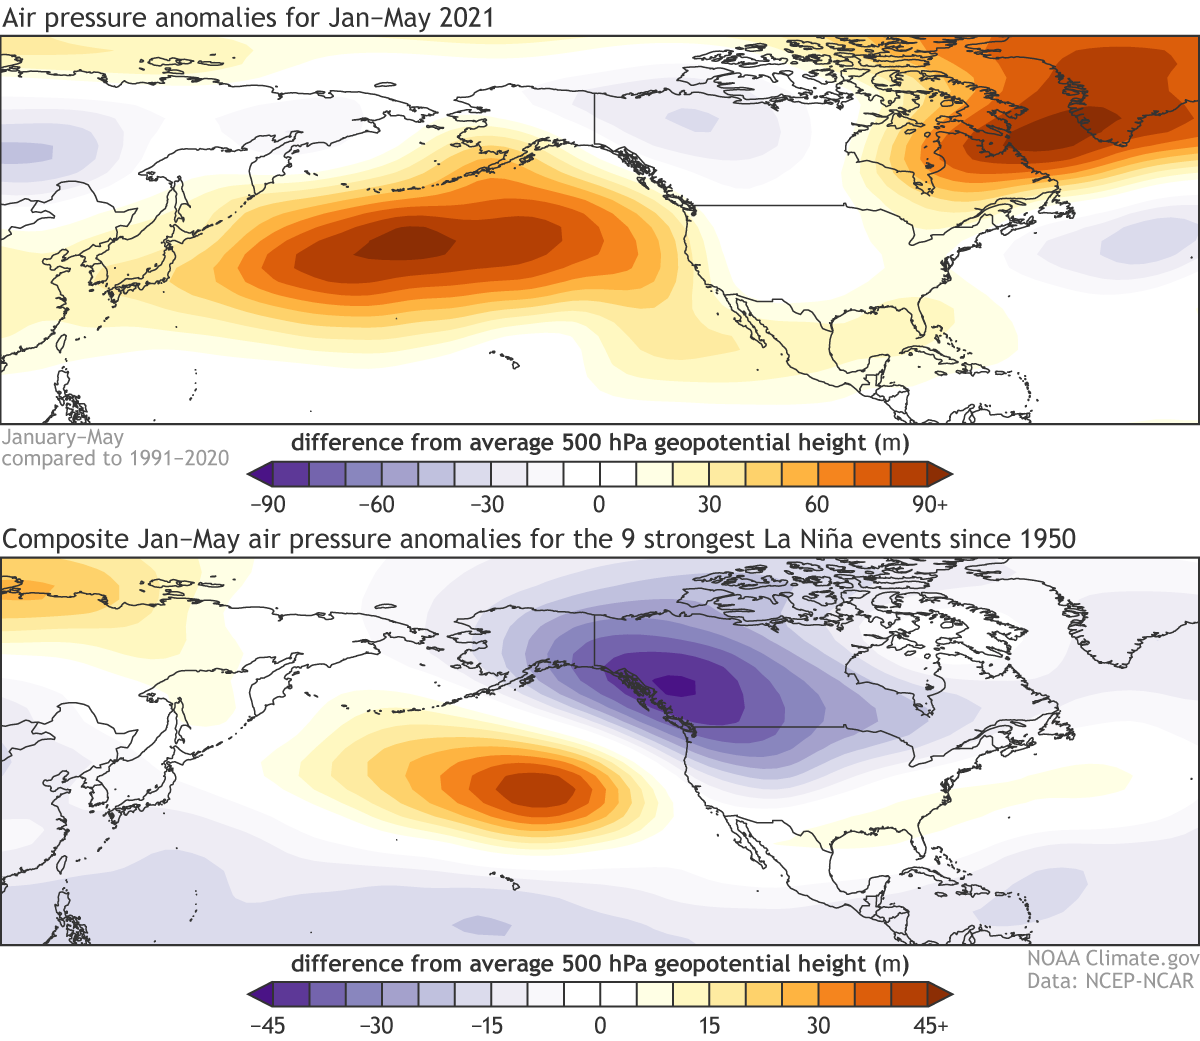
There has already been discussion this year about 2021 being “atmospherically” strange for a La Niña. While NOAA’s primary metric for ENSO, the three-month-average sea surface temperature anomaly in the Niño-3.4 region of the tropical Pacific (Oceanic Niño Index), suggested a moderate La Niña in terms of sea surface temperatures through the winter and early spring before waning into May, the circulation over North America didn’t seem to be playing the same tune. Nowhere is this more evident than considering the air pressure patterns as compared to historical La Niña events.
(Top) Geopotential height anomalies (m) at the 500 hectopascal (hPa) pressure level during January–May 2021. Cold colors indicate below-average atmospheric pressure and warm colors indicate above-average atmospheric pressure at a level about three miles above the Earth’s surface. (Bottom) The average 500 hPa geopotential height anomalies from January–May for the 9 strongest La Niña episodes since 1950. Note the different scaling between the top and bottom figures. The top figure has a wider range of values because the top figure includes contributions from both predictable signals, like La Niña, and random weather variability, whereas the bottom figure has filtered out most of the random weather variability. Anomalies are calculated with respect to the 1991-2020 base period. Figure by John Allen and NOAA Climate.gov with NCEP/NCAR Reanalysis data obtained from the NOAA Physical Sciences Laboratory.
The eastern Pacific high-pressure signature typical of La Niña was present, but this year was considerably stronger and broader across the north Pacific, while the low-pressure region over the northwestern United States was much weaker. Stronger surface highs over the eastern Pacific reflected the blocking of the typical flow pattern, and lack of troughing saw fewer low-pressure systems than average form east of the Rockies, with significant implications for precipitation and severe weather frequency over the Plains and Midwest.
This is not to say we didn’t get some smaller tornado outbreaks, such as those in late March and early May, but overall the spring and early summer were less favorable for producing these important low-pressure systems, and hence tornadoes.
The un-La Niña-ish atmosphere over North America meant that suggesting that the spring tornado season would be active was fraught with danger! Nonetheless, some of the calling cards of La Niña did persist from the winter months; for example, persistent dry conditions across the southwest since last fall. The challenge here is that it is nearly impossible to attribute tornado variability solely to the contributions of ENSO. As has been discussed on the ENSO Blog before, ENSO is very much like the violin section of an orchestra—it leads the movement of variability in our atmosphere. But what would a symphony by Beethoven or Mozart sound like without punctuation from other sections of the orchestra, both on shorter intervals and helping drive the overall piece?
Photo by John Allen via NOAA.
The tornado season of 2021 might be past its peak, but we certainly aren’t out of the woods just yet. However, the difference between expectation (higher than normal) and observations (lower than normal) thus far highlights the need to further explore the details of what drives variability in tornado frequency. Open questions also remain about how long ENSO’s influence persists into the spring months and how robust its influence on the atmosphere is, factors that may have played a role in this season’s evolution. It also suggests that greater caution is needed to understand the other processes at play before suggesting any given La Niña year will be the next 2011–as 1989 showed us prior to 2021, not all La Niña events favor such extreme generational outliers.
Lead Editor: Emily Becker
Footnotes
1) Tornado season is not easily defined, as tornadoes can occur on any day of the year. Despite this challenge, the vast majority of tornadoes occur between the beginning of March and the end of June each year, with ~1000 of the 1400 per year on average (averaged over 2005–2015) occurring between this period. Tornado season also varies by location. In the southeastern United States, tornado season is typically between February and April. In the central Great Plains, the peak is closer to April to June, and in the Midwest and close to the Rockies May through the end of June are typically the peak months. By July, the majority of tornado activity has shifted north to Canada.
2) Some recent studies include Lee et al. 2013, Allen et al. 2015, Cook et al. 2017, Lepore et al. 2017, Molina et al. 2018, and Lee et al. 2021.
3) Wind shear is the presence a degree of changing wind speed and direction at different levels of the atmosphere. The easiest way to see wind shear is by looking up at the clouds – if you see clouds moving in different directions, that is wind shear. Wind shear is important to the storms that produce tornadoes, it helps the organize the storms shape, move rain away from the updraft, and allows a storm to sustain itself outside the normal lifetime of a thunderstorm to several hours. Developing tornadoes also require the presence of changing wind speed and direction with height close to the ground, as the presence of shear generates ‘spin’ that can be stretched upwards to form the tornado.
4) The trouble with understanding tornado variability is that it’s affected by both small-scale and large-scale processes. Non-ENSO contributors to tornado variability identified so far include the Arctic Oscillation, North Atlantic Oscillation, Madden-Julian Oscillation, Global Wind Oscillation, and sea surface temperatures in the Gulf of Mexico (Molina et al. 2018). Each of these signals can project upon ENSO in either a constructive or destructive manner such that it can be very difficult to tease out which element was responsible for any sub-seasonal period of activity, and these interplays are generally poorly understood. That these influences can range from sub-seasonal scales of weeks to months can mean the difference between an overall active season and an inactive one can be dependent on the smallest of margins.
Adding to the challenge is that tornadoes are rather temperamental about the conditions they form in and difficult to predict on short timescales, making them a challenging seasonal forecast target. Too warm and tornadoes become less frequent, too dry and the same result is likely. Even in a “perfect” environment where violent tornadoes seem certain, timing is everything, and small differences as to the arrival of an individual trough impulse, or a slightly warmer-than-expected layer in the atmosphere can mean no storms form at all. This was exemplified in the predicted violent tornado outbreak that failed to realize on May 20, 2019.
5) A severe thunderstorm is defined as any convective storm that produces one or more of hail of 1 inch or large in diameter, storm induced winds of 58 mph or greater, or a tornado.
6) Long periods of relative quiet are more in line with La Niña conditions. For example, after more than 800 tornadoes in April 2011, May saw little to no activity before the 21st, before producing 241 tornadoes in the following 5 days. While these periods of relatively low frequency occur in most years, this pattern is particularly prevalent during La Niña, as is a tornado season that is skewed toward occurring earlier in the spring (Allen et al. 2018).
References
Allen, J.T., Molina, M.J. and Gensini, V.A., 2018. Modulation of annual cycle of tornadoes by El Niño–Southern Oscillation. Geophysical Research Letters, 45(11), pp.5708-5717.Cook, A.R. and Schaefer, J.T., 2008. The relation of El Niño–Southern Oscillation (ENSO) to winter tornado outbreaks. Monthly Weather Review, 136(8), pp.3121-3137.
Cook, A.R., Leslie, L.M., Parsons, D.B. and Schaefer, J.T., 2017. The impact of El Niño–Southern Oscillation (ENSO) on winter and early spring US tornado outbreaks. Journal of Applied Meteorology and Climatology, 56(9), pp.2455-2478.
Lagerquist, R., Allen, J.T. and McGovern, A., 2020. Climatology and Variability of Warm and Cold Fronts over North America from 1979 to 2018. Journal of Climate, 33(15), pp.6531-6554.
Lepore, C., Tippett, M.K. and Allen, J.T., 2017. ENSO‐based probabilistic forecasts of March–May US tornado and hail activity. Geophysical Research Letters, 44(17), pp.9093-9101.
Lee, S.K., Atlas, R., Enfield, D., Wang, C. and Liu, H., 2013. Is there an optimal ENSO pattern that enhances large-scale atmospheric processes conducive to tornado outbreaks in the United States?. Journal of Climate, 26(5), pp.1626-1642.
Lee, S.K., Lopez, H., Kim, D., Wittenberg, A.T. and Kumar, A., 2021. A Seasonal Probabilistic Outlook for Tornadoes (SPOTter) in the Contiguous United States Based on the Leading Patterns of Large-Scale Atmospheric Anomalies. Monthly Weather Review, 149(4), pp.901-919.
Marzban, C. and Schaefer, J.T., 2001. The correlation between US tornadoes and Pacific sea surface temperatures. Monthly Weather Review, 129(4), pp.884-895.
Molina, M.J., Allen, J.T. and Gensini, V.A., 2018. The Gulf of Mexico and ENSO influence on subseasonal and seasonal CONUS winter tornado variability. Journal of Applied Meteorology and Climatology, 57(10), pp.2439-2463.
Munoz, E. and Enfield, D., 2011. The boreal spring variability of the Intra-Americas low-level jet and its relation with precipitation and tornadoes in the eastern United States. Climate dynamics, 36(1-2), pp.247-259.
Tippett, M.K., Lepore, C. and Cohen, J.E., 2016. More tornadoes in the most extreme US tornado outbreaks. Science, 354(6318), pp.1419-1423.
Trapp, R.J., 2014. On the significance of multiple consecutive days of tornado activity. Monthly Weather Review, 142(4), pp.1452-1459.
Western governors told top federal officials that it was time to dramatically rework programs to help states recover from wildfires, thin overgrown, drought-ravaged forests, and protect mountain water systems.
Governors representing 17 states gathered last week for the virtual Western Governors’ Association conference, which included sessions on forest health, climate change and broadband initiatives, among other policy concerns.
Because the federal government owns vast swaths of land across the West, expanding shared stewardship programs, building in more flexibility to distribute more cash in new ways, and creating a new “green” timber industry to help thin ailing forests and reduce wildfire risk are all needed quickly, according to Colorado Gov. Jared Polis, who addressed a roundtable meeting with U.S. Secretary of Agriculture Tom Vilsack.
“With the federal government owning a big part of our state, it’s a shared responsibility to address forest health and fire mitigation,” Polis said. “Shared stewardship agreements are a valuable tool. But these need to be reimagined and re-upped given this new normal.”
The Western Governor’s Association represents 19 western states, as well as Guam, American Samoa and the Northern Mariana Islands.
The federal government owns roughly 30 percent of Colorado’s land and even more in other states, such as Idaho and Montana.
Thinning forests and protecting mountain watersheds is an often daunting, cross-boundary exercise between the U.S. Forest Service, the U.S. Bureau of Land Management, and state and local agencies.
Congress has been working on a massive infrastructure bill that has some bipartisan support and which will, if approved later this year, provide millions of dollars in new spending for roads, bridges and rural broadband networks, and may also include new funding to help deal with the devastation from wildfires across the West.
Governors made clear to federal leaders that forest health needs to be included in that definition of infrastructure, in part because of its importance to the West’s water supplies. In Colorado, for instance, approximately 80 percent of the drinking water for all residents flows off of forested watersheds.
“We have to have more treatment and to do that we will need more resources,” said Idaho Gov. Brad Little. “Hopefully we can get Congress to understand that as they are working on infrastructure [funding] for bridges and roads, we need to invest in our forests as well.”
Vilsack told governors he was hopeful that the new infrastructure bill as well as other federal legislation, such as the Great American Outdoors Act, would deliver funding and new programs that would help the West cope with a warming climate, water shortages and more frequent wildfires.
“We’re aware of the fire issue and we know the importance of having additional money on the treatment side, as well as ways to create more markets for the wood we produce [when forests are thinned],” Vilsack said.
“But I see a lot of opportunity, especially if we innovate and create voluntary programs and encourage people to take advantage of the income crops that are going to be created,” Vilsack said.
Jerd Smith is editor of Fresh Water News. She can be reached at 720-398-6474, via email at jerd@wateredco.org or @jerd_smith.
The Snake River Water District is planning ahead for increasing water needs in the Keystone area due to population growth over the past decade.
District Executive Director Scott Price said in a statement that the district recently created a water system master plan looking into emerging challenges in the next 10 years. The plan includes a prioritized list of short- and long-term projects.
According to the plan, the district needs to invest $38.5 million over the next decade to address trouble areas, update the old water treatment plant and add a new pump station and storage tank. The district is currently seeking grants and loans to help fund the improvements. It is also evaluating user rates that have remained unchanged for the past eight years.
The district will hold public meetings with key stakeholders to discuss the financial plans. There will be two public meetings July 22, including a 1 p.m. livestream on the district’s Facebook page and an in-person meeting at 6:30 p.m. at the district’s office in Keystone, 0050 Oro Grande Drive.