As things stand with the El Niño-Southern Oscillation (ENSO), neutral conditions are currently present in the tropical Pacific and favored to last through the North American summer and into the fall. But forecasters at NOAA’s Climate Prediction Center have issued a La Niña Watch, which means they see La Niña likely emerging (~55%) during the September-November period and lasting through winter.
June 2021 sea surface temperature departure from the 1991-2020 average. Image from Data Snapshots on Climate.gov.
Where we are:
I know you’re all excited for me to talk about La Niña, but I’m a killjoy, so bear with me for a second while I talk about the current state of the Pacific. In June, ocean surface temperatures were near the 1991-2020 average across the equatorial Pacific, including the all-important Nino3.4 region (check out this post for more on ENSO indices), which we use to monitor the state of ENSO. Specifically, the June sea surface temperature in the Nino3.4 region was 0.25 degrees Celsius below average, well within the ENSO-neutral range. Ocean temperatures in this region have been quickly returning to near-average conditions over the last several months, increasing by nearly half a degree Celsius since April and over a degree Celsius since last winter’s La Niña peak.
But as we have said, so many, many times: there is more to ENSO than just the surface of the ocean. Putting on our snorkels, let’s dive beneath the surface of the Pacific, where things aren’t as near average but still firmly indicative of an ENSO stuck in neutral. Waters were slightly warmer than average, except for the eastern Pacific where cooler-than-average waters developed near the thermocline—the layer of water that marks the transition between the warmer upper ocean and colder deeper ocean. But overall, nothing to write home about.
To finish off this trilogy of signs about our current ENSO-neutral Pacific, we look to the skies! After all, ENSO is a coupled atmosphere/ocean climate phenomenon. And for the past month, that atmosphere has been pretty darn neutral. Winds at both low and high levels of the atmosphere were pretty normal, and while thunderstorm activity was reduced near the dateline, things were mostly average elsewhere.
There hasn’t been a more boring trilogy since Star Wars episodes 1-3 (yeah…I said it). But then again, that’s expected during neutral ENSO conditions across the Pacific.
The official CPC/IRI ENSO probability forecast, based on a consensus of CPC and IRI forecasters. It is updated during the first half of the month, in association with the official CPC/IRI ENSO Diagnostic Discussion. It is based on observational and predictive information from early in the month and from the previous month. Image from IRI
Where we’re going:
It might seem odd, then, with things seeming so… blah… that a La Niña Watch has been issued. To clarify, a La Niña Watch means conditions are favorable for the development of La Niña within the next six months. So, what’s in the climate model “tea leaves” that has helped scientists feel comfortable enough to start throwing the La Niña label around?
The answer, in part, lies in a strong computer model consensus. While most of the models we look at predict ENSO-neutral to continue to last through fall, many models from the North American Multi-Model Ensemble (NMME) favor a transition to La Niña during the fall and into winter. The NMME is incredibly helpful to forecasters in predicting the future state of ENSO, especially when we are past the notorious spring barrier, a time when model accuracy wanes.
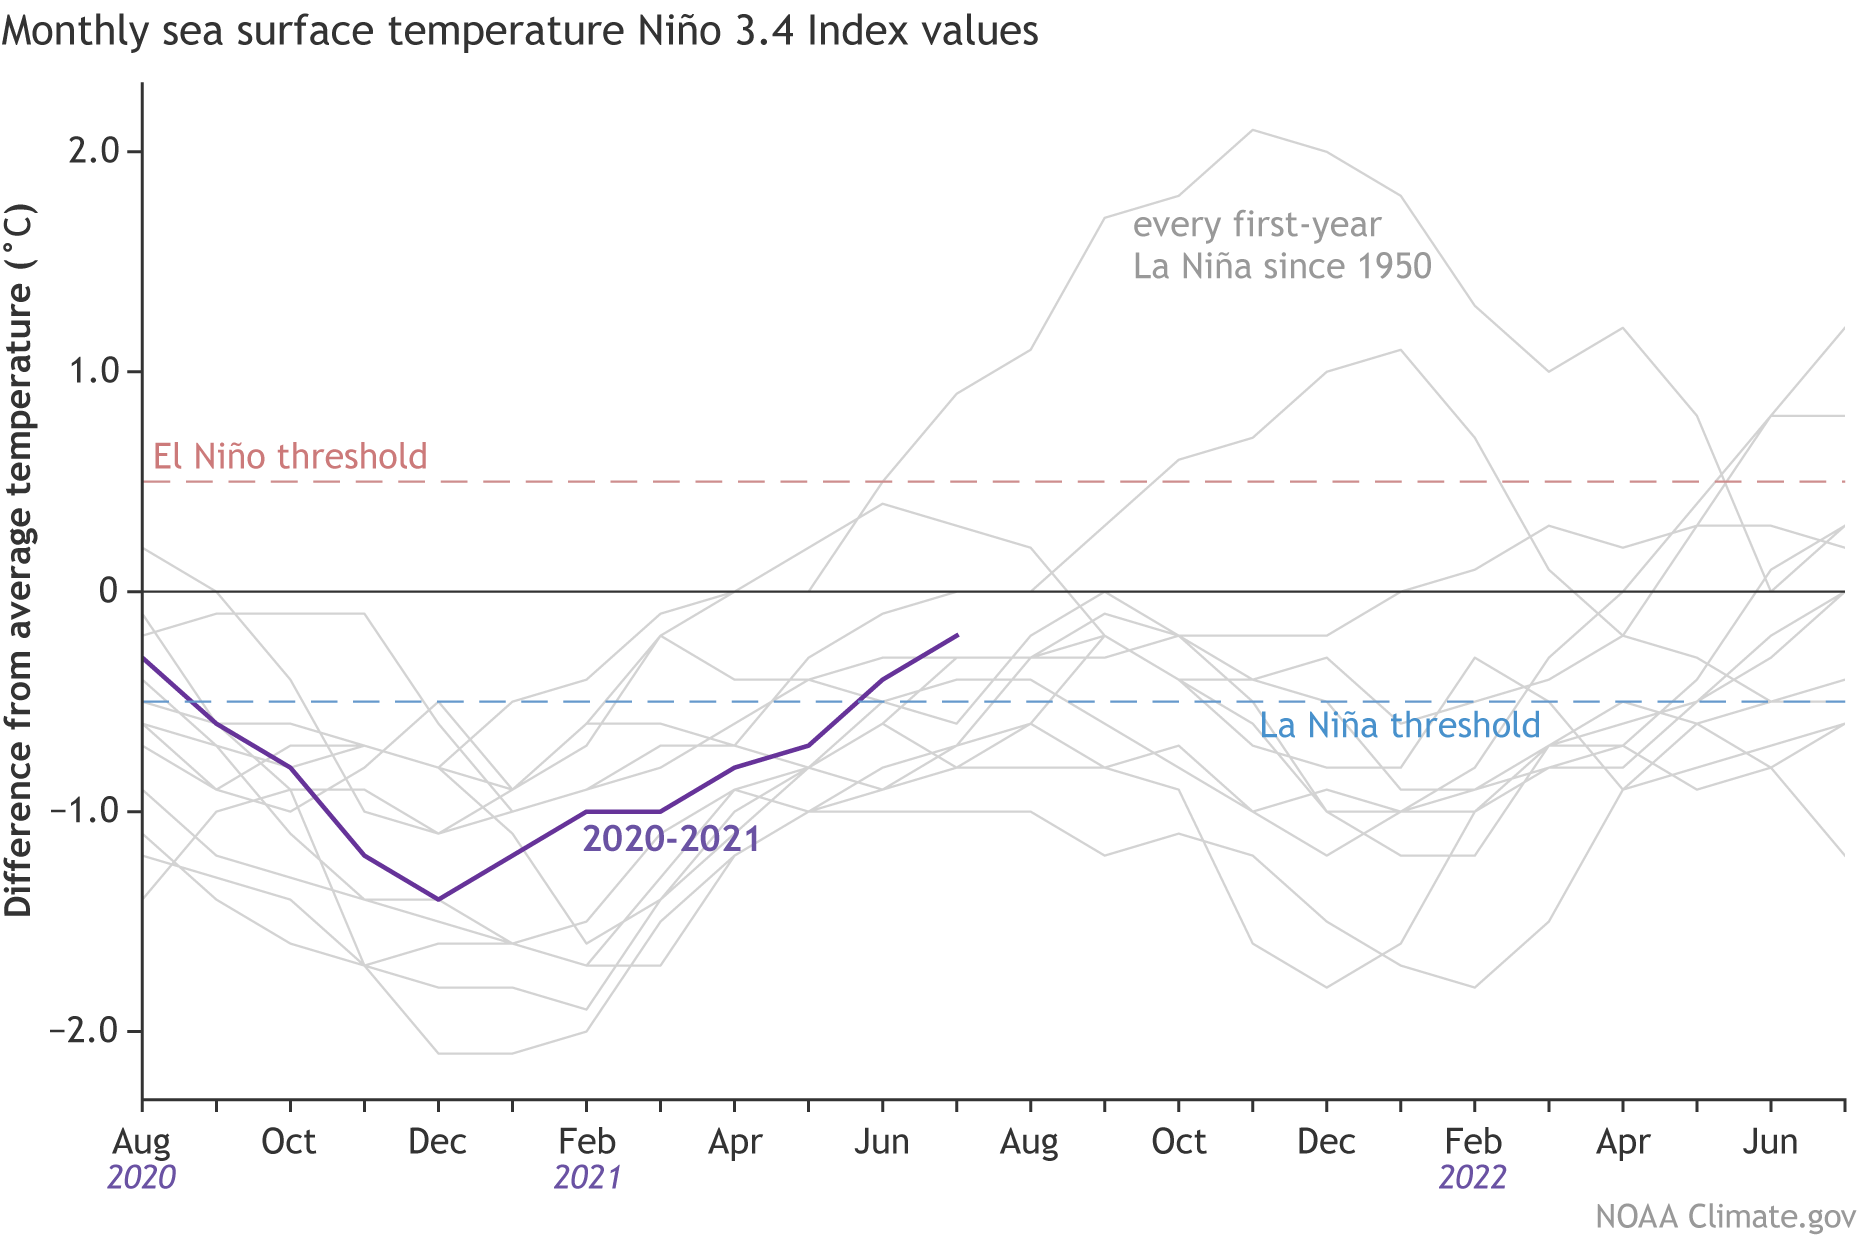
Monthly sea surface temperature anomalies (difference from average) in the Niño 3.4 region of the tropical Pacific for 2020-21 (purple line) and all other years starting from first-year La Niña winters since 1950. Climate.gov graph based on ERSSTv5 temperature data.
Where’s the beef?
Is it all that unusual to have two La Niña winters back-to-back? Nope! In fact, of the twelve first-year La Niña events, eight (!) were followed by La Niña the next winter, two by neutral, and two by El Niño. Honestly, with those numbers, it would have been more surprising if we thought neutral conditions would continue all year.
Putting all of those 12 first-year La Niñas together with 2020-2021, it’s evident how much this last year doesn’t stand out. Though, twelve past cases are not a ton to rely on by itself. This La Niña Watch is buoyed by much more than that.
One specific reason why and when any change to ENSO is important is the potential influence on the Atlantic and eastern Pacific hurricane season. As noted on the ENSO Blog in the past, La Niña can help make atmospheric conditions more conducive for tropical cyclones to form the Atlantic, and less conducive in the Eastern Pacific. If 2021 so far is any indicator, it could be an active year: through the beginning of July, five named storms in the Atlantic have already formed, a new record—breaking the previous record set just last year. In August, the Climate Prediction Center will issue an updated hurricane outlook, so stay tuned for more info on that. In the meantime, you can read the outlook from May to see what scientists were thinking two months ago.
FromE&E News (Thomas Frank) via Scientific American:
The extreme dry conditions threaten crops and raise wildfire risks
The western United States is experiencing its worst drought this century, threatening to kill crops, spark wildfires and harm public health as hot and dry conditions are expected to continue this month.
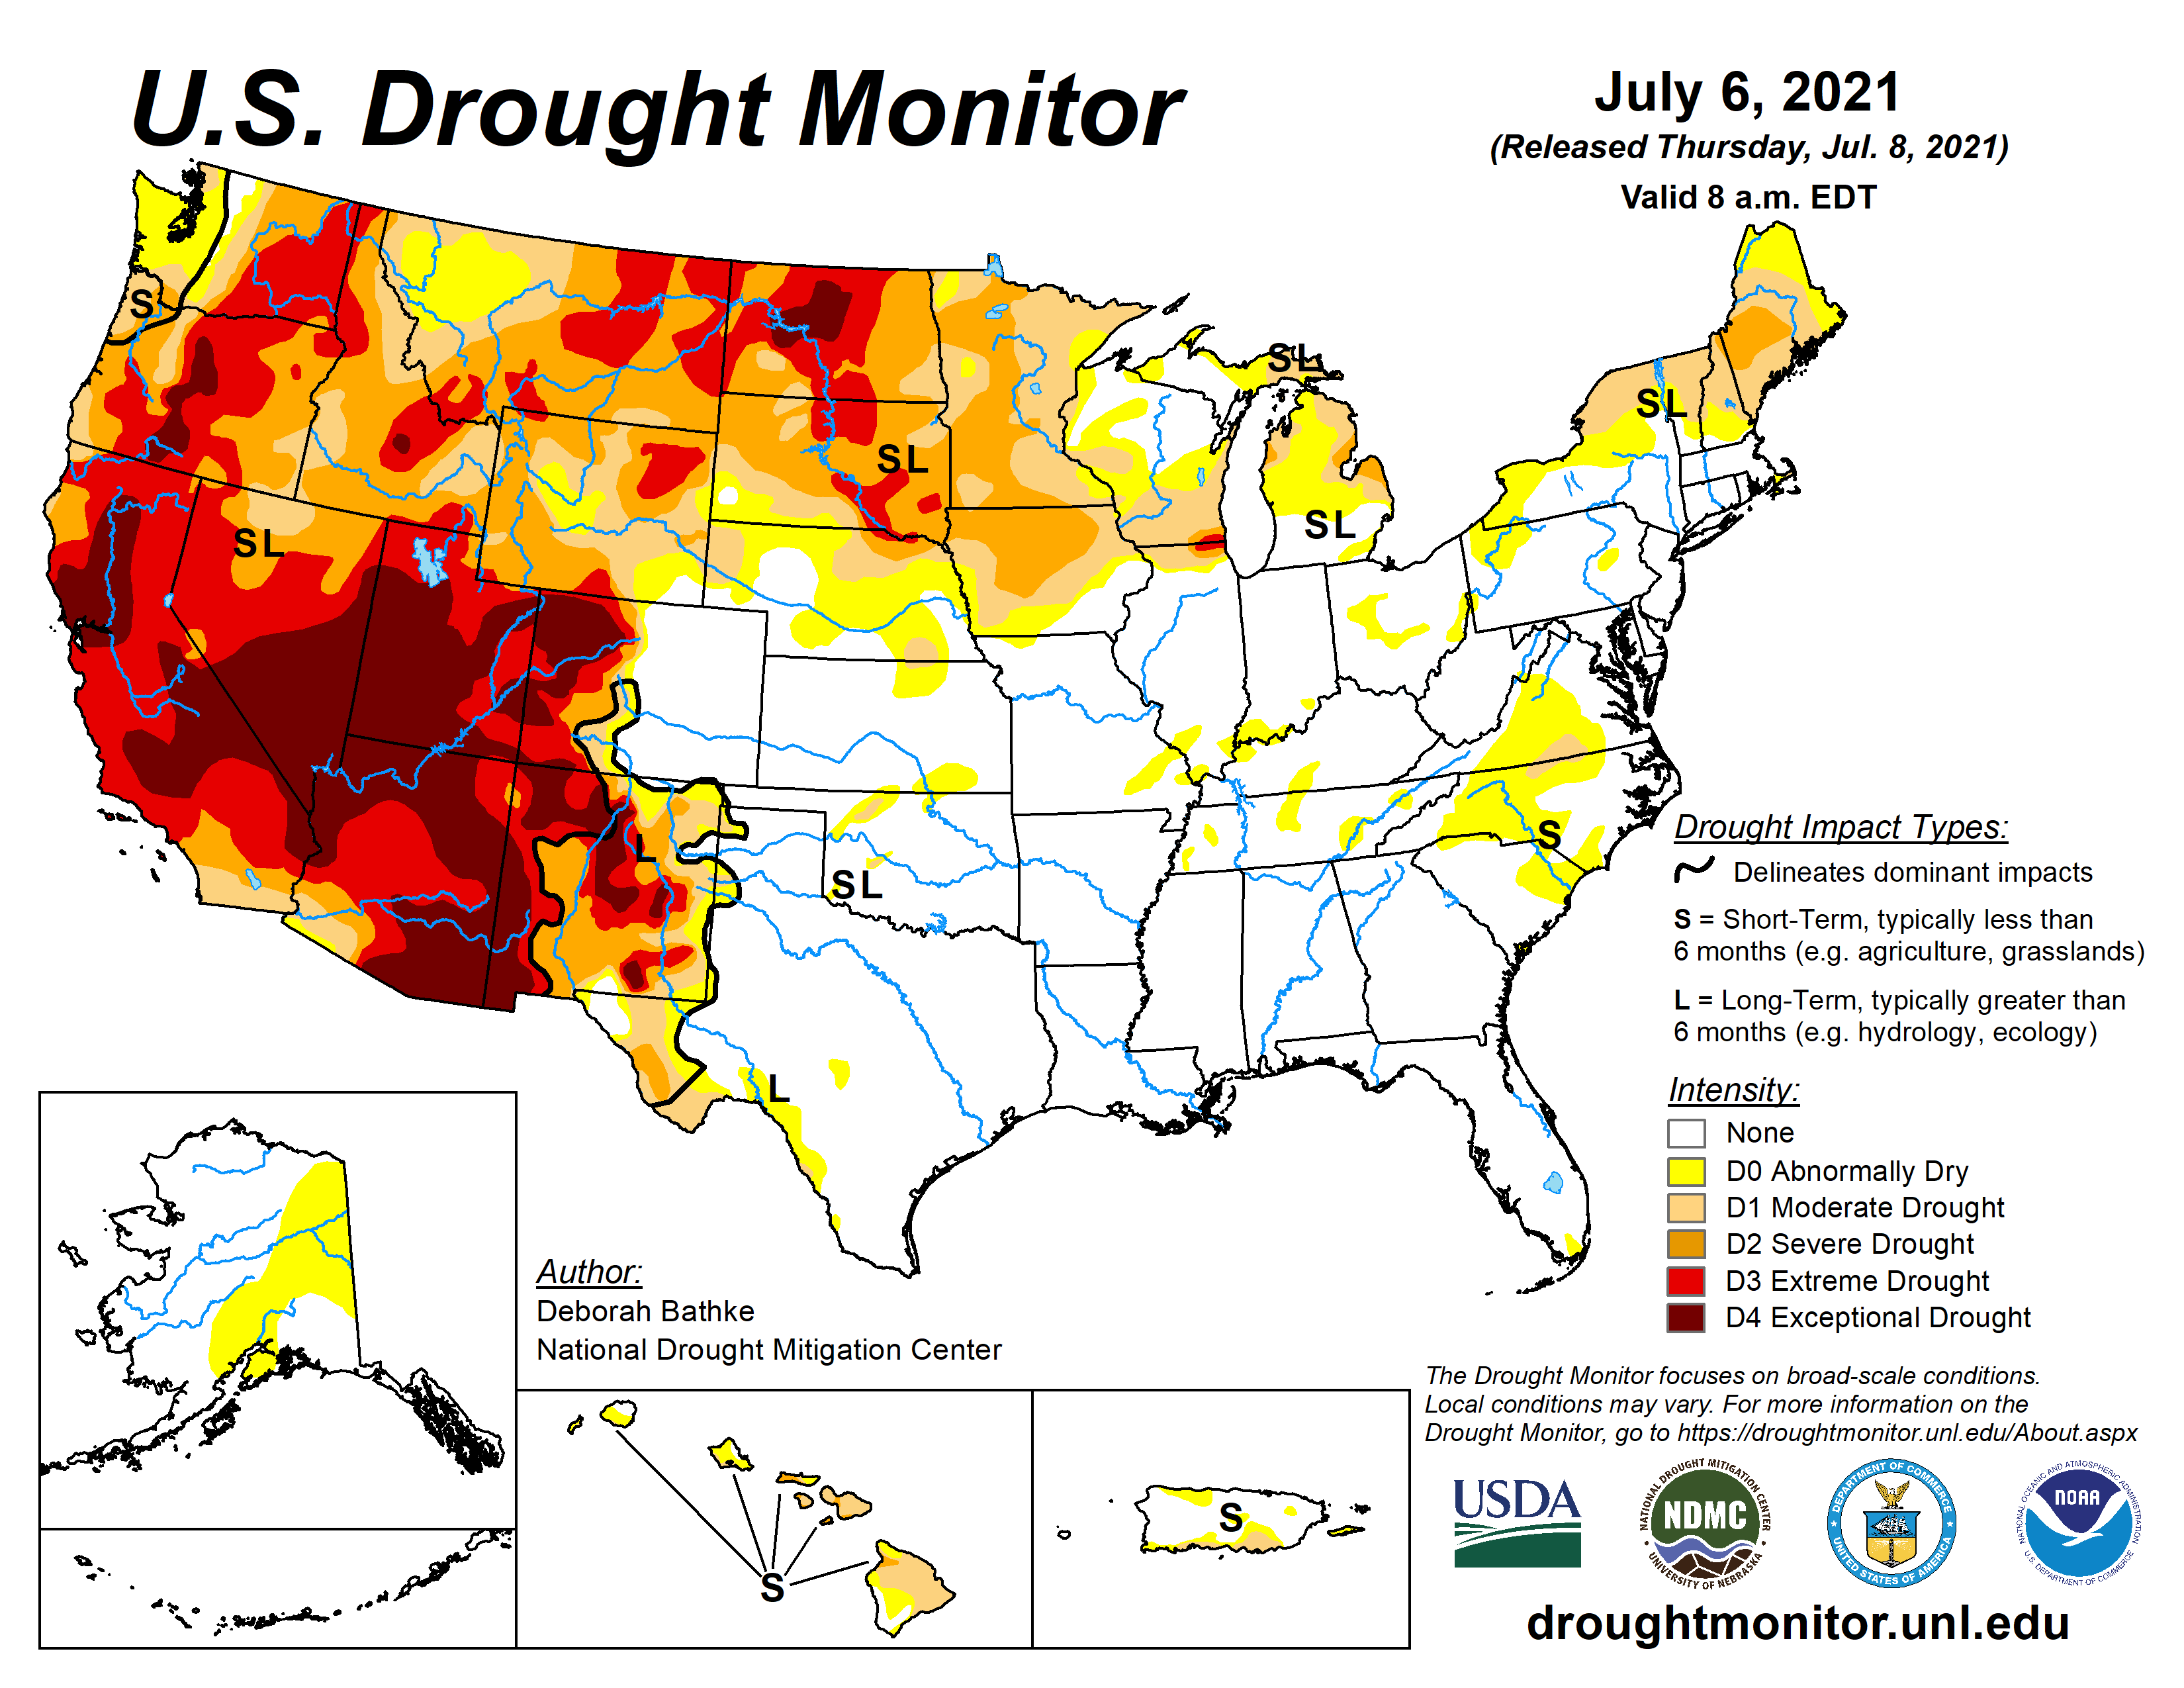
More than 93% of the land in seven Western states is in drought conditions, and nearly 59% of the area is experiencing extreme or exceptional drought—the two worst conditions—according to the latest figures released by the U.S. Drought Monitor.
Both figures are the highest this century for the area that covers all of Arizona, California, Idaho, Montana, Oregon, Washington and most of Utah.
Before this year, the record for the amount of Western land in extreme or exceptional drought was 43%, set in September 2003.
The conditions have led to fire and fishing restrictions across the West and have prompted wildfire alerts. The National Interagency Fire Center is warning that the intensifying drought across the West is creating significant wildfire risk over the next three months from California to the Northwest and across the northern Plains…
US Drought Monitor map July 6, 2021.
Agriculture Department reports show that several crops, including wheat, sunflowers and barley, are threatened by the extensive drought, which is concentrated in the West but is also affecting areas as far east as the Dakotas, Minnesota and Iowa…
Although drought conditions have been exacerbated by recent record temperatures in the West, Kluck said the current drought has been developing since the spring of 2020.
Colorado’s Congressional delegation moves legislation to help address climate crisis
The news about the climate crisis is bleak. The summer started with most of the nation gripped by heat waves smashing records across the continent. Once again the hurricane season is off to a historic start with the earliest fifth-named tropical storm. Last year was the worst fire season that the U.S. West has seen in decades, if not hundreds of years, and this year is likely to be at least as bad. Major rivers are drying up.
We are in a climate emergency and western Colorado is square in the cross-hairs. The alarm is sounding: We must act now, in an urgent and unprecedented manner.
he Gunnison Basin is facing a climate emergency, putting our farm and food systems at severe risk. This map shows the warming that has already occurred in this Gunnison watershed since 1895. It is from our upcoming report on climate change in the region and some steps to take to avert worsening harm. Graphic credit: The Washington Post via the Colorado Farm & Food Alliance
Climate action, generally speaking, needs to do three things to reverse a descent into even greater ecological and social calamity. Importantly, we cannot trade one for the other, which is a bait and switch tactic some industry boosters are now pushing. We need an “all of the above” climate plan (to borrow a favored fossil fuel phrase). We cannot get by pretending, as the erstwhile denialists cum begrudging believers ask us to do, that some new fix will allow business to continue as usual. Instead, we must transform our practices and businesses to meet the needs of this moment.
We need to act, across all sectors, to:
Curb climate pollution.
Keep and return carbon in (to) the ground.
Adapt human systems to be climate-smart and restorative.
These necessary goals are both daunting and full of opportunity. They point to big and rapid change. But each also has the potential to inspire all manner of innovative technology, entrepreneurship, and solutions. So we cannot wait to get started. First we must stop adding to the problem.
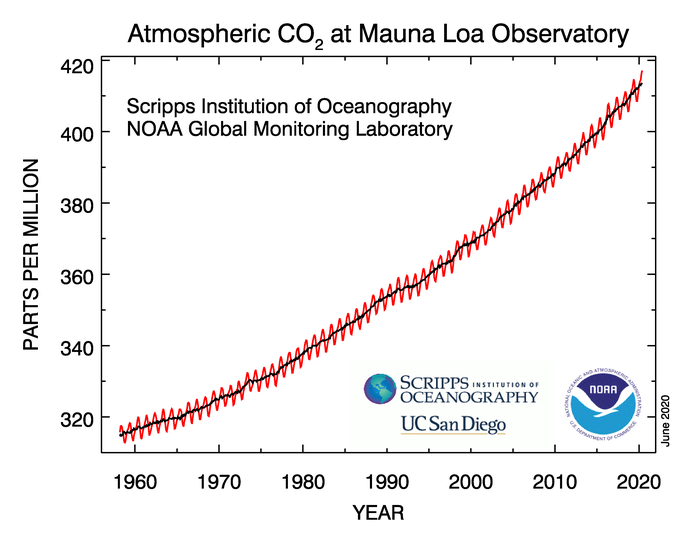
The carbon dioxide data on Mauna Loa constitute the longest record of direct measurements of carbon dioxide in the atmosphere. C. David Keeling of the Scripps Institution of Oceanography began measurements in 1958 at the NOAA weather station. NOAA started its own CO2 measurements in May of 1974, and they have run in parallel with those made by Scripps since then. Credit: NOAA and Scripps Institution of Oceanography.
This year atmospheric concentrations of carbon dioxide have reached toward 420 ppm. Many places are already experiencing heating above the 1.5 degree threshold we are to avoid, as set by international accord. Ice caps, permafrost and glaciers are melting, sea levels rising, biological diversity collapsing: the ecological systems that have long allowed human civilization to flourish are in severe crisis. There is no time to paper over or “both sides” the situation we are in: If we do not act boldly and quickly, our livelihoods, our businesses, and our ability to prosper in the U.S. Southwest are all at severe risk.
The action required is monumental and we should not shy from declaring it as such. And just acknowledging that and reversing course can signal a shift in momentum. But the effort needs to accelerate if we are to avoid even more damaging heating ahead.
We cannot claim to be moving forward if for every small step ahead we continue to take several back. Fortunately in Colorado we do have elected leaders who are at least taking these first steps. So we want to acknowledge these action and encourage more that must follow. And we should stay on guard for back-sliding or double-speak.
Colorado Congressional Leaders Take Action
The Grand Junction Sentinel reported, in a June 23rd article by reporter Dennis Webb that “U.S. Sen. Michael Bennet, D-Colo., is again pushing for passage of bills that would boost funding for cleanup of abandoned, or orphaned, oil and gas wells on federal lands and boost the opportunities for public comment when federal oil and gas lease sales are proposed.”
And last week, President Biden signed a law limiting methane pollution from oil and gas on public lands, a bill sponsored by Colorado congresswoman Diana DeGette. CNN reported: “President Joe Biden on Wednesday signed a bill repealing a Trump-era rule that rolled back regulations on methane emissions — a particularly potent greenhouse gas believed to contribute significantly to the climate crisis — from the oil and gas industries. The President described the bill as an “important first step” to cut methane pollution and said it “reflects a return to common sense and commitment to the common good.”
We applaud these steps. But it must be just the start of an “all of the above” approach to climate action if we are to avert worsening catastrophe. And we must make sure that we are not making the problems worse. Our priorities for public lands should be on conservation and restoration. We should limit the further expansion of fossil fuel development.
The first bill introduced by Sen. Bennet would increase bonding and clean-up requirements for oil and gas on public lands. This may seem minor, but is a critically important fix to a badly broken system. Our public lands fossil fuel leasing and development programs have long put the interests of corporations ahead of both the health of the lands and the interests of the public — and the public ends up paying for it, time and again.
The second piece of legislation from Sen. Bennet improves public oversight and community involvement processes around the oil and gas programs. This too is a small, but vitally important, step. It would begin to re-center community concerns–including the need to address the climate crisis– in public lands management. For too long the scales have been tipped toward the oil and gas industry.
That is why the Colorado Farm & Food Alliance recently issued a statement in support of Senator Bennet’s bills which would start to re-balance the scales in favor of the public, toward greater accountability, and in favor of resource protection.
The climate emergency is real and brings grave risk and an urgent need for action. We must move quickly away from fossil fuels. An obvious place to start is with our public lands, which provide so much from water sources, to critical wildlife lands and popular recreation areas. We have an opportunity to to rethink the purpose of these cherished lands and to model the leadership needed to take the climate crisis head on.
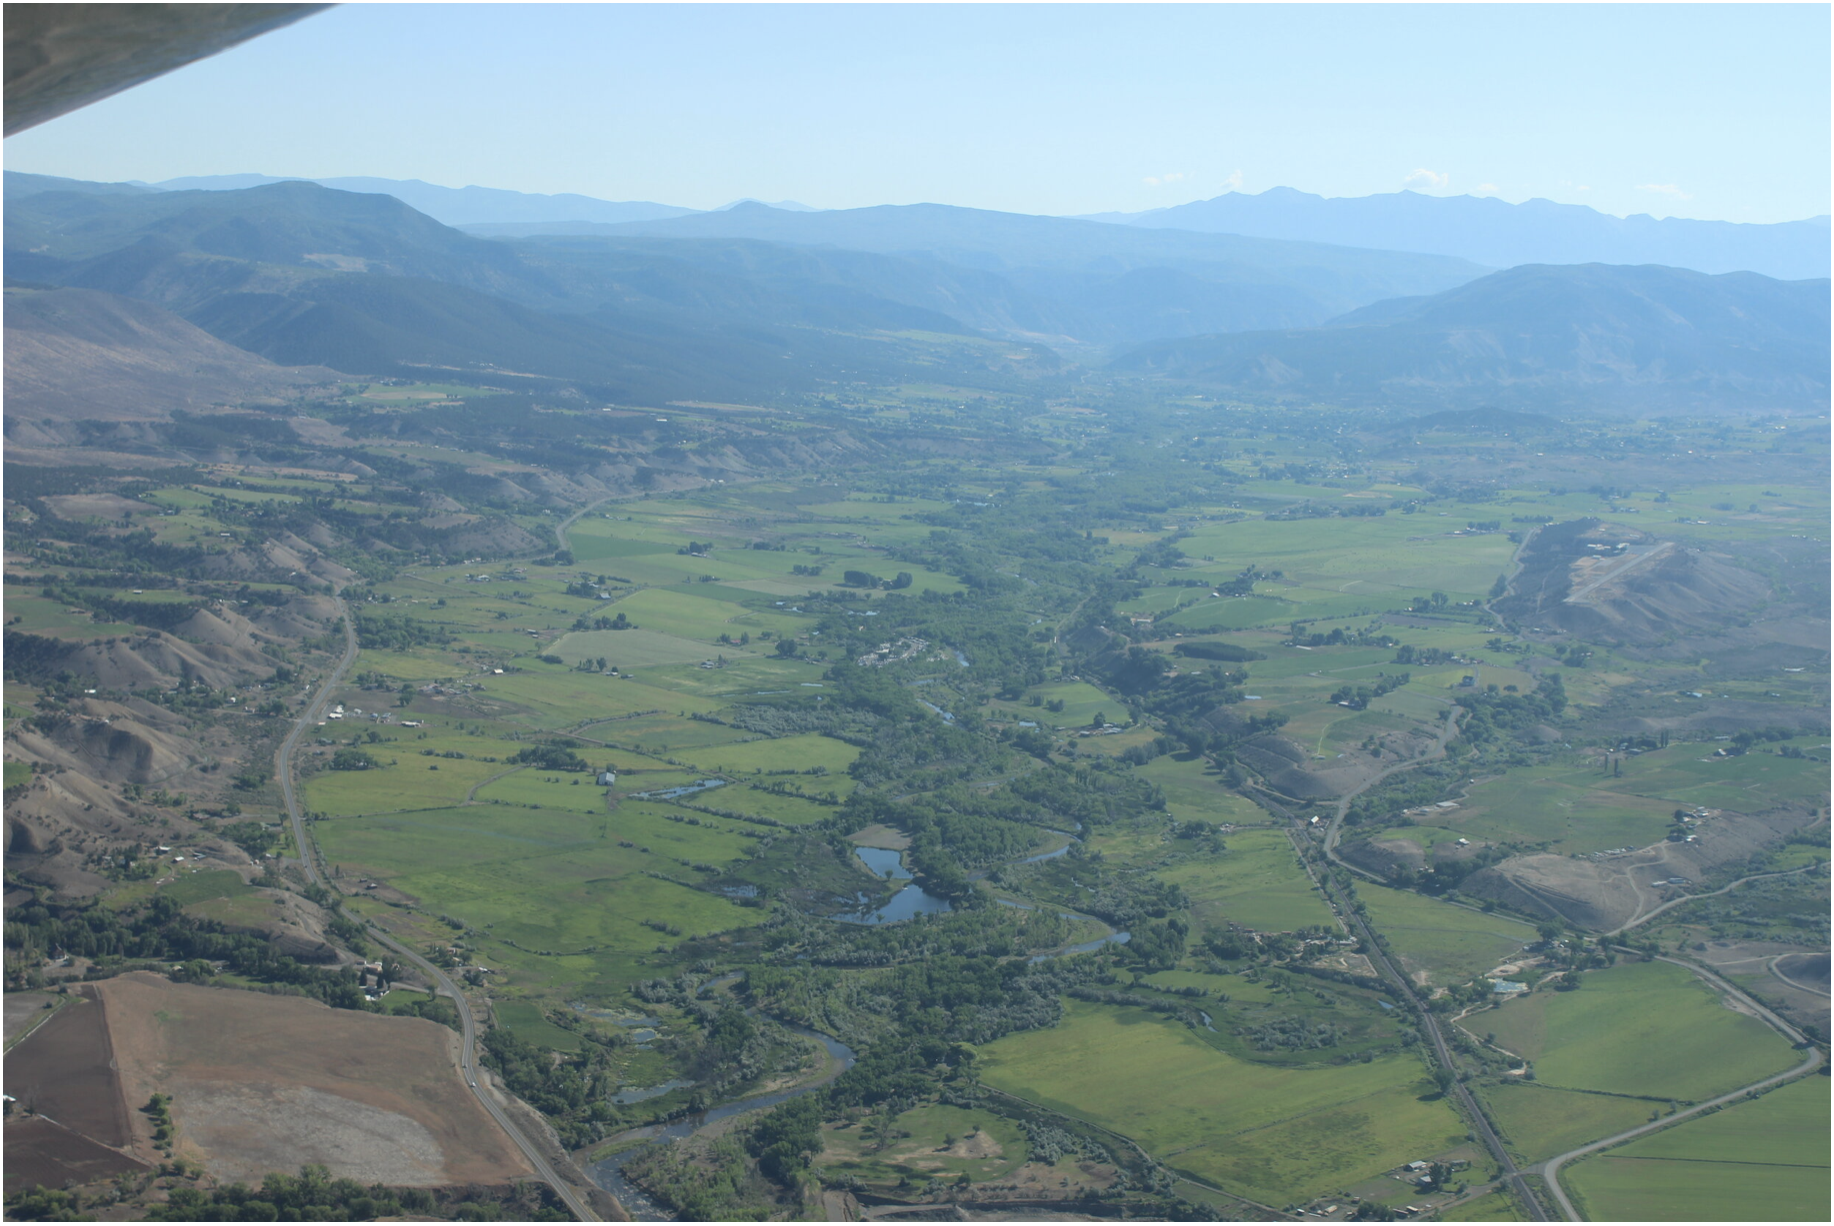
Agriculture in the U.S. Southwest is at high risk from the impacts of climate change. EcoFlight photo of the North Fork Valley by the Western Slope Conservation Center.
The International Energy Agency has noted: “A rapid shift away from fossil fuels [is required].
While these three acts, one now law and two others pending, before Congress are just tweaks to the federal land oil and gas program — they add critical side-boards that will limit the expansion and harm of this activity on our National Forests and other public lands. Still, we must do much more, and continue to enact reforms that move us rapidly beyond fossil fuels and curtail the further expansion of this activity on public lands.
“Net zero means huge declines in the use of coal, oil and gas. …[Efforts must] include, from today, no investment in new fossil fuel supply projects….” — The International Energy Agency
Because, if we are serious about responding to the Climate Emergency then it is time we act like it.
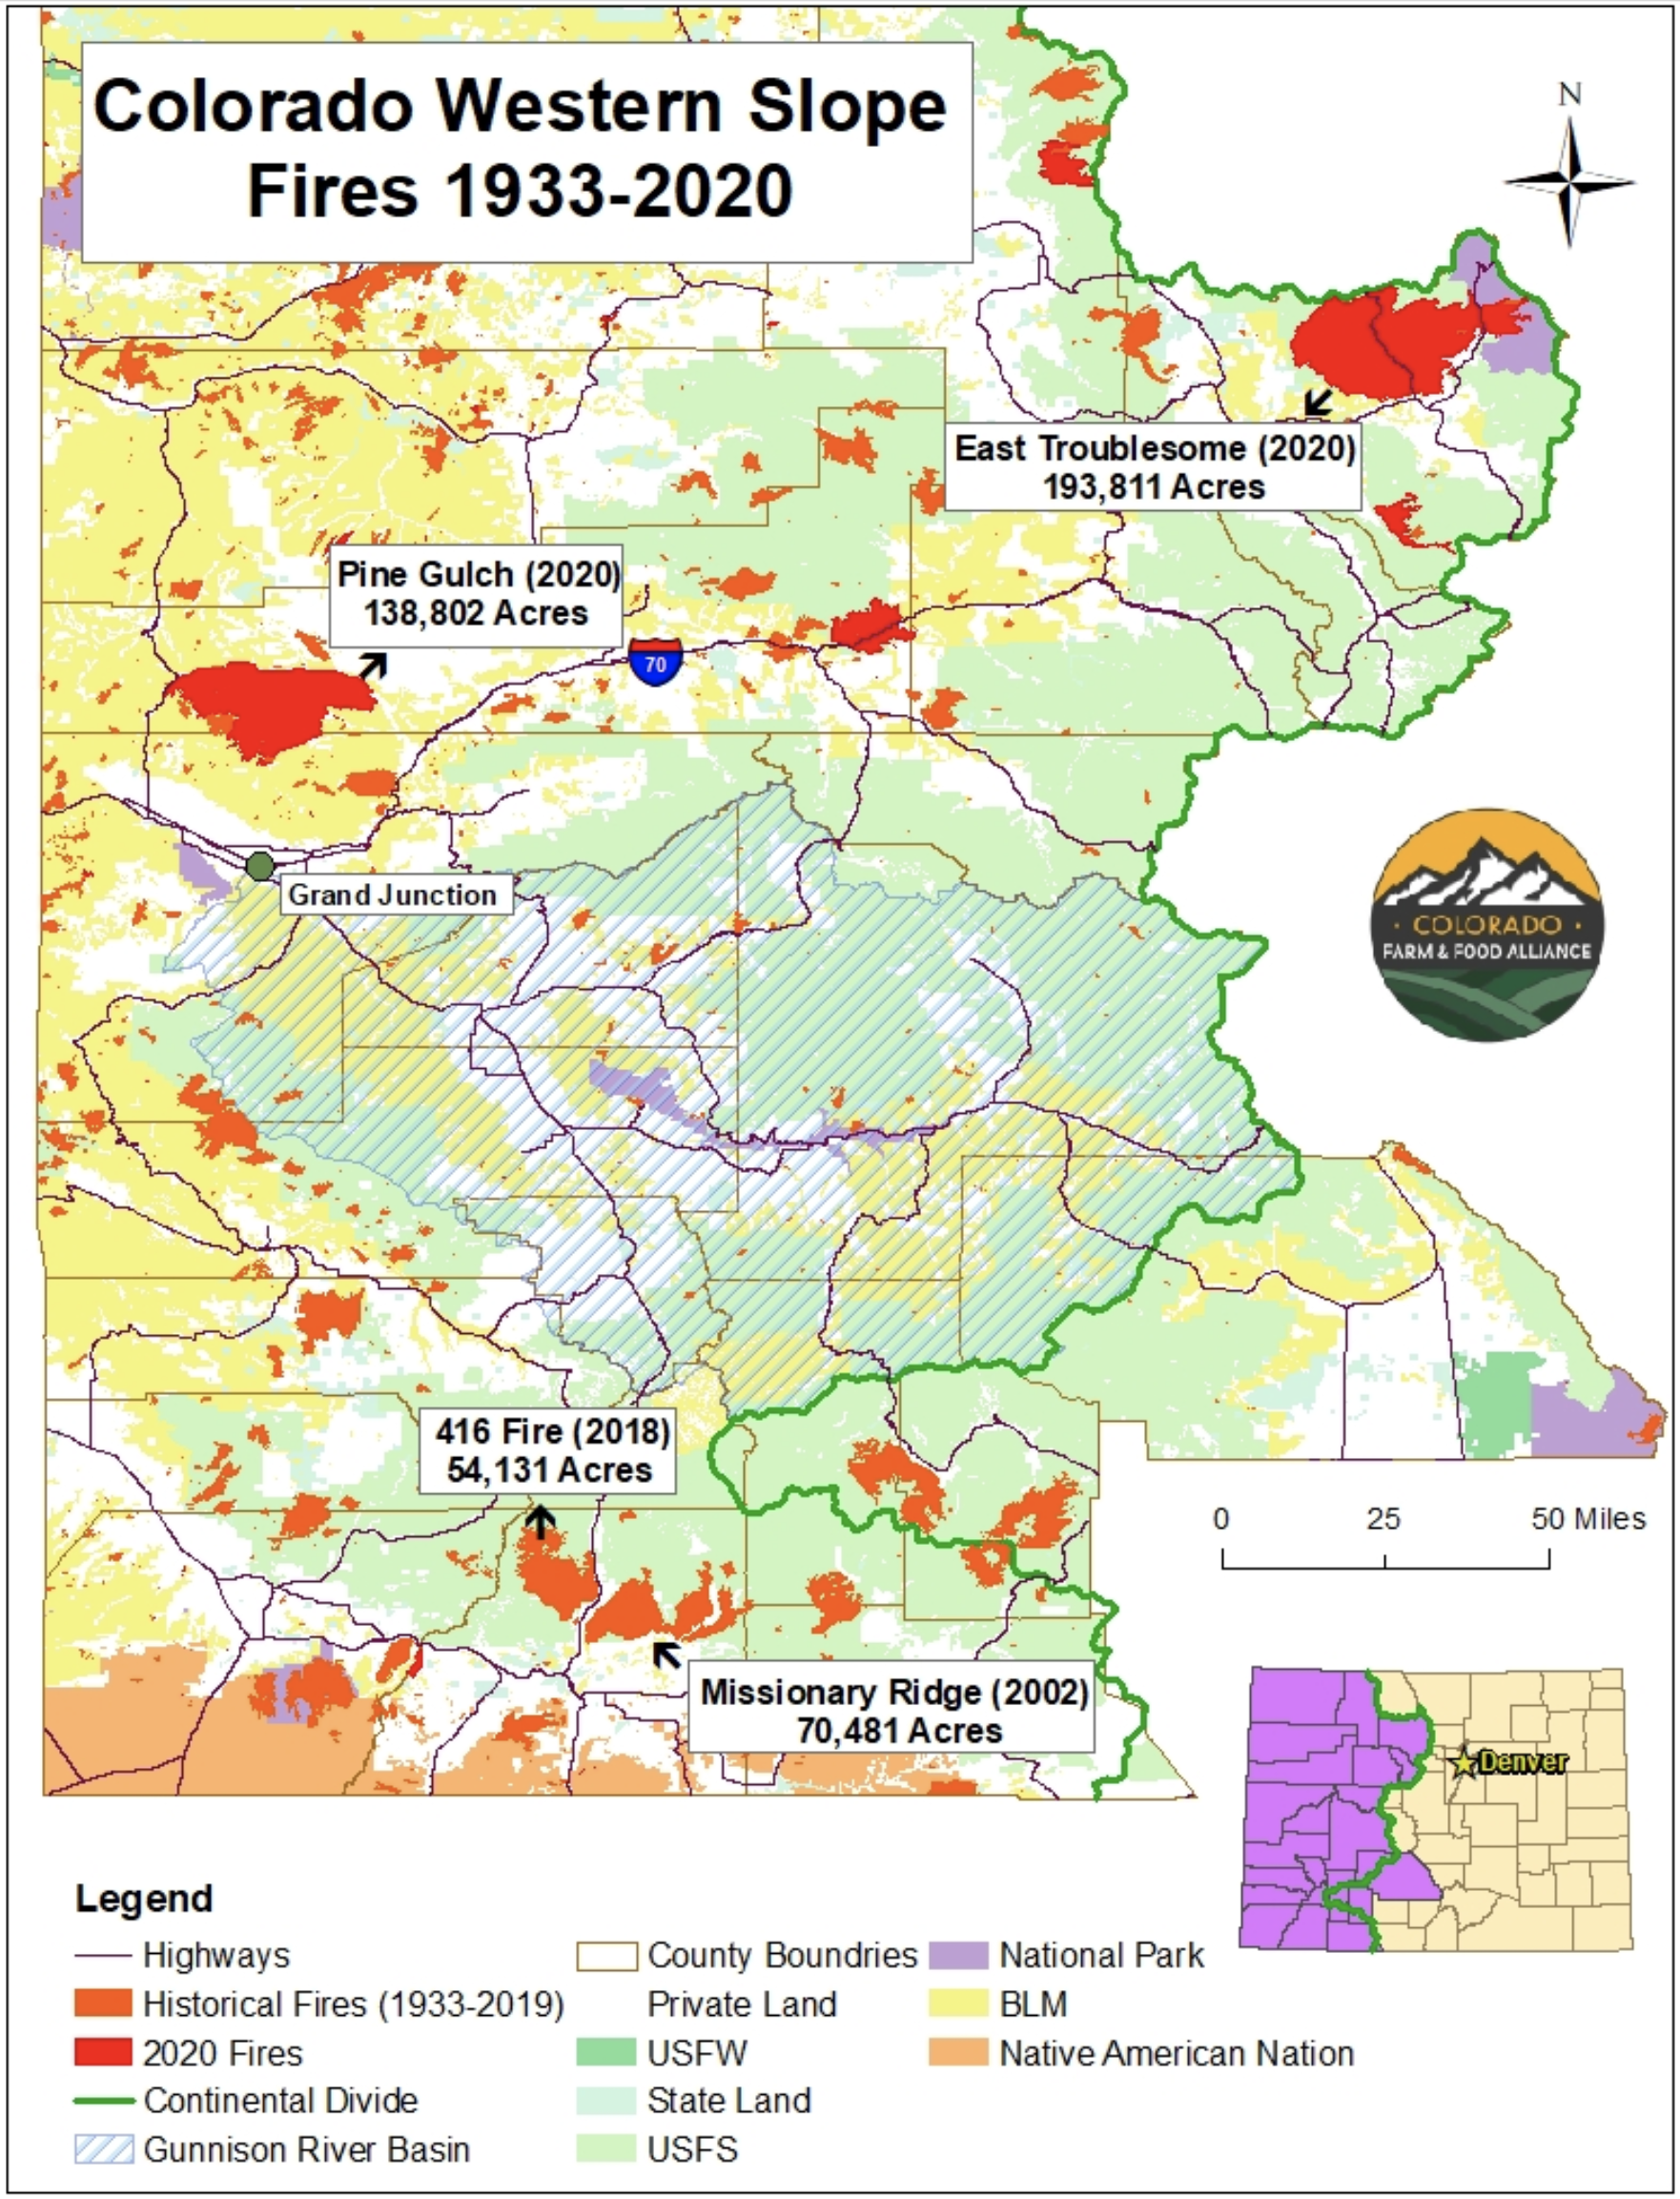
Wildfire season is becoming longer and worse across the West as the twin effects of heat and drought but more forests and grasslands at risk. This map from our up-coming report depicts the changing patterns of fire on the Western Slope since 1933.
Brad Udall on twitter yesterday ran through a striking series of graphs of the current state of the Colorado River. With his permission, I’m posting them here along with a slightly polished version of his accompanying commentary. Some key points that grabbed my attention:
Second-lowest Powell inflow in a period of record we use dating to 1964.
Risk of Powell dropping next year to levels that could jeopardize power production.
Risk of Mead dropping low enough in the next 18 months to trigger much deeper “Tier 2” reductions to Lower Basin water users in 2023.
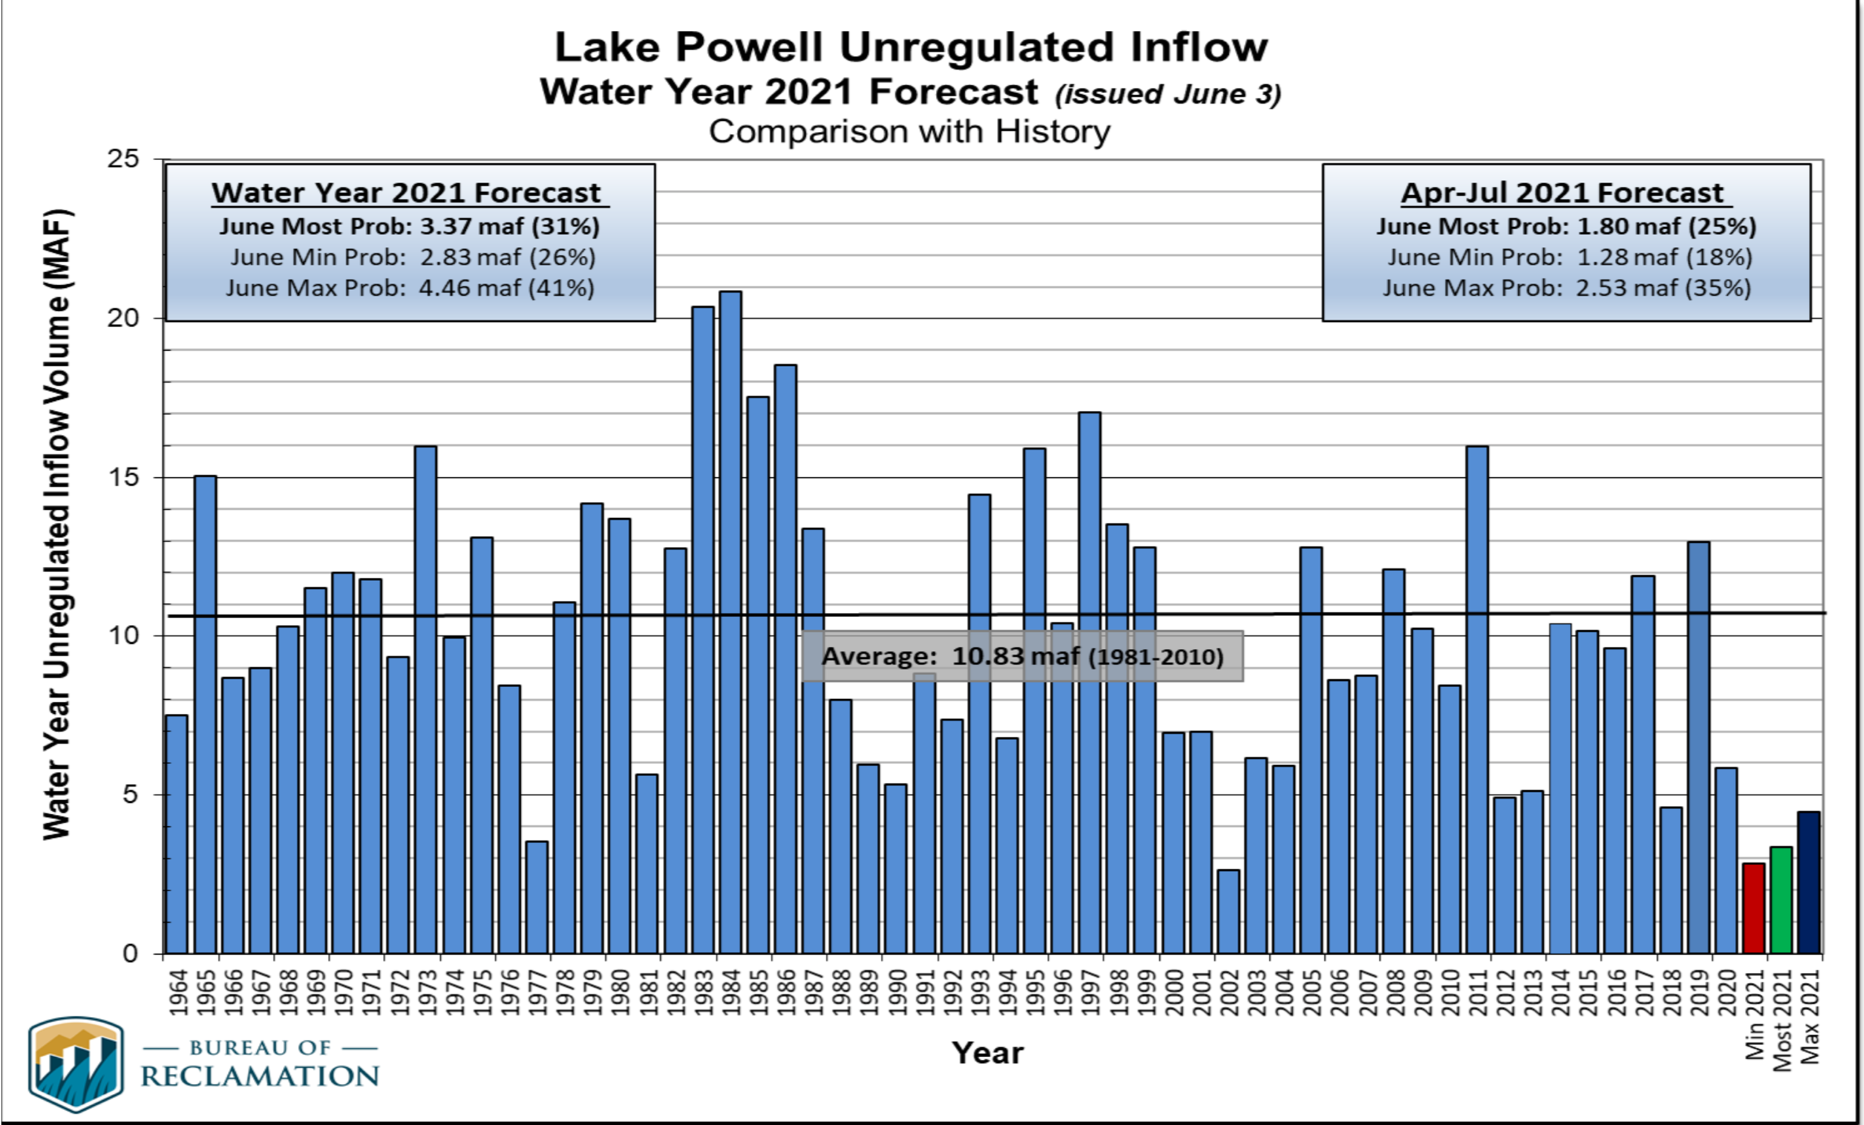
Reclamation’s ‘unregulated inflows’ into Lake Powell show that 2021 will be the 2nd worst year after only 2002 going back to 1964. 2021 will be the RED bar most likely. This is a really grim year for runoff.
Graphic credit: Bureau of Reclamation via Brad Udall
2021 inflow will be only ~3 maf, compared to the 1981-2010 average of 10.3 maf or the 2000-2021 average of 8.3 maf (20% less than 1981-2010 average).(maf = million acrefeet)
Considering that Powell will release or lose to evaporation ~ 8.5 maf, the lake will lose ~ 5 maf this year or ~55 feet of elevation.
April 2021 snowpack above Powell peaked at ~85% of normal but will generate about 25% of normal river flow. This comes on top of April 2020 snowpack of 100% of normal that generated about 50% of normal flow.
Declining runoff efficiency has been noted in multiple peer-reviewed studies. For a recent overview of recent climate change studies on the Colorado River see this written with Jonathan Overpeck:
Jeff Lukas points out that the twitter thread implied that the low runoff efficiency this year as measured by runoff as a percent of snowpack is all due directly to warming. I did not mean to imply that. The low runoff percent numbers are much more a function of (1) very low spring precipitation in both 2020 and 2021 and to a lesser extent (2) low soil moisture from the previous year. It may be that there is a human-caused connection to the low spring precipitation although there’s no real evidence of this yet. Low soil moisture in the springs of 2020 and 2021 is definitely connected to dry and very warm late summer and early fall from the previous years. Teasing this apart to obtain the actual driver(s) is not simple. That said, no one should doubt that climate change is reducing the flows of the Colorado. Multiple peer-reviewed papers have now supported this finding.
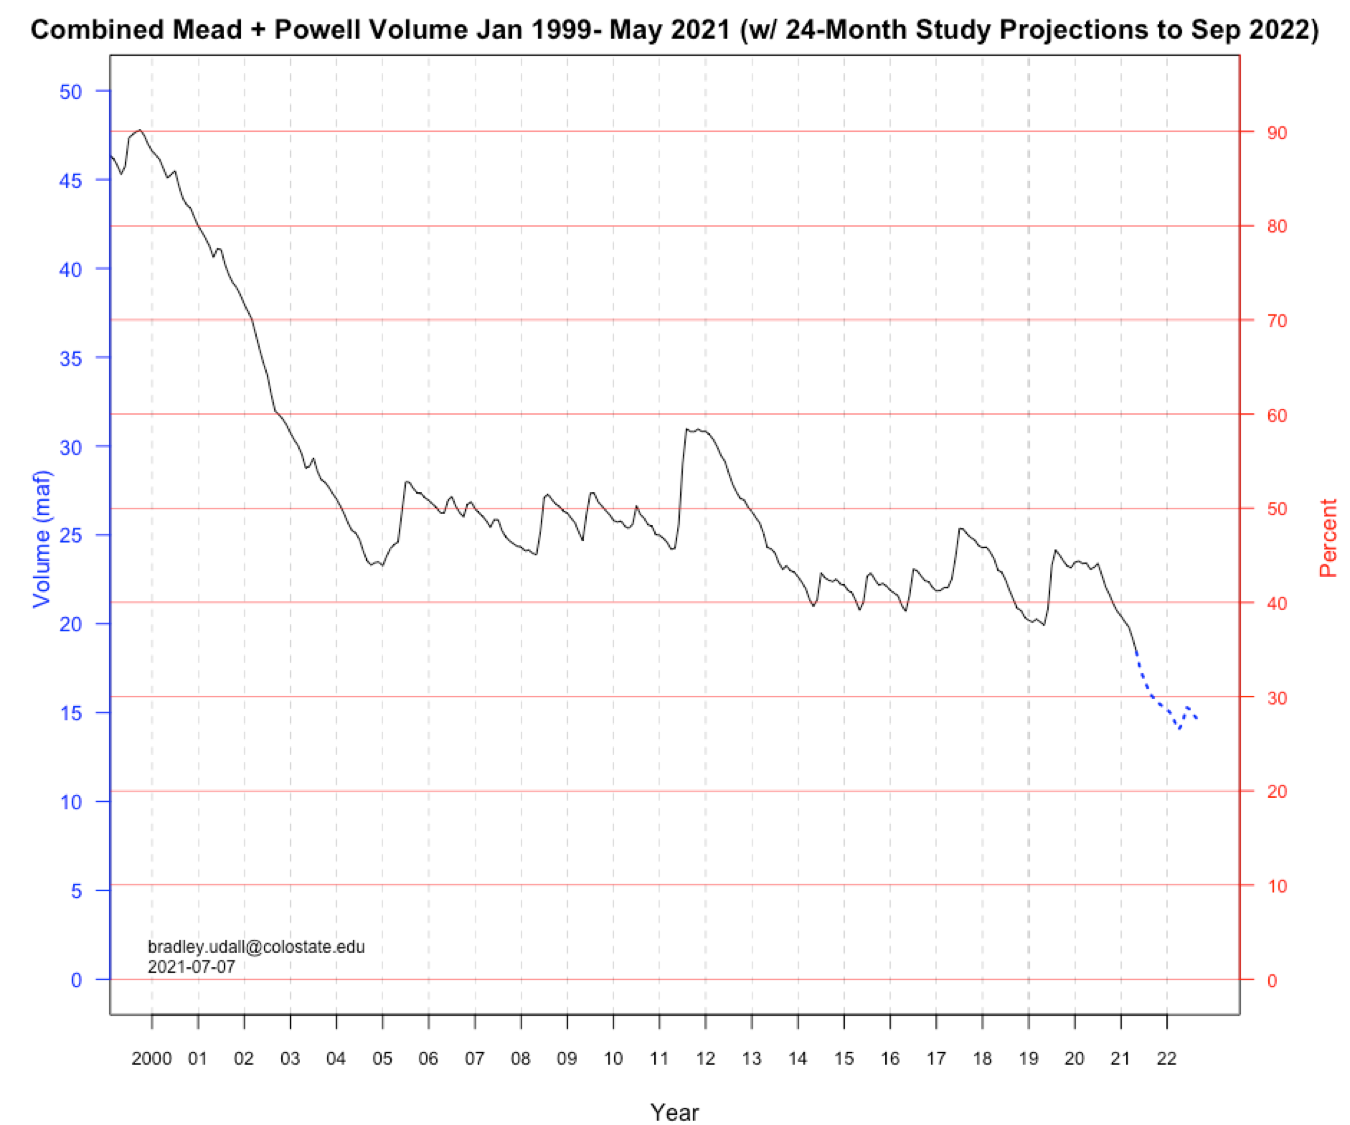
Here’s what’s going to happen to the nation’s 2 largest reservoirs because of this measly inflow:
Losses to Mead and Powell. Graphic credit: Brand Udall via InkStain
Note that combined contents will drop below 30% by late next year.
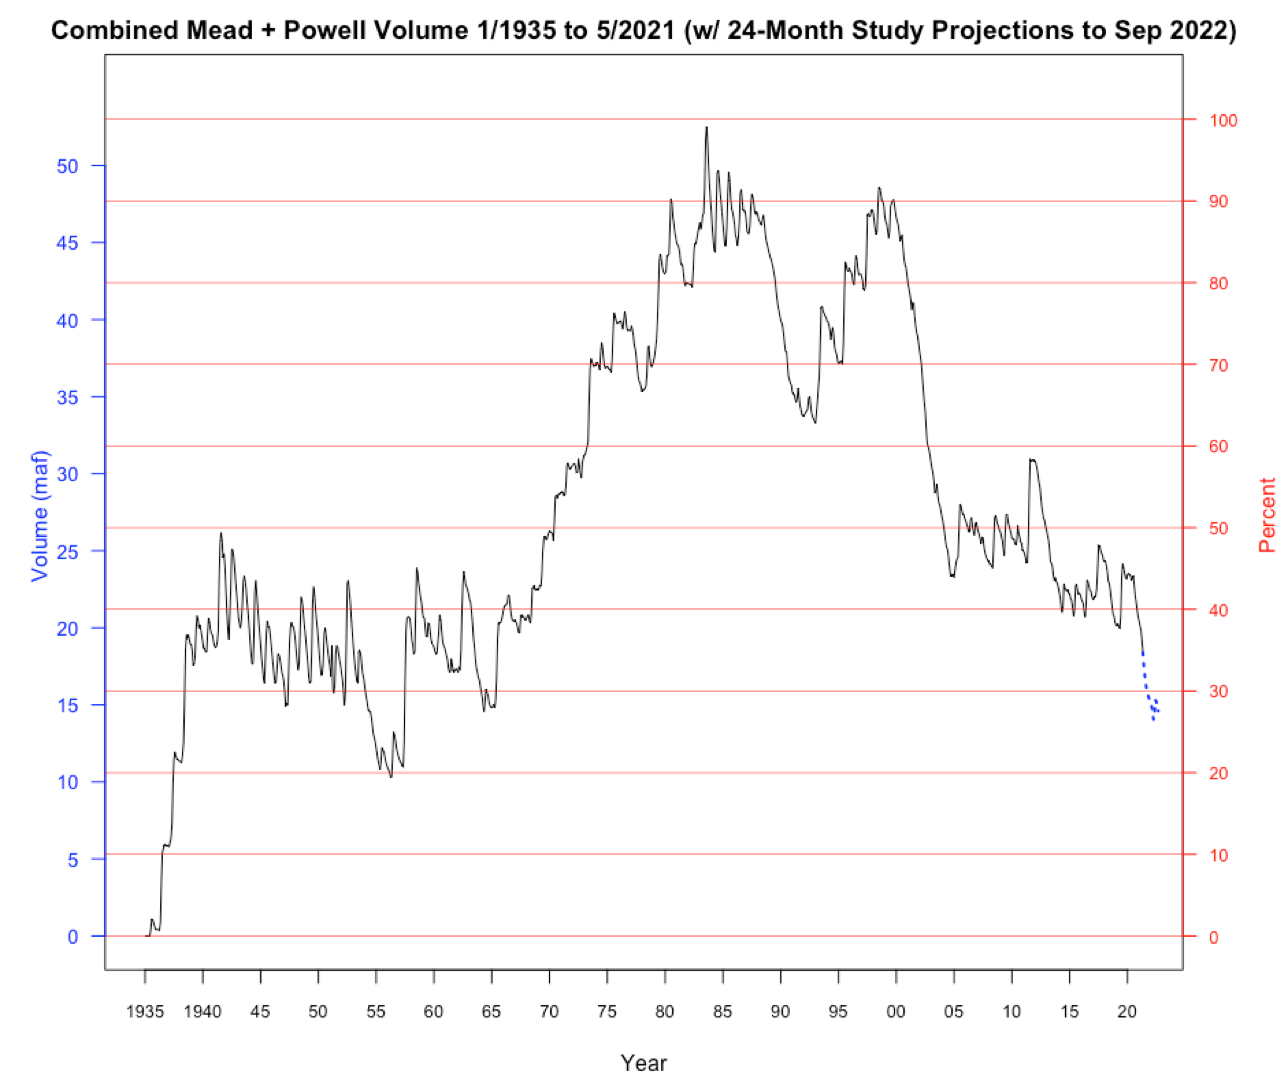
Here’s that decline for all years back to 1935 when Mead first filled. These two reservoirs will hold less water than Mead did alone in many years before 1964 when Powell was built.
Combined storage, Mead and Powell. Graphic credit: Brad Udall via Inkstain
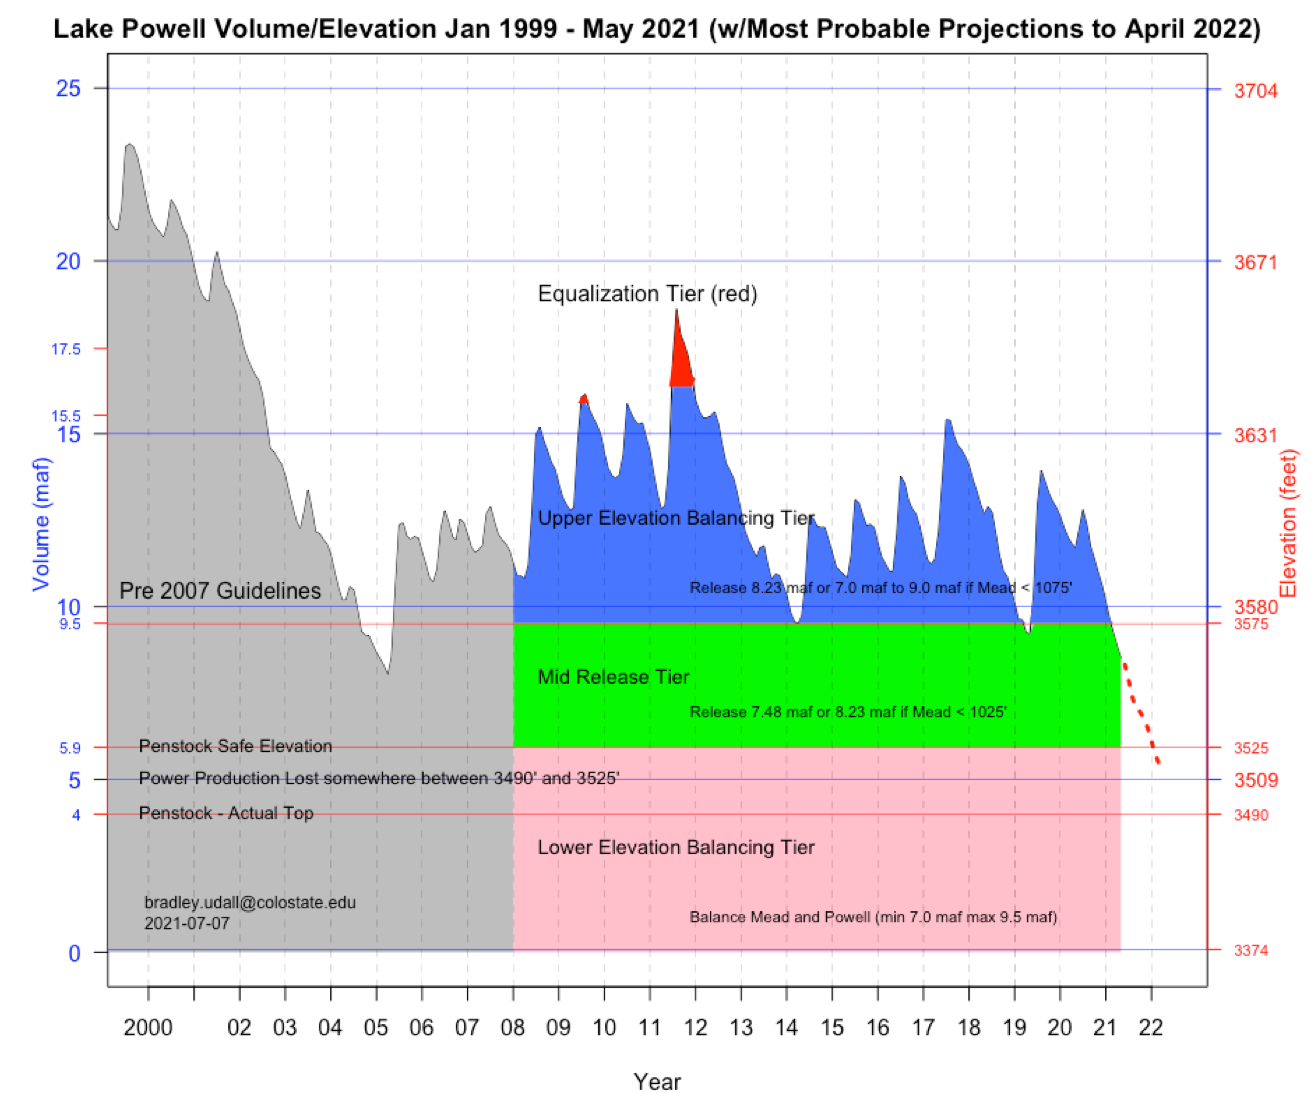
By next April Powell will hit 5.4 maf, ~185 feet below full. See Red dots. This will be the lowest since its initial fill in 1964. Since 1999, Powell will have lost ~18 maf, 75% of its contents.
Graphic credit: Brad Udall via InkStain
At 5.4 maf Powell could be low enough to lose the ability to generate power. (We’re uncertain about how penstocks operate when lake gets low — water in penstocks can not be aerated or turbine damage will occur.)
Loss of power, while not calamitous, is concerning. Power revenues fund environmental compliance and other important items in the basin.
As part of the 2019 agreement, the UB can release flows from reservoirs upstream of Powell to prop it up. But there is only about 5 maf for that all together. It is a one-shot deal.
We’ll have to wait on next winter to understand what happens after April of 2022. But 5.4 maf is very little water in a 25 maf reservoir.
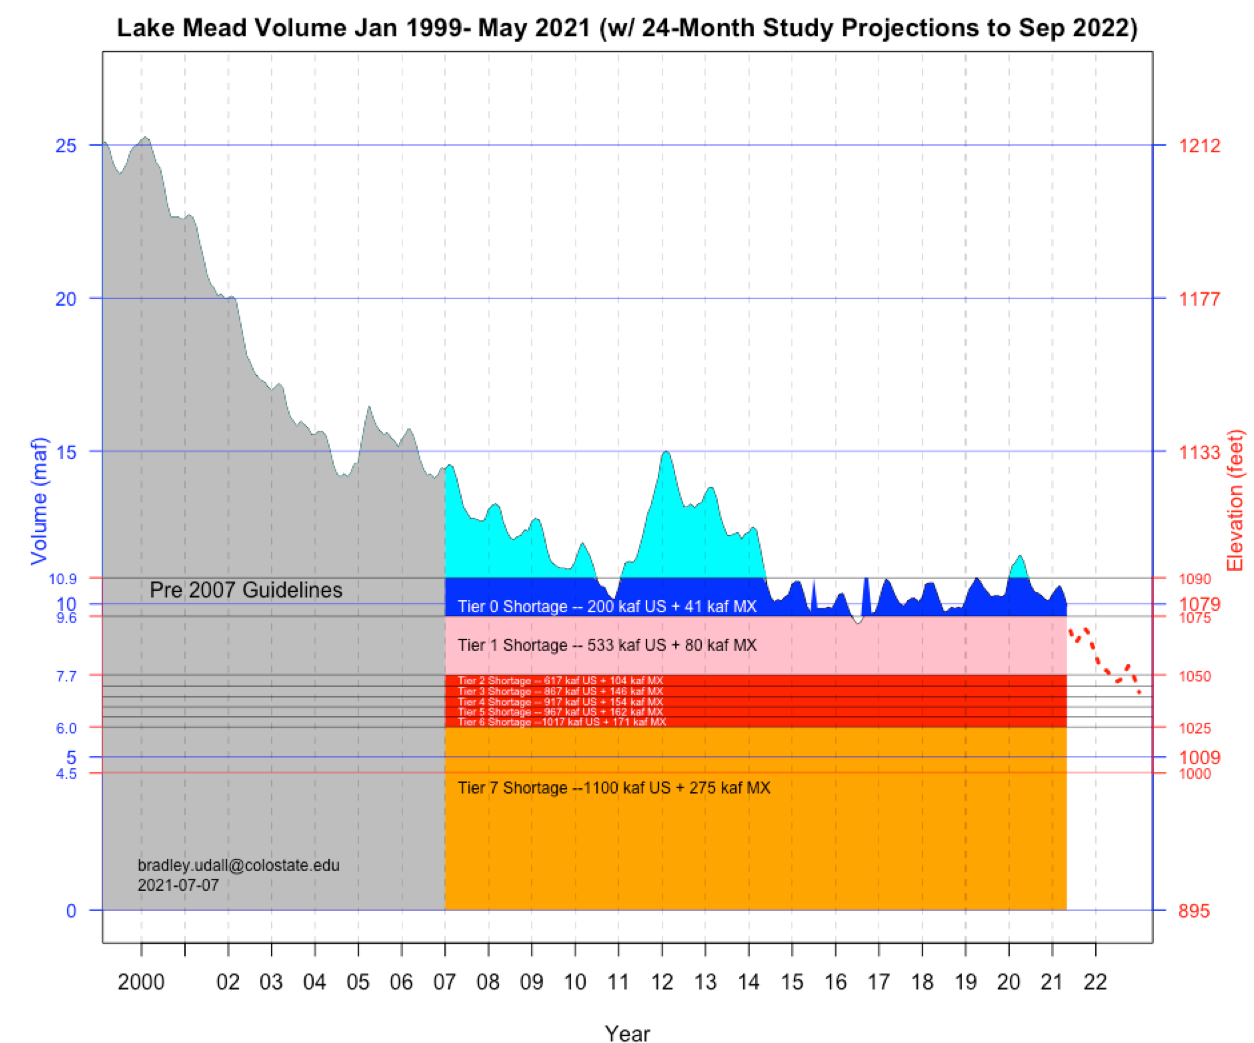
So what about Lake Mead, the nation’s largest reservoir?
Reclamation’s current forecasts show January 1, 2022 elevation at 1065’ feet (8.8 maf) , well below the 1075’ needed to avoid a ‘Tier 1 Shortage’.
Decline of Lake Mead. Graphic credit: Brad Udall via InkStain
If it ends up below 1050’ on Jan 1 (as projected in August 2022), that will lead to a Tier 2 Shortage (total cutbacks of 721 kaf). Otherwise, Mead will face a 2nd year of Tier 1 shortages. Either way, this is not good.
Shared by seven states and Mexico, the Colorado Basin provides about 40 million Americans with a portion of their drinking water and irrigates up to 5.5 million acres.
It is home to endangered species and supports about $1.4 trillion in economic activity.
Because of record-high temperatures and a drying climate, the basin is also dangerously close to being parched: Lake Mead, which is just 36 percent full, is in poor health. So is Lake Powell, located upstream and only 34 percent full.
A complex and arcane water banking program in the lower Colorado River basin, adopted in 2007 and later amended, was designed to incentivize water conservation, prevent waste, and boost storage in a waning Lake Mead.
The program has already proved its worth, lifting Lake Mead dozens of feet higher than it otherwise would have been and nurturing collaboration among states that will need to work together to surmount daunting challenges of water availability. In the next two years, the program will be tested in another way, becoming a small but important source of water for Arizona and California even as the lake continues to fall to levels that haven’t been witnessed in several generations.
Water managers in the basin view the program, called intentionally created surplus or ICS, as a flexible tool for adapting to a drying climate. It is a tool that they will soon call upon. Bill Hasencamp from the Metropolitan Water District of Southern California, a large regional wholesaler, told Circle of Blue that the district intends to draw between 100,000 and 150,000 acre-feet from its savings this year.
Arizona officials, meanwhile, plan to use 69,100 acre-feet of ICS credits to reduce mandatory cutbacks that will be required in 2022 if Mead declines as projected. The state already used this maneuver to deal with a cutback last year, albeit in a smaller amount. Instead of taking a big cut in one year, ICS allows Arizona to “smooth the reduction,” as Chuck Cullom of the Central Arizona Project put it. CAP delivers the bulk of Arizona’s Colorado River allocation and is first in line in the state when cutbacks are required.
These amounts are small but significant, especially in these times…
At the same time that water users plan to tap their savings, scholars in the basin are calling for more analysis of the ICS program, especially as Lake Mead’s decline accelerates. They would like to check how the system responds to ICS use under a range of water supply scenarios.
Ever since the late-2000s, the last time that water supplies in Colorado River reservoirs reached critically low levels, the biggest water users in Arizona, California, and Nevada have been stashing water in Lake Mead, in preparation for another emergency to come — and in an attempt to avoid a catastrophic collapse of the region’s water storage system.
With the federal government now projecting that Lake Mead will drop precipitously in the next two years — perhaps to levels not seen since the Great Depression, when the country’s largest reservoir was first filled — that emergency has arrived.
“While Colorado River water users have invested billions of dollars to reduce consumption and increase resiliency, the situation we face today is real and urgent,” John Entsminger, the general manager of the Southern Nevada Water Authority, said at a House Natural Resources subcommittee hearing on May 25…
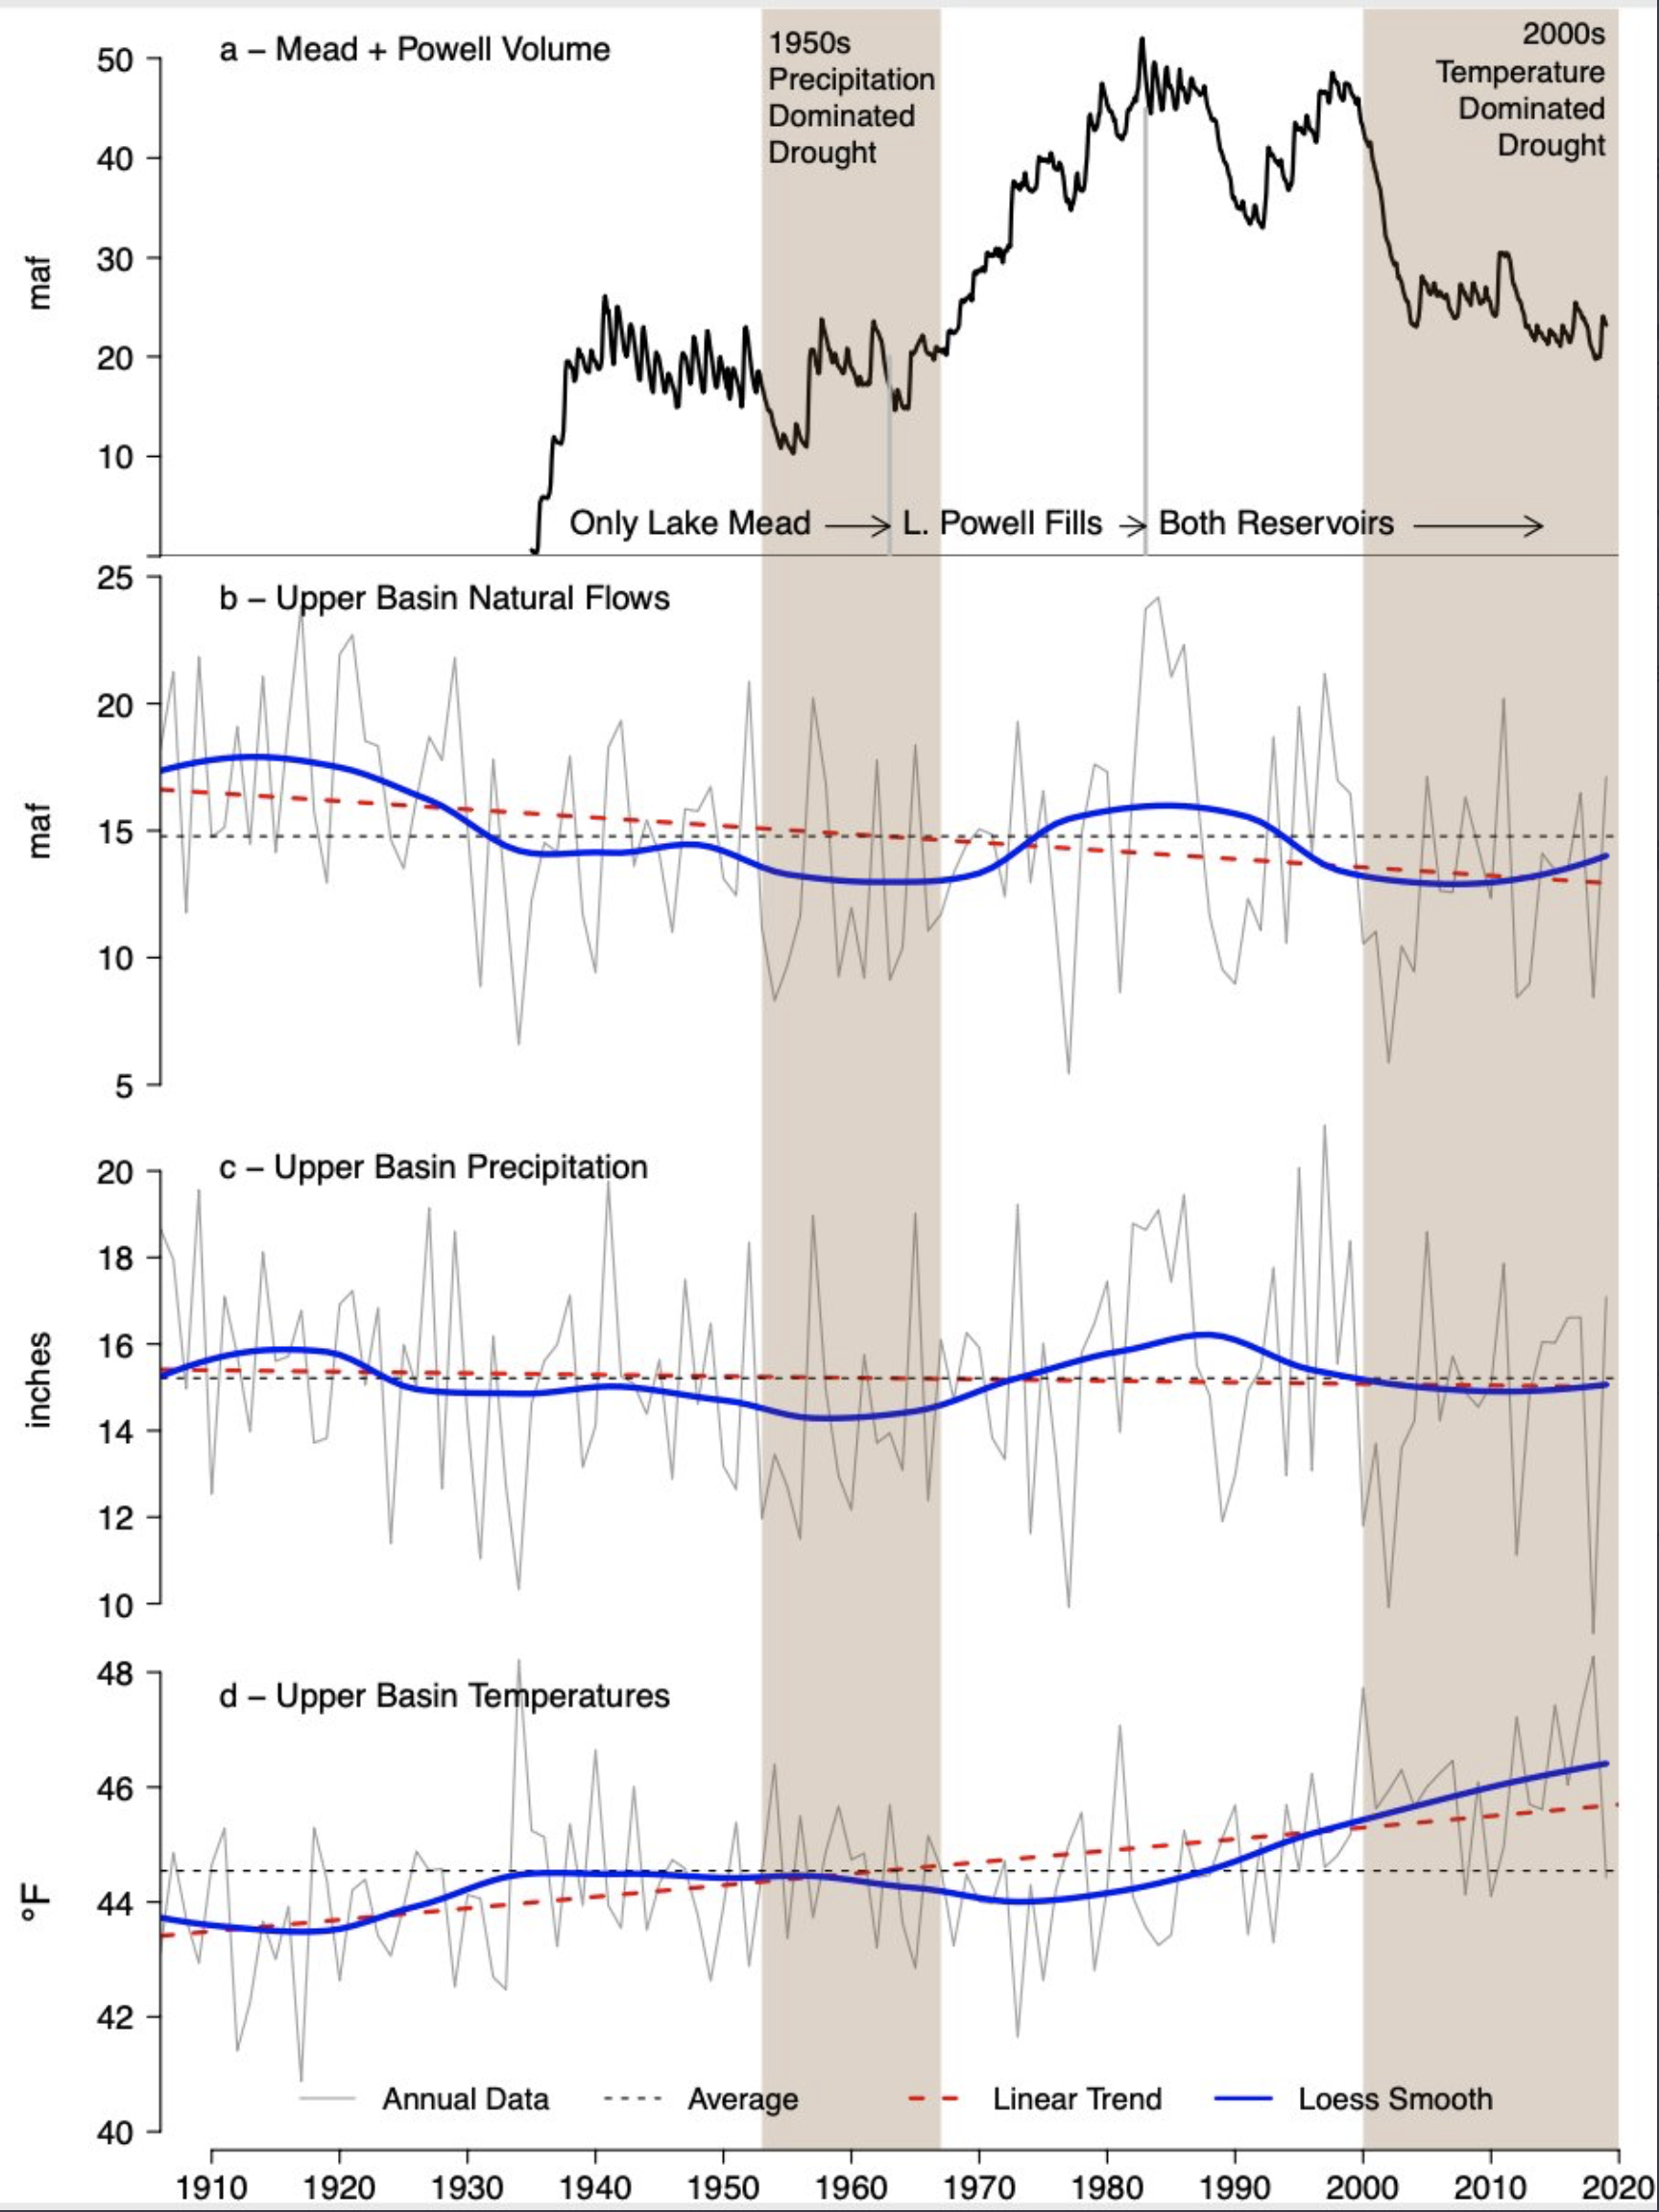
Brad Udall: Here’s the latest version of my 4-Panel plot thru Water Year (Oct-Sep) of 2019 of the #coriver big reservoirs, natural flows, precipitation, and temperature. Data goes back or 1906 (or 1935 for reservoirs.) This updates previous work with @GreatLakesPeck
Arizona, California, and Nevada, which together form the lower basin, rely on water from Lake Mead, whose fluctuations have become a barometer for water stress in the American Southwest. As stress increased in the last two decades, water managers have responded. They have been willing to process new information about the changing hydrology and rewrite the rules by which they operate, constraining themselves so as to dodge the worst outcomes. ICS, to this date, has functioned the same way. But difficult situations are likely to soon arise.
“[ICS] has enabled more opportunity to be a part of this puzzle of how to make things work so that we avoid deep shortages that have harsher implications to water users,” Sharon Megdal, director of the University of Arizona Water Resources Research Center, told Circle of Blue. “I think it’s been a very good tool. But like anything else it’s with uncertainty.”
Creating Surplus
ICS was conceived during negotiations between the seven states that led to a milestone agreement in 2007 that transformed how the basin operates. At the time, Lake Powell had experienced the driest five-year period in the region in a century and there were unresolved questions about delivering water under such conditions. The 2007 Interim Guidelines, which expire at the end of 2025, were a landmark document that secured three substantial changes.
First, the guidelines developed a formula for determining how much water is released from Lake Powell into Lake Mead. The releases are designed to keep the reservoirs roughly in balance.
The guidelines also set Lake Mead elevations at which lower basin states would be required to reduce their withdrawals. The first of these shortage tiers — at 1,075 feet above sea level — is expected to be breached next year. (Mead is currently at 1,073 feet, but for shortage determinations, it is the projected level in the following January that matters. Right now that projection is 1,066 feet.)
The third change was establishing intentionally created surplus, or ICS. The program allows big water users in the lower basin to open a savings account in the lake. To bank water in their account, they must take an action that reduces water consumption. That banked water is credited to the user that created it. ICS is not conservation in the household sense of simply using less. It is not taking a shorter shower or only watering the lawn once a week. ICS is instead more comparable to a personal savings account. Water banked now becomes an asset that can be withdrawn later, subject to certain conditions.
The program was championed initially by the Metropolitan Water District of South California. Known as Met, the district is the largest urban water wholesaler in the state, providing water to 19 million people in six counties including Los Angeles and San Diego. Met wanted a way to take advantage of its right to store “surplus” water in Lake Mead, a right it secured in 1931 when it agreed to be cut off from Colorado River supplies before the state’s irrigation districts were. Met needed the flexibility of extra Lake Mead storage for two reasons: a court decision limited California’s use of Colorado River starting in 2003 and its supply from reservoirs in northern California’s Sierra Nevada mountains is quite variable. In dry years in the Sierra, like this year when deliveries from the State Water Project canals are low, Met draws more water from the Colorado River. It is one of the many ways that human use connects watersheds of the American West that are physically separated by hundreds of miles.
With a bit of linguistic maneuvering, the rules were written so that agencies like Met could create “surplus” by investing in conservation. Say, for example, that Met paid to line a canal with concrete so water would not seep into the soil, or paid farmers to fallow their fields. The Bureau of Reclamation, playing the oversight role in the lower basin, checks that the lining kept water in the canal and the alfalfa fields were not irrigated. That amount of water — the difference between what would have been delivered without the intervention and what was actually delivered — would then be credited to Met in the form of ICS, minus a small percentage that is the lake’s share.
A few years later these rules were altered to bring Mexico into the program. U.S. entities can pay a counterpart in Mexico for conservation and reap the ICS asset. The rules were changed again in 2019, in an agreement called the Drought Contingency Plan, or DCP, that welcomed certain tribal nations into the fold. Banked water is now subjected to a one-time tax of 10 percent, a cut that is credited to the storage system as a whole.
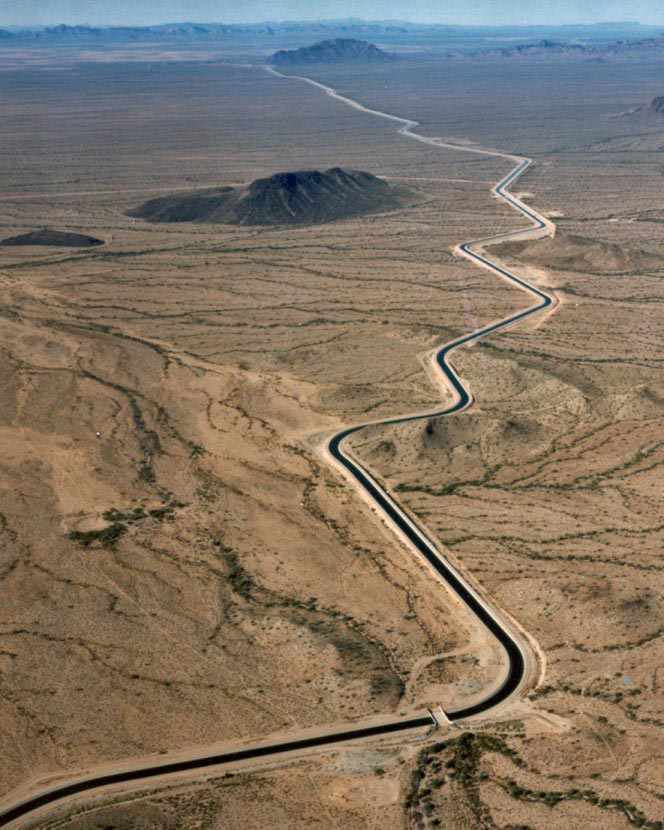
Aerial photo – Central Arizona Project. The Central Arizona Project is a massive infrastructural project that conveys water from the Colorado River to central and southern Arizona, and is central to many of the innovative partnerships and exchanges that the Gila River Indian Community has set up. Public Domain, https://commons.wikimedia.org/w/index.php?curid=326265
Only six entities have created ICS, according to Jeremy Dodds, who is responsible for ICS accounting and verification at the Bureau of Reclamation. Those six are some of the largest water users in the basin: Met, Gila River Indian Community, Colorado River Indian Tribes, Southern Nevada Water Authority, Imperial Irrigation District, and the Central Arizona Water Conservation District, which manages CAP. Within the four categories of ICS, there are limits on the ICS each water user can create, the amount they can take out in a year, and the total amount stored.
There have been far more ICS deposits than withdrawals. Dodds said that about 3.7 million acre-feet of ICS have been created since 2007, but water users have withdrawn only about 550,000 acre-feet. Taking into account the system cuts, the Bureau of Reclamation counts just over 2.8 million acre-feet of ICS in Mead today. About half belongs to Met.
Met has been responsible for nearly all withdrawals, taking out a combined 485,000 acre-feet in 2013, 2014, and 2015 when California was clutched by a severe drought and water deliveries from the State Water Project bottomed out in 2014 at 5 percent of contracted amounts.
When it is withdrawn, ICS is additional to a state’s typical allocation of Colorado River water. That means California can exceed its annual 4.4 million acre-feet allocation when Met draws on ICS.
Bill Hasencamp, who is Met’s manager of Colorado River resources, said that his district’s ICS account is like a yo-yo that goes up and down, depending on water supply conditions elsewhere in California…
ICS serves another purpose, too. Lower basin states can use ICS to cover part of their mandatory cutbacks under the Drought Contingency Plan. In effect, states have “pre-paid” some of their shortage obligations. Arizona leaned on that mechanism in 2020, when it contributed 47,434 in ICS credits to a required 192,000 acre-feet reduction.
That doesn’t mean the rights to the water are lost, though. ICS that pays down a shortage obligation, through the basin’s accounting alchemy, becomes DCP ICS. This is a special category can be withdrawn through the year 2057, but only once Lake Mead rises above 1,110 feet.
Quest for Certainty in an Uncertain System
To this point, basin managers and federal officials are extremely satisfied with ICS. It is a “landmark success,” according to Colby Pellegrino, deputy general manager for the Southern Nevada Water Authority. Cullom of the Central Arizona Project said that the program has led to “deeper collaboration among water users interstate and intrastate and even internationally.” Elizabeth Klein, senior counselor to the secretary of the Interior and the department’s drought response coordinator, praised the ICS program during a House Natural Resources subcommittee hearing on May 25. “This demonstrates the extraordinary importance of taking proactive, cooperative measures to protect limited water supplies,” Klein said.
But as Lake Mead declines, there are scenarios that will test the system of checks and balances.
One uncertainty that has been partially resolved is the risk of unintended consequences. The 2007 Interim Guidelines said that ICS was not allowed to be withdrawn during shortage situations, when Mead is below 1,075 feet. There was fear several years ago that there would be a run on the bank as the lake approached that level. Met would draw down its credits, storing the water elsewhere and leading the reservoir to crash.
That scenario did not happen, due in part to the DCP. That agreement allows ICS to be withdrawn until Mead reaches 1,025 feet. California, in exchange for the ability to take water out at lower lake levels, agreed for the first time to cutbacks in its Colorado River allocation, which constrains its ability to withdraw ICS as the lake declines. Below elevation 1,045, for every five feet that Mead declines, California’s cutbacks increase, thus diminishing its capacity to withdraw ICS.
These are some of the checks and balances written into the system, Pellegrino explained. The compromise on when ICS could be withdrawn provided more certainty, she said, but it also delayed a reckoning with the key question: whether there is a point at which ICS becomes stranded, even temporarily. The DCP contains a clause that the states will discuss “additional measures” if Lake Mead is projected to fall below 1,030 feet.
Hasencamp offered another consideration: the size of the ICS accounts relative to the amount of water in Lake Mead. Right now about 30 percent of the water in the reservoir is ICS. What happens if that figure reaches 40 percent or 50 percent? Is there a limit?
[…]
The false sense of security is what irks Brad Udall about ICS. Udall is a water and climate scientist at Colorado State University who says that ICS has laudable intentions: preventing water waste and increasing water levels in Mead. Higher reservoir levels help lakeside marinas stay in business and maintain the valuable hydropower generated by Hoover Dam. But Udall also believes that discussing Lake Mead water storage without being explicit about how much is set aside as ICS amounts to a “double counting” of supplies, combining the private ICS accounts with the public pool of water.
Udall would prefer a more rigorous examination of the implications of ICS use, especially given that the credits can be used to reduce shortage requirements. But he could not recall any academic study that modeled potential outcomes. One such study, however, is on the horizon.
Sarah Porter, director of the Kyl Center for Water Policy at Arizona State University, said that she plans to start work this year on an assessment of how ICS use would impact water availability in Arizona. A full analysis will take 18 months to two years, she said. But preliminary results could be available in six months or so.
“We have to look at a range of scenarios so we can look at a range of responses,” Porter told Circle of Blue.
The water supply scenarios are indeed daunting. By April 2022, the Bureau of Reclamation projects that Mead will drop to 1,063 feet, or 33 percent of its capacity. A year after that, in April 2023, the forecast is that Mead will sit at 1,047 feet. At that elevation, the reservoir would be just over 28 percent full.
All of these issues should be on the table soon. The basin states are set to begin negotiations over what will replace the 2007 interim guidelines, which expire on December 31, 2025. A big question — maybe the biggest — is how to permanently reduce reliance on the river so that water withdrawals are more in line with the drying hydrology.
A high desert thunderstorm lights up the sky behind Glen Canyon Dam — Photo USBR
Hoover Dam photo via the US Bureau of Reclamation
Here’s the release from the Bureau of Reclamation:
As one element of the ongoing implementation of the 2019 Drought Contingency Plans for the Colorado River Basin, the Bureau of Reclamation today released additional 5-year projections on the Colorado River System based on June 2021 conditions.
Five-year projections are typically modeled in January, April and August of each year. The additional June projections will inform the ongoing drought operations planning efforts at key Reclamation reservoirs in the Upper Colorado River Basin. These efforts are ongoing among Reclamation and the Colorado River Basin states under the Upper Basin Drought Response Operations Agreement.
“The June 5-year projections for the Colorado River System reaffirm this is a serious situation,” said Wayne Pullan, Upper Colorado Basin Regional Director. “We are actively engaged with the Colorado River Basin states and other partners to respond to changing conditions to avoid critical elevations at Lake Powell.”
Projections for anticipated runoff in the Upper Colorado Basin have declined over the course of the spring. Using information based on recent hydrology (since 1988 and known as the Stress Test Hydrology), Reclamation notes several key findings for Lake Powell in the June 5-year projections:
A 79% chance that Lake Powell will fall below its target water-surface elevation of 3,525 feet sometime next year.
Lake Powell’s target water-surface elevation of 3,525 feet provides a 35 vertical-foot buffer designed to minimize the risk of dropping below the minimum power pool elevation of 3,490 feet, and balances the need to protect the infrastructure at Glen Canyon Dam and to meet current operational obligations to the Lower Colorado River Division states of Arizona, California, and Nevada.
Beyond 2022, Lake Powell’s chances of falling to critical levels also increased.
There is a 5% chance that Lake Powell will fall below minimum power pool elevation of 3,490 feet in 2023 and 17% in 2024.
In the Lower Basin, the updated projections for Lake Mead continue to affirm the high likelihood of a first-ever shortage condition in the Lower Basin in calendar year 2022. Consistent with the 2007 Interim Guidelines, if Lake Mead’s end-of-calendar-year elevation is projected to be at or below 1,075 feet, Lake Mead would operate in a shortage condition in the upcoming year. The prescribed shortage reductions for Arizona and Nevada would also be coupled with water savings contributions under the Lower Basin Drought Contingency Plan. Mexico would reduce their allotment and make water savings contributions under Minute 323 to the 1944 U.S. Mexico Water Treaty. Consistent with the 2007 Interim Guidelines, the 2019 DCP and Minute 323, operational decisions for 2022 will be made by Reclamation in August 2021.
Reclamation is also concerned with the longer-term projections, which show a higher likelihood of Lake Mead declining to the critical elevations of 1,025 and 1,000 feet by 2025. Based on the June update, the chance of this occurring by 2025 is 58% and 21%, respectively.
Reclamation provides projections using two future hydrology scenarios: The Stress Test Hydrology based on the last 32 years, and the Full Hydrology based on the last 114 years. The Stress Test Hydrology provides more plausible near-term outlooks because it embeds the recent warming trend and current drought period. It is about 11% lower on average compared to the Full Hydrology.
Assumptions about drought operations are included in these projections; drought response operation plans to protect Lake Powell are being developed by Reclamation and the Upper Division states of Colorado, New Mexico, Utah, and Wyoming. Pursuant to the provisions of the Drought Response Operations Agreement and the Companion Agreement, Reclamation will consult with the Lower Division states before finalizing drought response operation plans. If actual hydrology demonstrates an imminent need to protect the elevation at Lake Powell, the Secretary retains all applicable authority to adjust releases from the upstream initial units of the Colorado River Storage Project Act (Flaming Gorge, Navajo, and Blue Mesa reservoirs) before those operating plans can be finalized.
Reclamation and the Colorado Basin states continue to closely monitor conditions to be prepared to meet the goals of the DROA in the months and years ahead.
A key component of Reclamation’s Colorado River Basin activities is the integration of sophisticated modeling tools and scientific research to inform water management decisions. Through a decades-long partnership with the Center for Advanced Decision Support for Water and Environmental Systems at the University of Colorado in Boulder, Reclamation hydrologic engineers and hydrologists are actively collaborating with climate, hydrology and decision support scientists to provide advanced modeling tools. Their work is helping Reclamation link advances in science to water resource management decisions in the face of greater uncertainty and increased hydrologic and operational risks.
Reclamation’s modeling and operations teams further refine these tools, such as the 24-Month studies, to make annual operational determinations for Lake Powell and Lake Mead through close coordination with water and power customers throughout the basin.