Click the link to read the article on the InkStain website (Jack Schmidt, John Fleck, and Eric Kuhn):
On the eve of the release of the US Bureau of Reclamation’s August Colorado River reservoir forecasts – freighted with meaning this month because of Reclamation’s ultimatum to the states about the need to cut water use – we look back at the last four decades of water-supply management to pose the central question:
How did we get into this mess? Our answer in brief:
When the Colorado’s flow was up, we used it all.
When it was down, we drained the reservoirs.
The river’s natural flows have been down for a long time.
And during the few stretches of somewhat higher flows, we did not significantly refill the reservoirs.
A FAILURE TO SET WATER ASIDE FOR THE FUTURE
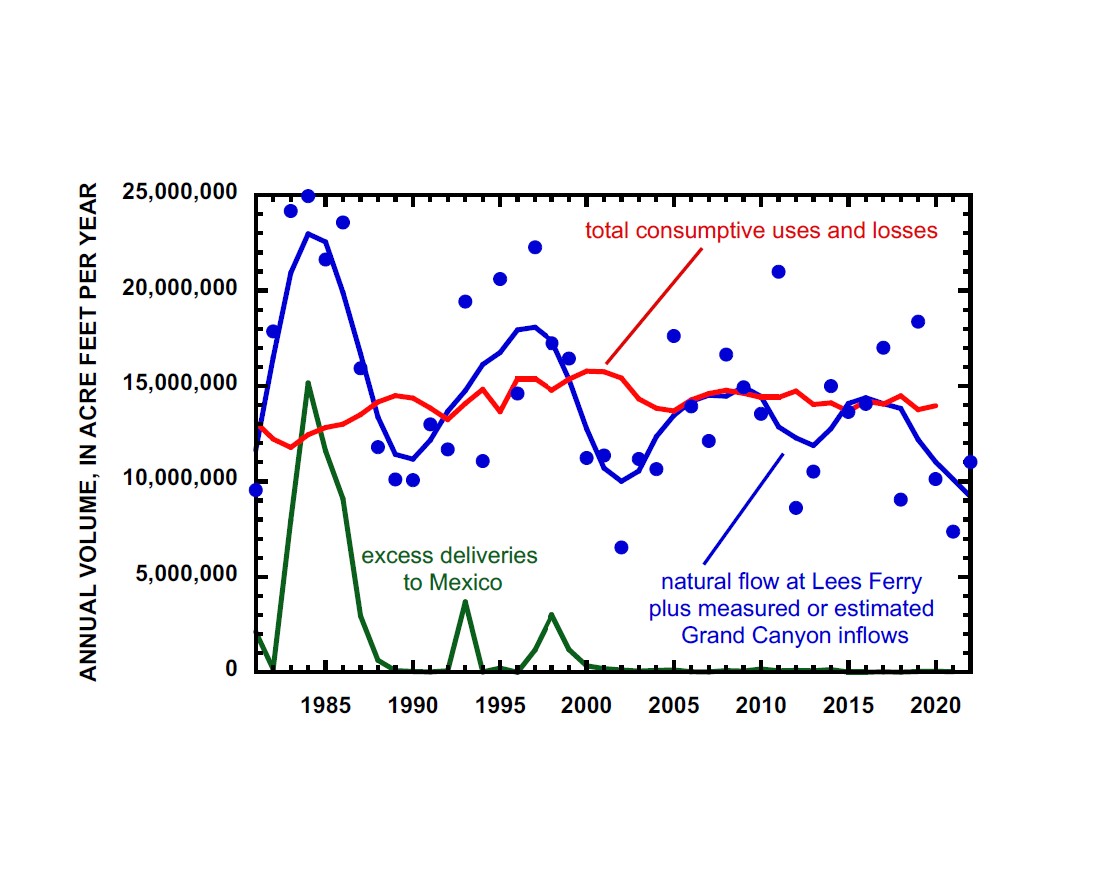
Colorado River water use outpacing supply. Graph by Jack Schmidt, Utah State University
Operating year to year, it is easy to get lost in the river’s annual ups and downs, and the immediate desire to get water to farm fields and cities – THIS YEAR! NOW!
But the longer view, based on the best available data, makes clear our mistakes during the past 20 years. Since the year 2000, the blue line in the graph above has spent little or no time above the red line. That is water use outpacing supply.
The result – the most recent three consecutive dry years have left us with headline-clear problems:
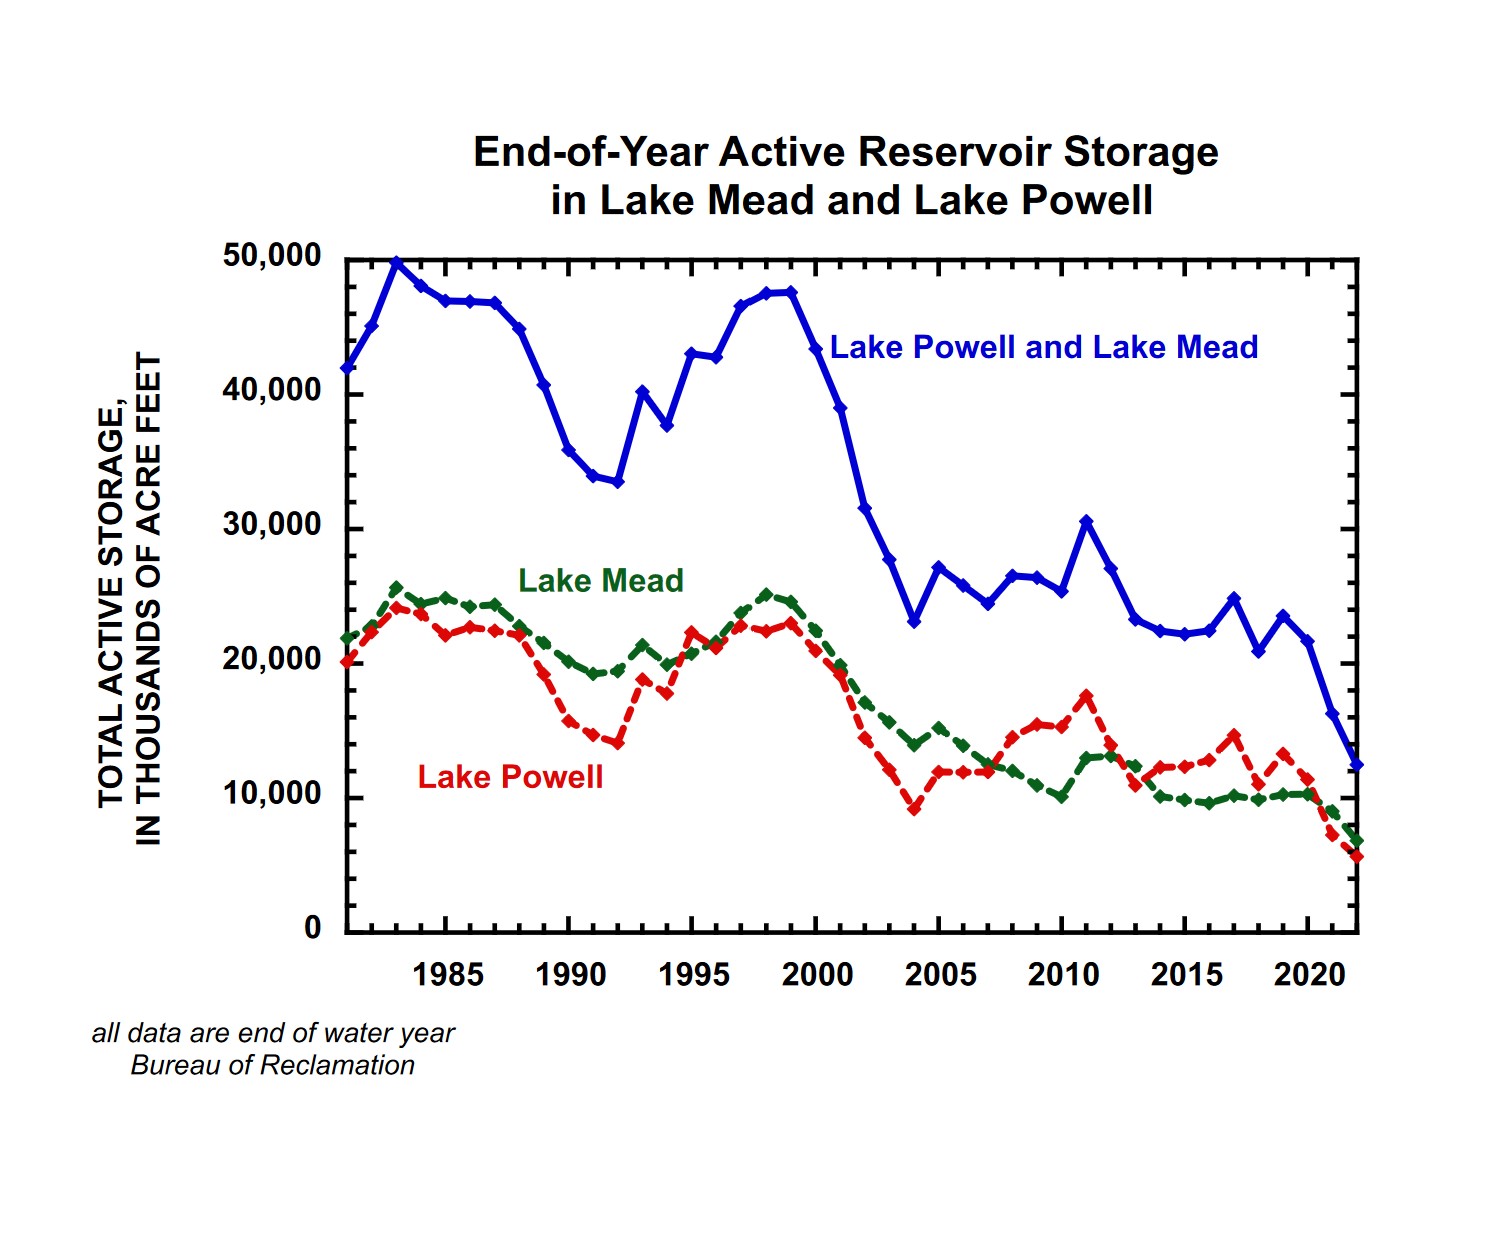
Reservoir storage is 66 percent less than it was in 2000.
Reclamation is concerned about the structural integrity of the river outlets at Glen Canyon Dam that will be continuously needed if Lake Powell falls below the minimum power pool elevation.
Las Vegas’s old water supply intakes – and dead bodies! – are emerging from the Lake Mead mud.
21ST CENTURY COLORADO RIVER WATER USE HAS EXCEEDED SUPPLY BY 1.2 MILLION ACRE FEET PER YEAR
The graph’s nuances are worth noting.
Blue dots represent each year’s total natural water supply – the sum of the natural water yield of the entire Upper Basin and of the many springs and tributaries that flow into the Colorado River in the Grand Canyon. This natural supply, not considering the Gila, Bill Williams, or Virgin Rivers, averaged 12.8 maf/yr (million acre feet per year) in the 21st century, 23% less than the average between 1981 and 1999.
To help visualize longer-term trends and cycles, we statistically smoothed the data to create the blue line, which more clearly shows the longer-term ups and downs of the Colorado River’s flow. The smooth line makes clear the wet periods of the 1980s and 1990s, and the deep droughts of the early 2000s and of today. Importantly for our current mess – the “wets” of the 21st century were not as wet, and the “drys” were drier, than those of the late 20th century.
The red line – total basin water use and reservoir evaporation loss (not including uses and losses in the Gila, Bill Williams, Virgin, or Little Colorado watersheds) – crept up through 2000 as the Central Arizona Project finally grew into the paper water allocations of the 20th century Law of the River.
Total consumptive uses and losses, including treaty deliveries to Mexico, peaked in 2000 at ~15.8 maf and were reduced during the next 2 years. Thereafter, average basin-wide consumptive uses and losses remained ~14.2 maf/yr between 2003 and 2020, and individual years were consistently within 4% of the average of that period. Throughout the 21st century, total Upper Basin uses and losses were ~30% of the basin-wide total.
Sustained consumptive uses and losses that exceed the natural supply can only be sustained by draining the reservoirs – but only so long as there is available water in the reservoirs. Thus, it is no surprise that the 21-year average (2000-2020) rate of water consumption and losses that exceeded the natural supply by ~1.2 maf/yr led to today’s crisis.
There were a few opportunities to rebuild reservoir storage, especially in 2005, 2008, 2009, 2011, 2017, and 2019, but a decades’ long water consumption rate that exceeds natural supply is unsustainable. The reservoirs are now mostly drained.
THE FAILURE TO REFILL
The reservoirs’ decline. Graph by Jack Schmidt, Utah State University
The history of water storage, described in the two graphs, has gone like this:
The reservoirs were brim full in the mid-1980s and lots of water passed through the delta to the Gulf of California
Reservoirs were somewhat depleted in the late 1980s and early 1990s when basin-wide consumption exceeded natural supply, but the reservoirs refilled in the late 1990s due to three years when supply greatly exceeded consumption (1993, 1995, and 1997). Thus, the reservoirs were relatively full in 2000 when the Millennium Drought began.
Reservoir storage greatly decreased thereafter when the natural supply was never greater than 11.7 maf/yr (2001) and was as low as 6.39 maf/yr (2002).
Reservoir storage stabilized at a new lower level thereafter when there were a few wetter years between 2006 and 2011. The last relatively wet year was 2019, but our continued use of large quantities of water was such that this sequence of somewhat wetter years was not used to rebuild reservoir storage.
Natural supply has been especially low between 2020 to 2022, averaging 9.4 maf/yr, which is far less than the basin-wide consumptive uses and losses that are approximately 14 maf/yr (we note that basin-wide consumptive use data are not available for 2021.)
Thus, today’s crisis – two decades of low natural supply, including some short, very dry periods, cannot sustain consumption and losses that exceed the natural supply and that have not significantly changed since 2003.
POLICY IMPLICATIONS
What are the policy implications of this analysis?
There has been a natural cyclicity of somewhat wetter and somewhat drier years, but the recent wet periods, when the reservoirs might have been refilled, have not been as wet as in the 1980s and 1990s.
The recent dry period that we are experiencing today since 2020 is comparable to the dry period of 2000-2005.
Reductions in consumptive water use and losses mandated by Commissioner Touton will need to remain in place through the end of the present very dry cycle and well into any future wetter cycle in order to rebuild reservoir storage.
The call for an immediate reduction of 2-4 maf/yr in consumptive uses and losses is an unprecedented reduction in relation to the pattern of use in the watershed since 2003.
Anything less than sustained reductions of the scale demanded by Touton’s ultimatum risks crashing the system – certainly if we get another year or two of very low runoff from the Rocky Mountains.
AN EXPLANATION OF OUR METHODOLOGY
The present water-supply crisis is a simple mass balance problem and we sought to describe this mass balance in the simplest way – averaging for the entire watershed
How did we consider inflows?
We used Reclamation’s estimates of natural flow at Lees Ferry, including the provisional data that are available for 2022. We used ~40 years of data.
We estimated inflows downstream from Lees Ferry that flow into Lake Mead based on the difference between USGS measurements made at Lees Ferry at the upstream end of the Grand Canyon and near Peach Springs, just upstream from Diamond Creek at the downstream end of the Grand Canyon. These data are available for 1990-2021, and we used the average for the 1990s as the estimated inflows of the 1980s. We used the average for the 2010s as the inflow in 2022. These data include inflows from the Paria and Little Colorado Rivers.
We added these two data sets as the available natural supply available for water users. We did not consider the natural inflow of the Virgin, Bill Williams, or Gila River because these rivers, with only rare exceptions like year 2005, are fully depleted and considered the sole domain for use by the Lower Basin states. Note that 2001-2005, Lower Basin use of these three tributaries was 2.2 maf/yr (the last years for which these data are available).
How did we estimate consumptive uses and losses?
We used Reclamation’s Consumptive Uses and Losses reports and Water Accounting reports
For the Upper Basin, we used revised and peer reviewed data prior to 1995 and provisional data 1996 to 2020. Data for 2021 are not available.
For the Lower Basin, we used Colorado River system summaries prior to 2005.
For the Lower Basin, we used Water Accounting reports 2006-2021.
We assumed that Lower Basin mainstem reservoir evaporation 2006-present was same as the average for 2001-2005 (1.1 maf/yr).
We only considered Treaty deliveries to Mexico as a use, and large surplus flows of the 1980s and 1990s were assumed to have passed to the sea.
We assumed that the uncertainty of all values was 2 or 3 significant digits and rounded off our calculations accordingly.
THE AUTHORS
Jack Schmidt is Janet Quinney Lawson Chair in Colorado River Studies, Center for Colorado River Studies, Watershed Sciences Department, Utah State University
John Fleck is Writer in Residence at the Utton Transboundary Resources Center, University of New Mexico School of Law; Professor of Practice in Water Policy and Governance in UNM’s Department of Economics; and former director of UNM’s Water Resources Program.
Eric Kuhn is retired general manager of the Colorado River Water Conservation District based in Glenwood Springs, Colorado, and spent 37 years on the Engineering Committee of the Upper Colorado River Commission. Kuhn is the co-author, with Fleck, of the book Science Be Dammed: How Ignoring Inconvenient Science Drained the Colorado River.
Click the link to read the article on the NOAA website:
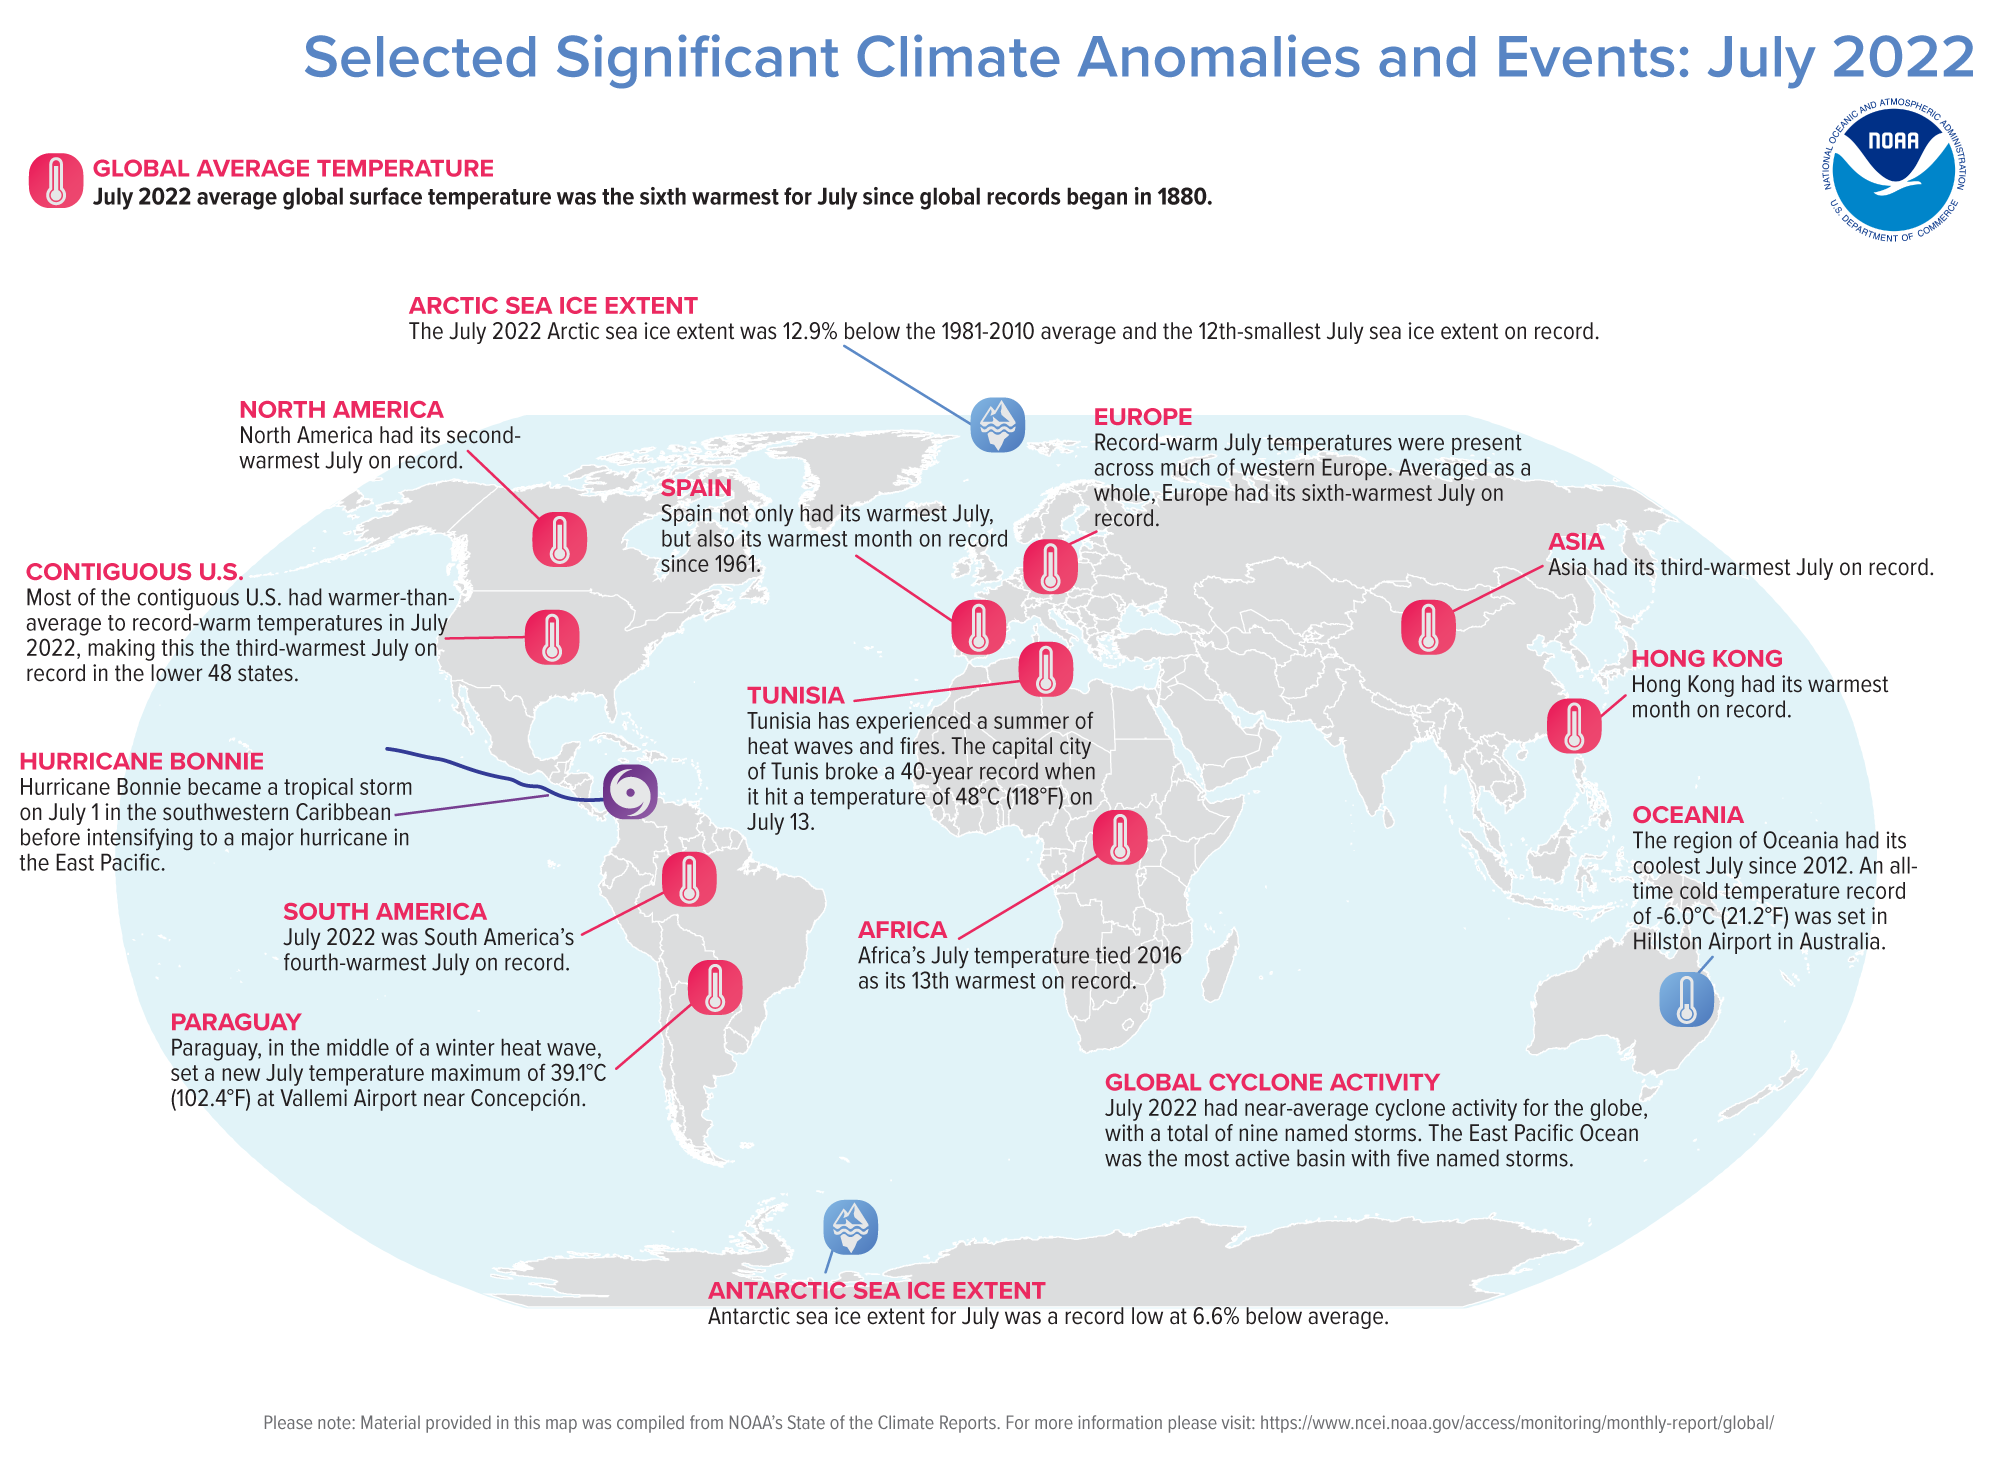
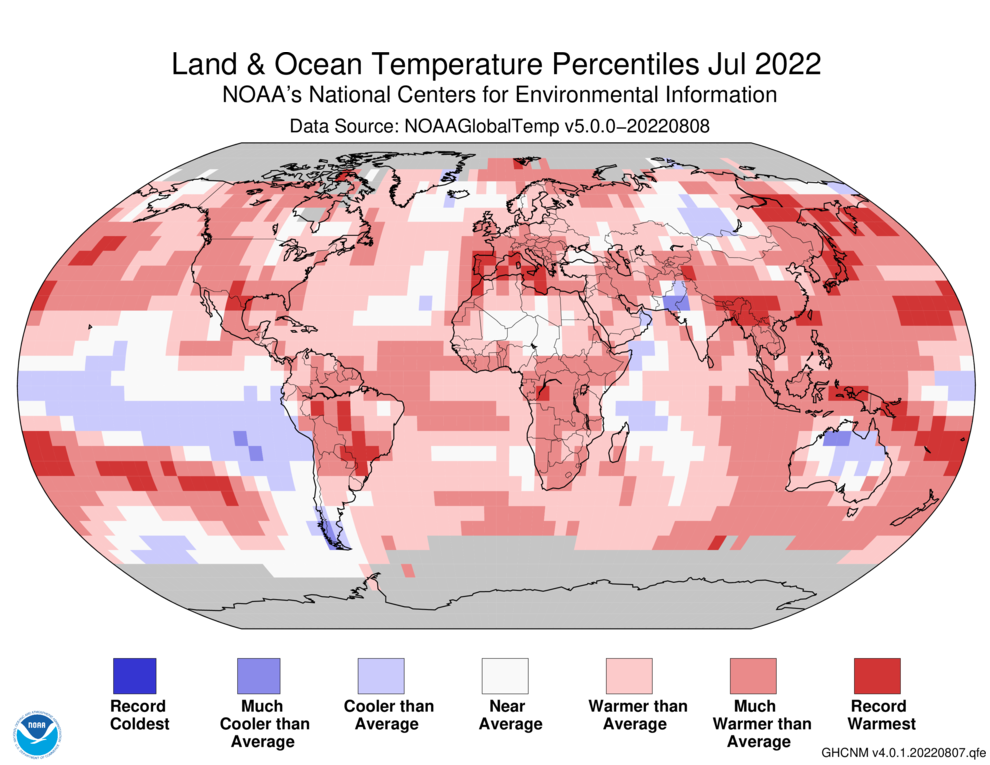
Globally, July 2022 was the sixth-warmest July in the 143-year NOAA record. The year-to-date (January-July) global surface temperature was also the sixth-warmest on record. According to NCEI’s Global Annual Temperature Outlook, there is a greater than 99% chance that 2022 will rank among the 10-warmest years on record but only an 11% chance that it will rank among the top five.
A map of the world plotted with some of the most significant climate events that occurred during July 2022. Please see the story below as well as more details in the report summary from NOAA NCEI at http://bit.ly/Global202207.
This monthly summary, developed by scientists at NOAA’s National Centers for Environmental Information, is part of the suite of climate services NOAA provides to government, business, academia and the public to support informed decision-making.
Monthly Global Temperature
The July global surface temperature was 1.57°F (0.87°C) above the 20th-century average of 60.4°F (15.8°C). This ranks as the sixth-warmest July in the 143-year record. July 2022 marked the 46th consecutive July and the 451st consecutive month with temperatures, at least nominally, above the 20th-century average. The five warmest Julys on record have all occurred since 2016.
July 2022 was among the top 10 warmest Julys on record for several continents. North America had its second-warmest July on record. Asia had its third-warmest July on record, and its second-warmest year-to-date. South America had its fourth-warmest July, while July 2022 was the sixth-hottest July on record for Europe.
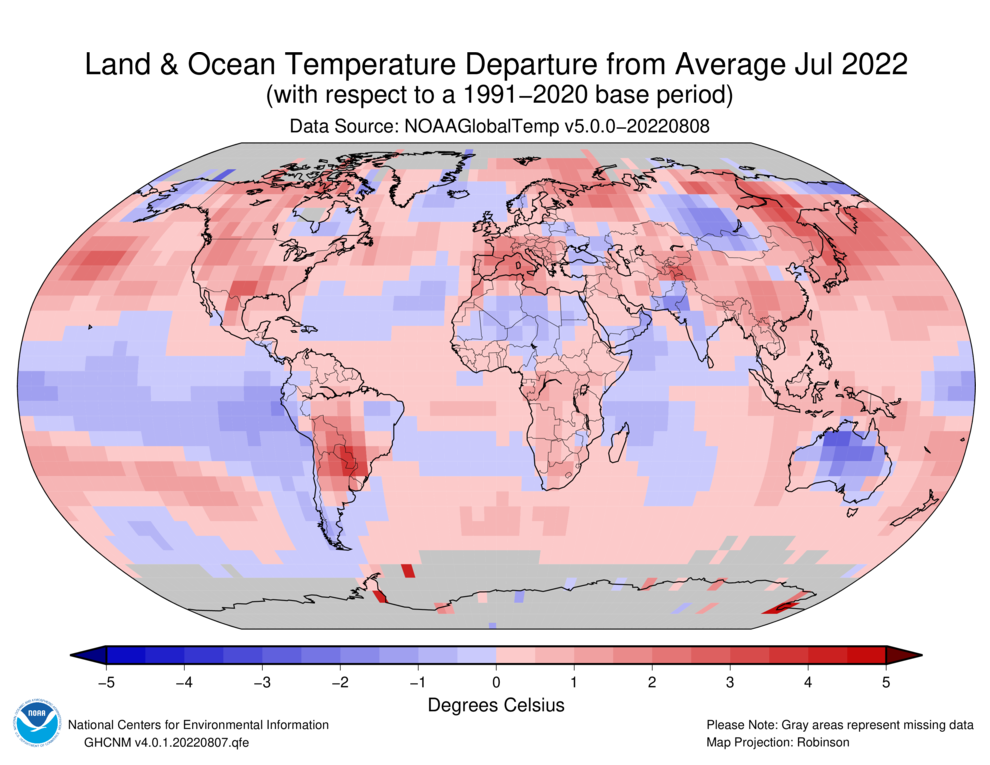
Temperatures were above average throughout most of North America, Europe, and Asia and across parts of northern and southern Africa, China, Japan, central South America, the Arabian Peninsula, and northern Oceania. Parts of Spain, Portugal, Italy, the United Kingdom, Japan, China, northern Africa, and central South America experienced record-warm temperatures for July. Sea surface temperatures were above average across much of the Gulf of Mexico and the northern, western, and southwestern Pacific, as well as parts of the Atlantic and eastern Indian oceans.
Temperatures were near- to cooler-than-average throughout most of Australia and across parts of southern South America, western India, Pakistan, and central Russia. Consistent with La Niña, sea surface temperatures were below average over much of the south-central, central, and eastern tropical Pacific. None of the world’s surface had a record-cold temperature in July.
Sea Ice
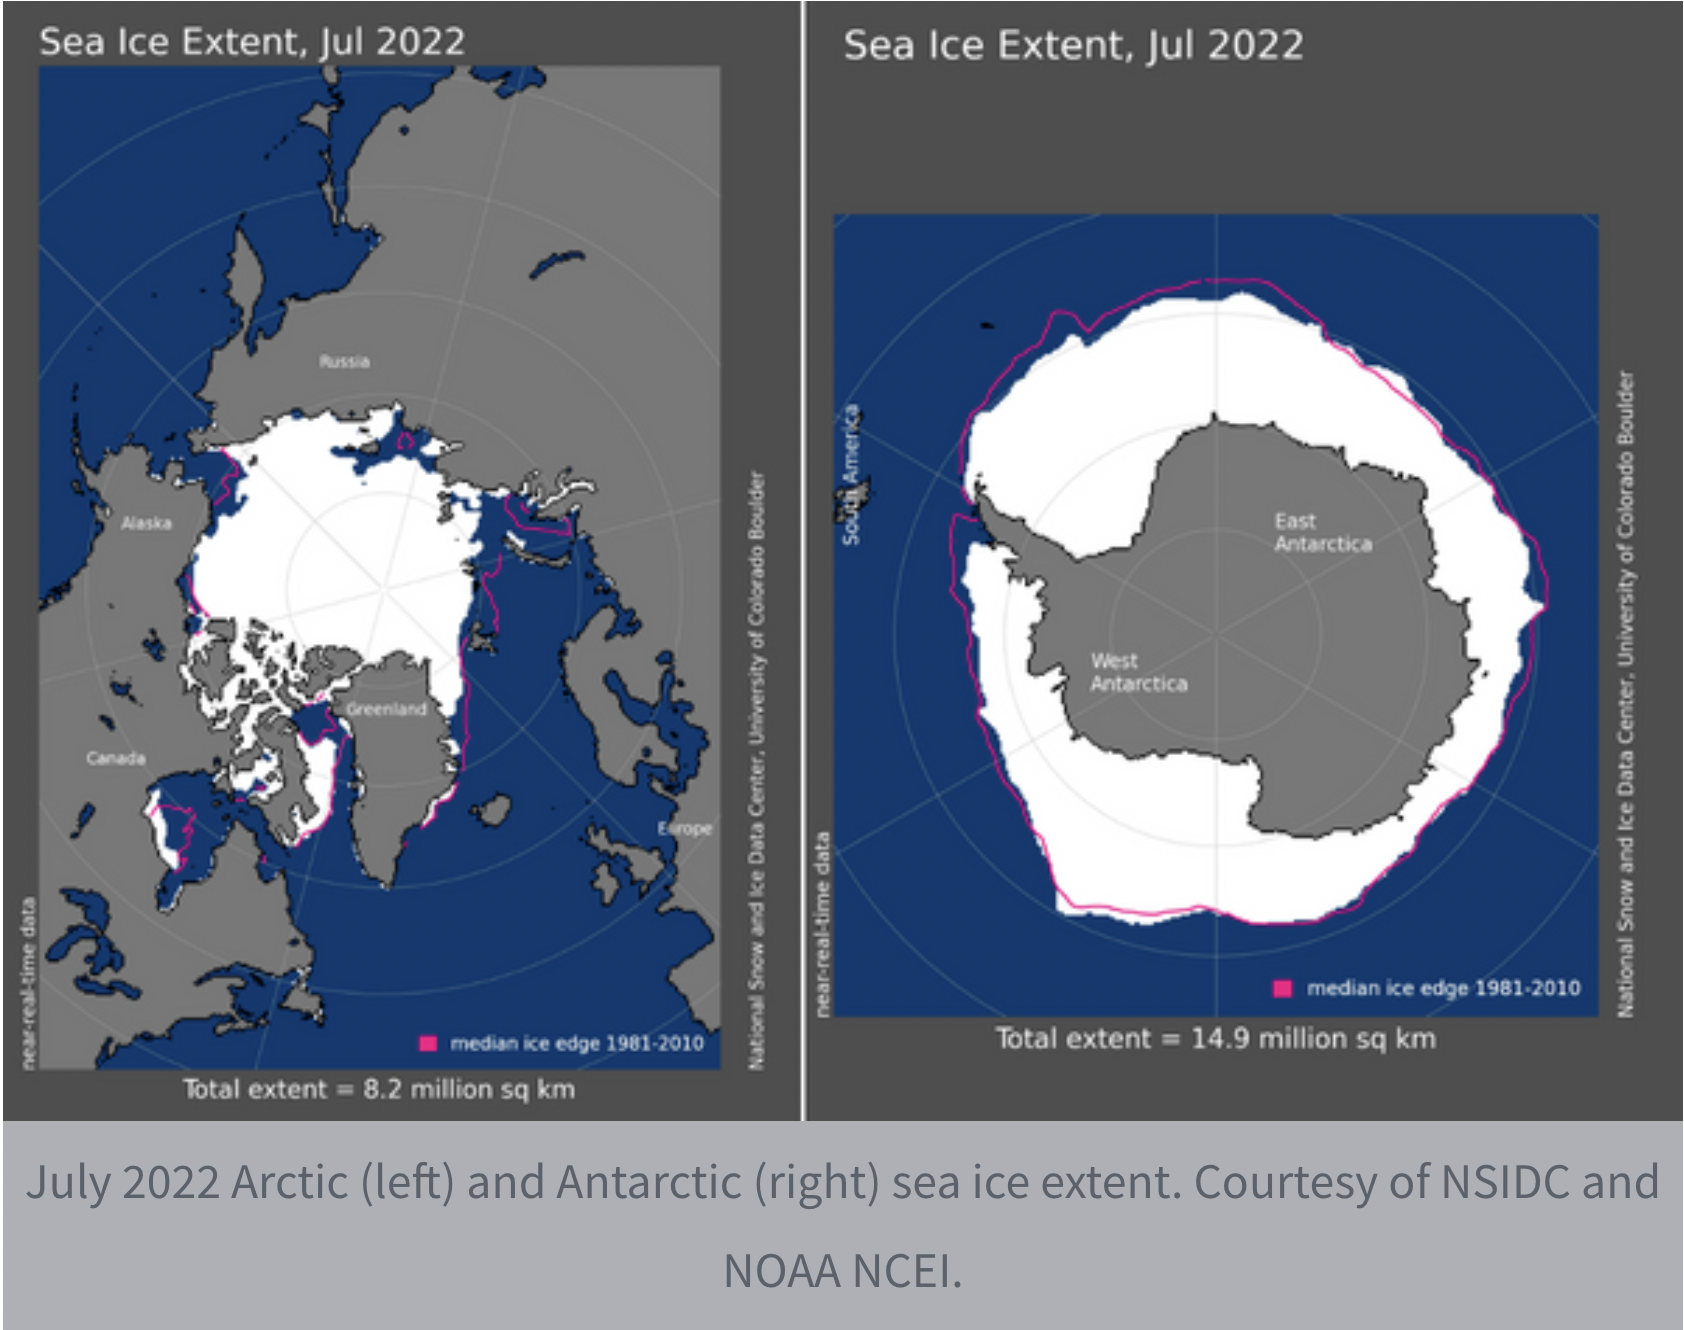
Globally,July 2022 saw the third-lowest July sea ice extent on record. Only the Julys of 2019 and 2020 had a smaller sea ice extent.
uly 2022 Arctic (left) and Antarctic (right) sea ice extent. Courtesy of NSIDC and NOAA NCEI.
Arctic sea ice extent in July averaged 3.19 million square miles, which is 471,000 square miles — roughly the size of South Africa — below the 1981-2010 average and the 12th-smallest July extent in the 44-year record. Regionally, sea ice extent was well below average in the Barents, Kara, and Greenland seas, the Sea of Okhotsk, and the Hudson Bay. Conditions in Baffin Bay and the Chukchi and Eastern Siberian seas were near-normal or slightly-below average, whereas the Bering and Beaufort seas had above-average extents for July.
Antarctic sea ice extent for July was a record low at 5.75 million square miles, or about 409,000 square miles below average. According to an analysis by the National Snow and Ice Data Center (NSIDC) using data from NOAA and NASA, low ice extent persists in the Weddell and Bellingshausen seas and the eastern Antarctic coast.
Global Tropical Cyclones
July 2022 produced nine named storms across the globe, which is near-normal activity for July. Five storms reached tropical cyclone strength (74 mph), and two (Hurricanes Bonnie and Darby) reached major tropical cyclone strength (111 mph). The global cyclone activity for January through July remains slightly below average by most metrics.
A high desert thunderstorm lights up the sky behind Glen Canyon Dam — Photo USBR
Click the link to read the article on the KUNC website (Luke Runyon). Here’s an excerpt:
“Success is dependent on what happens in the Lower Basin,” [Rebecca] Mitchell said. “Anything we can do is meaningless unless there are actual cuts to what’s being used in the Lower Basin.”
Mitchell’s comments come ahead of a federal deadline on Tuesday.
In July officials from Colorado, Wyoming, New Mexico and Utah submitted a five-point plan that did not provide specific targets for conservation. In their letter to the Bureau of Reclamation, the states called for the revival of a conservation program from 2015 that paid farmers to temporarily restrict their uses. The letter also endorsed the possibility of releases from reservoirs upstream of Lake Powell to bolster its flagging levels. Providing a specific volume to conserve would be unfair to water users in her state, Mitchell said, and any commitment would be premature given that the river’s Lower Basin states have yet to come to an agreement on their conservation plans. Negotiations have stalled among the river’s Lower Basin states, according to sources familiar with the talks, making a seven-state agreement on where to find the 2 to 4 million acre-feet in savings unlikely ahead of the deadline. It’s unclear how the federal government will respond if the states fail to meet their demands.
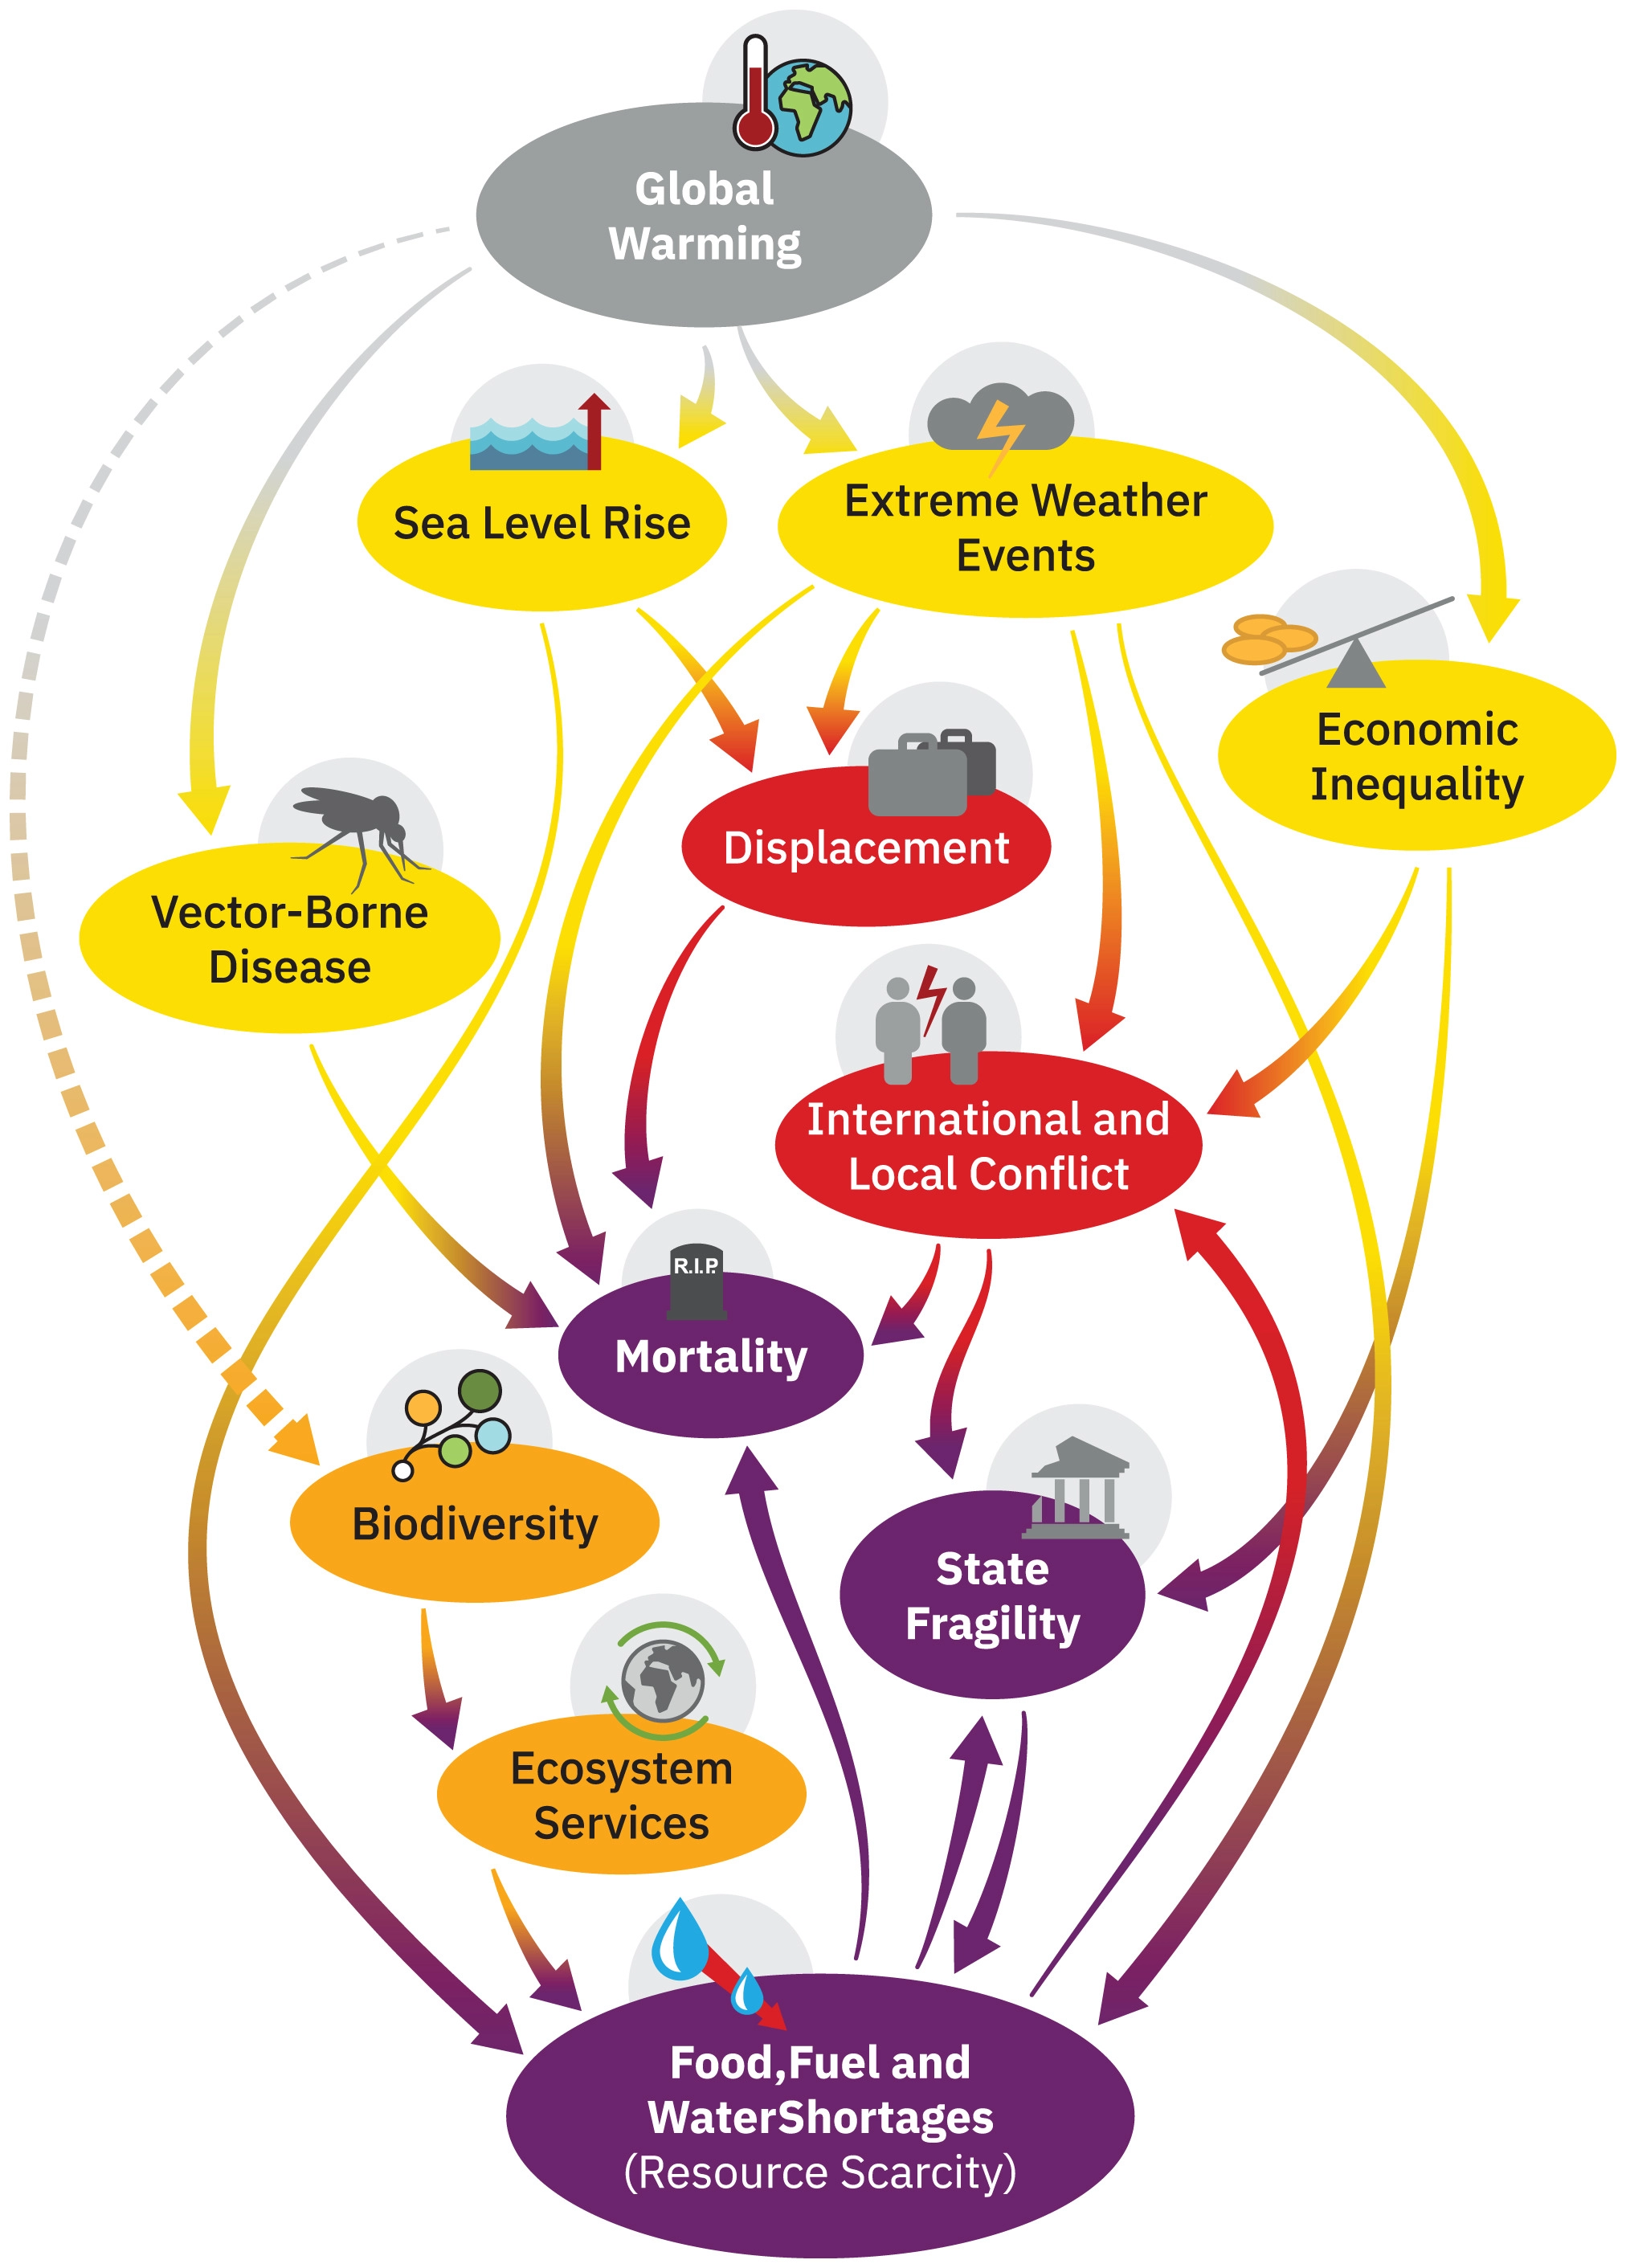
Cascading global climate failure. This is a causal loop diagram, in which a complete line represents a positive polarity (e.g., amplifying feedback; not necessarily positive in a normative sense) and a dotted line denotes a negative polarity (meaning a dampening feedback). See SI Appendix for further information.
Click the link to access the paper on the PNAS website (Luke Kemp, Chi Xu, Joanna Depledge, Kristie L. Ebi, Goodwin Gibbins, Timothy A. Kohler, Johan Rockström, Marten Scheffer, Hans Joachim Schellnhuber, and Timothy M. Lenton). Here’s the abstract:
Prudent risk management requires consideration of bad-to-worst-case scenarios. Yet, for climate change, such potential futures are poorly understood. Could anthropogenic climate change result in worldwide societal collapse or even eventual human extinction? At present, this is a dangerously underexplored topic. Yet there are ample reasons to suspect that climate change could result in a global catastrophe. Analyzing the mechanisms for these extreme consequences could help galvanize action, improve resilience, and inform policy, including emergency responses. We outline current knowledge about the likelihood of extreme climate change, discuss why understanding bad-to-worst cases is vital, articulate reasons for concern about catastrophic outcomes, define key terms, and put forward a research agenda. The proposed agenda covers four main questions: 1) What is the potential for climate change to drive mass extinction events? 2) What are the mechanisms that could result in human mass mortality and morbidity? 3) What are human societies’ vulnerabilities to climate-triggered risk cascades, such as from conflict, political instability, and systemic financial risk? 4) How can these multiple strands of evidence—together with other global dangers—be usefully synthesized into an “integrated catastrophe assessment”? It is time for the scientific community to grapple with the challenge of better understanding catastrophic climate change.
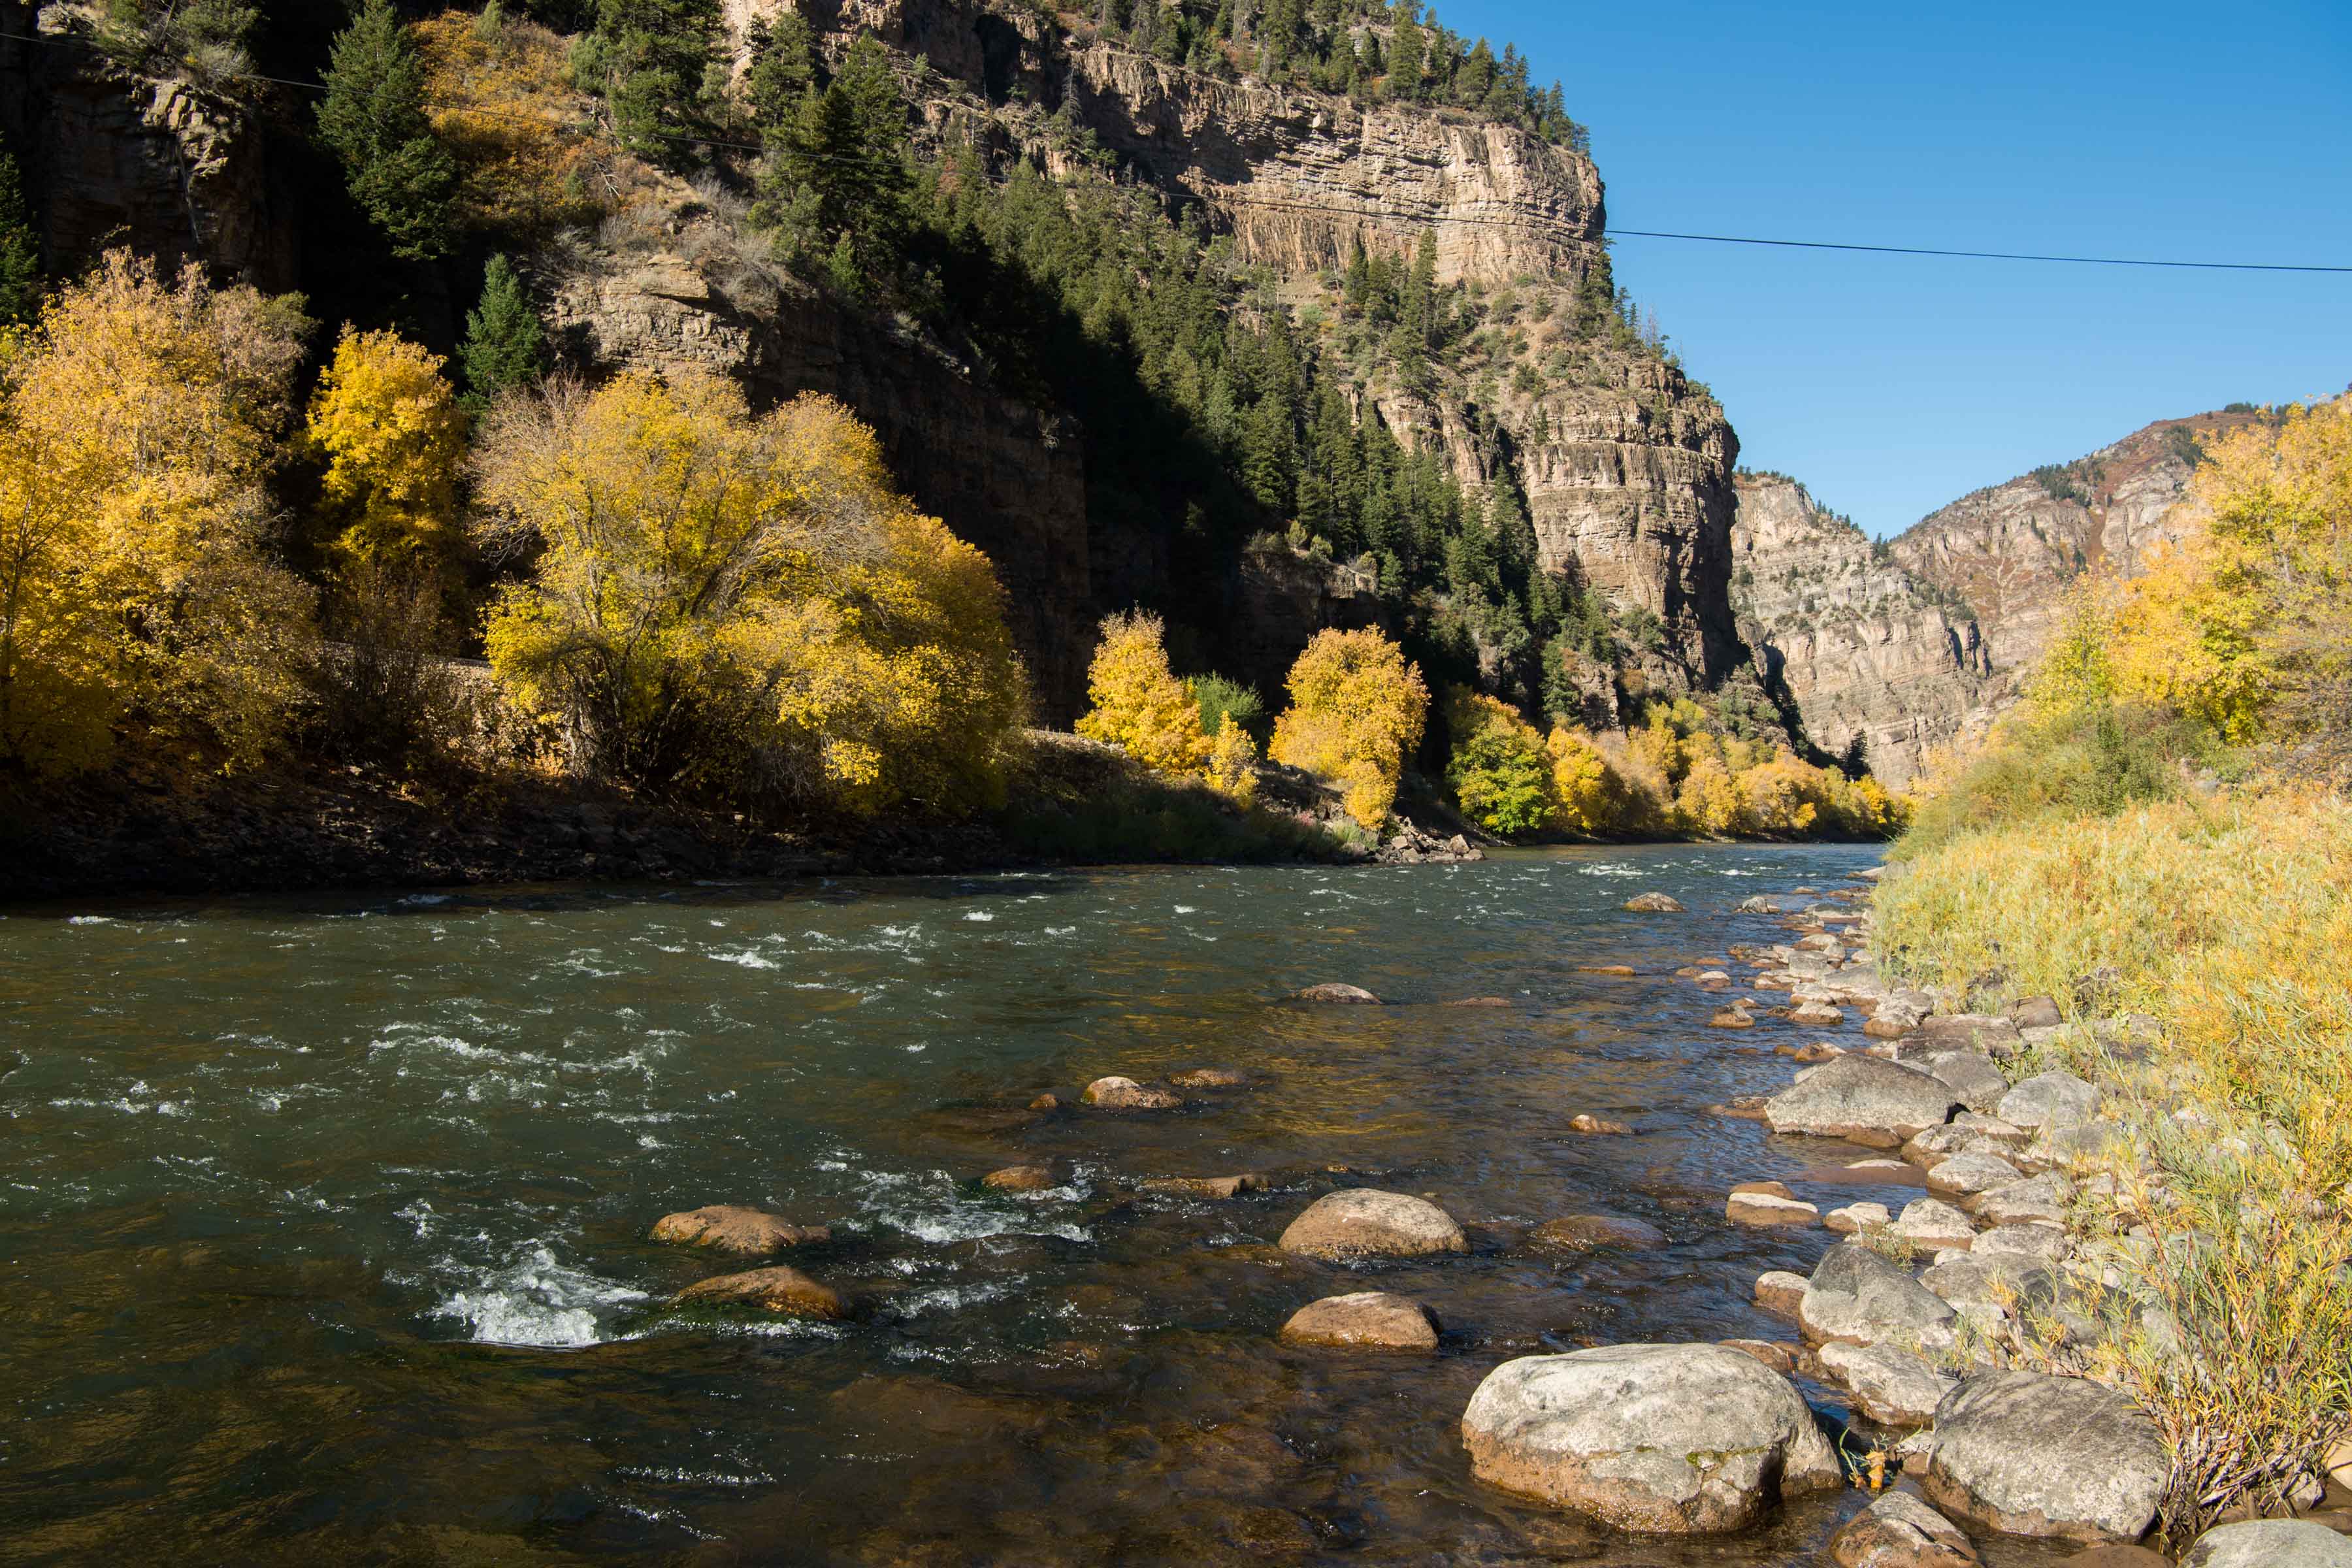
Photo shows the Colorado River flanked by fall colors east of Glenwood Springs, Colorado. Photo credit: USBR
Click the link to read the article on The Aspen Times website (John LaConte). Here’s an excerpt:
When the U.S. Senate passed the Inflation Reduction Act on Sunday, Western legislators breathed a sigh of relief after feeling victorious in an effort to see funding included for the Bureau of Reclamation to combat drought in the Colorado River Basin. U.S. Senators Michael Bennet, D-Colo., Catherine Cortez Masto, D-Nev., and Mark Kelly, D-Ariz., announced the agreement, which could see billions go toward “voluntary system conservation projects that achieve verifiable reductions in use of or demand for water supplies or provide environmental benefits in the Lower Basin or Upper Basin of the Colorado River,” over the next few years, according to the bill text.
The announcement comes amid one of the hottest summers on record for the Colorado River, which saw temperatures hit 75 degrees Fahrenheit near Dotsero in July. That’s a full 5 degrees higher than the temperatures deemed safe for fishing, and full-day voluntary fishing restrictions were placed on the river in Eagle County.
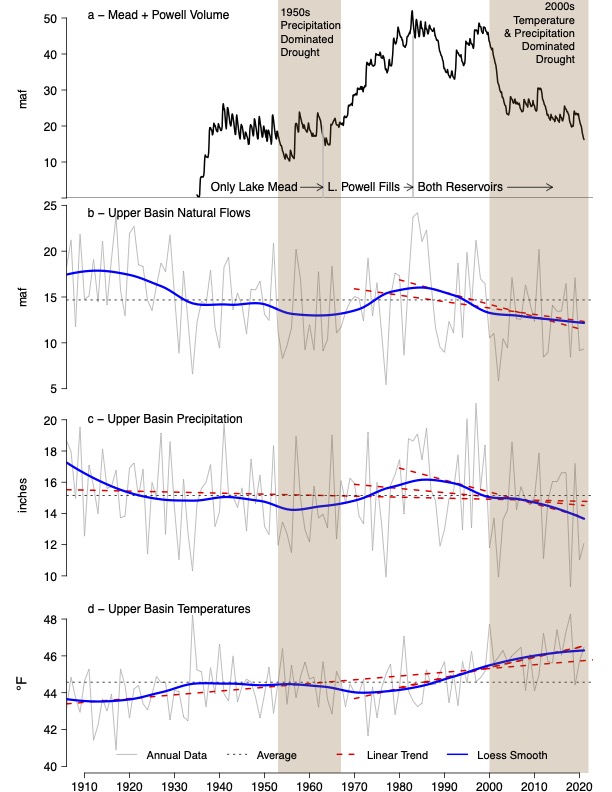
Brad Udall: Here’s the latest version of my 4-Panel plot thru Water Year (Oct-Sep) of 2021 of the Colorado River big reservoirs, natural flows, precipitation, and temperature. Data (PRISM) goes back or 1906 (or 1935 for reservoirs.) This updates previous work with @GreatLakesPeck.
Andrew Mueller, the general manager of the Colorado River Water Conservation District in Glenwood, also testified at the hearing, telling the committee that the flows of the Colorado River have been 20% below average over the last 22 years….an original draft of the bill did not contain any money to combat drought in the Colorado River Basin. Bennet started advocating for drought money to be added to the bill, a source close to the negotiations told the Vail Daily, and found support from Sen. Kyrsten Sinema, D-Ariz., along with Kelly and Cortez Masto. The result is a $4 billion package that will flow through states and public entities like water conservation districts and tribes in an attempt to enact both short-term and long-term solutions for drought in the West.
In the past, similar efforts have allowed conservation groups like Trout Unlimited to access funds for habitat work through the Bureau of Reclamation, and the climate bill passed by the Senate on Sunday also calls for funds to be used for “ecosystem and habitat restoration projects to address issues directly caused by drought in a river basin or inland water body.”