Chapter 1: An introduction to sustainability within the car industry
We hear a lot about sustainability – how to live more sustainably, how to make more sustainable decisions and how to buy sustainable products. But what role does sustainability play in the car industry?
Well, sustainability focuses around the idea that we need to meet our current needs without compromising the ability of future generations to do the same. This means that goods should be produced in a way that causes little (or no) damage to the environment.
We’ve seen a growing focus on sustainability across industries. It’s much easier to buy products made from recycled and/or recyclable materials, find information on where goods are sourced from, and have access to a greater choice of ethical services.
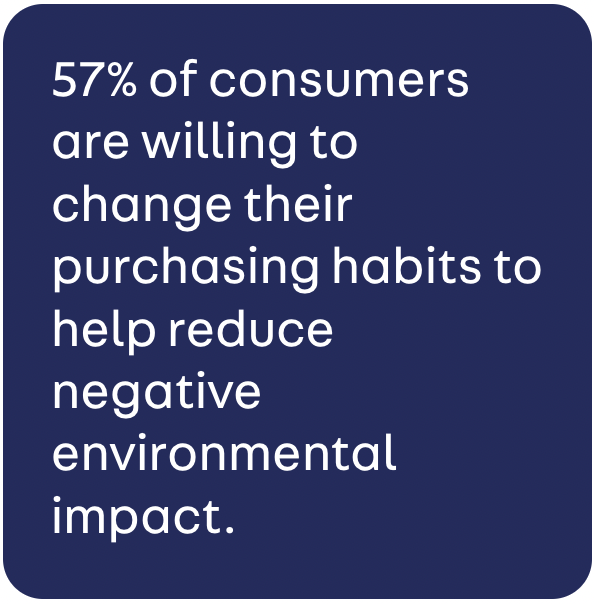
These are all things that we appreciate. An IBM study found that 57% of consumers are willing to change their purchasing habits to help reduce negative environmental impact. While recycling more or shopping locally are smaller decisions than purchasing a car, they are all important steps in the right direction. These changing habits signal a shift in priorities towards increasingly sustainable choices.
Experts predict that value and ease will continue to be the largest factors in buying decisions for some time, but rounding up the top three will be sustainability.
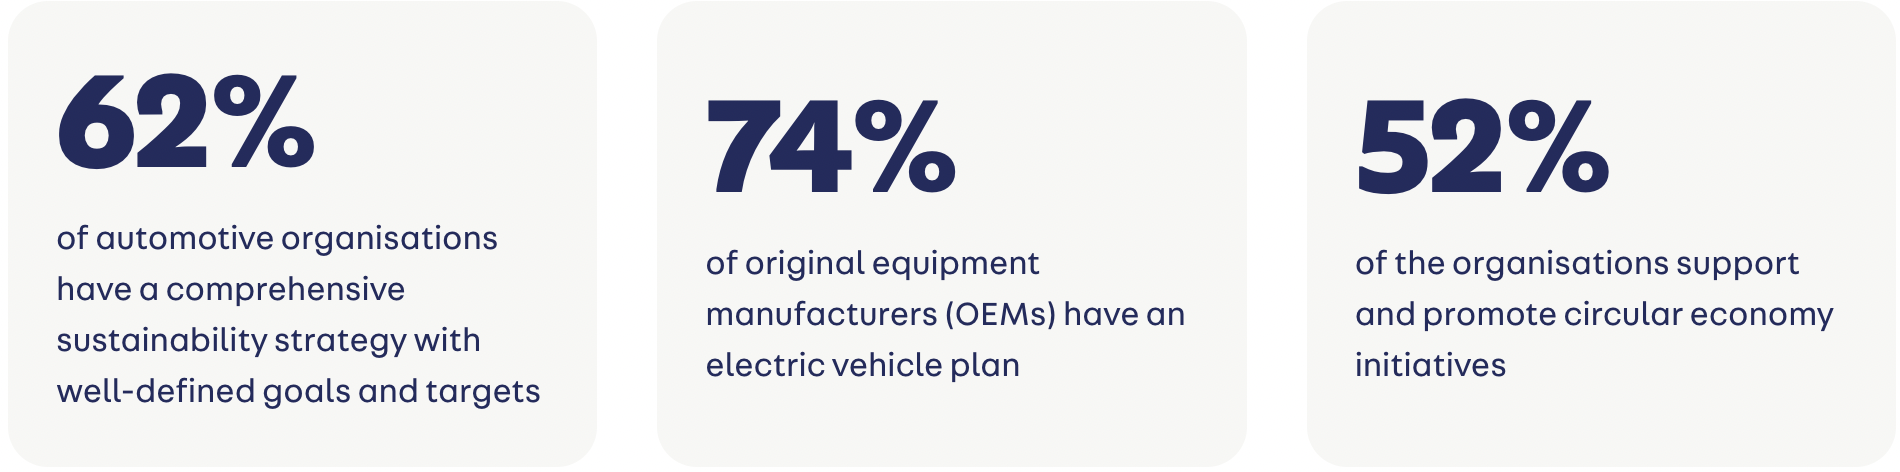
For the automotive industry, it can be a tough balancing act. But one thing is clear: sustainability is a strategic priority that’s here to stay. In a Capgemini Research Institute survey of 500 large automotive organisations, as well as 300 related experts, it was found that:
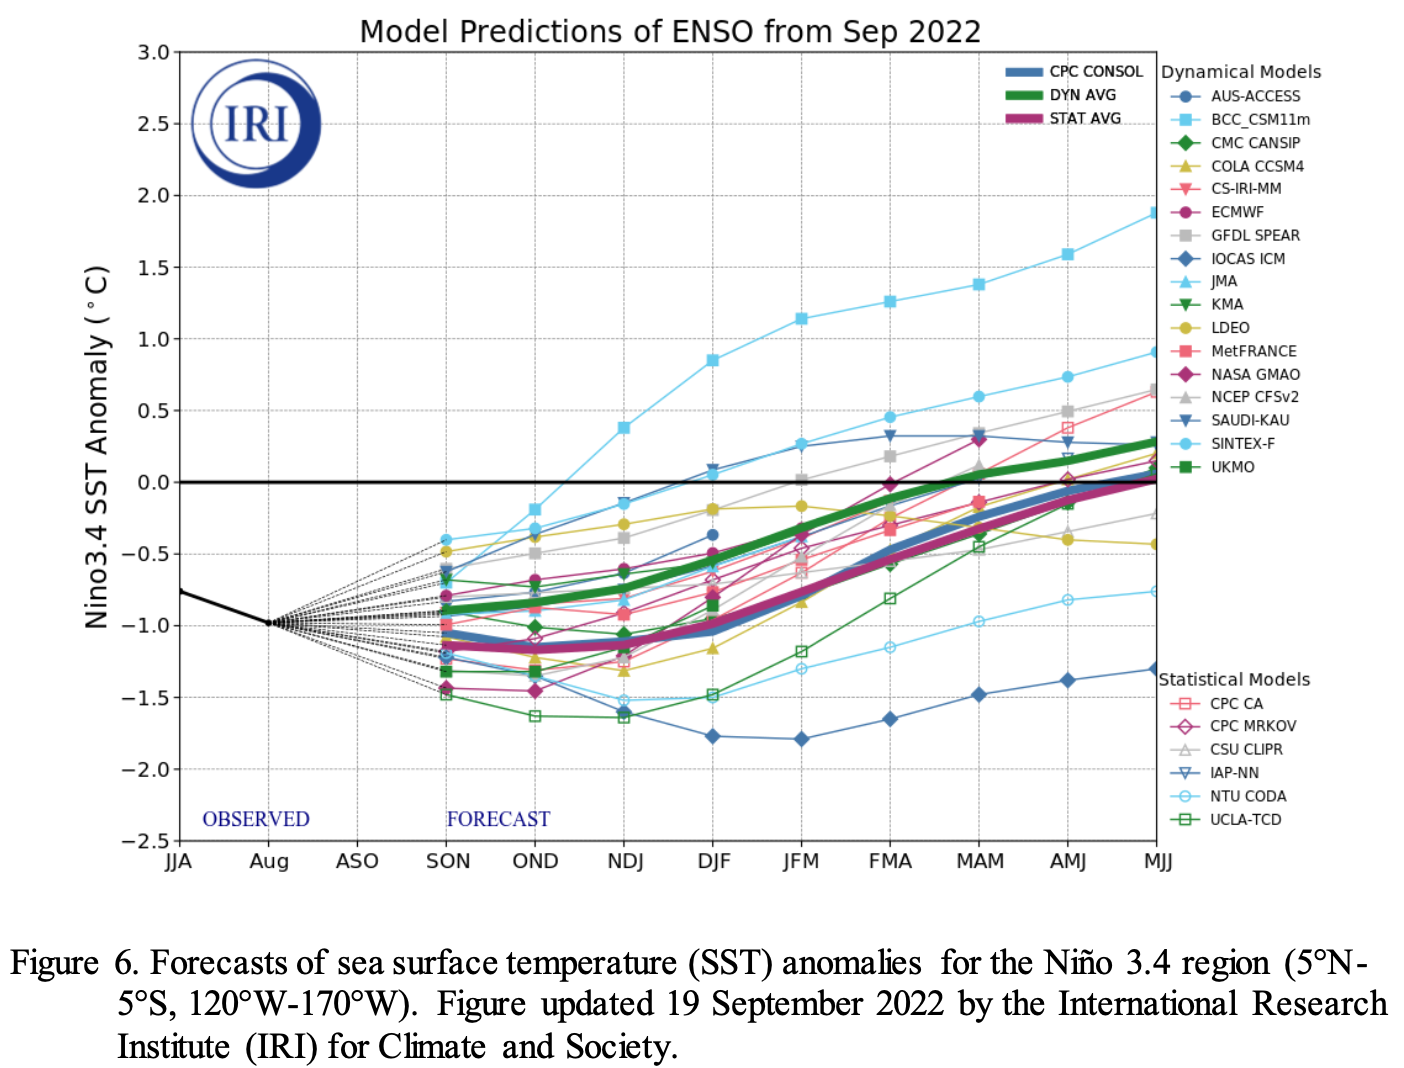
Synopsis: There is a 75% chance of La Niña during the Northern Hemisphere winter (December–February) 2022-23, with a 54% chance for ENSO-neutral in February-April 2023.
Pacific Ocean during September. Most of the Niño indices decreased during the past month, with the latest weekly index values spanning – 0.8C to-1.6C. For the last couple of months, negative subsurface temperature anomalies remained mostly unchanged, reflecting the persistence of below-average temperatures across the eastern Pacific Ocean. Low-level easterly wind anomalies and upper-level westerly wind anomalies prevailed across most of the equatorial Pacific. Convection was suppressed over the western and central tropical Pacific and was enhanced over Indonesia. Overall, the coupled ocean-atmosphere system continued to reflect La Niña.
The most recent IRI plume forecast of the Niño-3.4 SST index indicates La Niña will persist into the Northern Hemisphere winter 2022-23, and then transition to ENSO-neutral in January-March 2023. The forecaster consensus for this month favors a slightly later transition to ENSO-neutral, during February-April 2023, which is consistent with the latest North American Multi-Model Ensemble (NMME). However, predicting the timing of transitions is challenging, and there continues to be uncertainty over how long La Niña may last. In summary, there is a 75% chance of La Niña during the Northern Hemisphere winter (December-February) 2022-23, with a 54% chance for ENSO-neutral in February-April 2023.
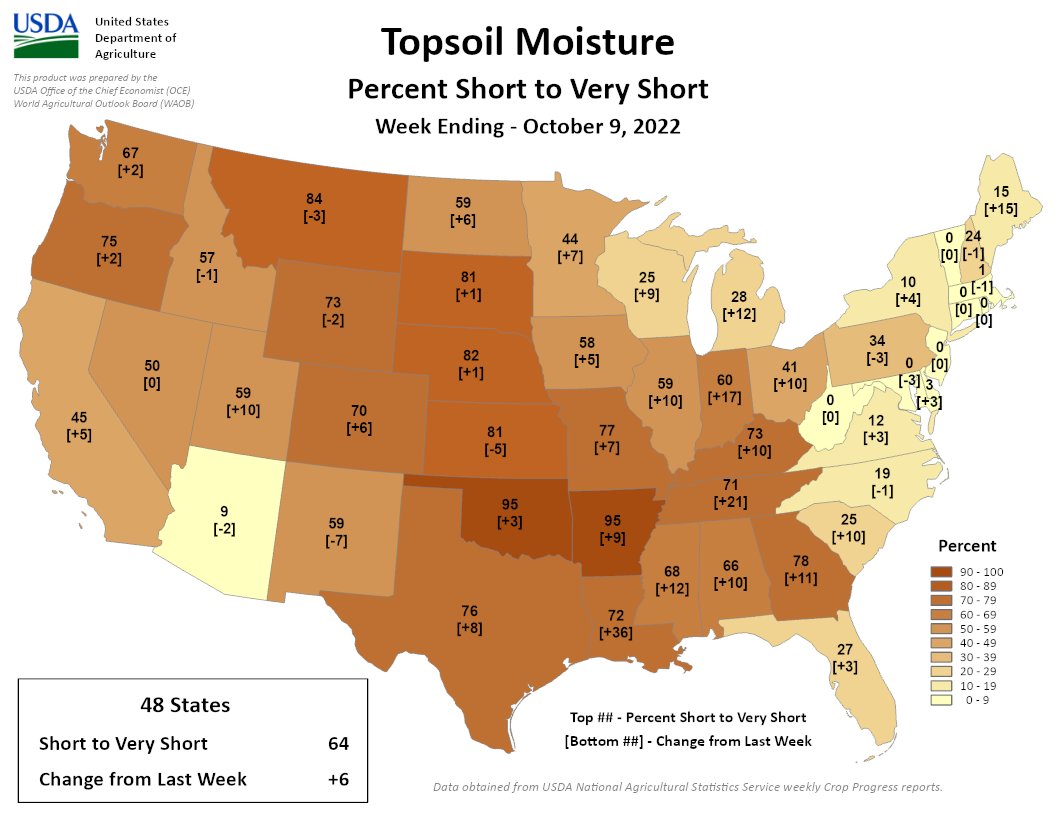
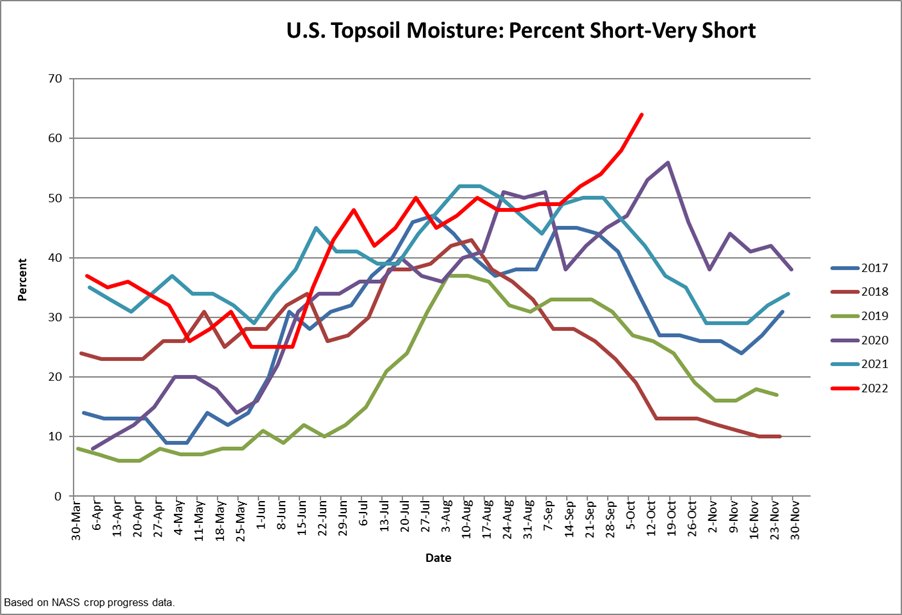
Water levels are approaching their lowest in a generation, forcing emergency dredging to keep commerce flowing
Areas of persistent and developing drought stretch across much of the Mississippi basin, which itself covers 41 percent of the contiguous United States. Though record-setting storms caused catastrophic flooding in parts of the watershed this summer, the past few months have been among the driest on record in parts of the Heartland, at a time of year when river levels are normally hitting their low points. And long-term forecasts suggest that unusually dry weather is likely to continue. At some spots, gauges reported the Mississippi’s river stages — a measure of water height normally used to evaluate flood conditions — with negative values, an indication of how far below normal levels the waters have receded…
There’s also a risk for drinking water. The relative trickle that is reaching the river’s mouth in Louisiana’s outlying Plaquemines Parish is allowing salt water to intrude up the Mississippi from the Gulf of Mexico, threatening to taint drinking water drawn from the river and requiring emergency action by the Army Corps of Engineers.
Repeatedly over the past week, water levels have become too low for barges to float, requiring the corps to halt maritime traffic on the river and dredge channels deep enough even for barges carrying lighter-than-normal loads. Days after a queue of stalled river traffic grew to more than 1,700 barges during emergency dredging near Vicksburg, Miss., a separate 24-hour dredging closure began Tuesday near Memphis. More dredging, which routinely costs billions of dollars a year, could be needed if barges continue to run aground.
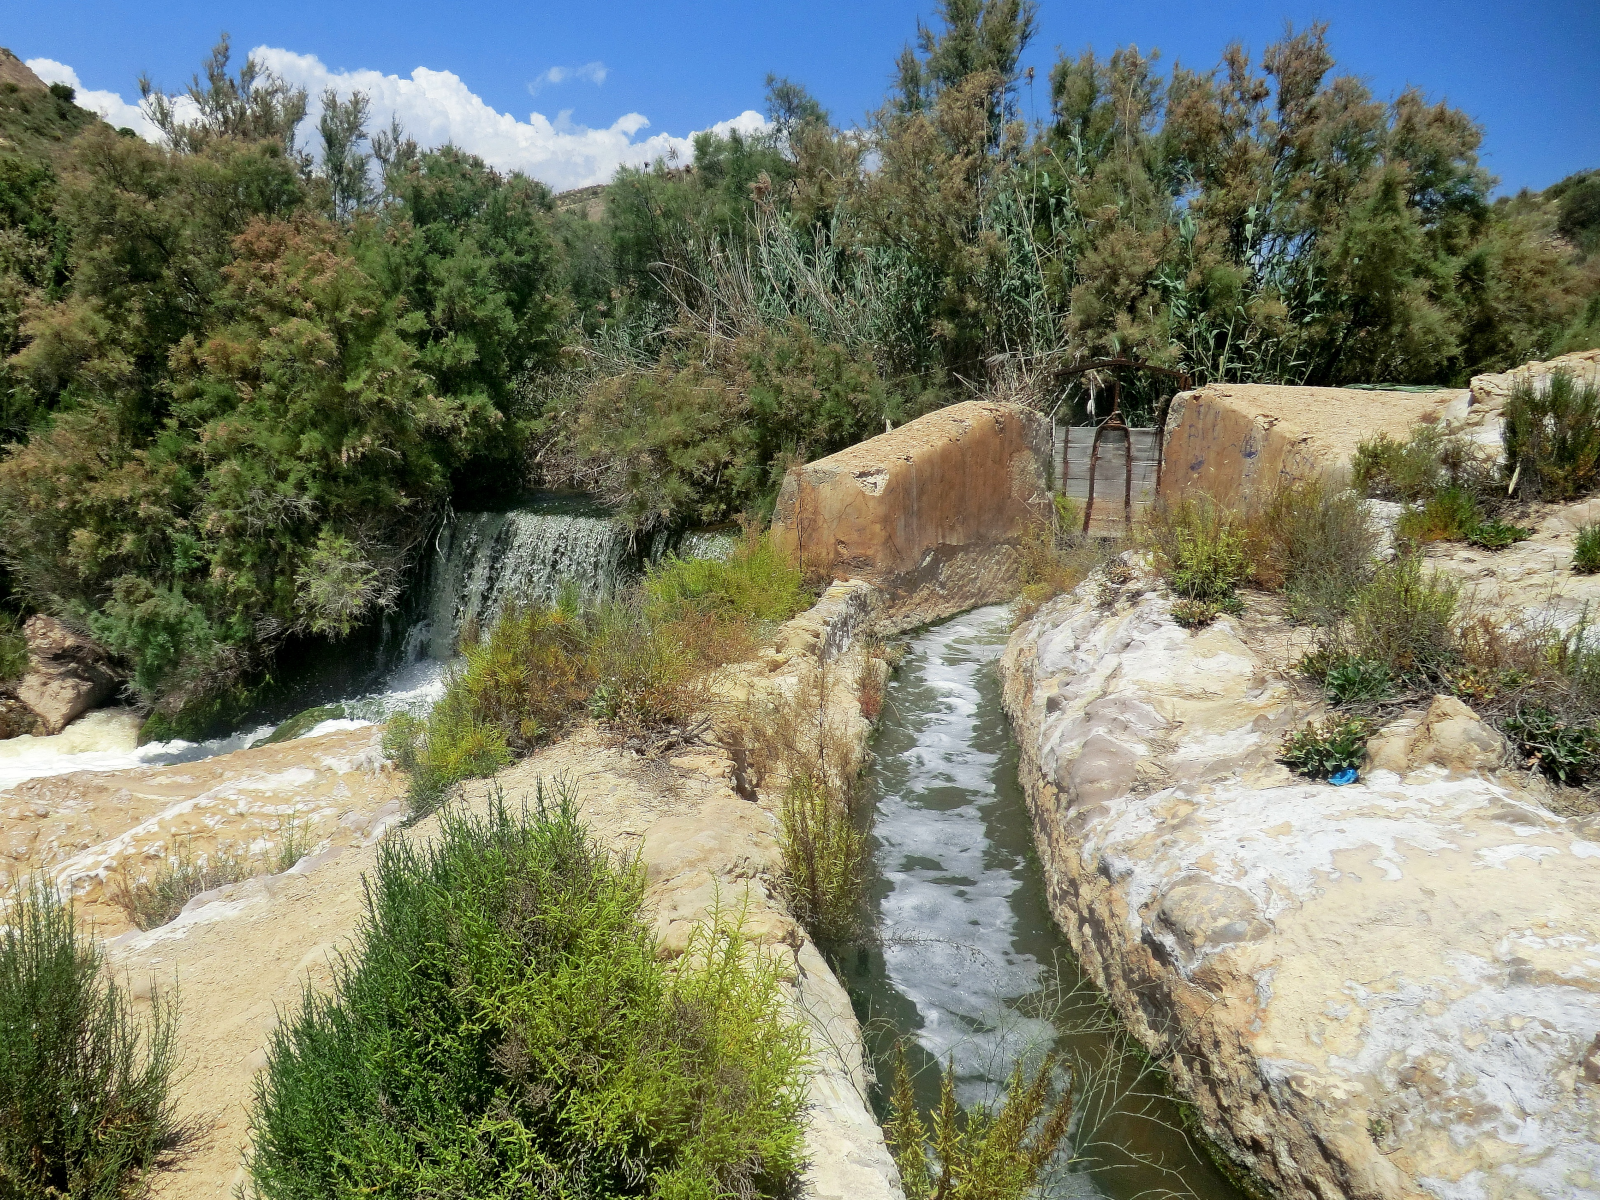
The main acequia, Elche Oasis, Vallongas, Elche, Valencia, Spain in May 2012. Water Alternatives Photos, CC BY 2.0 , via Wikimedia Commons
Click the link to read the article on the BBC website (Kira Walker). Here’s an excerpt:
An ancient Moorish invention has been providing water to the Sierra Nevada mountains for more than 1,000 years, making life possible in one of Europe’s driest regions.
For over a millennium, this acequia – from the Arabic as-saqiya, meaning “water conduit” or “water bearer” – has provided irrigation and drinking water to Mecina-Bombarón, enabling survival and agricultural prosperity in the semi-arid environment. The methods used by acequieros – people with expert skills in water catchment and allocation – to tend the channels today differ little from those used in the Middle Ages…The Islamic water management techniques introduced from the east transformed the landscape and agriculture in what was then Al-Andalus. Acequias made life possible for agrarian communities, conserving and distributing scant and seasonal water resources throughout the rugged mountains. In the newly fertile conditions, the abundance of crops introduced by the Moors thrived, among them almonds, artichokes, chickpeas, aubergine (eggplant), lemons, pomegranates, spinach, quince, walnuts and watermelon.
Though ancient, this traditional water management system is sustainable, efficient and resilient. As climate change worsens, the network will become even more important for helping communities in the Sierra Nevada cope and equitably share an increasingly scarce and unpredictable resource. While this ancient system is needed now more than ever, it’s threatened like never before. As traditional irrigation systems struggle with a lack of profitability compared with intensive agriculture and the rural exodus continues, increasingly few people still hold the skills and knowledge required to maintain acequias.
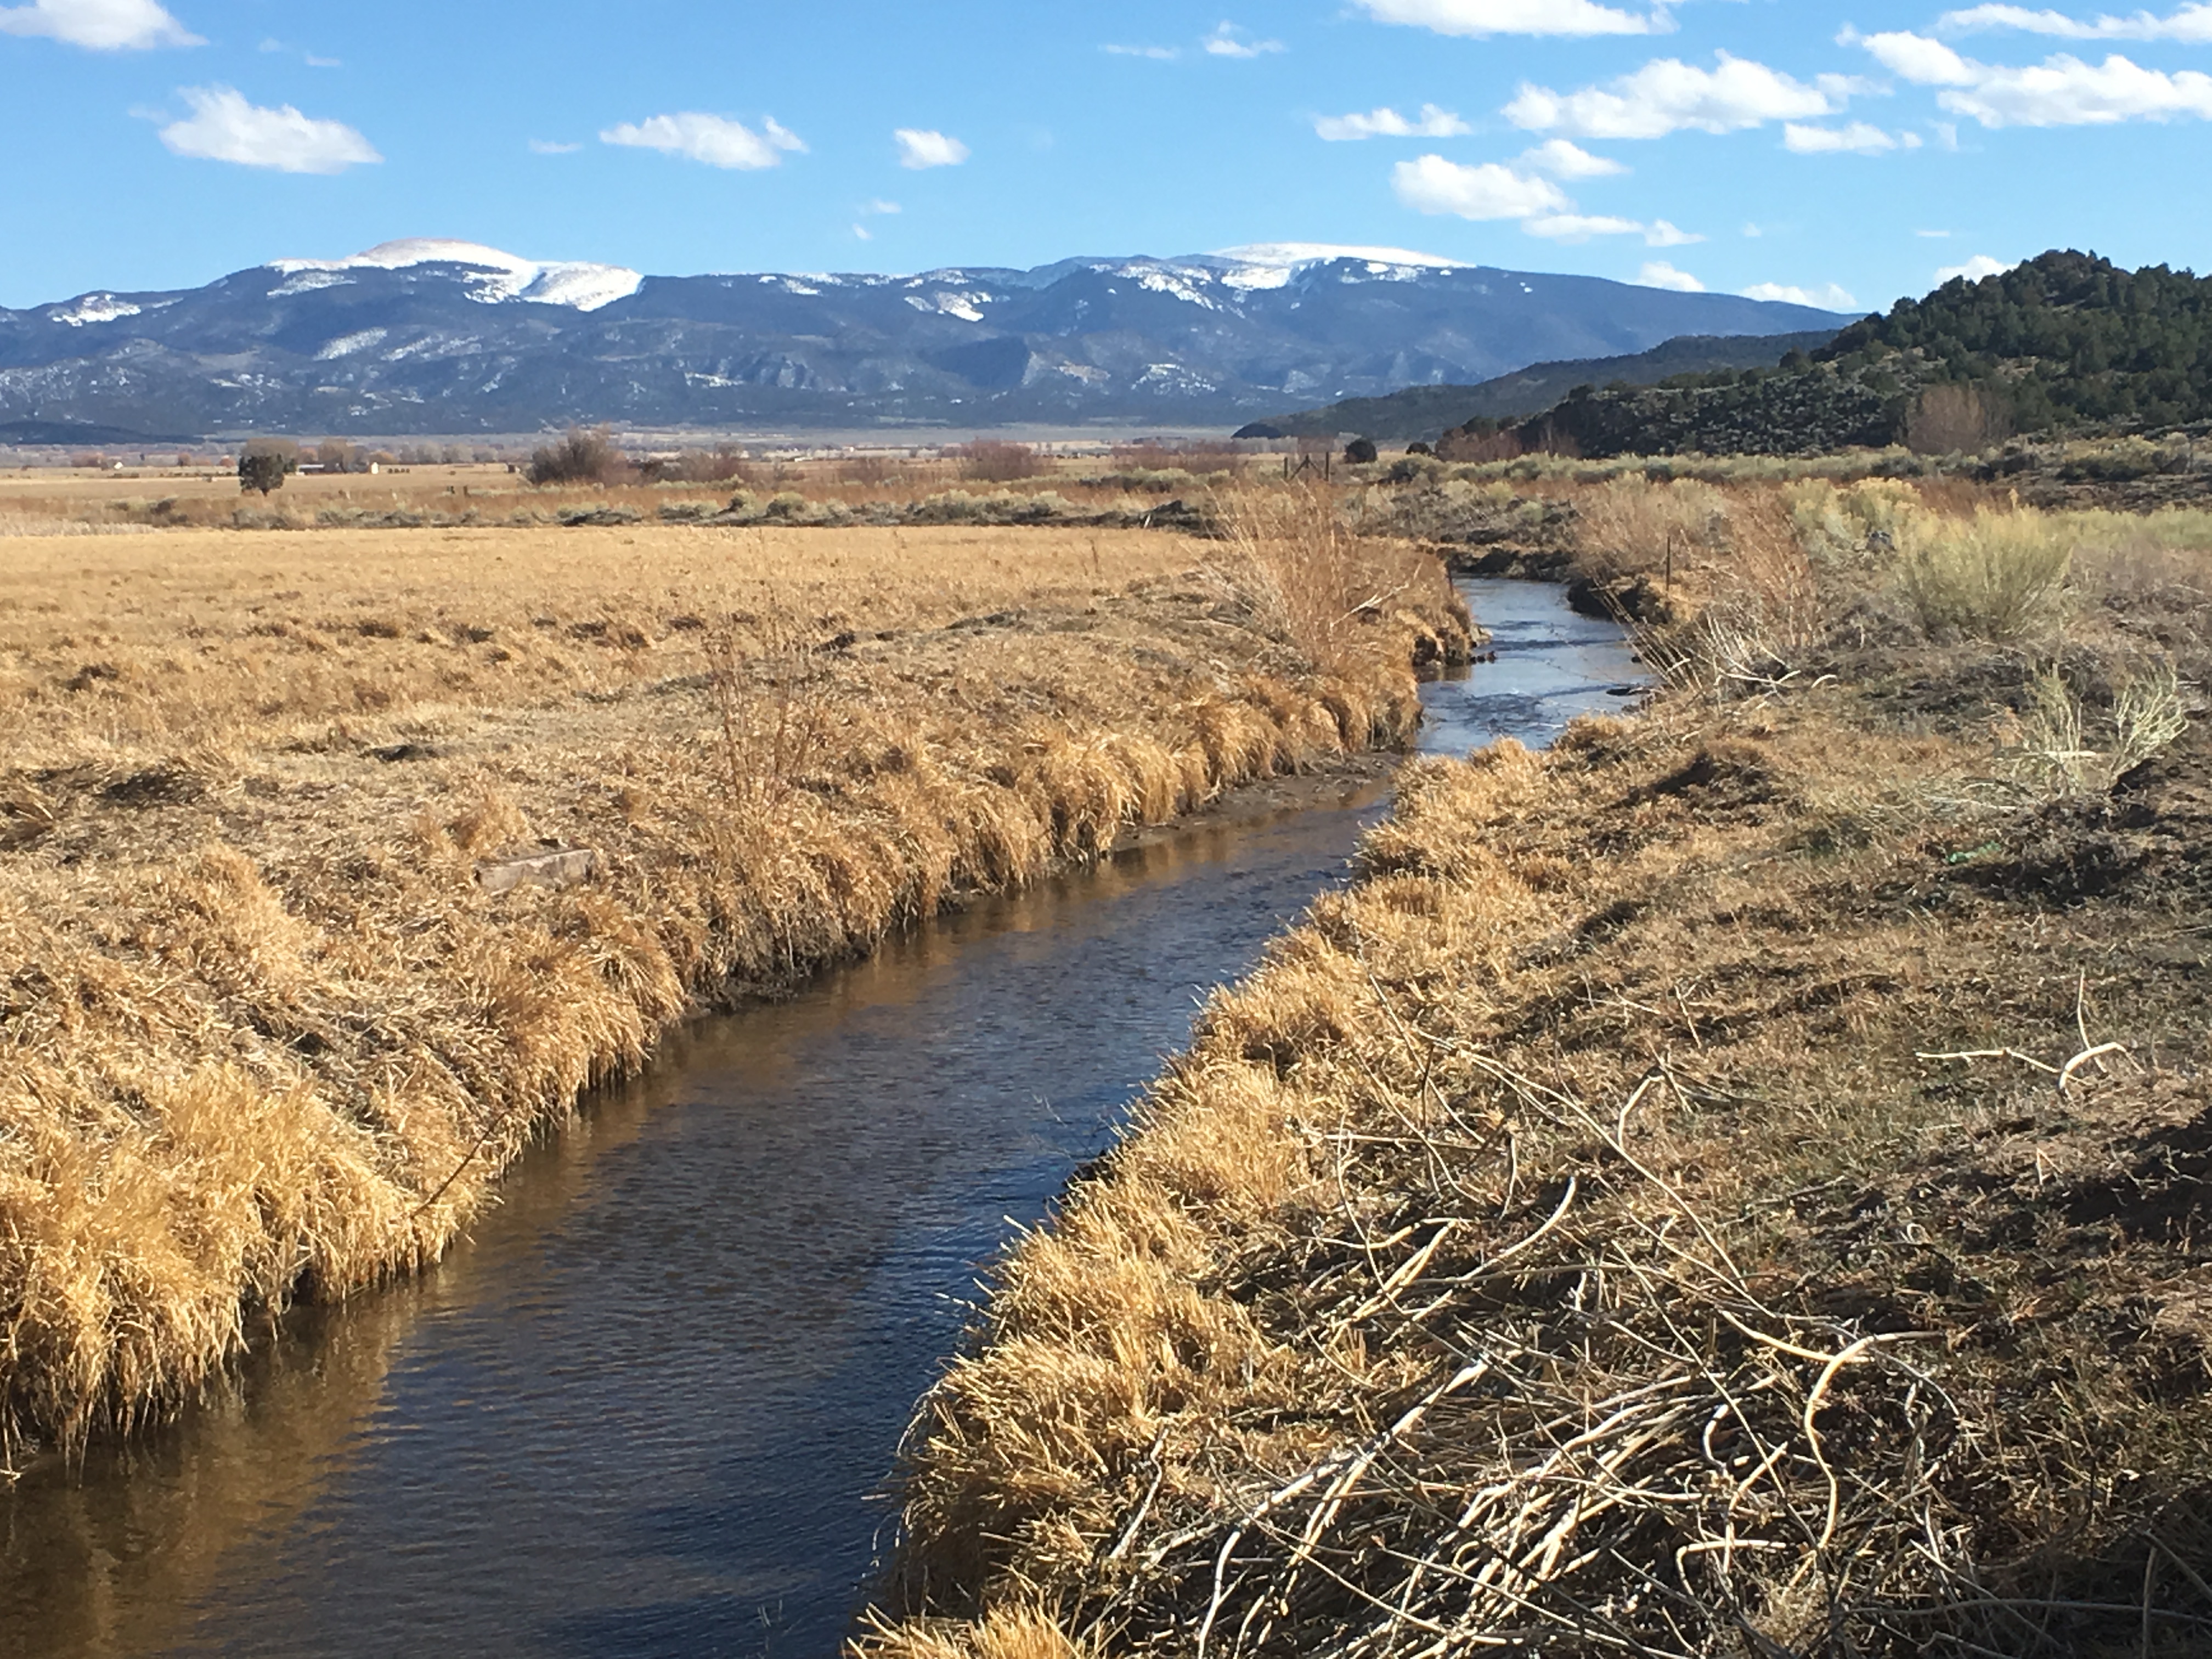
San Luis People’s Ditch March 17, 2018. Photo credit: Greg Hobbs
Click the link to read the article on the Deseret News website (Amy Joi O’Donoghue). Here’s an excerpt:
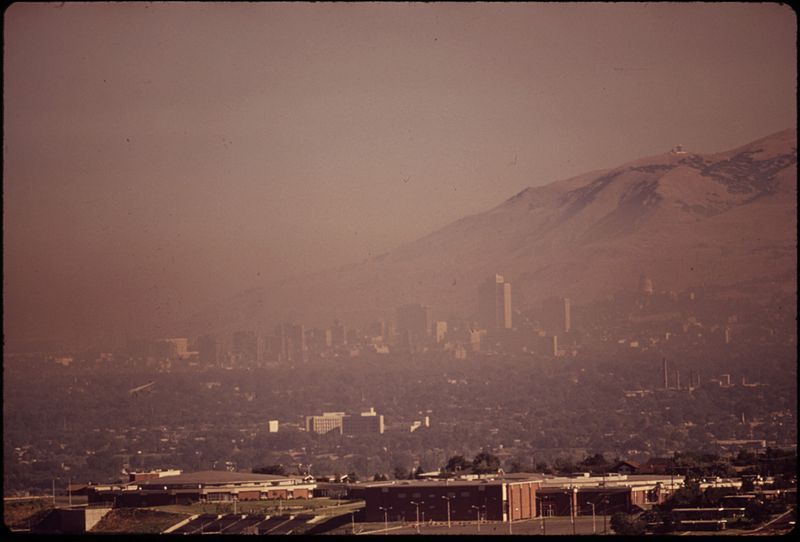
Owens Lake is surrounded by those monitors that measure PM10 pollution, but in Utah there has not been that much regulatory focus on examining dust levels whipped up from the 800 square miles of exposed lakebed of the Great Salt Lake. There have, however, been academic studies that point to the Great Salt Lake as a significant contributor of dust — as much as 30% — to the northern Wasatch Front. But a state regulatory authority like the Utah Division of Air Quality can’t manage what is not being actively measured. House Speaker Brad Wilson, R-Kaysville, does not think the Great Salt Lake is at the point where it needs its own monitoring system or a regulatory authority — yet — but it could be coming if lake levels keep dropping.
Smog blankets Salt Lake City. Photo credit Wikimedia Commons.
Greg Carling, an associate professor in Brigham Young University’s Department of Geological Sciences, asserts more could be done via the Division of Air Quality or refined academic research when it comes to dust off the Great Salt Lake.
“We need monitors east and north of the lake because that is where the dust is going to come from these southerly winds,” he said. “I think that would be the prudent thing to do.”
The issue is whether the state wants to open the door to more regulatory oversight on pollution problems that are already a headache in other areas, like PM2.5, or fine particulate matter. What would it look like to invite extra controls?
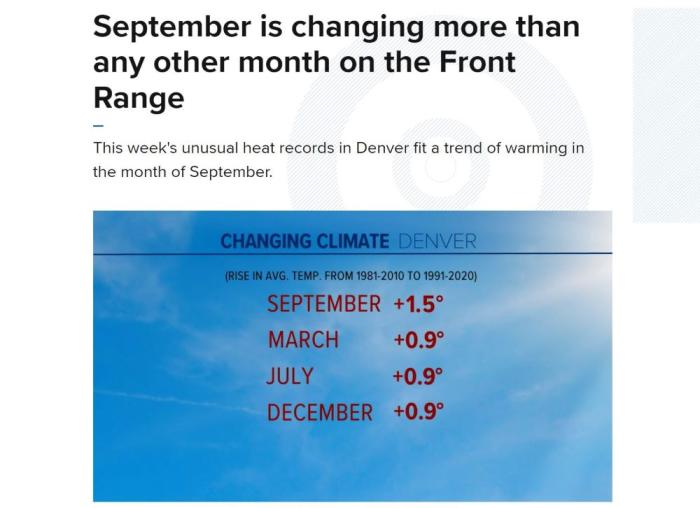
Weather forecasters consider September the start of “meteorological fall.” And even without the fancy term, most of us think of the month as the unofficial kickoff to autumn.
School starts, football season is underway, and temperatures begin a welcome cool down.
Well, about that last part: September is not as cool as it used to be.
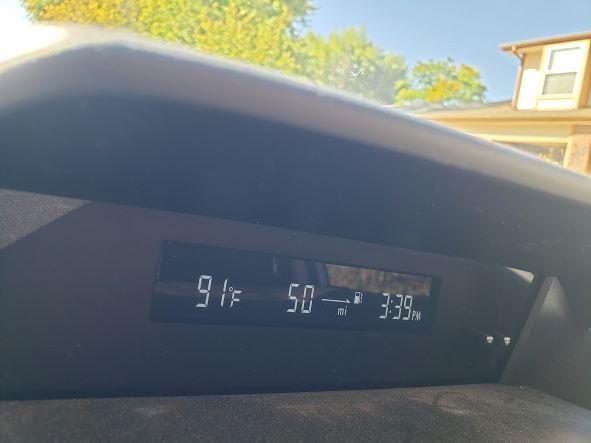
A car thermometer registers another hot September day. Photo credit: Denver Water.
And that means customers are watering their yards later into the year, creating more demand for water and making things trickier for Denver Water’s water supply managers.
Just recall the way September started this year, with a string of days in the mid-to-upper 90s, including back-to-back 99-degree days in the Denver area. (Denver Water’s downtown weather station hit 100.)
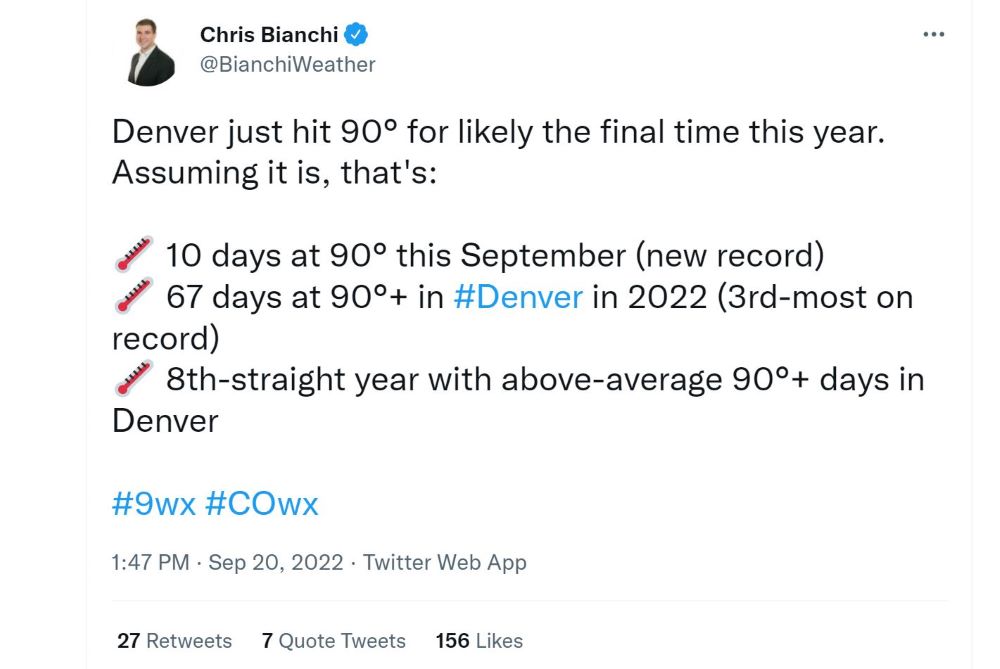
In fact, as 9News meteorologist Chris Bianchi reported on Twitter, Denver broke a record for number of 90-degree days (10) in a single September this year.
A wave of heat-related records were broken across the West this year, including here in the Denver metro area. Image credit: Chris Bianchi via Twitter.
The phenomenon was also well-documented by 9News meteorologist Cory Reppenhagen in his Sept. 5 report on how unusual heat records in Denver notched during September’s first week are part of the metro area’s rising September heat trend.
All told, toasty Septembers appear to be one more element of a changing and warming climate.
A screenshot from a Sept. 5, 2022, report by 9News meteorologist Cory Reppenhagen about September’s changing weather patterns in the Denver metro area. Image credit: 9News meteorologist Cory Reppenhagen.
“We have a pretty good idea of what water demand in the summer months will look like, but September is becoming a wild card,” said Nathan Elder, the utility’s water supply manager.
“We have seen higher demand and increased reservoir releases in recent Septembers,” he added. “But we also know we can see snow during the month, which makes planning for the month and setting up winter operations difficult.”
Additionally, Elder said, warmer fall temperatures can dry soil in the collection system, which means more snow is needed the following winter to fill reservoirs.
“This is a trend we are really keeping our eye on because it can have significant impacts on water supply late in the season and going into the next spring,” Elder said.
One other challenge tied to warmer Septembers: a longer fire season, such as in 2020, when the state’s two largest-ever fires exploded late in the year, including the East Troublesome Fire that roared through Grand Lake in mid-October.
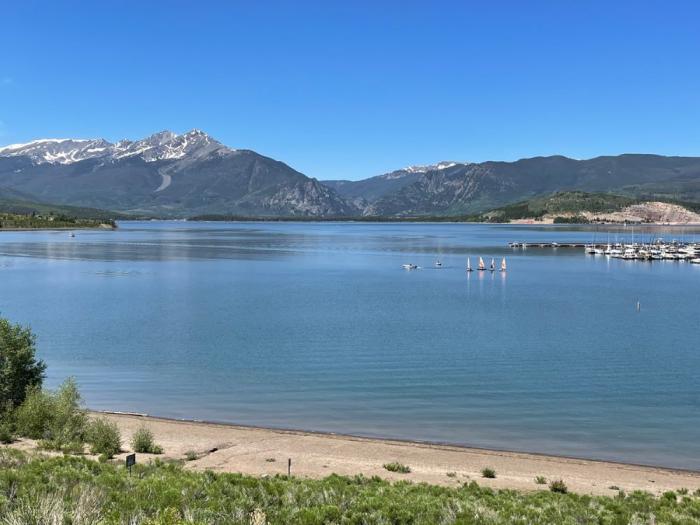
Dillon Reservoir is Denver Water’s largest reservoir. It sends water to the Front Range via the 23-mile-long Roberts Tunnel under the Continental Divide. Photo credit: Denver Water.
Some numbers that tell the story:
– Denver Water is seeing more demand for water in September. Last year, demand was about 30 million gallons per day above the 30-year average. In 2022, the volume was 15 million gallons over the same average. The difference between the two years can be attributed to the fact that precipitation in 2022 was closer to normal and 2021 was drier.
– September 2022 was Denver’s third-warmest on record, at an average of 69 degrees, surpassed only by 2015 and 2019, according to National Weather Service data highlighted by Bianchi, the 9News meteorologist.
– Flows in the Roberts Tunnel, which delivers water from Dillon Reservoir to the Front Range, are rising in September, with 260 cubic feet per second seen in recent years versus the long-term average of 160 cfs. That’s a sign Denver Water needs to send more water to the metro area to meet the higher September demand.
That doesn’t mean, however, that Denver Water is pulling more water from its West Slope reservoirs. In fact, overall water movement through the Roberts Tunnel over the course of a year is flat, as lower winter demand and tunnel shutoffs have helped balance out that September bump.
Warmer-than-normal temperatures during the day and at night raise the overall average temperature of the month. Image credit: Chris Bianchi via Twitter.
Overall, September reservoir releases across the system have been higher than average in recent years, a sign that Denver Water must rely more on storage to meet higher late-summer demand.
Cheesman Reservoir on the South Platte River system serves as one example, with average September releases during the last five years of 286 cfs versus the longer-term average of 211 cfs.
Denver Water’s records show September is warming at a higher rate than any other month during the watering season. And Reppenhagen’s reporting found that “September (weather) is changing the most out of all the months, warming by 1.5 degrees compared to the previous 30-year period of record.”
As Reppenhagen points out, warmer Septembers are extending the summer growing season, a development that he notes was predicted by some of the earliest computer modeling examining the effect of rising carbon dioxide in the atmosphere.
Denver Water customers are using more water later in the year as Septembers warm. Photo credit: Denver Water.
That is borne out by water use.
Outdoor demand in September has grown about 23% when comparing the recent-five year stretch of 2017-2021 to the period between 2000 and 2016. In the same five-year span, September use has only been 3% below June levels.
From a practical standpoint, warmer Septembers make work tougher for Denver Water’s planners.
When that extra pull on reservoirs in September is combined with lower soil moisture, it means the utility has to lean even harder on the winter months to provide enough snowpack to fill reservoirs the following spring.
The shift also means planners are relying less on historical water demand models and focusing far more on data from more recent years to get a better idea of how much water Denver Water customers will need in September.
Overall, Denver Water customers have been good at conserving. Demand is generally flat or even declining during most months of the year. September is an outlier: as noted above, the five-year average for the month is actually on the rise.
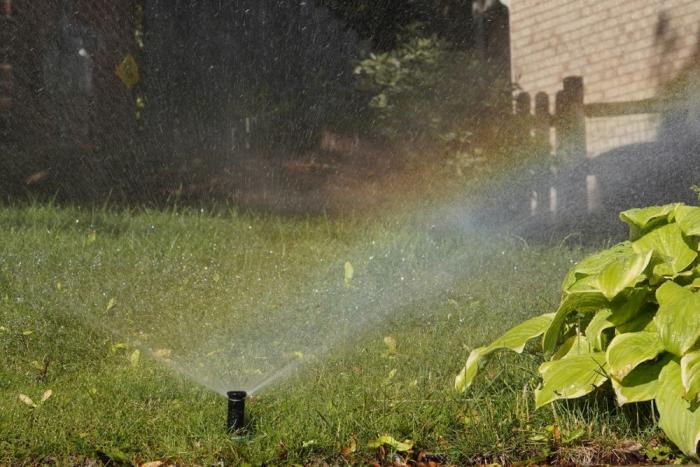
Adjusting your sprinkler control system to account for weather and the time of year can save water. Cooler nights send a signal to your landscape that it’s time to wrap things up for the winter and it doesn’t need as much water. Photo credit: Denver Water.
But a reminder to customers: Even with a warmer September, the need for outdoor watering declines because nighttime is cooler, and grass can get by with less water.
As Denver Water takes many steps to adapt to a warming climate, it will incorporate these late-summer temperature increases into its many-faceted approach to ensure it can supply the Denver region with water.
In the shorter term, Elder has a more visceral suggestion: “September should be kicked out of fall,” he said. “Move it permanently to summer.”
The Colorado Water Conservation Board awarded a $500,000 grant to the Upper Arkansas Water Conservancy District and Round Mountain Water and Sanitation District for construction of a new reservoir near Westcliffe.
Upper Ark Project Manager Gracy Goodwin reported the grant award during the Thursday meeting of the Upper Ark board of directors in Salida.
Upper Ark General Manager Terry Scanga said the total cost of the project is estimated at $3 million and that the Upper Ark District is responsible for a third of the cost under its agreement with Round Mountain.
Round Mountain provides water water and sanitation services to the towns of Westcliffe and Silver Cliff, serving a population of approximately 1,000.
As previously reported, the Upper Ark District and Round Mountain began collaborating on the project to address the need for a source of augmentation water on Grape Creek upstream from DeWeese Reservoir. The 7-acre reservoir will have a storage capacity of approximately 150 acre-feet.
Goodwin reported that Engineering Analytics, the firm hired to design the reservoir, recently completed a topographic survey for the intake infrastructure and the dam. The company is also finalizing the reservoir design and starting work on the construction drawings.
The Colorado Water Conservation Board also provided funding for an initial feasibility study and the design work, and Goodwin said Upper Ark staff are investigating additional sources of funding to help pay for construction costs.
In addition to its augmentation water needs, Round Mountain faces significant wastewater treatment challenges.
Citing an “overtaxed wastewater treatment plant” that “cannot adequately process additional effluent,” the Round Mountain board of directors enacted a moratorium on the sale of water and sewer taps Jan. 1., effectively halting new construction in Westcliffe and Silver Cliff.
Information on the Round Mountain website indicates the district’s wastewater treatment plant “is 46 years old, built with a technology that cannot meet current environmental standards and receiving considerably more sewage than it can fully process.”
The proposed Round Mountain Reservoir would provide a much-needed source of augmentation water in Custer County.
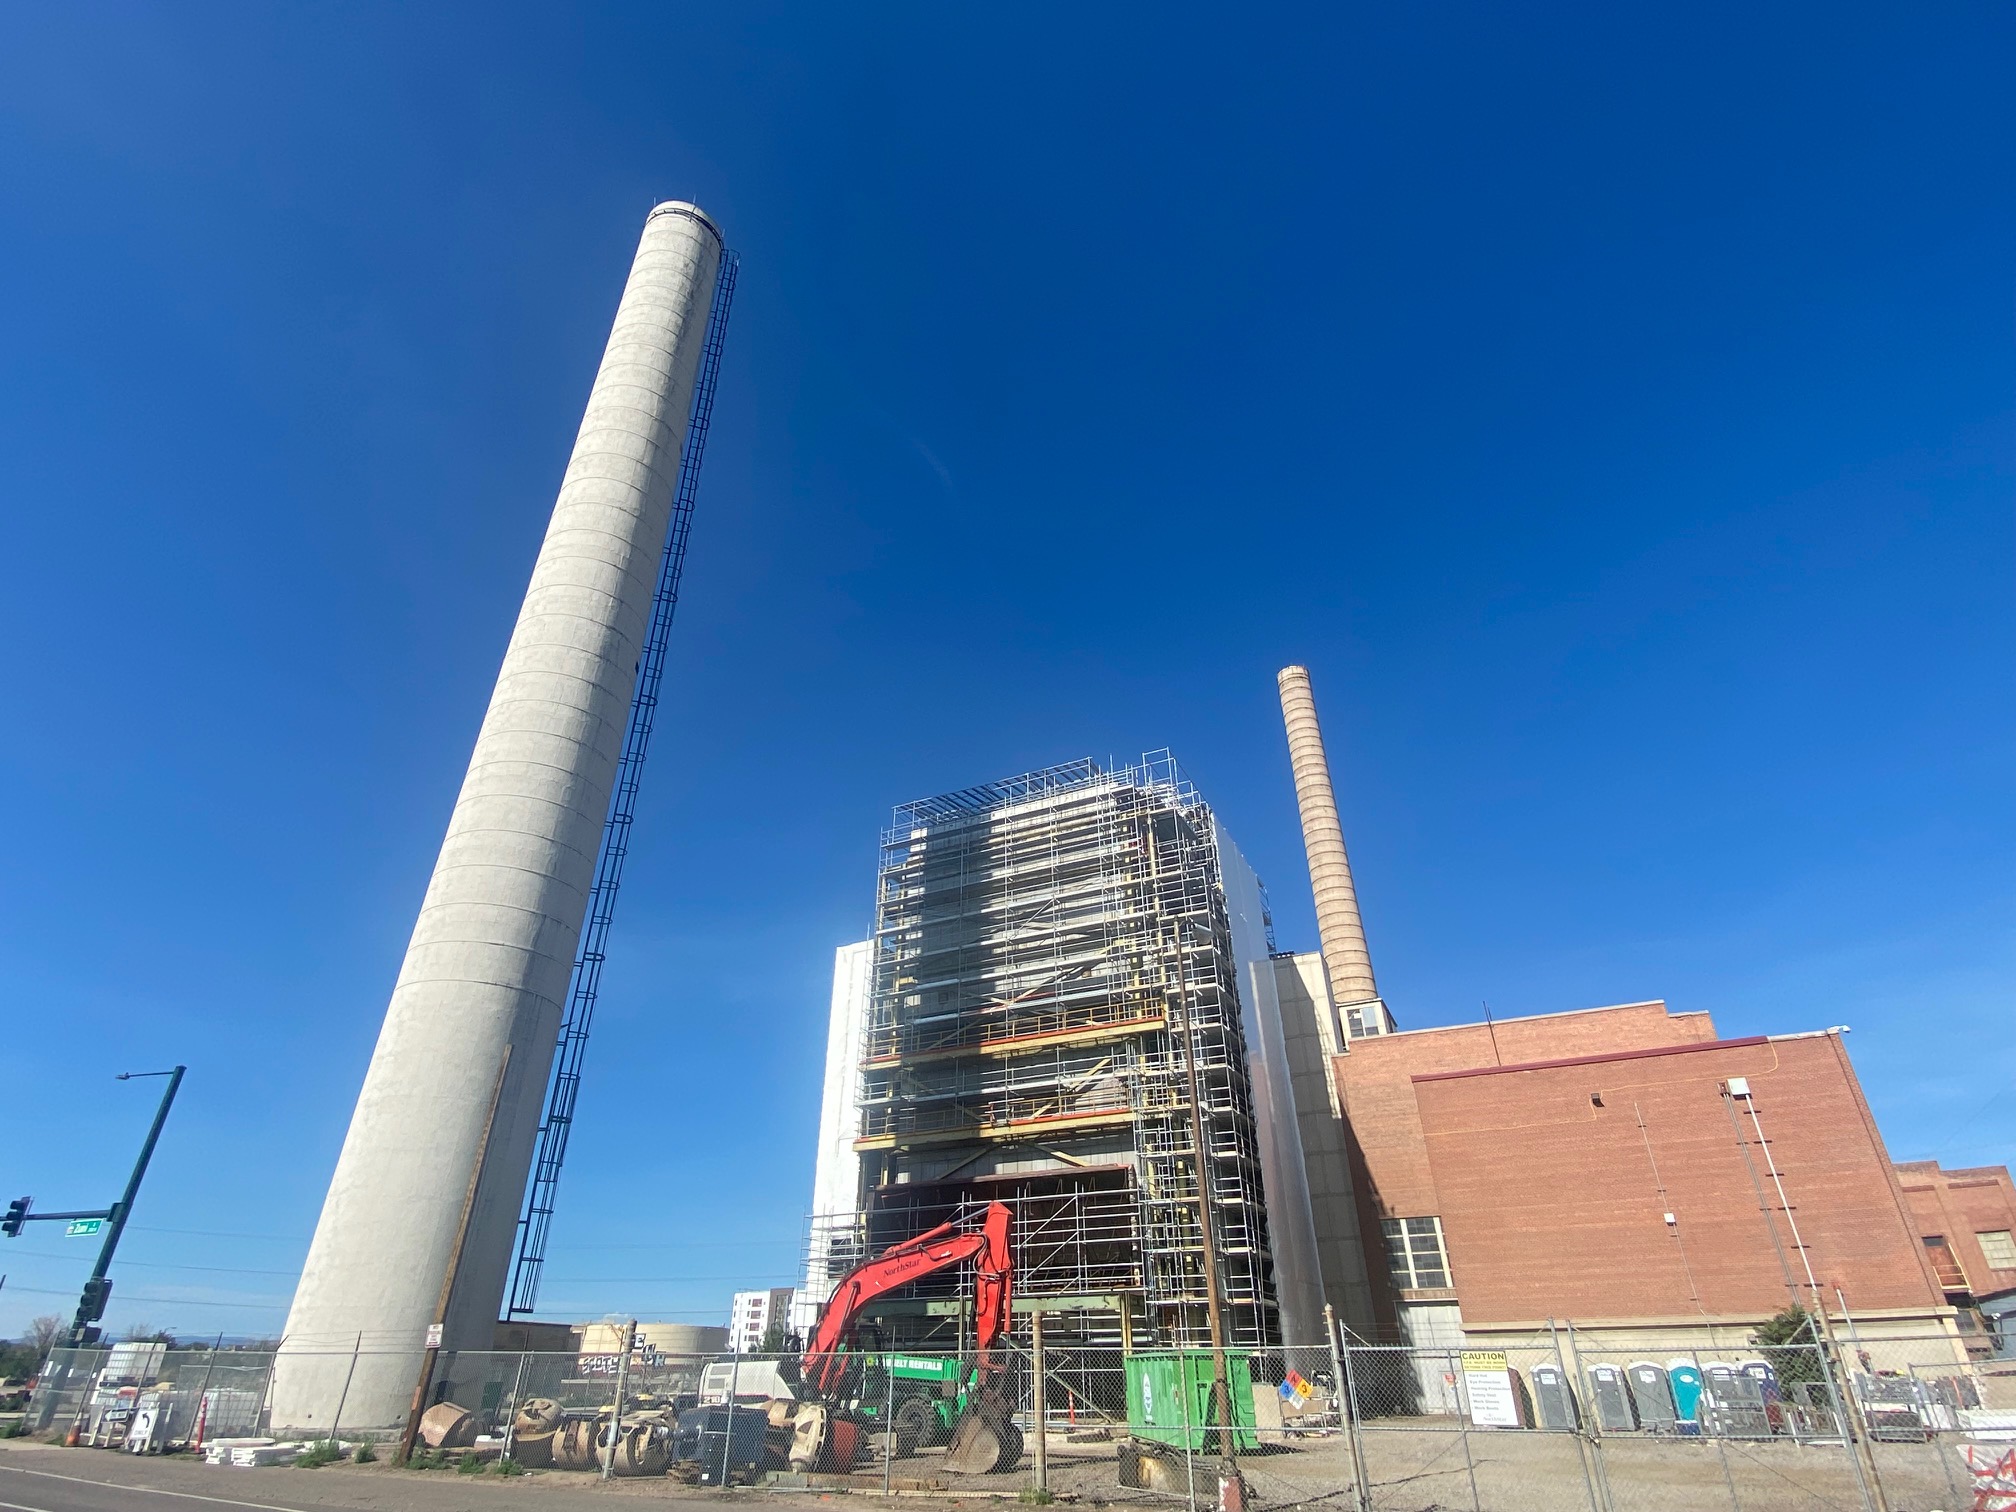
A view of Xcel Energy’s retired fossil fuel-fired Zuni Generating Station at Zuni Street and West 13th Avenue in Denver on Aug. 6, 2022. (Quentin Young/Colorado Newsline)
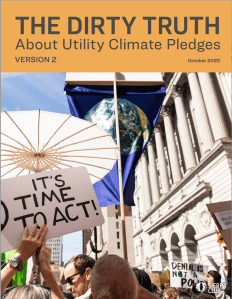
A report released last week by the Sierra Club faults dozens of utilities that provide a major chunk of U.S. electric generation for failing to speed up their decarbonization efforts.
“For the sake of our communities and planet, we must do everything in our power to create a clean, renewable electric grid by 2030,” the Sierra’s Club’s “Dirty Truth” report says. “Utilities must lead this transition, but our research shows they are wholly unprepared to do their part. Clean energy is reliable and affordable; electric utilities have no excuse to delay and no time left to waste.”
The report is an update of a 2021 study the group did. The Sierra Club analyzed plans of 77 utilities that collectively supply about 40% of U.S. electric generation and gave out letter grades based on how well utilities, many with their own clean energy goals, were working to decarbonize.
“Most are still not on the path to achieve 80% clean electricity by 2030. Of the 77 utilities we studied, nearly half of them (44%) made no progress or received a lower score than in our previous report,” the Sierra Club said. “This disappointing inaction occurred despite a tumultuous 18 months of grid reliability crises, blackouts, energy price spikes and extreme weather events; many of these trace their roots in large part to utilities’ stubborn reliance on expensive and unreliable fossil fuels.”
To determine the grades, the Sierra Club looked at the latest versions of the utilities’ integrated resource plans, documents that lay out how they will meet future electric demand, evaluating how quickly they intend to retire coal plants and penalizing them for plans that include building new gas generation.
“If a company includes multiple scenarios in their IRP, we use the scenario they denote as their preferred scenario,” said Cara Bottorff, a Sierra Club managing senior analyst. “If they do not denote a preferred scenario, we use the scenario that is the worst case for gas (i.e., the one that would add the most gas) to demonstrate the largest amount of gas that the company is considering building.”
Xcel Energy, Colorado’s largest energy provider, received a B grade in the report. It performed comparatively well next to the other utilities analyzed in the report, and it achieved one of the most dramatic improvements from the 2021 version of the report, when it received a D score. The report notes that it plans to replace 60% of existing coal and natural gas energy generation with clean energy by 2030.
Xcel plans to retire all its coal units by the end of 2030 in Colorado and Upper Midwest states, and its goal is to provide “net-zero” energy by 2050, noted Xcel spokesperson Michelle Aguayo.
“We were the first major U.S. energy provider in December 2018 to set ambitious and progressive voluntary goals for delivering 100% carbon-free electricity by 2050 and reducing carbon emissions 80% by 2030” from 2005 levels, Aguayo wrote to Newsline in an email.
The report also analyzed Westminster-based power wholesaler Tri-State Generation and Transmission Association, which also received a B grade. Tri-State plans to replace 70% of existing fossil fuel energy generation with clean energy by 2030, according to the report.
“Our cooperative’s high grade from Sierra Club recognizes Tri-State’s increasing renewable energy resources and decreasing emissions, and our robust planning to continue progress,” Tri-State CEO Duane Highley said in a statement to Newsline.
Tri-State in 2020 announced the retirement of all its coal generation in Colorado and New Mexico by 2030.
Xcel truck at Shoshone plant. Photo credit: Brent Gardner-Smith/Aspen Journalism
Overall, 56% of the utilities examined in the report improved their scores, 9% made no progress and 35% got worse grades. You can check how your local utility did here.
The Edison Electric Institute, an association that represents investor-owned utilities, called the metrics “arbitrary” and dismissed the report as a “messaging document.”
“The reality is that existing nuclear generation and the flexibility provided by natural gas generation are what enabled the U.S. electric power industry to deploy 27 gigawatts of new renewables, reliably and cost-effectively, last year,” said Brian Reil, an EEI spokesman.
“The emissions reductions goals set by America’s investor-owned electric companies are firmly grounded in our current understanding of technology and economics, and they also reflect our responsibility to prioritize customer affordability and reliability.”
Reil noted that more than 40% of U.S. electricity is now generated by carbon-free resources and said electric utilities are investing in new technologies to deliver more.
“If the Sierra Club truly wants to accelerate the deployment of clean energy, they should consider joining the other environmental, industry and government leaders who are working together constructively to identify ways to overcome the barriers to building the transmission and other clean energy infrastructure we clearly need in order to deliver more resilient clean energy to customers,” he said.
At the Experience POWER conference for energy industry professionals last week in Denver, the pace of the renewable energy transition was a major theme. Highley — the CEO of Tri-State, a not-for-profit cooperative supplier which operates in New Mexico, Colorado, Wyoming and Nebraska and includes 42 electric distribution cooperatives and public power districts that provide power to more than a million consumers — used an old George Carlin comedy bit about driving to illustrate the competing tensions on utilities and electric co-ops trying to decarbonize without risking reliability.
Anybody driving slower than you is an idiot, Carlin said, while anybody going faster is a maniac.
“We’re being pulled between those people who think we are going too fast and those who think we are going too slow,” he said, noting that two states his co-op operates in, New Mexico and Colorado, are much more green-energy oriented than the other two: Nebraska and Wyoming.
“There’s no map for this,” he said. “We’re in uncharted territory.”
He said the ability to generate electricity from fuel oil helped bail out Tri-State during the 2021 winter storm that caused the grid to collapse in Texas, resulting in an estimated 246 deaths. That makes it hard for utilities to ditch the reliability benefits of certain kinds of fossil fuel generation as quickly as some would like.
“We can make this happen and it is happening,” Highley said. He added that Tri-State, which got a B grade on the Sierra Club report, is on pace to have 50% of the electricity used by its members come from renewable sources by 2024 thanks to bountiful wind and solar resources, with an eventual goal of getting to 80% decarbonization, though that will still require some fossil fuel generation to stay in the mix.
“We’re going to clean up the grid and then we’re going to electrify everything,” he said.
Quentin Young contributed to this report. Robert Zullo can be reached at rzullo@statesnewsroom.com
A paper published Tuesday in the journal Geophysical Research Lettersfinds that it’s raining harder in most of the United States. The study, written by researchers at Northwestern University, tied the results to climate change and to warmer air’s ability to hold more water. The findings echo the fundamental laws of physics and thermodynamics, as well as the evidence from decades of research, and highlight the real-time effect that humans are having on the weather and climate. The research offers confirmation of what atmospheric scientists have been warning of for years: a warmer world is, on balance, a wetter world. And as global temperatures continue to rise, an uptick in precipitation extremes is expected. What the study finds is consistent with a basic tenet of atmospheric physics: For every degree Fahrenheit that air temperature rises, the atmosphere can hold 4 percent more water; this is known as the Clausius-Clapeyron relationship. Where storm clouds develop and the atmosphere is sufficiently moist, it means a warmer climate will support more intense rainfall.
Click the link to read “It’s raining harder in the U.S.: New study finds rainfall is becoming more intense across most of the United States” on the Northwestern University website (Amanda Morris):
Just like the old adage says: When it rains, it pours.
That turns out to be increasingly true for much of the United States, according to Northwestern University researchers.
In a new study, researchers compared observed rainfall from two climatologically distinct time periods and across 17 different climate regions in the U.S. They found that when it’s rained in recent decades, it’s rained more. In most regions, the intensity of the rainfall has shifted from lighter to more moderate and often heavy deluges.
When it rained east of the Rocky Mountains in recent decades, about 5% more precipitation fell. When it rained over the Pacific Coast or Rocky Mountains, however, no intensity changes were observed. Climate model simulations have previously predicted increases in precipitation intensity, particularly during extreme events, but the Northwestern study examined historically observed precipitation data across all intensities — and found a systematic shift in precipitation intensity in many parts of the country.
“When people study how climate change has affected weather, they often look at extreme weather events like floods, heatwaves and droughts,” said Northwestern’s Daniel Horton, the study’s senior author. “For this particular study, we wanted to look at the non-extreme events, which are, by definition, much more common. What we found is pretty simple: When it rains now, it rains more.”
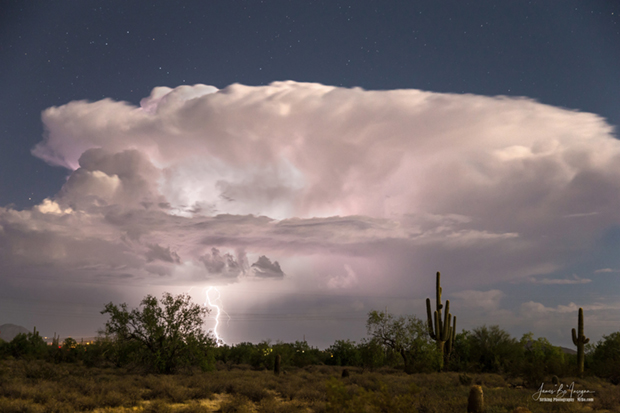
Arizona monsoon cloud with lightning striking the beautiful Sonoran desert in North Scottsdale. Photo by James Bo Insogna. Title: Arizona Monsoon Thunderstorm. Taken on August 15, 2016. Used under a Creative Commons license.
Changing intensities of daily rainfall
To conduct the study, Harp and Horton compared two climatologically distinct time periods: 1951-1980 and 1991-2020. For each time period, they used historical precipitation data from the Global Historical Climatology Network, a publicly available database maintained by the National Oceanic and Atmospheric Administration.
Then, the researchers analyzed the observations within 17 distinct climate regions in the United States. These regions reflect differences in temperature, precipitation, vegetation and ecosystem dynamics.
After analyzing data from two time periods across regions, Harp and Horton discovered that precipitation intensity (including rain and snow) had increased across much of the United States, particularly in the East, South and Midwest. Changes in the western United States were not detected.
“Not only do we see increasing precipitation intensity for regions east of the Rockies,” Harp said, “but the intensities are becoming more variable as well, making water resource management even more challenging.”
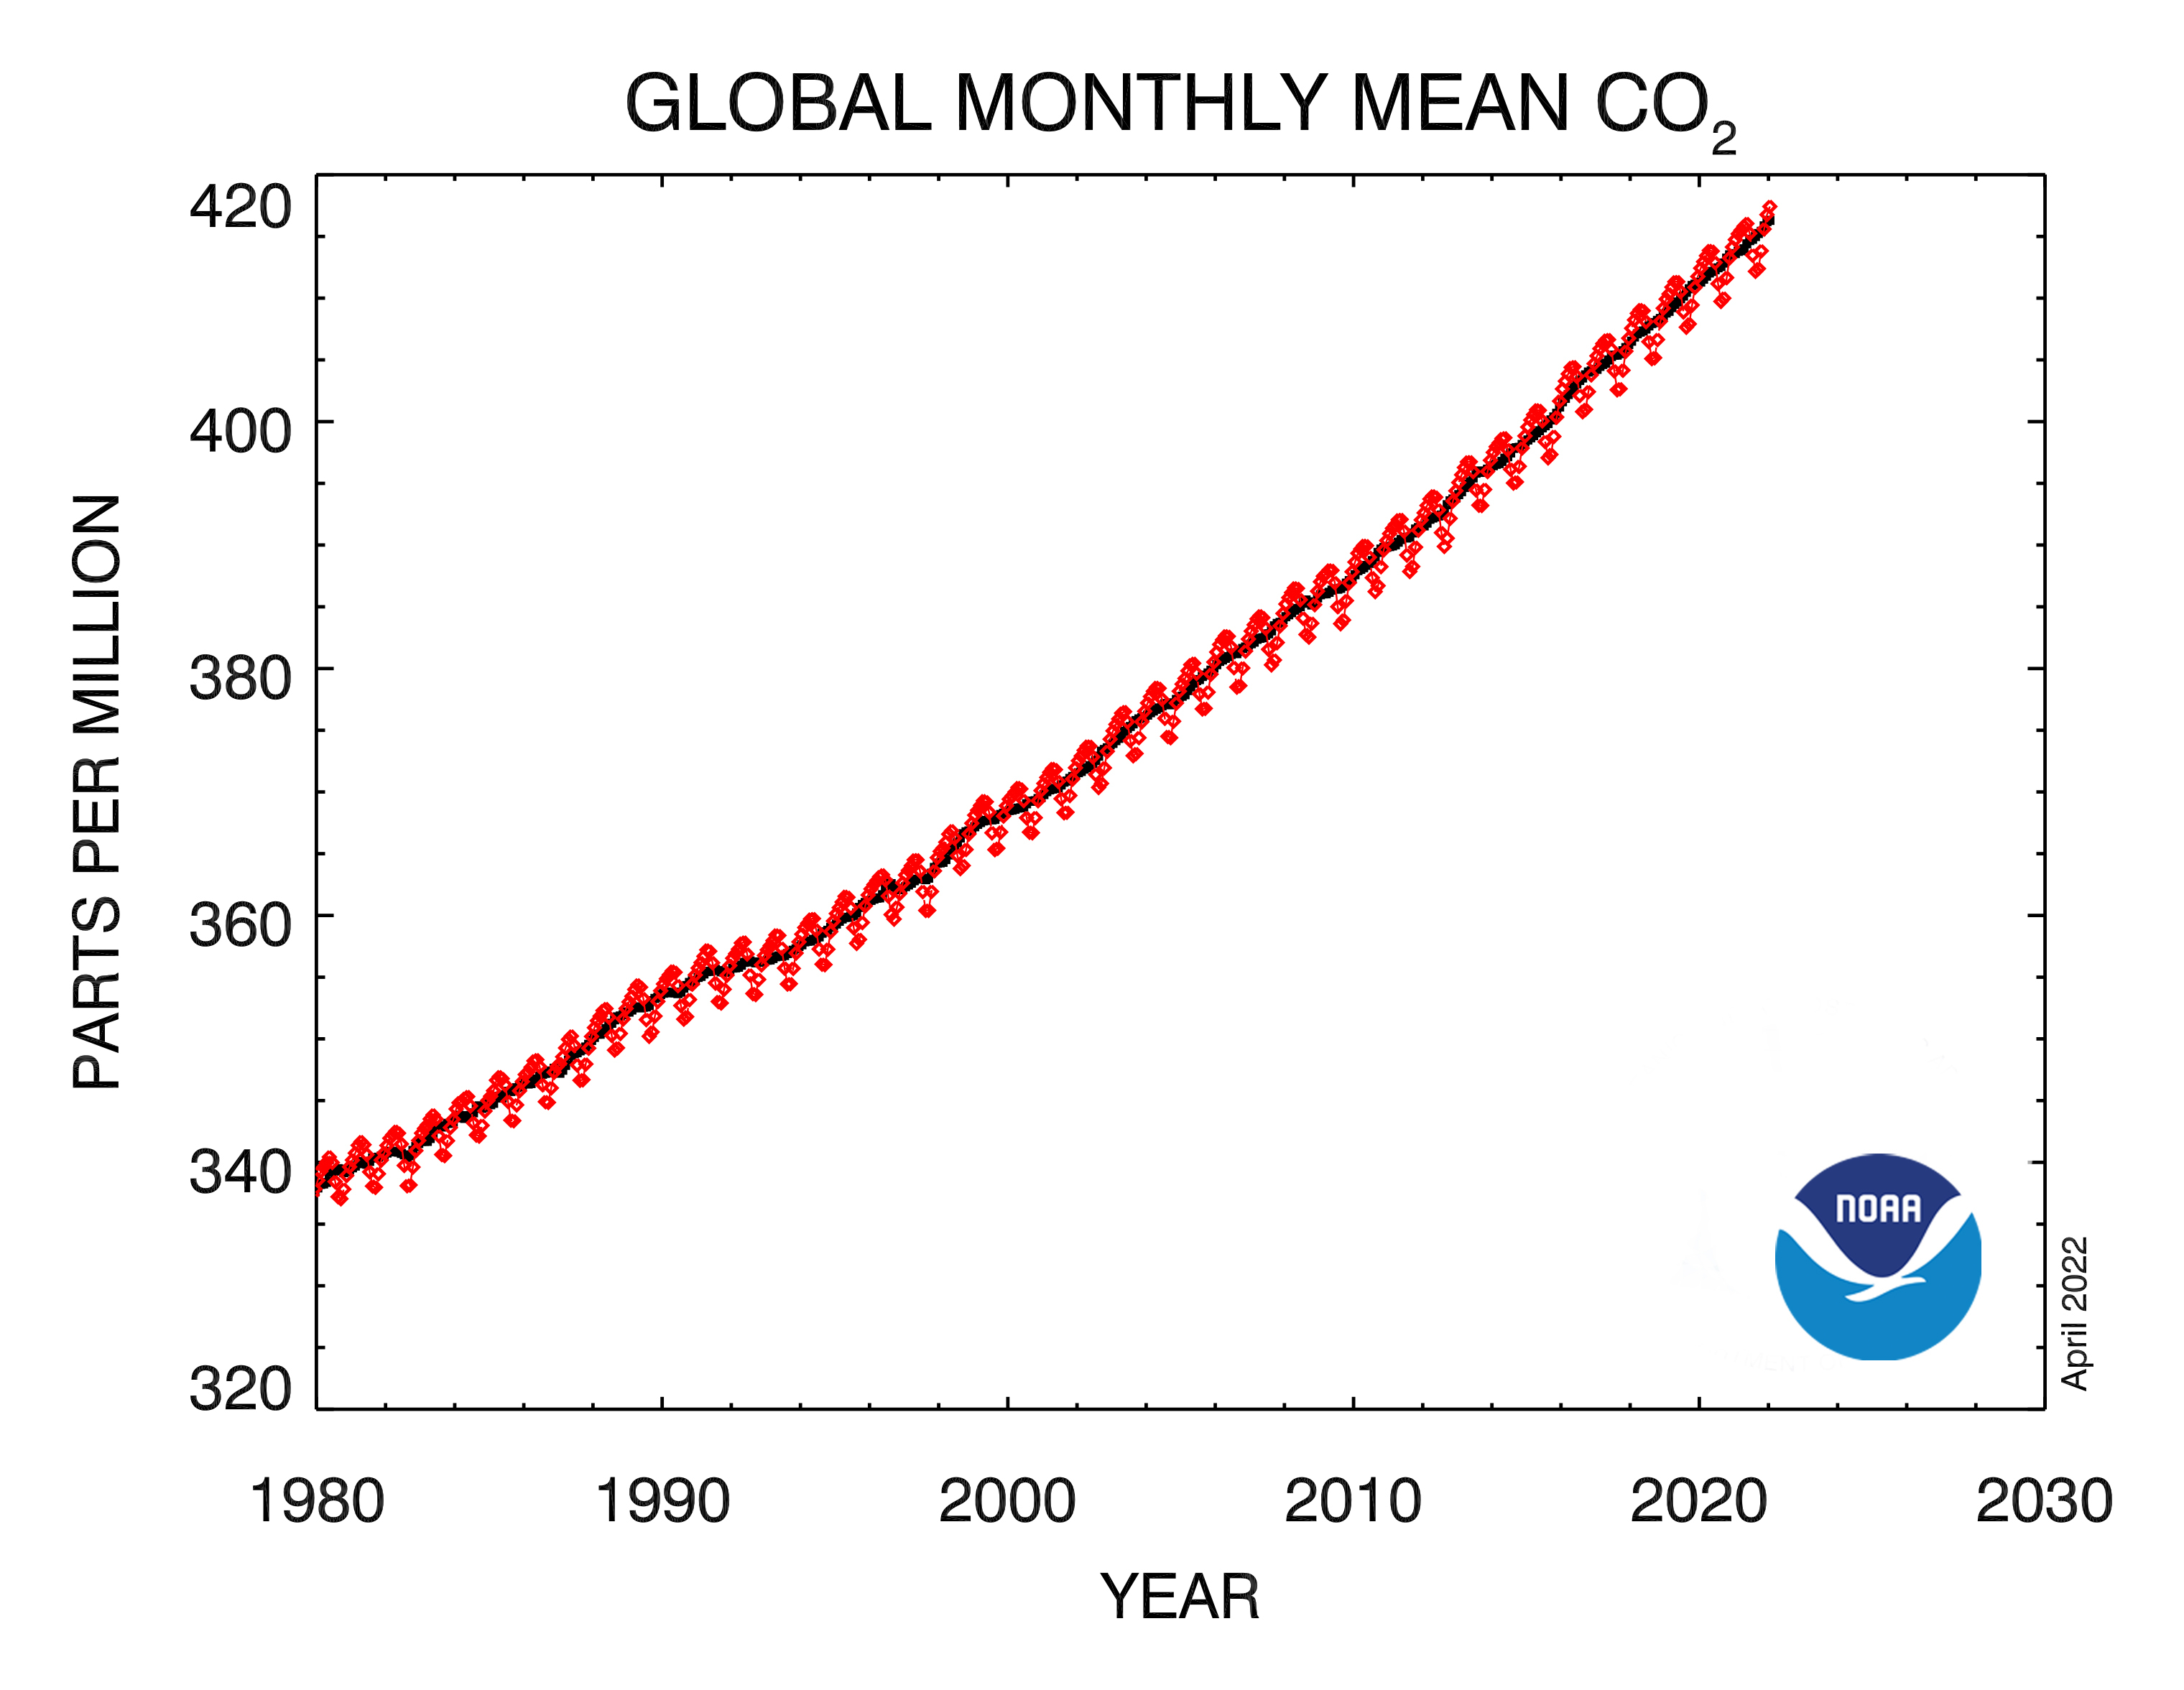
CO2 trend: This graph shows the monthly mean abundance of carbon dioxide globally averaged over marine surface sites since 1980. (NOAA Global Monitoring Laboratory)
Consequences of climate change
In this study, Harp and Horton narrowed their focus to examine how much precipitation falls during each rain or snowfall event. For their next study, they plan to investigate if annual precipitation is becoming more variable and if precipitation events are becoming more or less frequent. Although this study does not attribute the changes in precipitation rates to climate change, Harp said the findings are consistent with human-caused global warming and climate model predictions.
“Warmer air holds more moisture,” he explained. “For every one degree Celsius the atmosphere warms, it holds 7% more water vapor. So these observations are consistent with the predicted effects of human-caused global warming.”
Increased precipitation intensities affect many sectors, including agriculture and infrastructure, as well as lead to increased risks of landslides and flooding. Horton hopes the study findings can be used by resource managers, policy makers and urban planners to design infrastructure that is more resilient to changing weather patterns.
Flooded corn crop September 2013.
“You don’t need an extreme weather event to produce flooding,” Horton said. “Sometimes you just need an intense rainstorm. And, if every time it rains, it rains a little bit more, then the risk of flooding goes up.”
The paper, “Observed changes in daily precipitation intensity in the United States,” was supported by the Ubben Program for Carbon and Climate Science at Northwestern University.